1. Introduction
Solid fuel boilers are still a frequent source of heat within households and are also a significant source of air pollution. The emitted pollutants have a negative impact on the environment and human health [
1]. The combustion of solid fuels in small combustion devices produces emissions in the form of gaseous substances and combustion particles. Combustion particles bind various pollutants (e.g., benzo(a)pyrene, heavy metals, and volatile organic compounds (VOCs)). Particles with an aerodynamic diameter of less than 10 μm (PM10) penetrate the upper and lower respiratory tract. PM2.5 particles enter the bronchi and lung chambers, and PM1 particles penetrate the bloodstream [
2,
3]. The size of the particles produced is essential information for assessing their human health effects [
4]. Exposure to PM10 particles generally damages the respiratory and cardiovascular systems, reduces life expectancy, increases the risk of infant mortality, and can cause lung cancer [
3].
In an effort to reduce the concentration of emitted harmful substances, emission limits are set for manufactured boilers [
5], which are verified when the combustion source is put on the market. However, there is no further verification of compliance with these emission limits in long-term operation. The number of pollutants produced by combustion sources is mainly influenced by the design of the boiler, the way the boiler is operated, and the type of fuel burned. Only boilers complying with an eco-design can now be put into operation [
6], and the main attention in recent years has been paid to reducing the emissions of fine combustion particles. The amount of emitted particulate matter is most often reported as a mass or volume concentration of particulate matter.
For specific conversions between the volume and mass of particles, knowledge of their particle density is necessary. The knowledge of particle density is also necessary for specific numerical solutions for the trajectories of particles moving in a continuous phase (air). Particle density is also essential for the design and calibration of measurement apparatus for particle identification. Laboratory particle size identification is most often based on indirect methods monitoring the electric charge on the particle surface (SMPS—scanning mobility particle sizer), the effect of particles on the scatter of the light beam (OPS—optical particle sizer), the mass of the captured particles (impactor), or the dynamics of the particles’ behavior in the air stream (APS—aerodynamic particle sizer) [
7]. The particle size measurement results obtained using these methods are valid for the respective calibration particles, but for other particles, there is often an unspecified systematic error. Another reason to pay attention to particle density is that density affects the deposition of particles in the human respiratory tract; thus, it is essential to determine their impact on human health. It was found that particles with a higher density have a higher settling velocity than particles with a lower density [
8]. The movement of smoke plumes in an atmosphere is determined by the atmospheric conditions, particle size, and particle density. The greater the particle density (particles are heavier), the higher the settling velocity and the more likely the particles are to deposit on surface areas. Furthermore, particle density is an important property for filter cake formation during filtration [
9,
10]. Particle density also affects the durability of the filter cake, i.e., the efficiency of filter regeneration. The greater the mass of the filter cake, the more efficient the filter regeneration [
11]. Particle density is primarily influenced by combustion conditions (temperature, gas flow rate, oxygen content [
12], combustion character, fuel type, particle size and shape, etc. [
13].
Cohesion is a phenomenon caused by the action of attractive intermolecular forces between particles of a given substance, which cause particles of the same substance to bond together and agglomerate (create a cluster). Intermolecular forces can be hydrogen bonds or van der Waals attractive forces [
14].
There are two types of particle densities—particle density and bulk density. Bulk density is commonly defined for bulk materials and expresses the ratio of the mass of the solid to the bulk volume, which includes air-filled interparticle voids. The bulk density is less than the particle density, and the relationship between the two is determined by the porosity of the bulk environment. Porosity is calculated as the ratio of the void volume to the total (bulk) volume [
15]. The magnitude of the bulk density generally depends on the size, shape, and surface area of the particles, the density of the solid particles, and the cohesion of the particles [
16].
The current state of knowledge shows that there are few studies dealing with the identification of the particle bulk density and particle cohesion of different size fractions of fine particles from different types of fuels. This paper focuses on the determination of the bulk density of combustion particles by combining the gravimetric identification of the mass of captured particles of different size classes and an optical method to determine the volume of captured particles. An optical analysis is also used to identify the bulk properties of the particles deposited. Specifically, this paper focuses on combustion particles emitted during the combustion of wood pellets, wood logs, and coke in a small residential combustion device. A 14-stage high-temperature Dekati low-pressure impactor (HT-DLPI+) was used to capture particulate matter (PM) from the combustion process to determine the mass size distribution of the particles in the flue gas in the size range of 13 nm–50 μm.
The particles captured in each impactor stage were dimensionally evaluated via optical microscopy. The geometric characteristics of the particle layer (bulk volume, height, angle of repose) were obtained using an optical digital microscope, allowing for the assessment of the bulk density and cohesion of the particles. The novelty of this paper is that the evaluation of the bulk density and cohesion was performed using a new method, the optical method.
2. Materials and Methods
Within the framework of this study, combustion tests of three selected fuels were carried out in a small residential combustion device. The sampling of the particles that were carried away in the flue gas stream and their subsequent mass and optical identification were performed. Separately, the individual particle size fractions captured on the cascade impactor stages were monitored. Based on the obtained characteristics, the particle bulk density and the particle deposition characteristics of the individual particle size fractions were evaluated.
2.1. Combustion Equipment and Tested Fuels
For the combustion tests, an automatic pellet boiler with a screw feeder (ATTACK FD32 6-part; year of manufacture, 2019; rated output, 30 kW) was used. The boiler had been in service for three years as a heat source for a residential building. The variable design of the boiler construction allows the burning of wood logs and coke in addition to wood pellets.
Three types of fuel were burned in the boiler—wood pellets, wood logs, and coke. The ENplus A1 wood pellets are made only from pure spruce sawdust without admixtures and were stored in bags for two to three years. In addition, hard, dry wood logs (oak) were burned, which were stored under a ventilated shelter for four years. The last fuel that was burned was coke, which was stored in a dry ventilated room for a minimum of five years.
Table 1 shows the proximate analysis of the measured fuels. This table shows the average values of the three measurements and sample standard deviations (SSDs). To measure the water content, the samples were placed in a laboratory dryer oven at 105 °C for 12 h. Subsequently, the samples were placed in a desiccator to prevent the absorption of air moisture [
17]. For the measurement of the ash content, the samples in ceramic crucibles were annealed in a kiln at 550 ± 10 °C for 10 h (at least 60 min, according to the standard), and the samples were subsequently placed in a desiccator [
18]. For the measurement of the volatile combustible content, the samples in ceramic crucibles were placed in an oven at 900 ± 10 °C for 7 min, then placed in a desiccator [
19]. The determination of the heat of combustion, also known as the higher heating value (HHV), was carried out using a Parr 6200 calorimeter [
20].
2.2. Combustion Tests
Prior to each stoking, the boiler, including the heat exchangers and the flue pipe, was cleaned to ensure that no tar deposits were present in the boiler or flue. The pellet combustion was automatic using a screw feeder and the burner power was set at 17 kW. Sampling was carried out in a steady-state operation at a rated power level. After the boiler was rebuilt (removing the pellet burner, replacing the ash door, etc.), the boiler was operated on wood logs and then on coke. Boiler stoking of the wood logs was carried out to reach the boiler operating temperature in the shortest possible time. Subsequently, larger wood logs were added. The secondary air of the boiler was fully opened. Measurements were taken with the boiler operating at a steady state, with the boiler water temperature maintained at 80 °C. The coke was burned in the same manner, but coke takes longer to kindle. Coke burns with a small flame or only glows compared to wood logs. The coke was fed to the back of the boiler. During the burning of the coke, only the primary air supply was provided under the grate; the secondary air was closed. The oxygen content of the flue gas during the flue gas sampling was ideal, at approximately 10%.
2.3. Particle Sampling
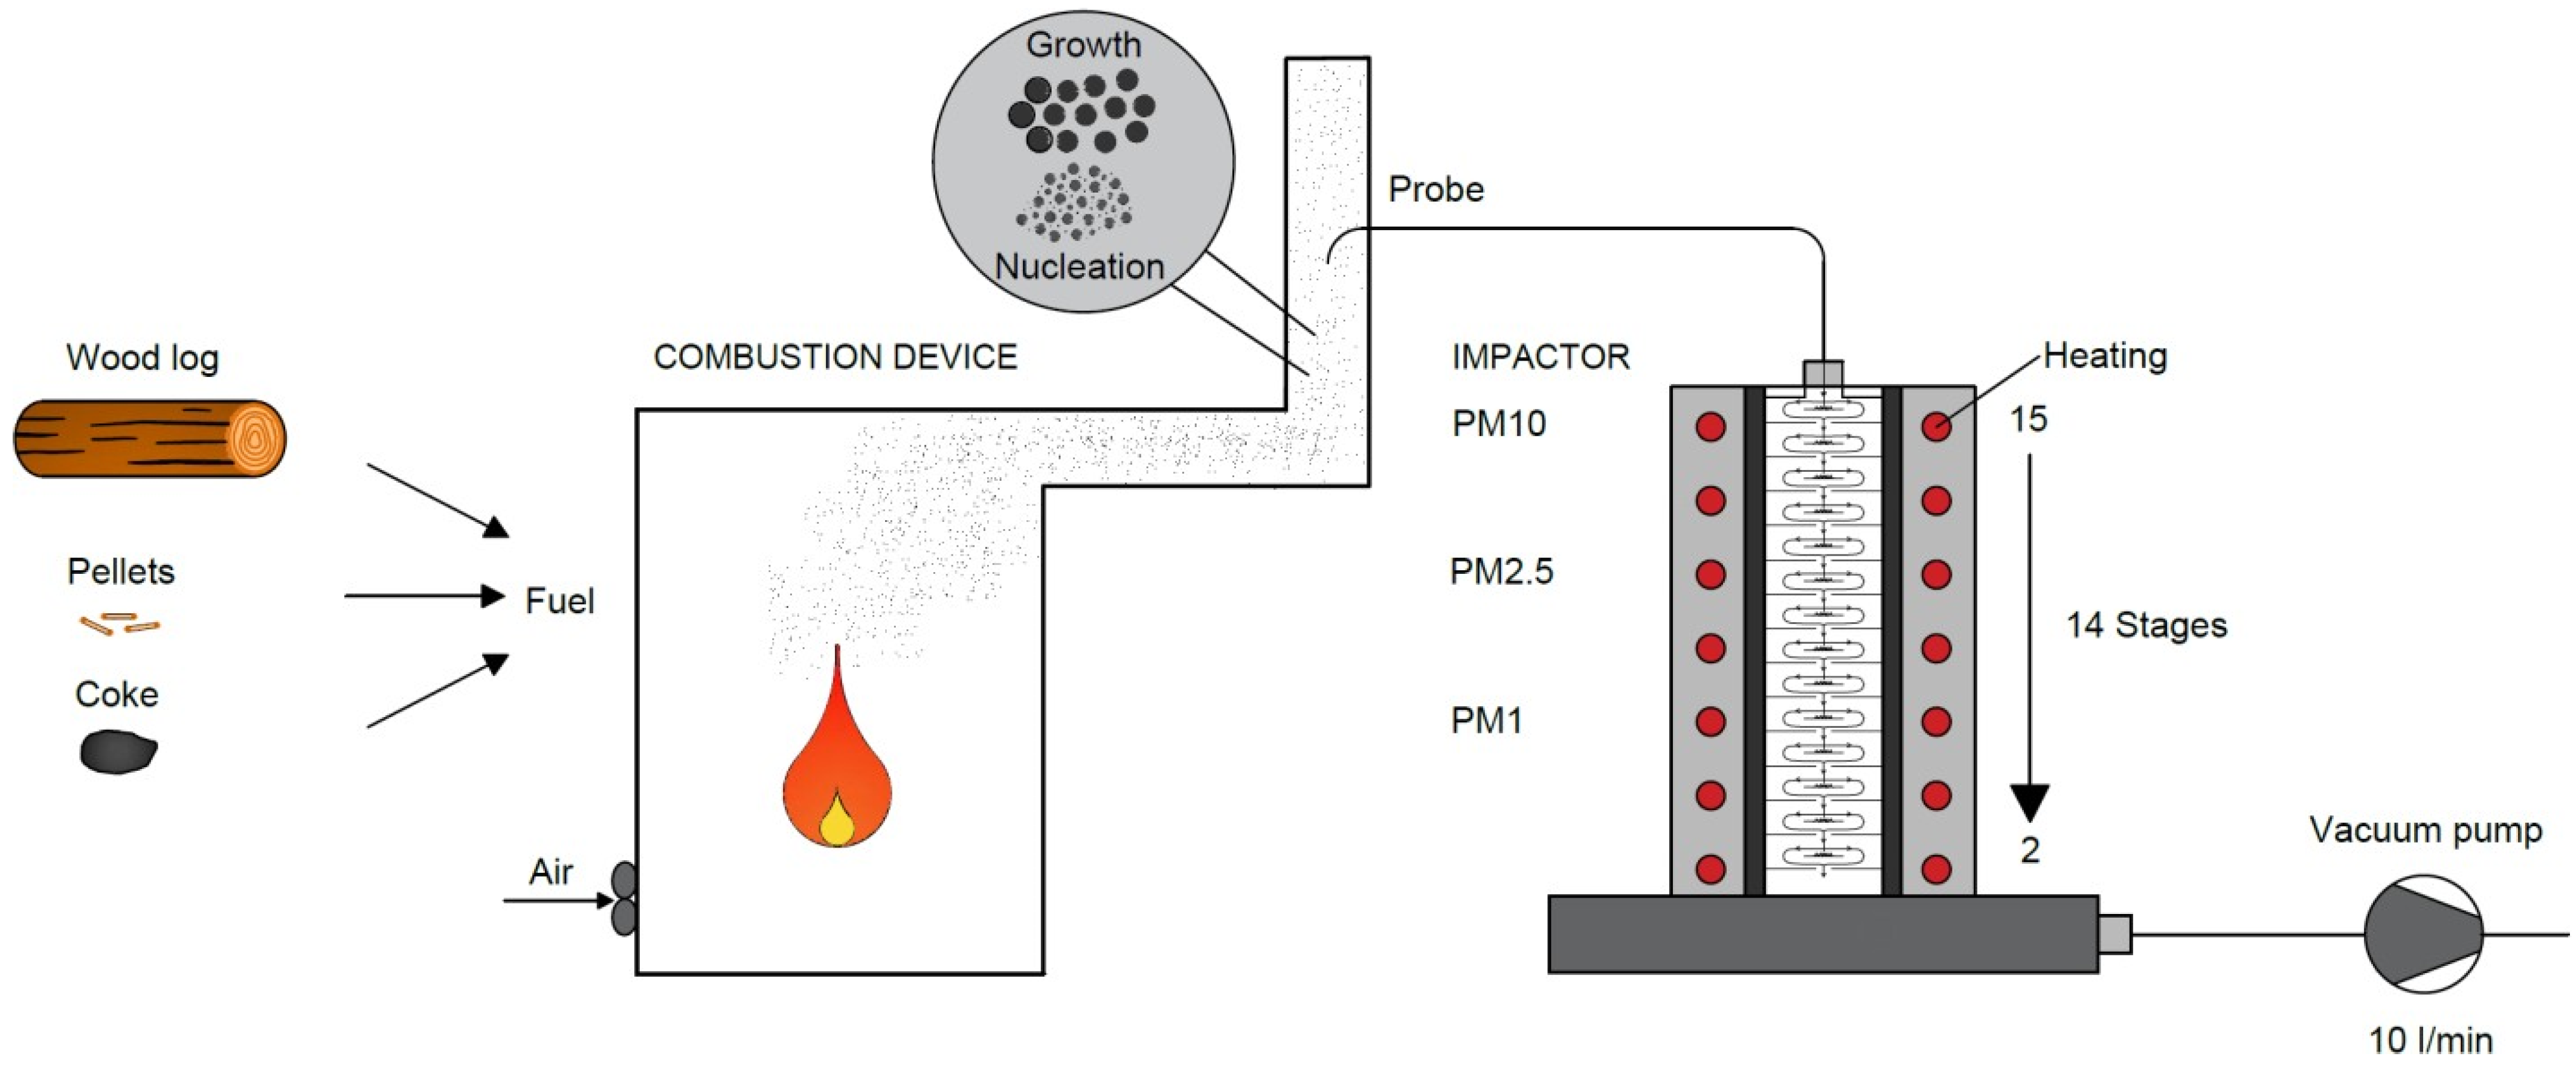
Flue gas sampling was carried out in the flue pipe with a diameter of 150 mm, discharging the flue gases from the boiler. A sampling isokinetic probe, placed in the flue pipe at approximately 1 m above the boiler, was used to sample the flue gas. The sampling probe was only oriented against the direction of the flue gas flow during the sampling period. For the remaining time, the probe was oriented in the direction of the flue gas flow to avoid the unwanted fouling of the probe. Flue gas sampling was carried out during the stable combustion phase when the flue gas temperature was kept constant. From the sampling probe, the flue gas passed through an insulated pipe that connected the probe to the impactor; see
Figure 1.
The sampling of the flue gas for each fuel type was repeated three times; thus, 9 measurements were made with the impactor during the steady-state combustion operation. The flue gas sampling times and flue gas temperatures for the wood pellets, wood logs, and coke combustion are shown in
Table 2.
The sampled flue gas was introduced into the high-temperature Dekati low-pressure impactor. The impactor is a device used to gravimetrically determine the distribution of particles. It consists of fourteen stages through which the flue gas passes, and particles in the size fractions of 13 nm–50 μm are captured. The flow of the flue gas sample through the impactor is provided by a pump connected to the outlet of the impactor. The exhaust gas sampling time was determined based on test measurements for each fuel. Prior to sampling, the impactor was heated to 130 °C to prevent the passing gas from condensing in the impactor. During the flue gas sampling, the pressure was set at 40 mbar on the vacuum pump, and the temperature of the gas entering the impactor was continuously recorded. The flue gas passing through the impactor flows through individual stages, which contain aluminum foils coated with Vaseline. The foils are used to gradually capture particulate matter via impaction. Around the foils are openings through which the flue gas sample flows to the next stages of the impactor, which have smaller and smaller openings (conditions for higher flue gas velocity—separation of smaller particles). To determine the gravimetric distribution of particles, the foils were weighed before and after the measurements. The weighing of the clean and used foils was repeated three times and the final weight was obtained by averaging the values obtained. Prior to weighing, the electrical charge of the aluminum foils was removed using a frame ionizer.
2.4. Optical Identification of Captured Particles
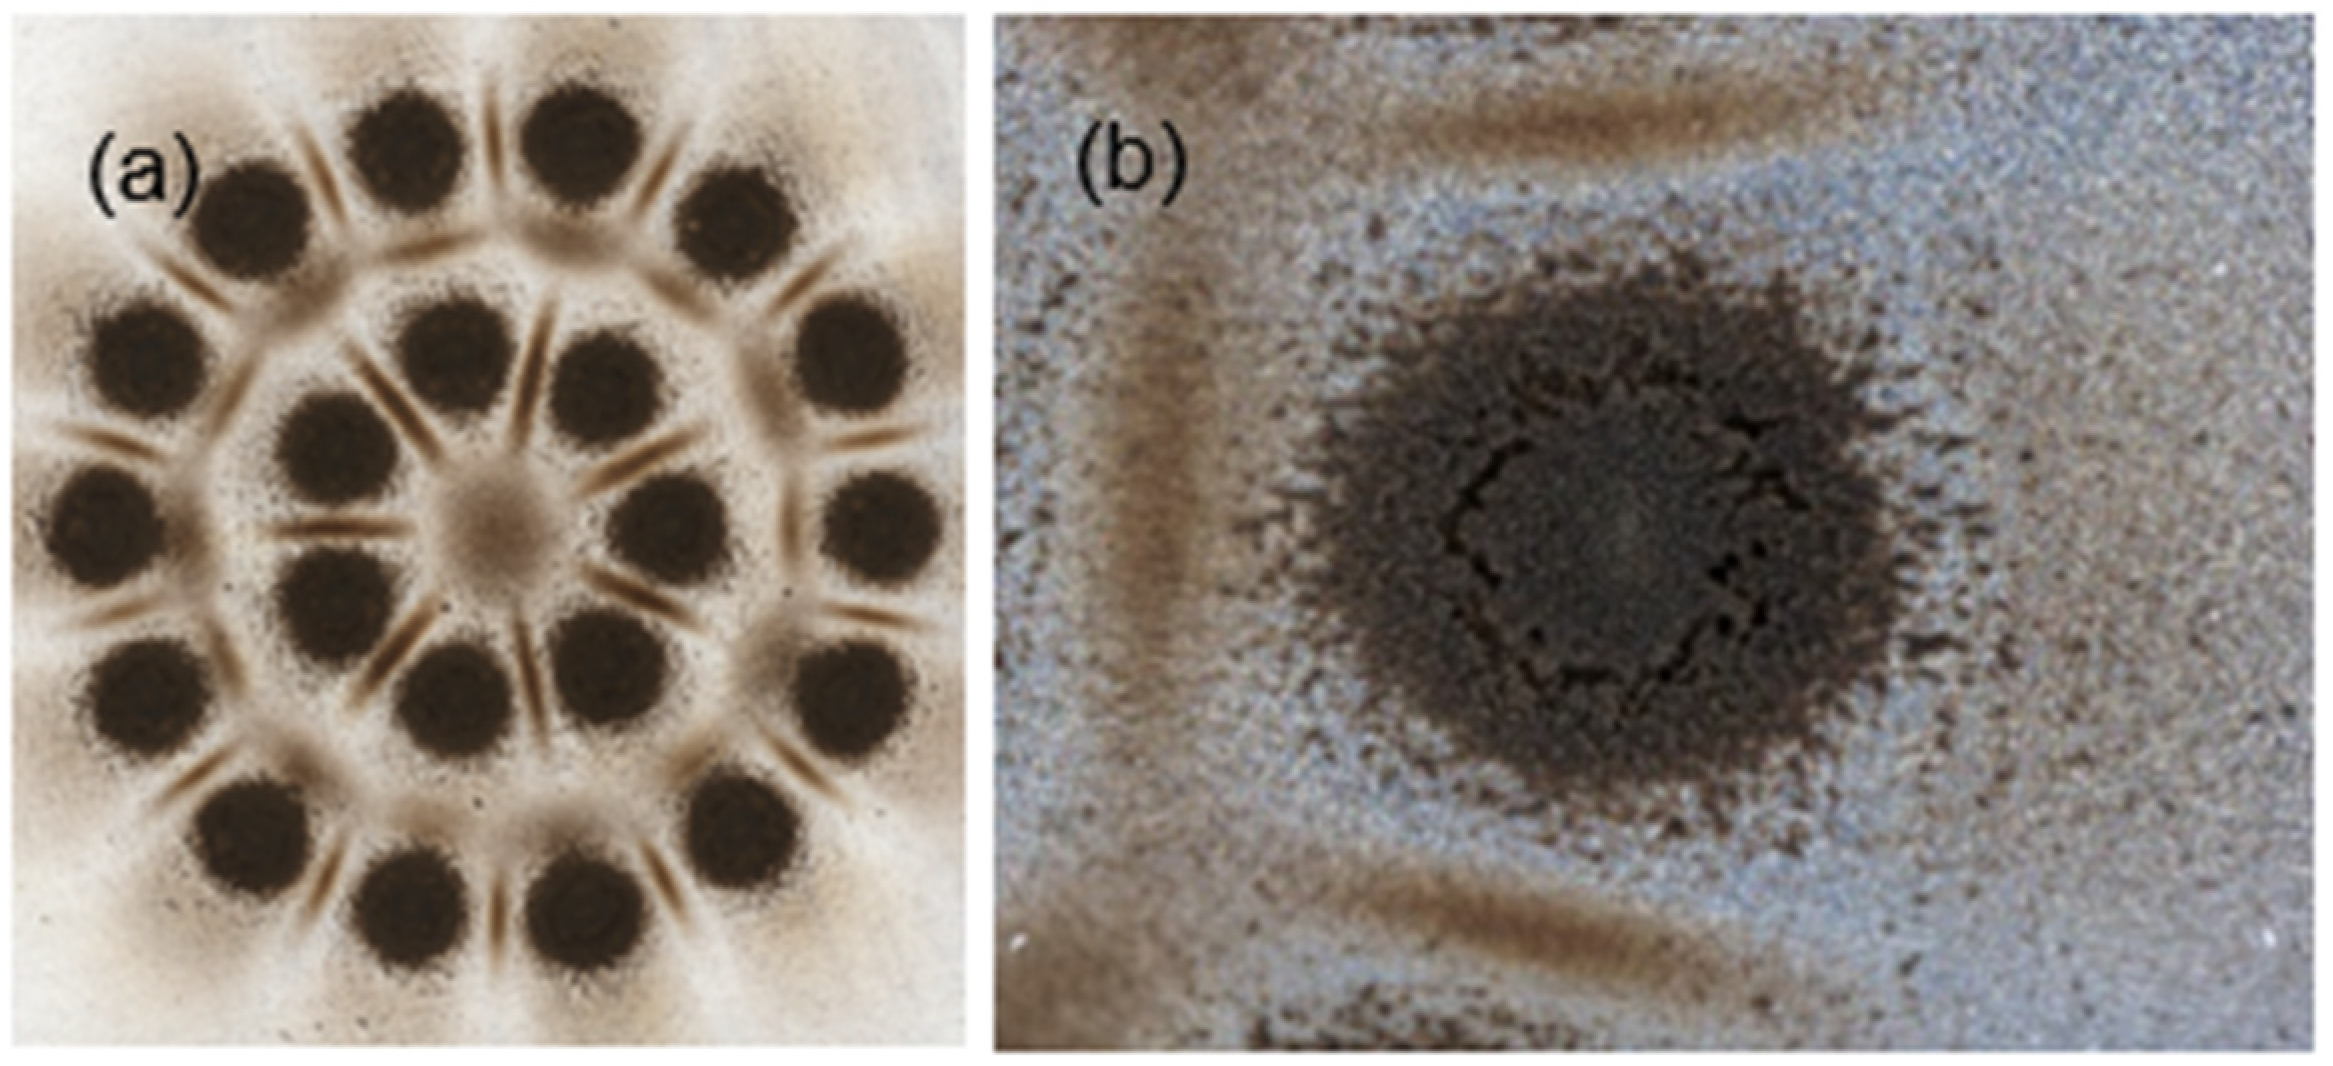
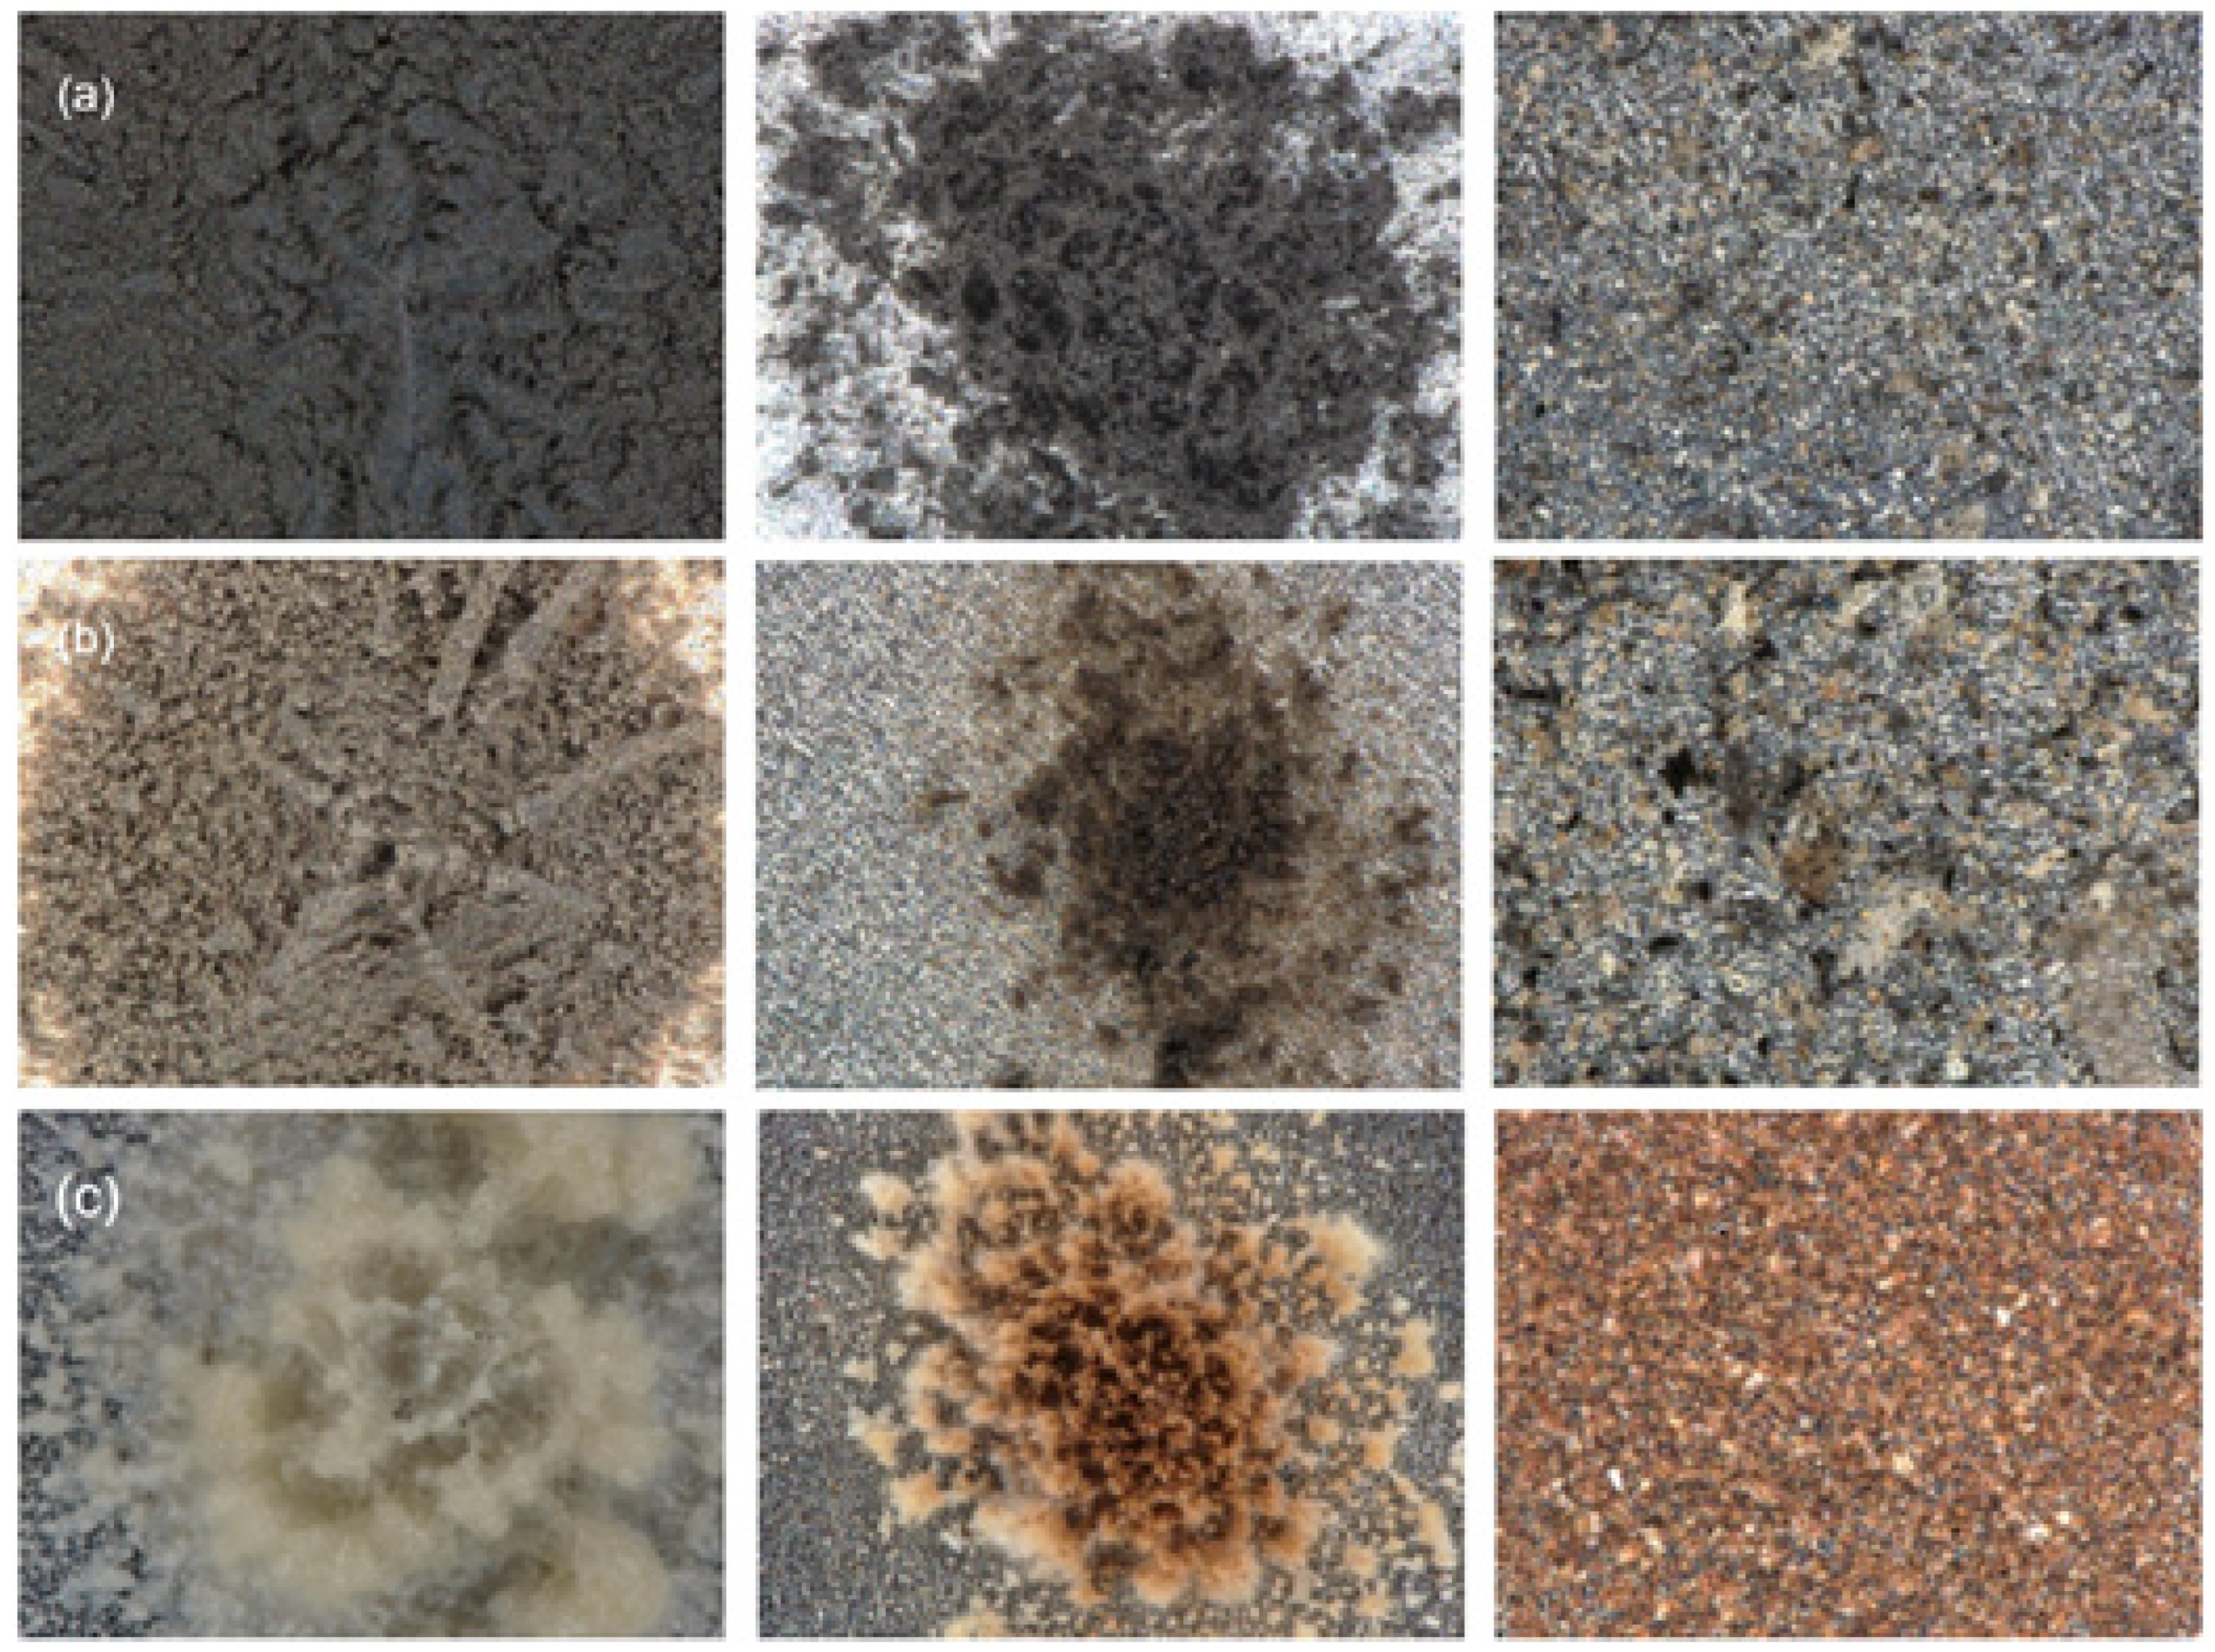
The determination of the volume and bulk properties of the particles captured on the foil was performed using a Keyence VHX-7000 optical digital microscope capable of 20–7000× optical magnification. The bulk volume of the captured particles was obtained via the 3D imaging of the captured particles; see
Figure 2b. The 3D image was obtained at a high resolution using the “Fine Depth Composition” function at 700× or 500× magnification to assess the volume of a particular impaction deposit sample more accurately. The captured particles on the foils formed several separate impaction deposits, the number of which corresponded to the number of openings of each impactor stage; see
Figure 2a.
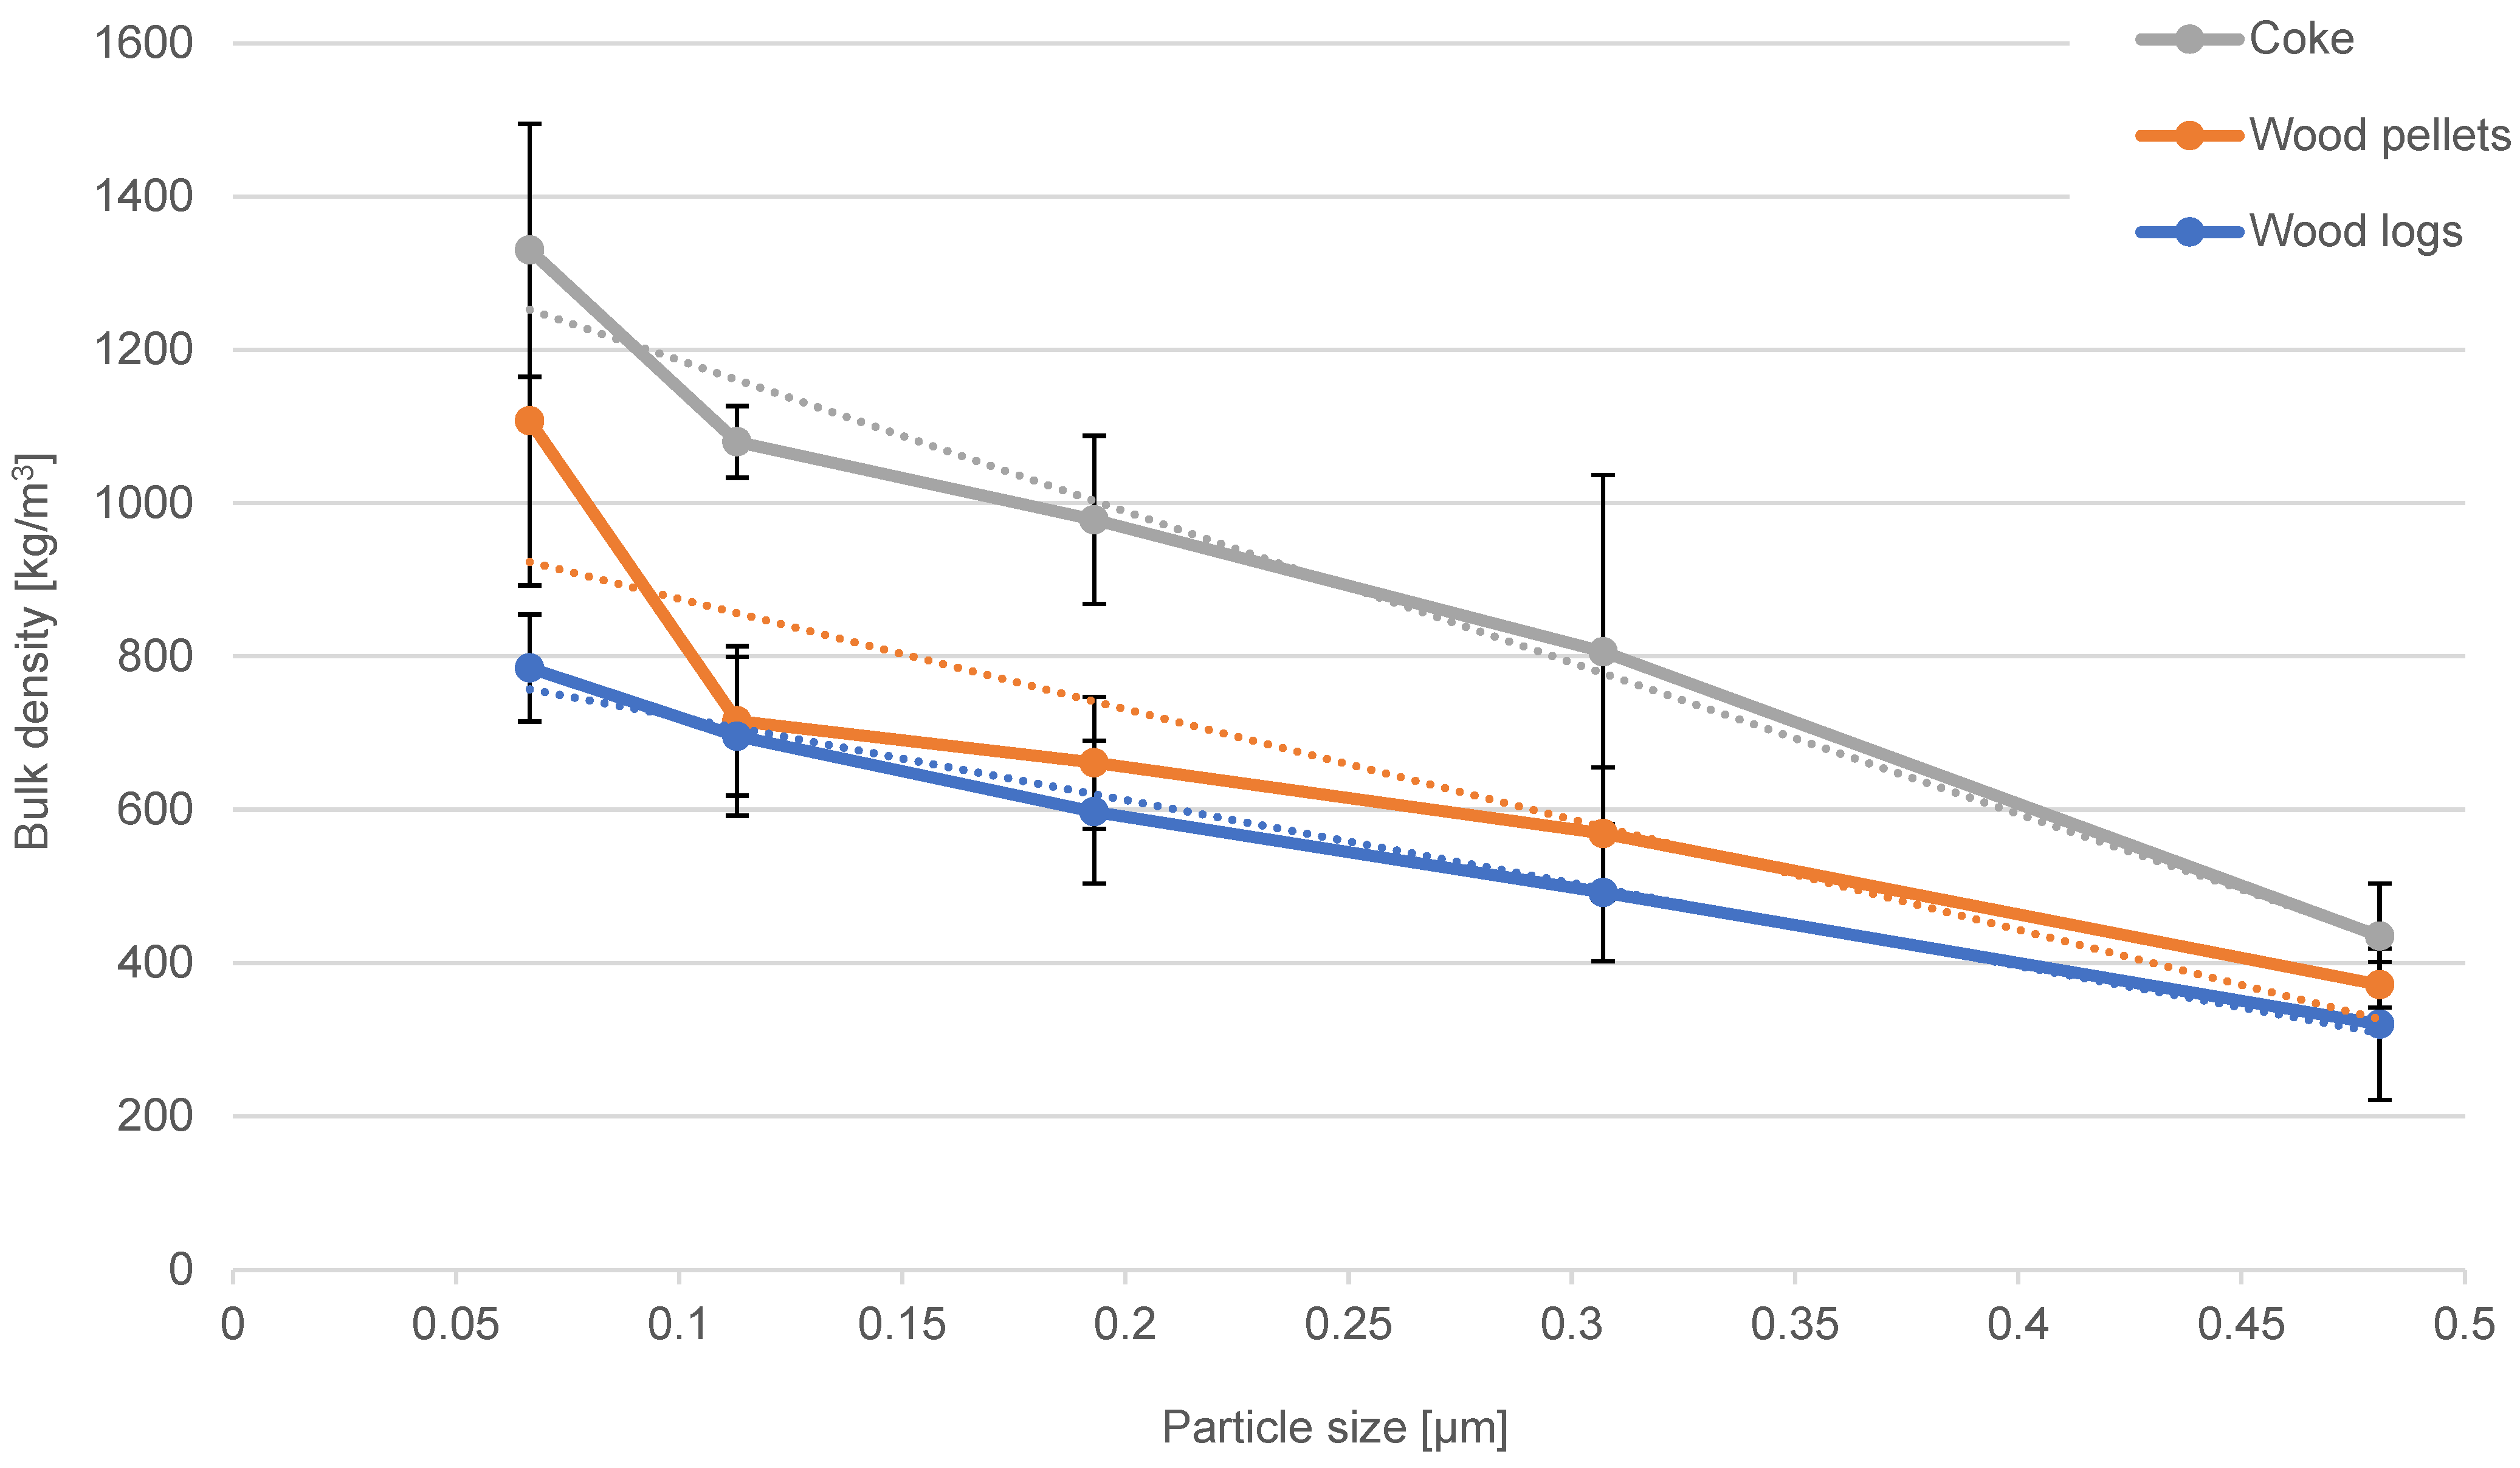
Consequently, the stitching of the partial 3D images was performed to display a 3D image of the whole foils. Subsequently, the tilt correction of the 3D image was performed by defining the base plane. Since the particle volumes of individual impactor deposits vary only negligibly within a single impactor stage, the total volume of the particles captured in a single stage was obtained as the average volume of the reference one deposit multiplied by the total number of the deposits of the respective impactor stage. The geometry of the reference impaction deposit was obtained as the average of the geometric characteristics of at least 3 analyzed impaction deposits within a single impactor stage. From the measured bulk volume and sample weight, the bulk particle density of the three tested fuel samples was calculated. The bulk density was identified with sufficient accuracy for a particle size range of 51–595 nm (impactor stages 4–8). In this size range, the particle deposition volumes identified with the microscope are significant. The particle deposits in the other impactor stages were too small to allow for the optical identification of their volume with sufficient accuracy.
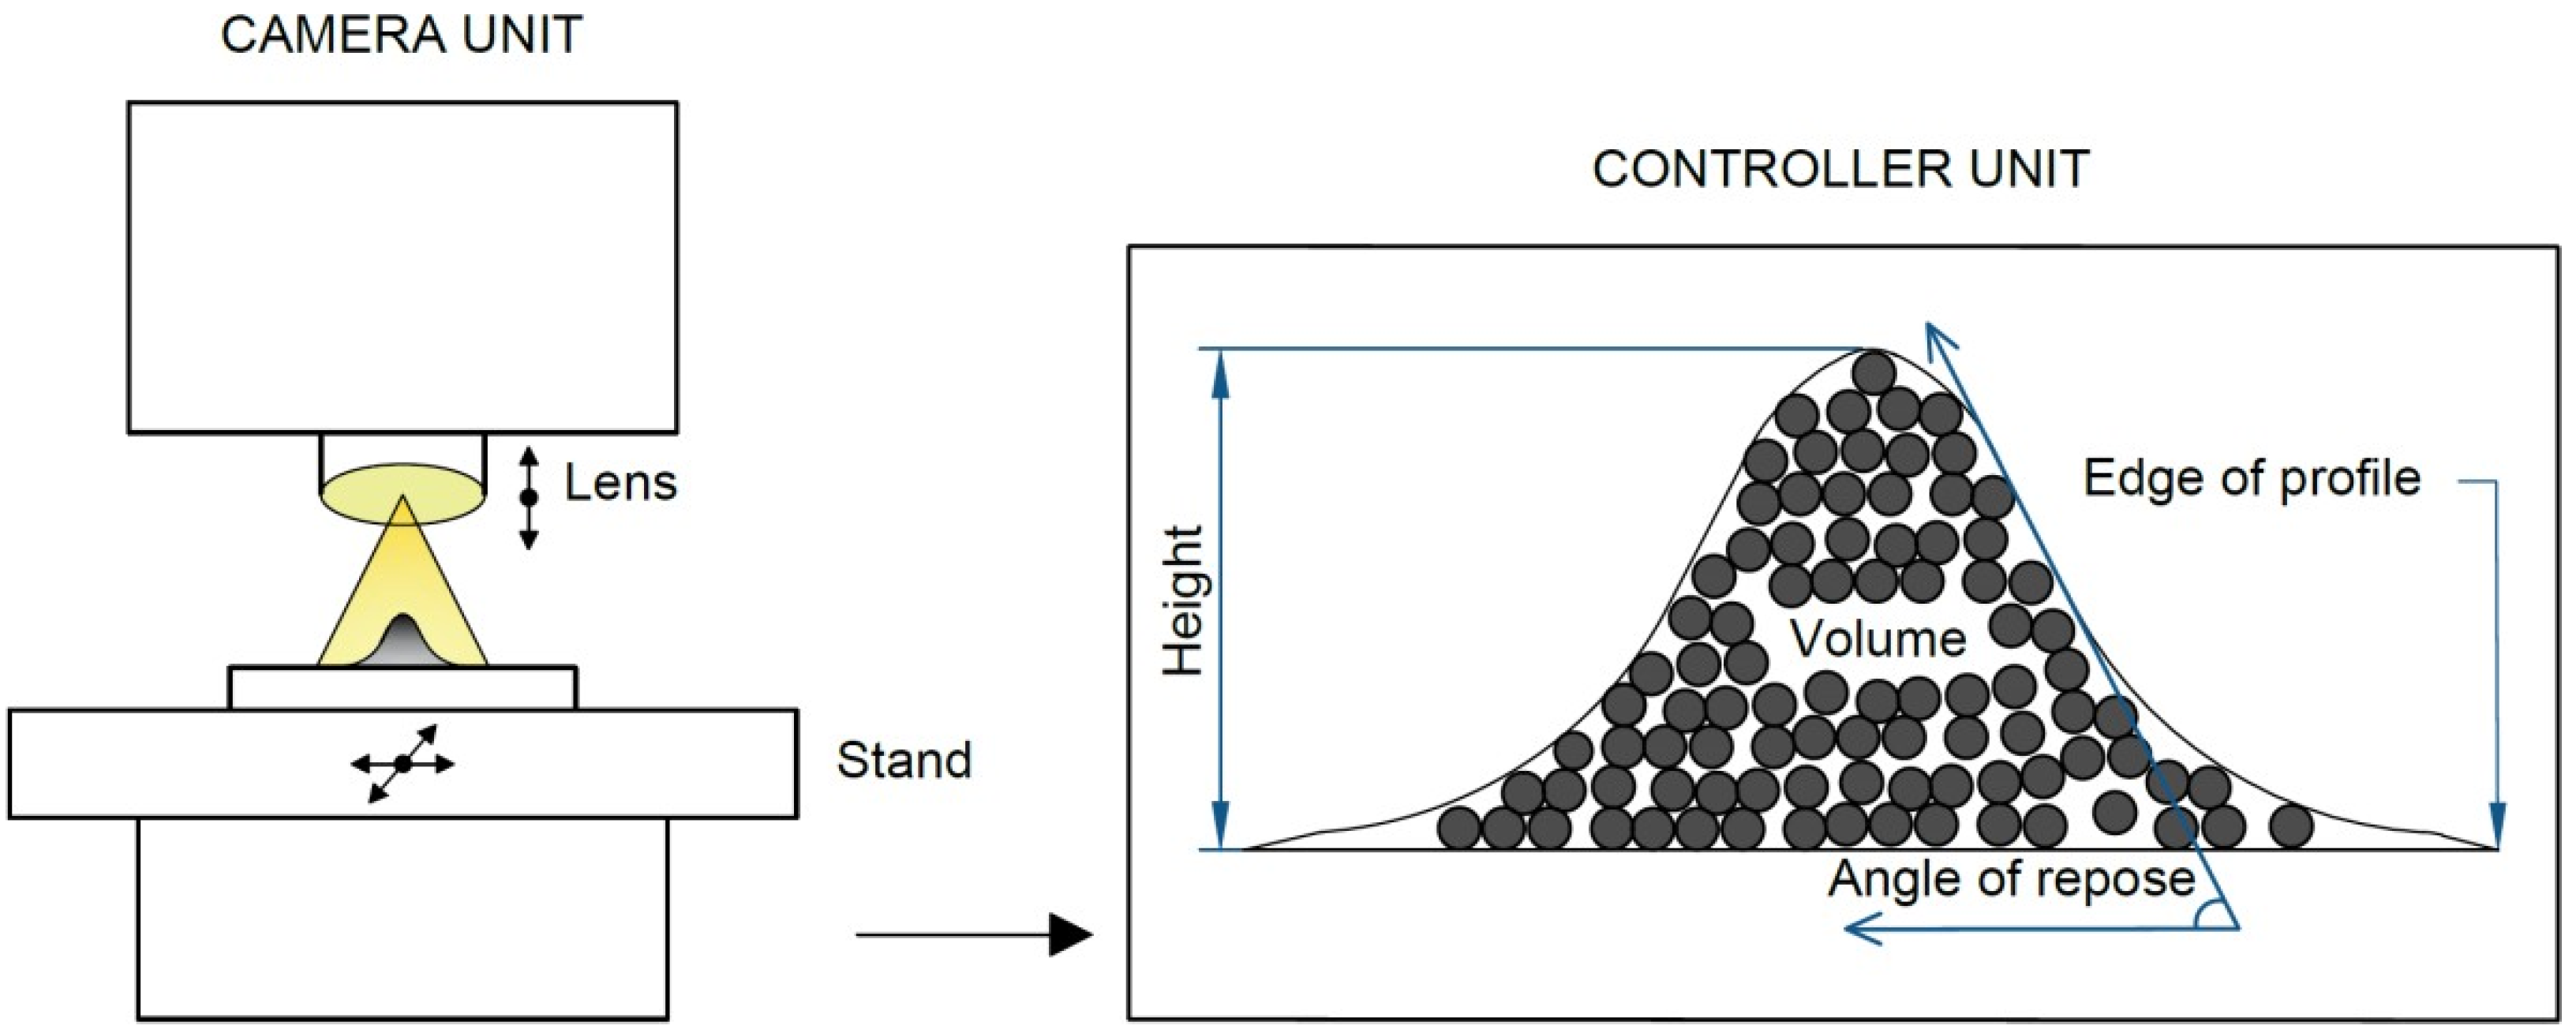
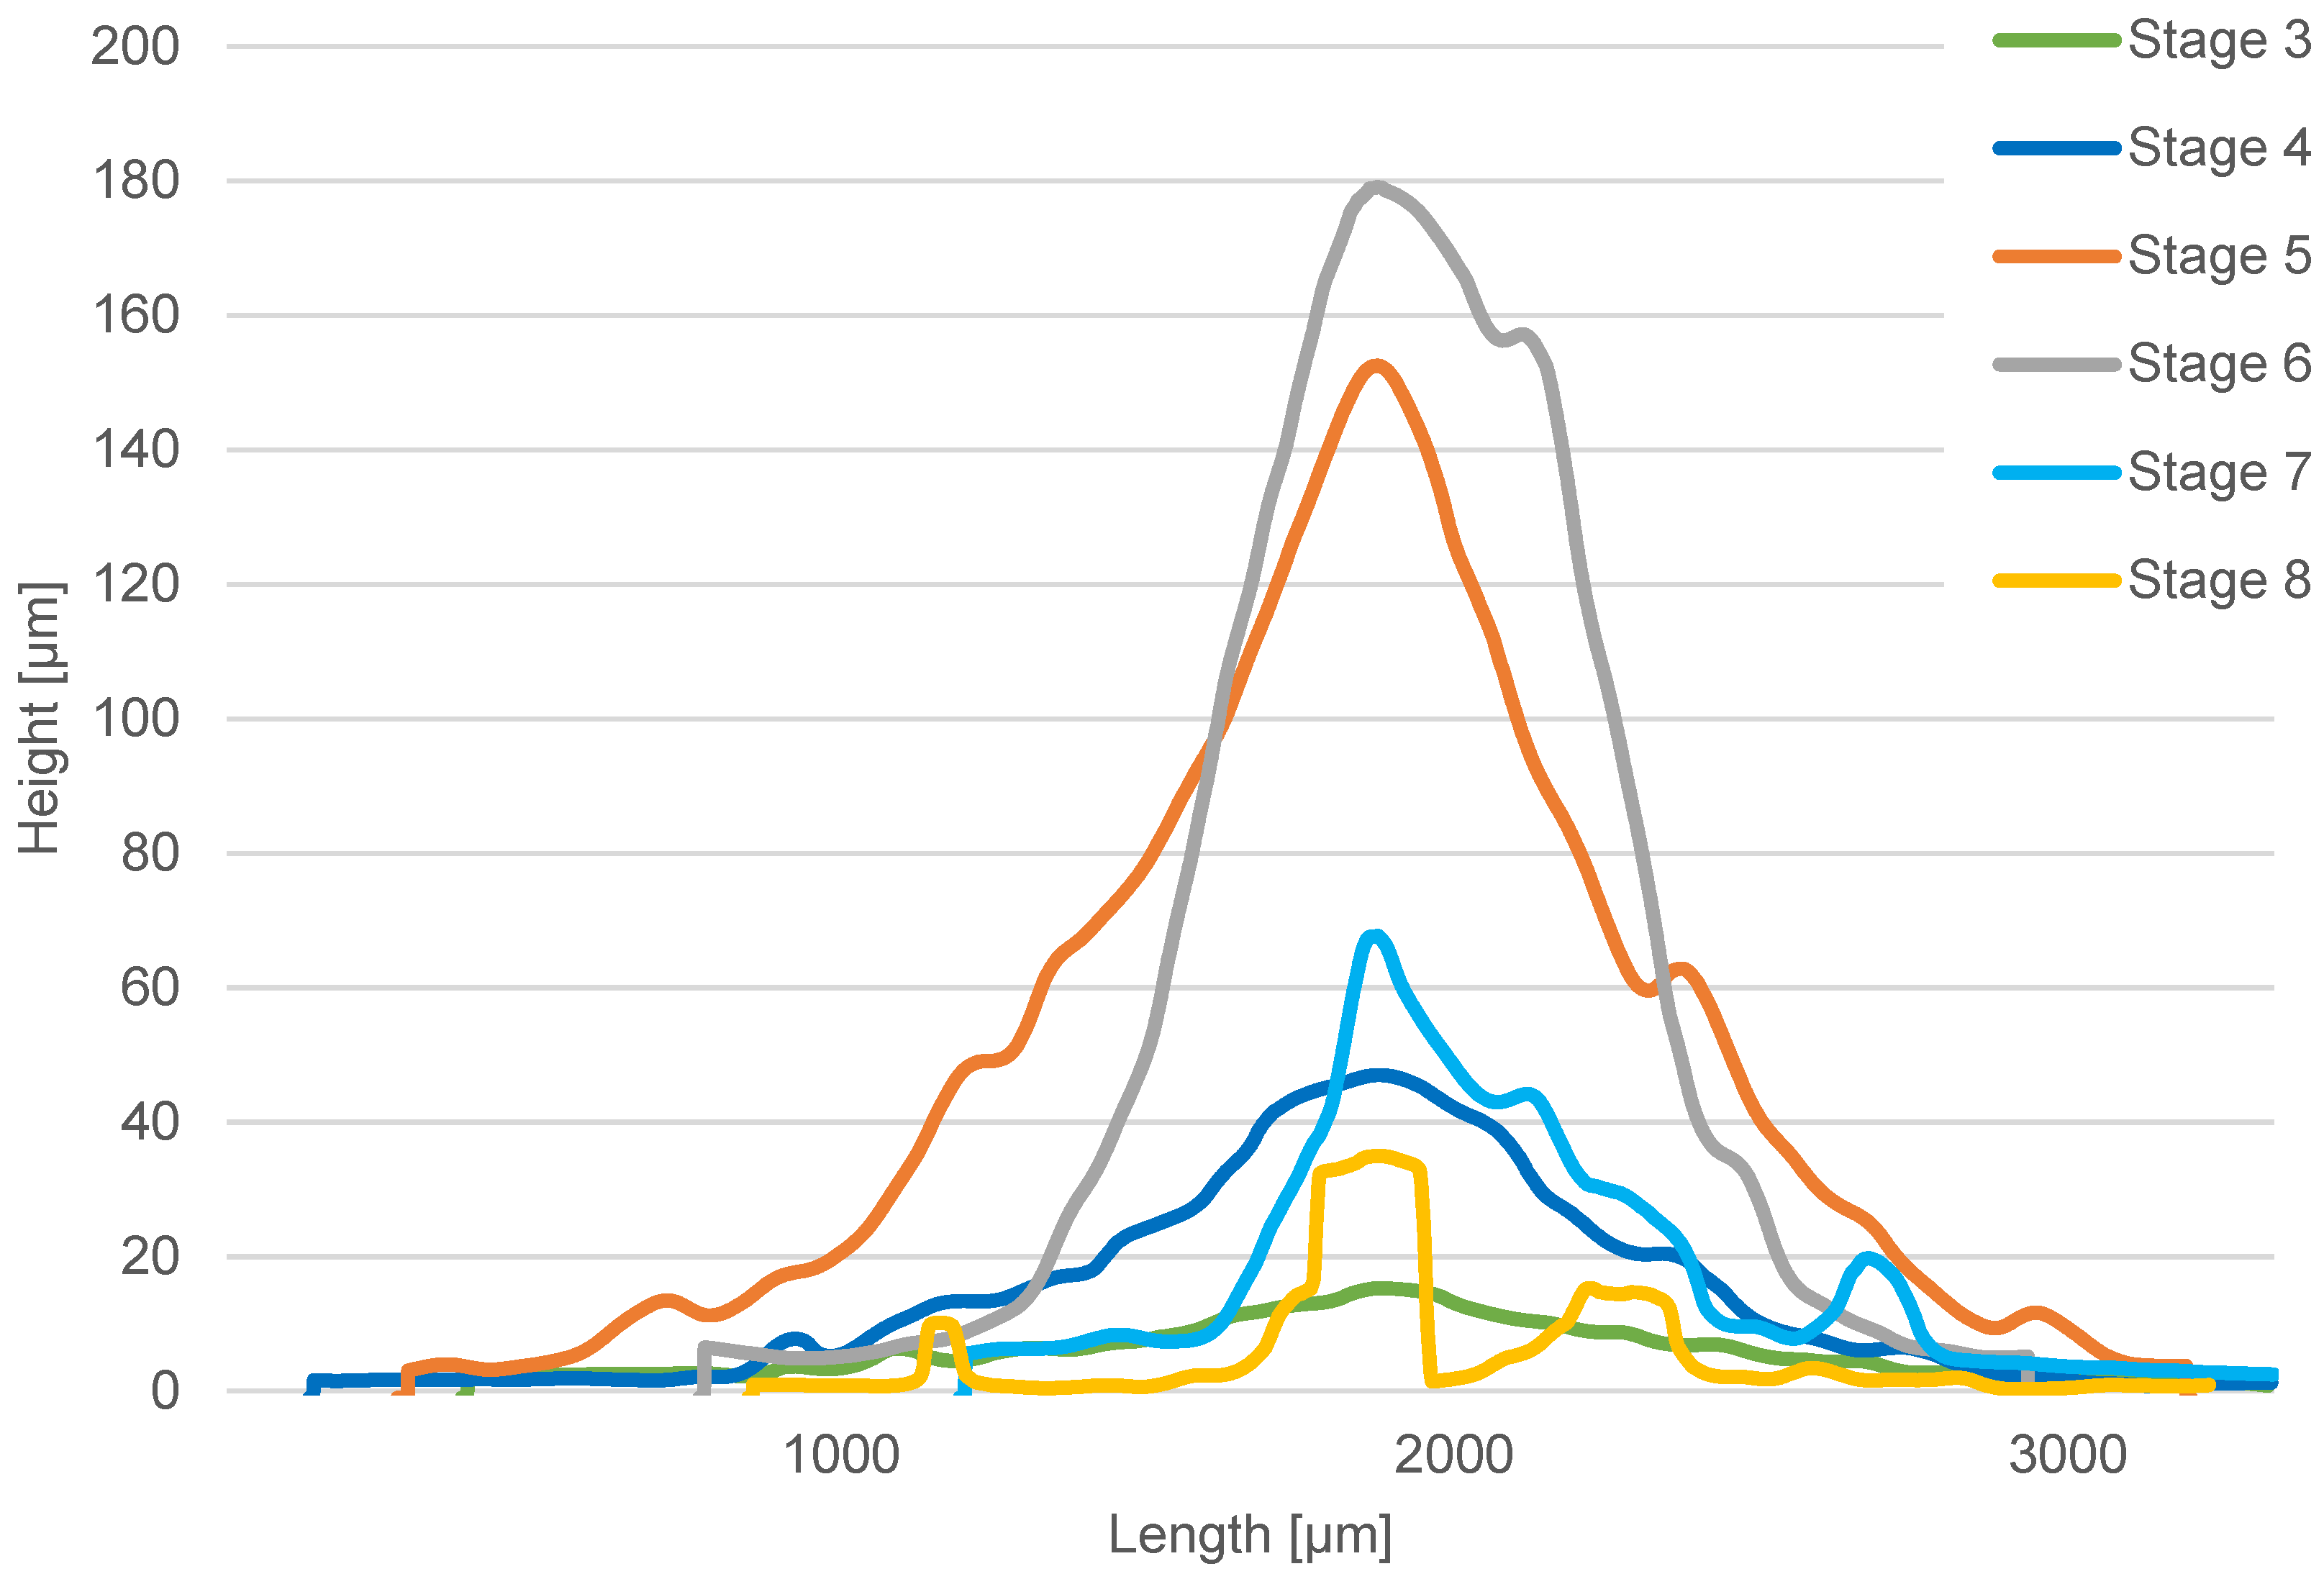
Using the data obtained through the microscopic analysis, a 3D profile of the reference impactor deposit was further obtained to evaluate the angle of repose. For this purpose, the angle between the horizontal plane and the maximum slope of the deposit contour was monitored; see
Figure 3.
4. Discussion
The studies from Stringer et al. and Freeman indicate that with a smaller particle size (less mass), the contribution of gravitational forces decreases and the influence of interparticle forces increases [
22,
23]. Specifically, for particle sizes smaller than 100 μm, the interparticle attractive van der Waals forces exceed gravity. When the attractive forces exceed the mass of the particle by at least an order of magnitude, the particles become very cohesive and form aggregates (strongly bound particles). At the same time, smaller particles have a relatively large specific surface area, resulting in very high adhesion and an associated increase in interparticle forces [
24]. In general, smaller particles tend to be more cohesive for these reasons. Larger particles tend to pack tightly into homogeneous layers with a rigid structure. Such layers may have significant void spaces between touching particles but are generally free of large voids [
23]. Generally, the smaller the particles, the more they stick together due to smaller void spaces, resulting in a higher bulk density and cohesion. However, it must be considered that the cohesion and bulk density are also influenced by the particle type and other particle properties (see Introduction).
The cohesion of fine particles significantly influences the formation of particle clusters and particle deposits in the flue gas paths. Depending on the properties of the particles, the particles are either permanently joined or only briefly contacted with subsequent separation. The maintenance of long-term particle contact is used, for example, in the filtration of fine particles using porous filters [
25,
26,
27,
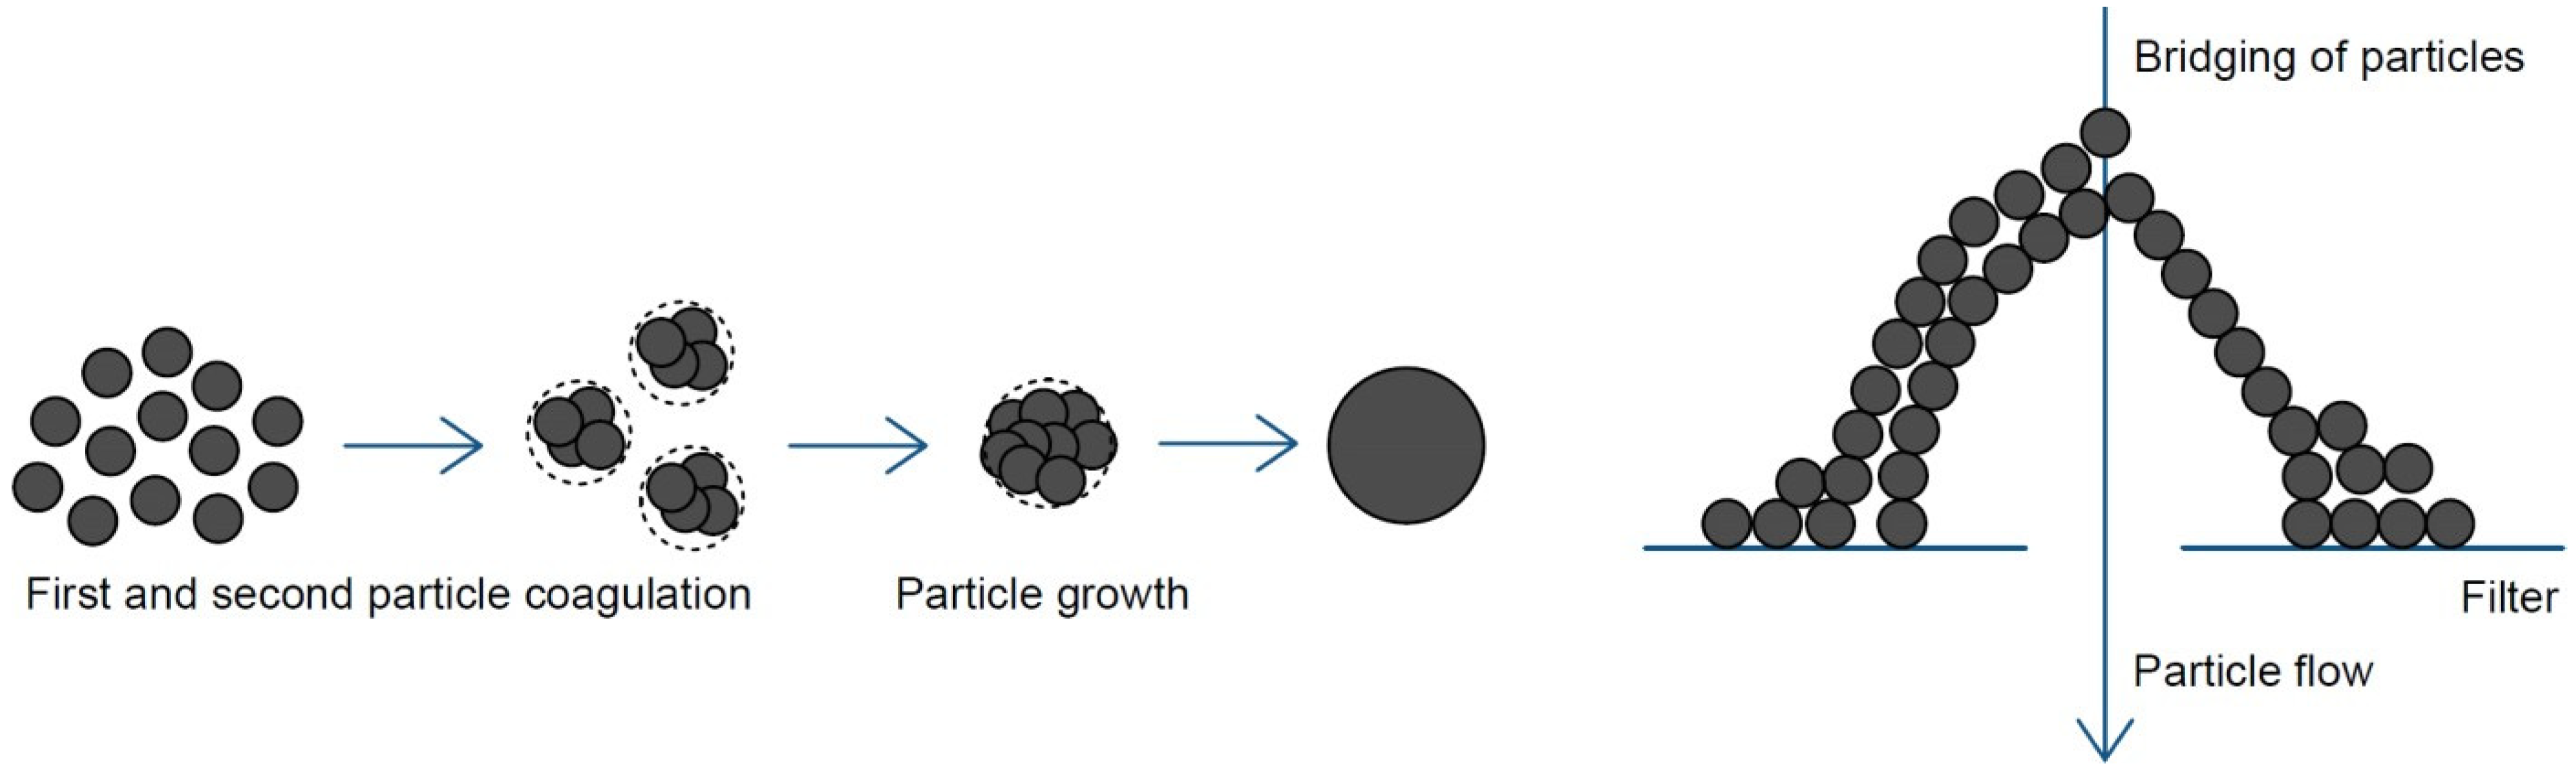
28]. The pores of the filter are, in most cases, significantly larger in size than the particles to be captured. The capture process requires the bridging of the particles in the initial stage of filtration, thus partially clogging the pores and increasing the filtration efficiency for the fine particles; see
Figure 8 (adapted from [
29,
30]). On the other hand, particle cohesion can also have an undesirable effect, for example, when particles are captured in impactors. Particles that are easy to bond permanently form narrow but relatively high structures (towers) on the impaction surface, which restrict the function of the impactor, even though the mass of the captured particles has not reached the desired value.
Due to the very small particle sizes, we are usually only able to identify the density and cohesion of a certain number/mass of particles. The direct measurement of particle density is practically not used, and indirect methods are dominantly used for density identification. Published studies by various authors describe the use of different methods for measuring the density of combustion particles. Leskinen et al. measured the effective density (density of porous particles or nanoparticle agglomerates [
9]) of particles produced during the combustion of various wood fuels using an aerosol particle mass analyzer and a scanning mobility particle sizer (APM-SMPS). In the steady-state phase of combustion, the effective density of agglomerates for small particles was found to be 1000 kg/m
3, and for 400 nm particles, the density dropped to 250 kg/m
3. In the glowing phase, the effective density was higher, namely 1000–2000 kg/m
3 [
13].
In another study by Ouf et al., the actual density of emitted combustion particles was measured according to ISO 787-23, which is based on the measurement of the liquid displacement caused by the immersion of a powder of known mass [
31]. It was found that the actual particle density decreases significantly with the increasing organic carbon (OC) content in the flue gas. The density of soot with a low OC content (<5%) came out to be 1834 ± 187 kg/m
3, and the density of soot with a high OC content (>20%) came out to be 1285 ± 217 kg/m
3. The agreement between the results obtained using the indirect method using a differential mobility analyzer and centrifugal particle mass analyzer (DMA-CPMA) was demonstrated [
9].
Coudray et al. in their studies use an electrical low-pressure impactor (ELPI) and a scanning electron microscope (SEM) to determine particle size distribution and density [
12,
32]. The density of wood combustion ash was identified in the range of 1100–3000 kg/m
3 for a mean equivalent particle diameter of 69–157 nm [
12]. In a study by Sitek et al., the particle size distribution of combustion source particles was evaluated using an SMPS, and the largest number of particles produced from biofuels was identified as 100–130 nm [
4]. For combustion in a thermogravimetric analyzer (TGA), a density value of 500 kg/m
3 was used, according to Leskinen et al. [
13].
Other studies by Cha et al. evaluate the effective density of flying particles in a railway tunnel using a combination of several instruments, e.g., a tapered element oscillating microbalance (TEOM) and a fast mobility particle sizer (FMPS). The effective density was measured using the ELPI+ and SMPS came out to be 1350 kg/m
3 [
33]. A study by Geller et al. focuses on the measurement of the effective density of atmospheric aerosols using a differential mobility analyzer and aerosol particle mass analyzer (DMA-APM). Other authors report an effective particle density of 1200–1500 kg/m
3 for particles of 50–202 nm [
34].
4.1. Comparison of the Results with Other Studies
The authors of this study were able to find only a limited number of studies devoted to the comparable identification of combustion particle density and its bulking properties. Among the retrieved studies, the comprehensive study published by Leskinen et al. plays an important role. In this study, the author measured the effective density of particles produced by the combustion of different types of wood using the APM-SMPS system. Leskinen et al. report the measured effective density of combustion particles from hardwood, specifically beech. In the steady combustion phase, when the least gaseous emissions are produced, he reports an effective particle density of beech of approximately 300–900 kg/m
3 in the particle size range of 50–300 nm. This trend is consistent with the results obtained in this study for oak wood. Also consistent is the trend in the results that the particle density decreases with increasing particle size. The identified bulk density of particles emitted during the combustion of softwood pellets with bark admixture corresponds closely to the results reported by Leskinen et al. for the combustion of spruce wood particles [
13]. Some differences in the results are due to the different types of boilers used in the studies by different authors, the different experimental methods, and the different properties of the fuels used.
4.2. Future Prospects
Particulate matter emitted from the combustion of solid fuels is very unsafe for humans, so studying its properties is very important. The density of particles from combustion is not sufficiently studied; therefore, further research will lead to further evaluation of bulk densities using other types of fuels and under different combustion conditions (different combustion phases, different oxygen content).
5. Conclusions
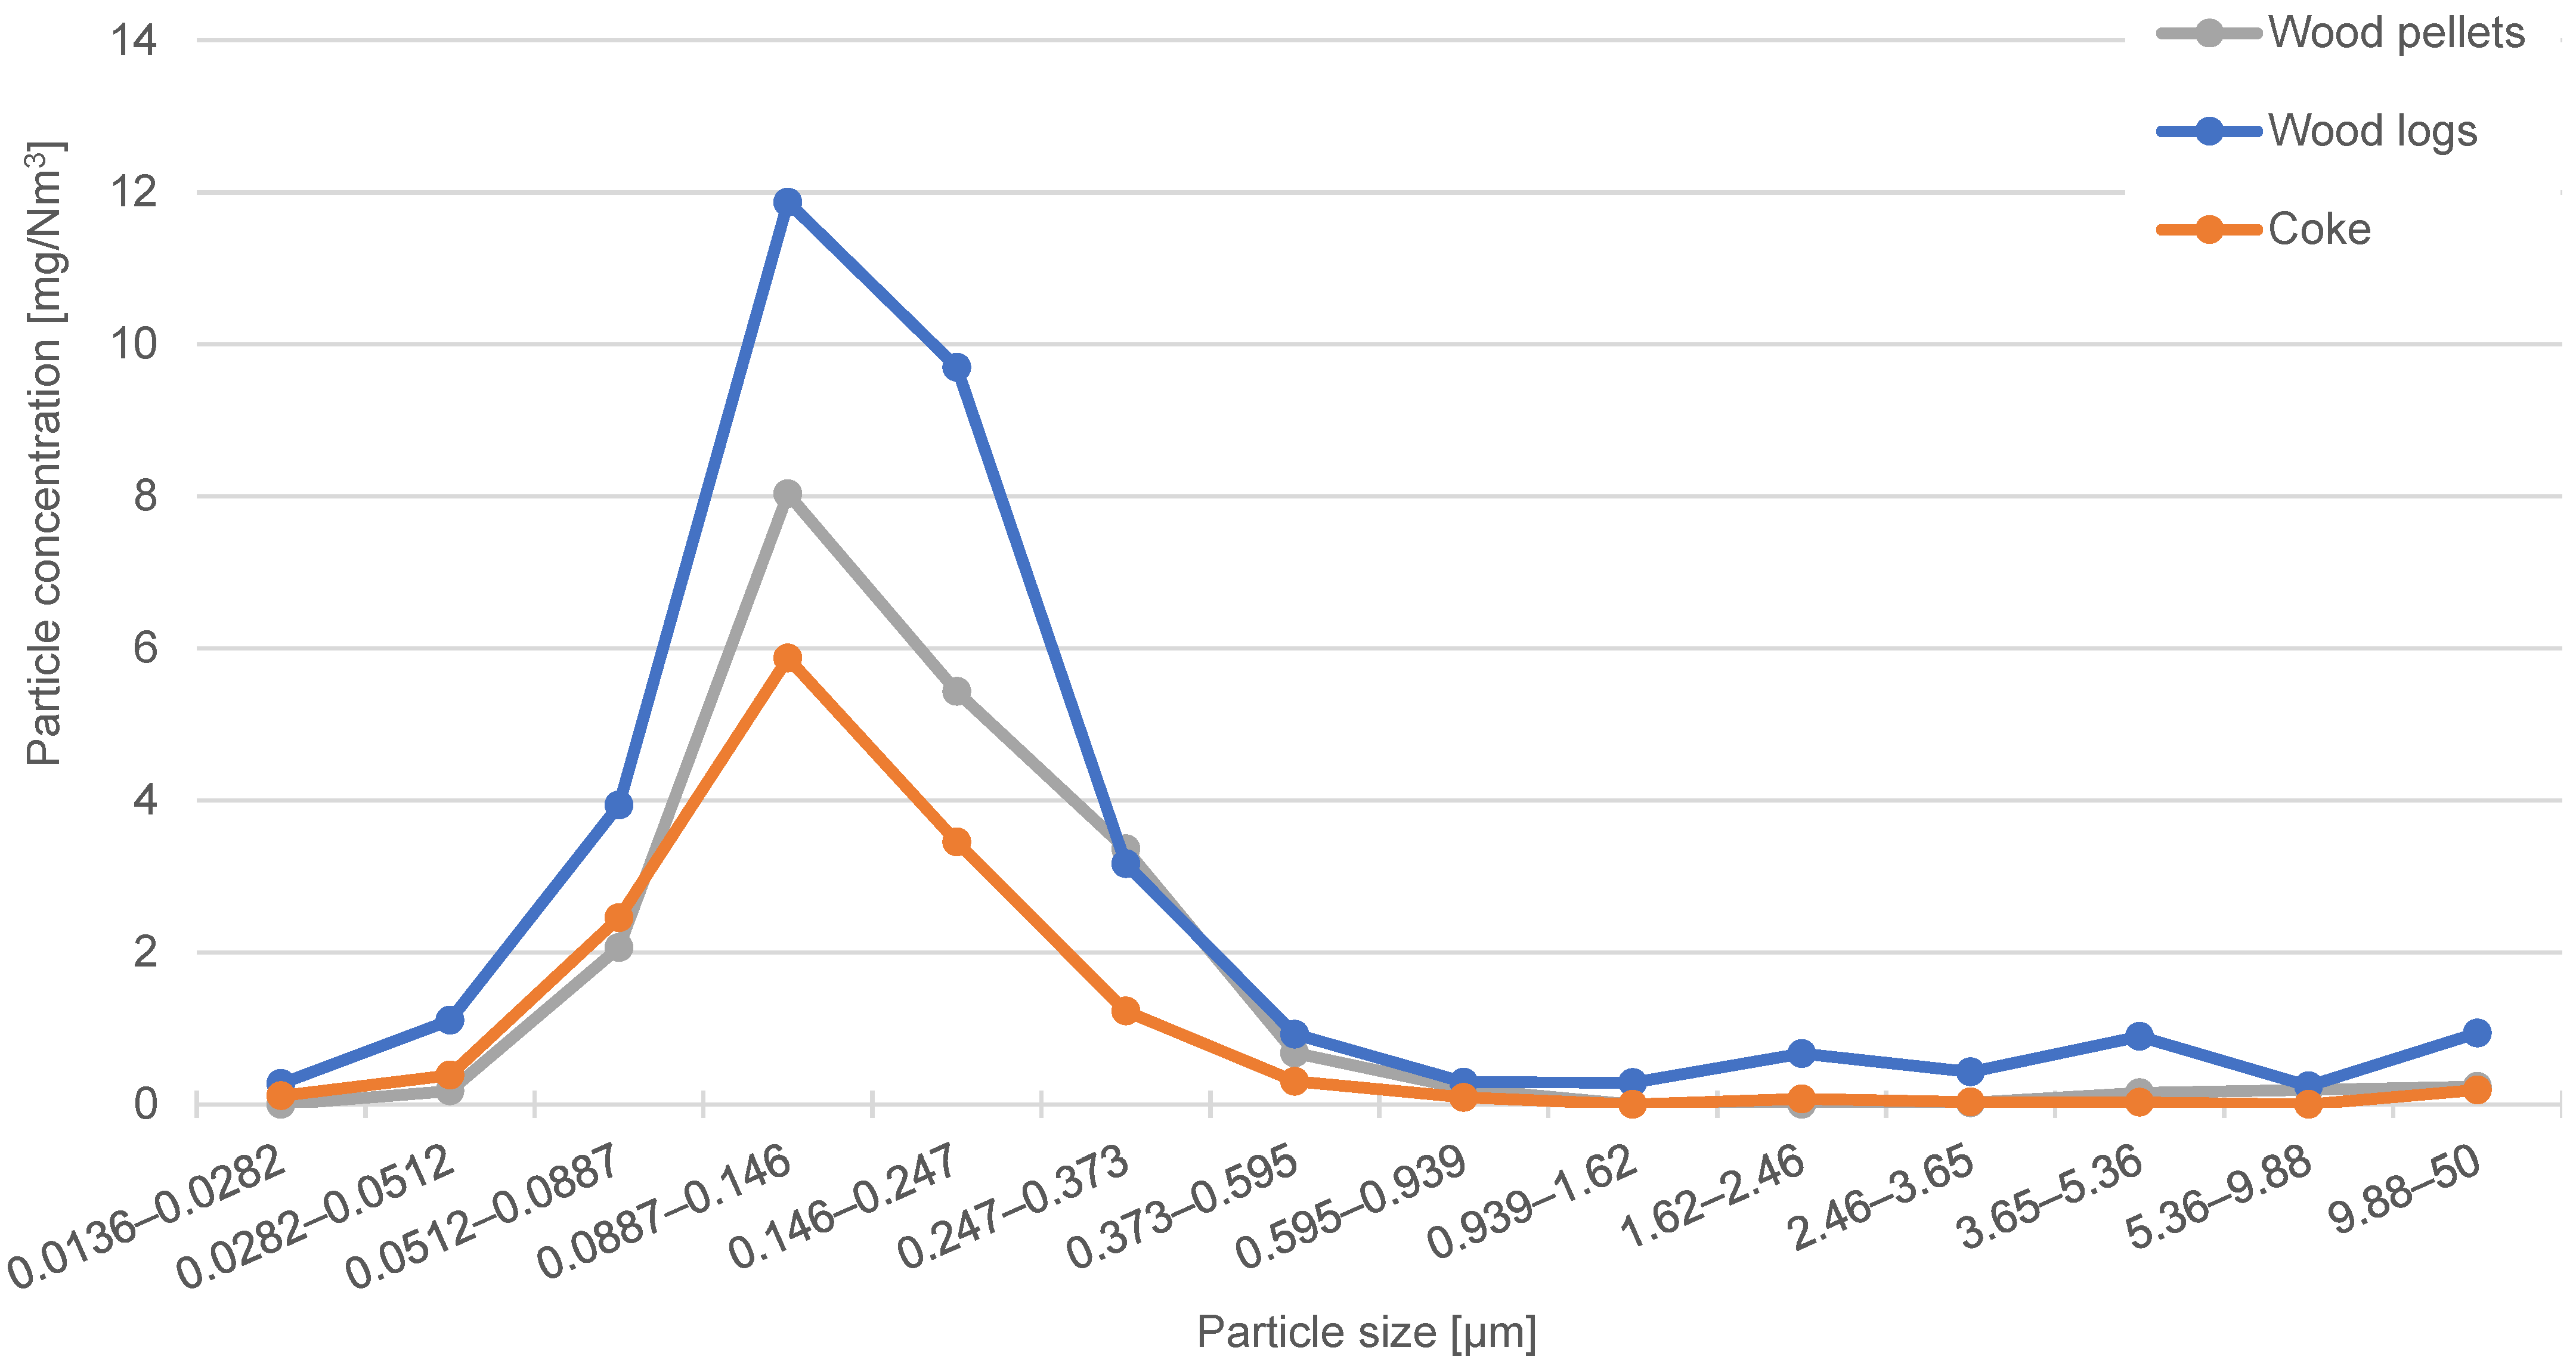
The number of combustion particulates emitted from small combustion sources is influenced by the design of the boiler, the way the boiler is operated (combustion conditions), and the type of fuel burned. The identification of the characteristics of the emitted combustion particles was carried out for the combustion of wood pellets, wood logs, and coke in a residential solid fuel boiler. Particles produced in the steady-state combustion phase were captured on low-pressure cascade impactor filters. By comparing the obtained distribution curves, it was found that the highest mass concentration of particles produced during combustion corresponds to the particle size class of 89–146 nm. Wood log combustion produces the highest particle mass concentration, while coke combustion produces the least. Using an optical digital microscope, the bulk density for particles in the size interval of 51–595 nm was identified. The resulting bulk density is 320–785 kg/m3 for wood logs, 372–1108 kg/m3 for wood pellets, and 435–1330 kg/m3 for coke. The results show that the bulk density of particles from fuels decreases with increasing particle size. The evaluation of particle bulk density using an optical microscope and a cascade impactor is a reliable method, with the only disadvantage being that it is more time consuming. The advantage of optical evaluation is that the same samples can be used for particle cohesion analysis. The cohesion (angle of repose) is dependent on the particle size, and it can be stated that the cohesion of the particles in the deposit decreases with increasing particle size. The smaller the particle size, the more compactly the particles are arranged in the deposit due to the higher contributions of intermolecular forces. There are smaller gaps between the interacting particles, so the captured particles occupy a smaller volume and have a higher bulk density. Bulk density and particle cohesion are key parameters for flue gas filtration and the efficient regeneration of flue gas filters.


