Article

Study on the Influence of Ventilation Speed on Smoke and Temperature Characteristics of Complex Underground Spaces

1
State Key Laboratory of Coal Resources and Safe Mining, China University of Mining and Technology, Xuzhou 221116, China
2
School of Safety Engineering, China University of Mining and Technology, Xuzhou 221116, China
3
Faculty of Geoscience and Environmental Engineering, Southwest Jiaotong University, Chengdu 611756, China
*
Author to whom correspondence should be addressed.
Fire 2023, 6(11), 436; https://doi.org/10.3390/fire6110436
Submission received: 9 October 2023 / Revised: 8 November 2023 / Accepted: 10 November 2023 / Published: 13 November 2023

Abstract

:
This study explores the intricate behaviors of smoke flow, temperature distribution, carbon monoxide (CO) levels, and visibility dynamics within complex underground spaces during fire incidents. A key revelation is the profound impact of ventilation speed, with the identification of a critical range between 2 and 3 m/s that consistently proves to be instrumental in curbing smoke-related hazards and ensuring the safe evacuation of personnel. Furthermore, this paper underscores the influence of accelerated longitudinal winds on temperature profiles, particularly under high HRR conditions, underscoring the importance of accounting for wind effects in comprehensive fire response strategies. Regarding CO concentration, which is a critical safety concern, this study demonstrates that higher ventilation speeds effectively reduce hazardous gas levels, thereby fortifying overall safety measures. The visibility is analyzed, with the findings indicating that elevated ventilation speeds enhance visibility, albeit with considerations about potential drawbacks on personnel evacuation due to excessive wind speed. In conclusion, this paper offers a comprehensive understanding of the pivotal role played by ventilation speed in underground space safety by encompassing smoke control and temperature management.

1. Introduction

A complex underground space system represents a distinctive and prevalent type of tunnel-based transportation. In modern cities, it has gained growing significance due to its convenience and benefits. Nonetheless, the inherent traits of this system, including its intricate, elongated, and subterranean structure, present significant challenges in ensuring fire safety. The outbreak of a fire within a subway system has the potential to escalate into a catastrophic disaster [1,2,3,4].
Remarkably, up to 78.9% of fire-related deaths in these complex underground spaces can be attributed to the inhalation of hot and toxic smoke rather than direct flames [5,6]. In the context of emergency fire rescue operations within these intricate underground spaces, incorrect decisions made by conductors frequently exacerbate the outcomes of exogenous fires. This is often due to a failure to adequately assess the extent of hot and toxic airflow, as well as the dispersion of harmful smoke [7,8,9]. In summary, the recurrent incidents of exogenous fires in these intricate underground environments serve as significant impediments to the sustainable development of the industry.
As for urban underground spaces, Ingason [10] embarked on a series of experiments employing a 1/10 scale model of a train compartment. Throughout these tests, a consistent element was the presence of an open door, while the number of open windows varied. From the outcomes of these experiments, a predictive model emerged, offering a means to estimate the heat release rates in regular train compartment fires. Li et al. [11] expanded the scope by conducting fire tests within three train compartments, each characterized by different scaling ratios. During these experiments, each model compartment featured one door and nine windows on a single side. The findings unveiled a striking similarity in the fire development patterns of fully developed fires, even across tests with varying scaling ratios. Ng et al. [12] explored the flame color dynamics within a 1:15 scaled-down model train. Their study focused on fires within train compartments under restricted ventilation conditions, achieved by adjusting the number of lateral openings. Xi et al. [13,14] conducted a study to examine the influence of a side passage on the transition between fuel-controlled and ventilation-controlled conditions in a corridor-like enclosure fire. Additionally, they investigated the temperature distribution within the enclosure when sustained flame ejection occurred through an opening. This collective body of research offers valuable insights into the complexities of fire behavior and safety considerations within urban underground spaces.
However, for more complex underground structures, like the “U” structure, studies are less focused on. Thus, we can gain insights from mining roadway fires. Vauquelin and Wu [15] made noteworthy observations concerning the relationship between heat release rates ( HRRs ) and critical wind speeds during fires. Their findings indicated that at lower HRRs , the critical wind speed tends to increase with higher HRRs from the fire source, while this correlation diminishes at higher HRRs . With a focus on both smoke flow dynamics and personnel evacuation strategies, Wang et al. [16] used the Fire Dynamic Simulator (FDS) to establish a local ventilation system and control measures for fire smoke by observing the temperature, visibility, and so on. Wu et al. [17] considered five different altitudes from 0 to 4000m in an attempt to reveal the distribution of temperature along the longitudinal centerline of the mine roadway. A correlation to predict the longitudinal distribution of roof temperature in mine fires at different altitudes was proposed.
When it comes to underground fires, a paramount concern is the comprehensive comprehension of thermal hazards and smoke propagation. Addressing these formidable challenges necessitates a holistic approach that takes into account a multitude of factors. These factors encompass the characteristics of the fire smoke flow and the distribution of temperatures within forced ventilation systems within underground environments. Of particular significance are underground fire simulations, which assume pivotal roles in furnishing proactive insights into strategies for personnel evacuation. This, in turn, permits the formulation of safer evacuation routes and the establishment of meticulously coordinated rescue plans. It is essential to underscore the critical importance of conducting a thorough investigation into the unique attributes of fires within underground spaces.
In this specific study, we utilized the FDS simulation software to explore the intricate behavior of smoke flow, temperature distribution patterns, levels of carbon monoxide, and the dynamics of visibility within high-temperature environments found in underground spaces. Our analysis encompasses diverse scenarios, including varying positions and wind speeds within both the inlet and return air passages, as well as at the working faces of the underground environment. Our primary objective is to offer a comprehensive repository of theoretical insights and practical guidance in the context of underground fires.

2. Numerical Simulation
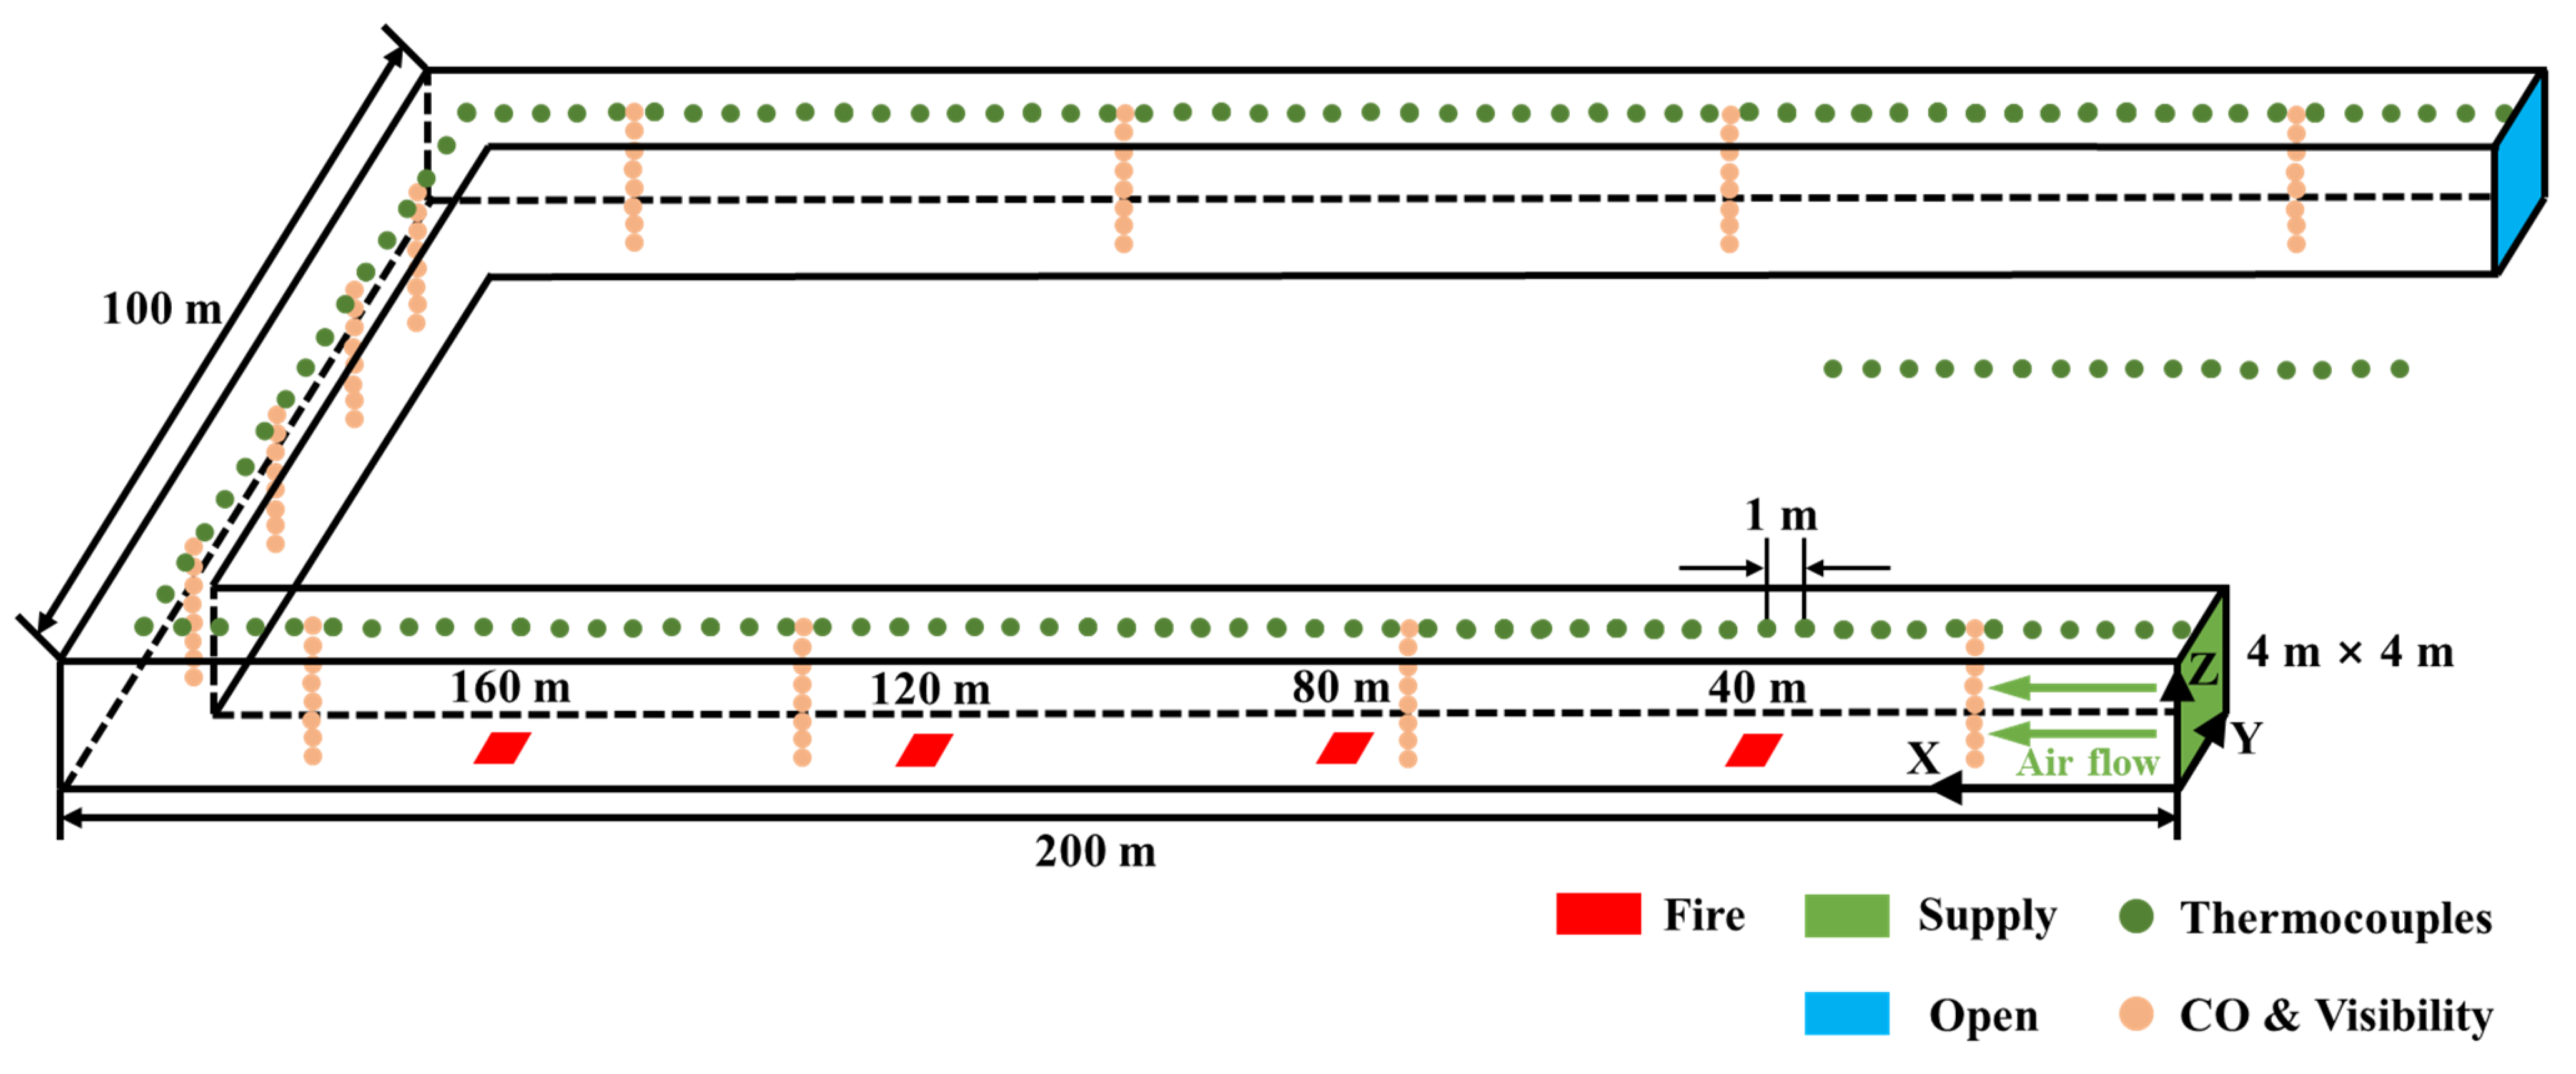
Numerical simulation has gained extensive popularity in fire research due to its ability to efficiently manipulate experimental parameters and yield intricate flow field results beyond the scope of traditional experiments. Among the notable tools in this domain is the Fire Dynamics Simulator (FDS), a computational fluid dynamics (CFD) model used to analyze fire-driven fluid flow. The FDS was developed by the National Institute of Standards and Technology (NIST) and is highly regarded for its practicality.
This CFD software has found widespread application in simulating tunnel fires, a field where its accuracy has been extensively corroborated by prior research efforts. The FDS encompasses two primary numerical methods, namely large eddy simulation (LES) and direct numerical simulation (DNS), with LES being the chosen method for this specific study. The reliability of the FDS has been well established in numerous prior investigations [18,19,20,21,22,23,24,25].
The numerical simulations in this paper were calculated using the FDS (6.7.9) in a high-performance computing cluster.
The governing equation used in the FDS for mass conservation is shown as follows [26]:
ρ t + ρ u = m ˙ b
The momentum conservation equation is
t ( ρ u ) + ρ u u + p = ρ g + f b + τ i j
The energy conservation equation is
ρ h s t + ρ h s u = D p D t + q ˙ q ˙
where ρ is the density; t is the time; u is the velocity vector; m ˙ b is the mass production rate; p is the pressure; g is the gravity vector; f b is the external force vector (excluding gravity); τ i j is the viscous stress tensor; h s is the sensible enthalpy; q ˙ is the heat release rate per unit volume; and q ˙ is the heat flux vector.

2.1. Fire Scenarios

The “U”-shaped underground model, depicted in Figure 1, features inlet and return lanes that are 200 m long, as well as a 100 m middle lane. The cross section of the tunnel is 4 m × 4 m. The inlet and return air ends are configured as “SUPPLY” and “OPEN”, respectively. The forced ventilation speeds V are set at 1, 2, and 3 m/s. The external temperature is maintained at 20 °C, while the air density is 1.29 kg/m3, and the ambient pressure is 1.01325 Pa. The simulation lasts for about 600 s. The data used in the next analysis are based on the stable stage in the last 100 s.
As shown in Table 1, the fire source is positioned along the centerline of the inlet lane, at an interval of 40 m, namely X f = 40, 80, 120, and 160 m. The chosen HRRs for the fire source are 2, 5, and 10 MW. The fuel we used was heptane.
To accurately measure the temperature variations, as illustrated in Figure 1, three sets of thermocouples are strategically placed 0.1 m beneath the ceilings of the inlet air, cut, and return lanes. These thermocouples are positioned at 1 m intervals. Additionally, 12 carbon monoxide and visibility measurement devices are evenly distributed across the three lanes, with a separation of 0.5 m within each group [27,28,29,30].

2.2. Grid Independence Analysis

The selection of the grid size significantly influences the outcomes of the simulation, as highlighted in the FDS User’s Guide [26]; hence, D*/16–D*/4 should be between 4 and 16, where D* can be determined as follows:
D * = Q ˙ ρ C p T g 2 5
This paper selects the grid size as 0.25 m × 0.25 m × 0.25 m, which is brought into Equation (4). Table 2 presents the calculation results of D* and D*/D for different HRRs, indicating that the chosen size in this simulation was appropriate.

3. Results and Interpretation

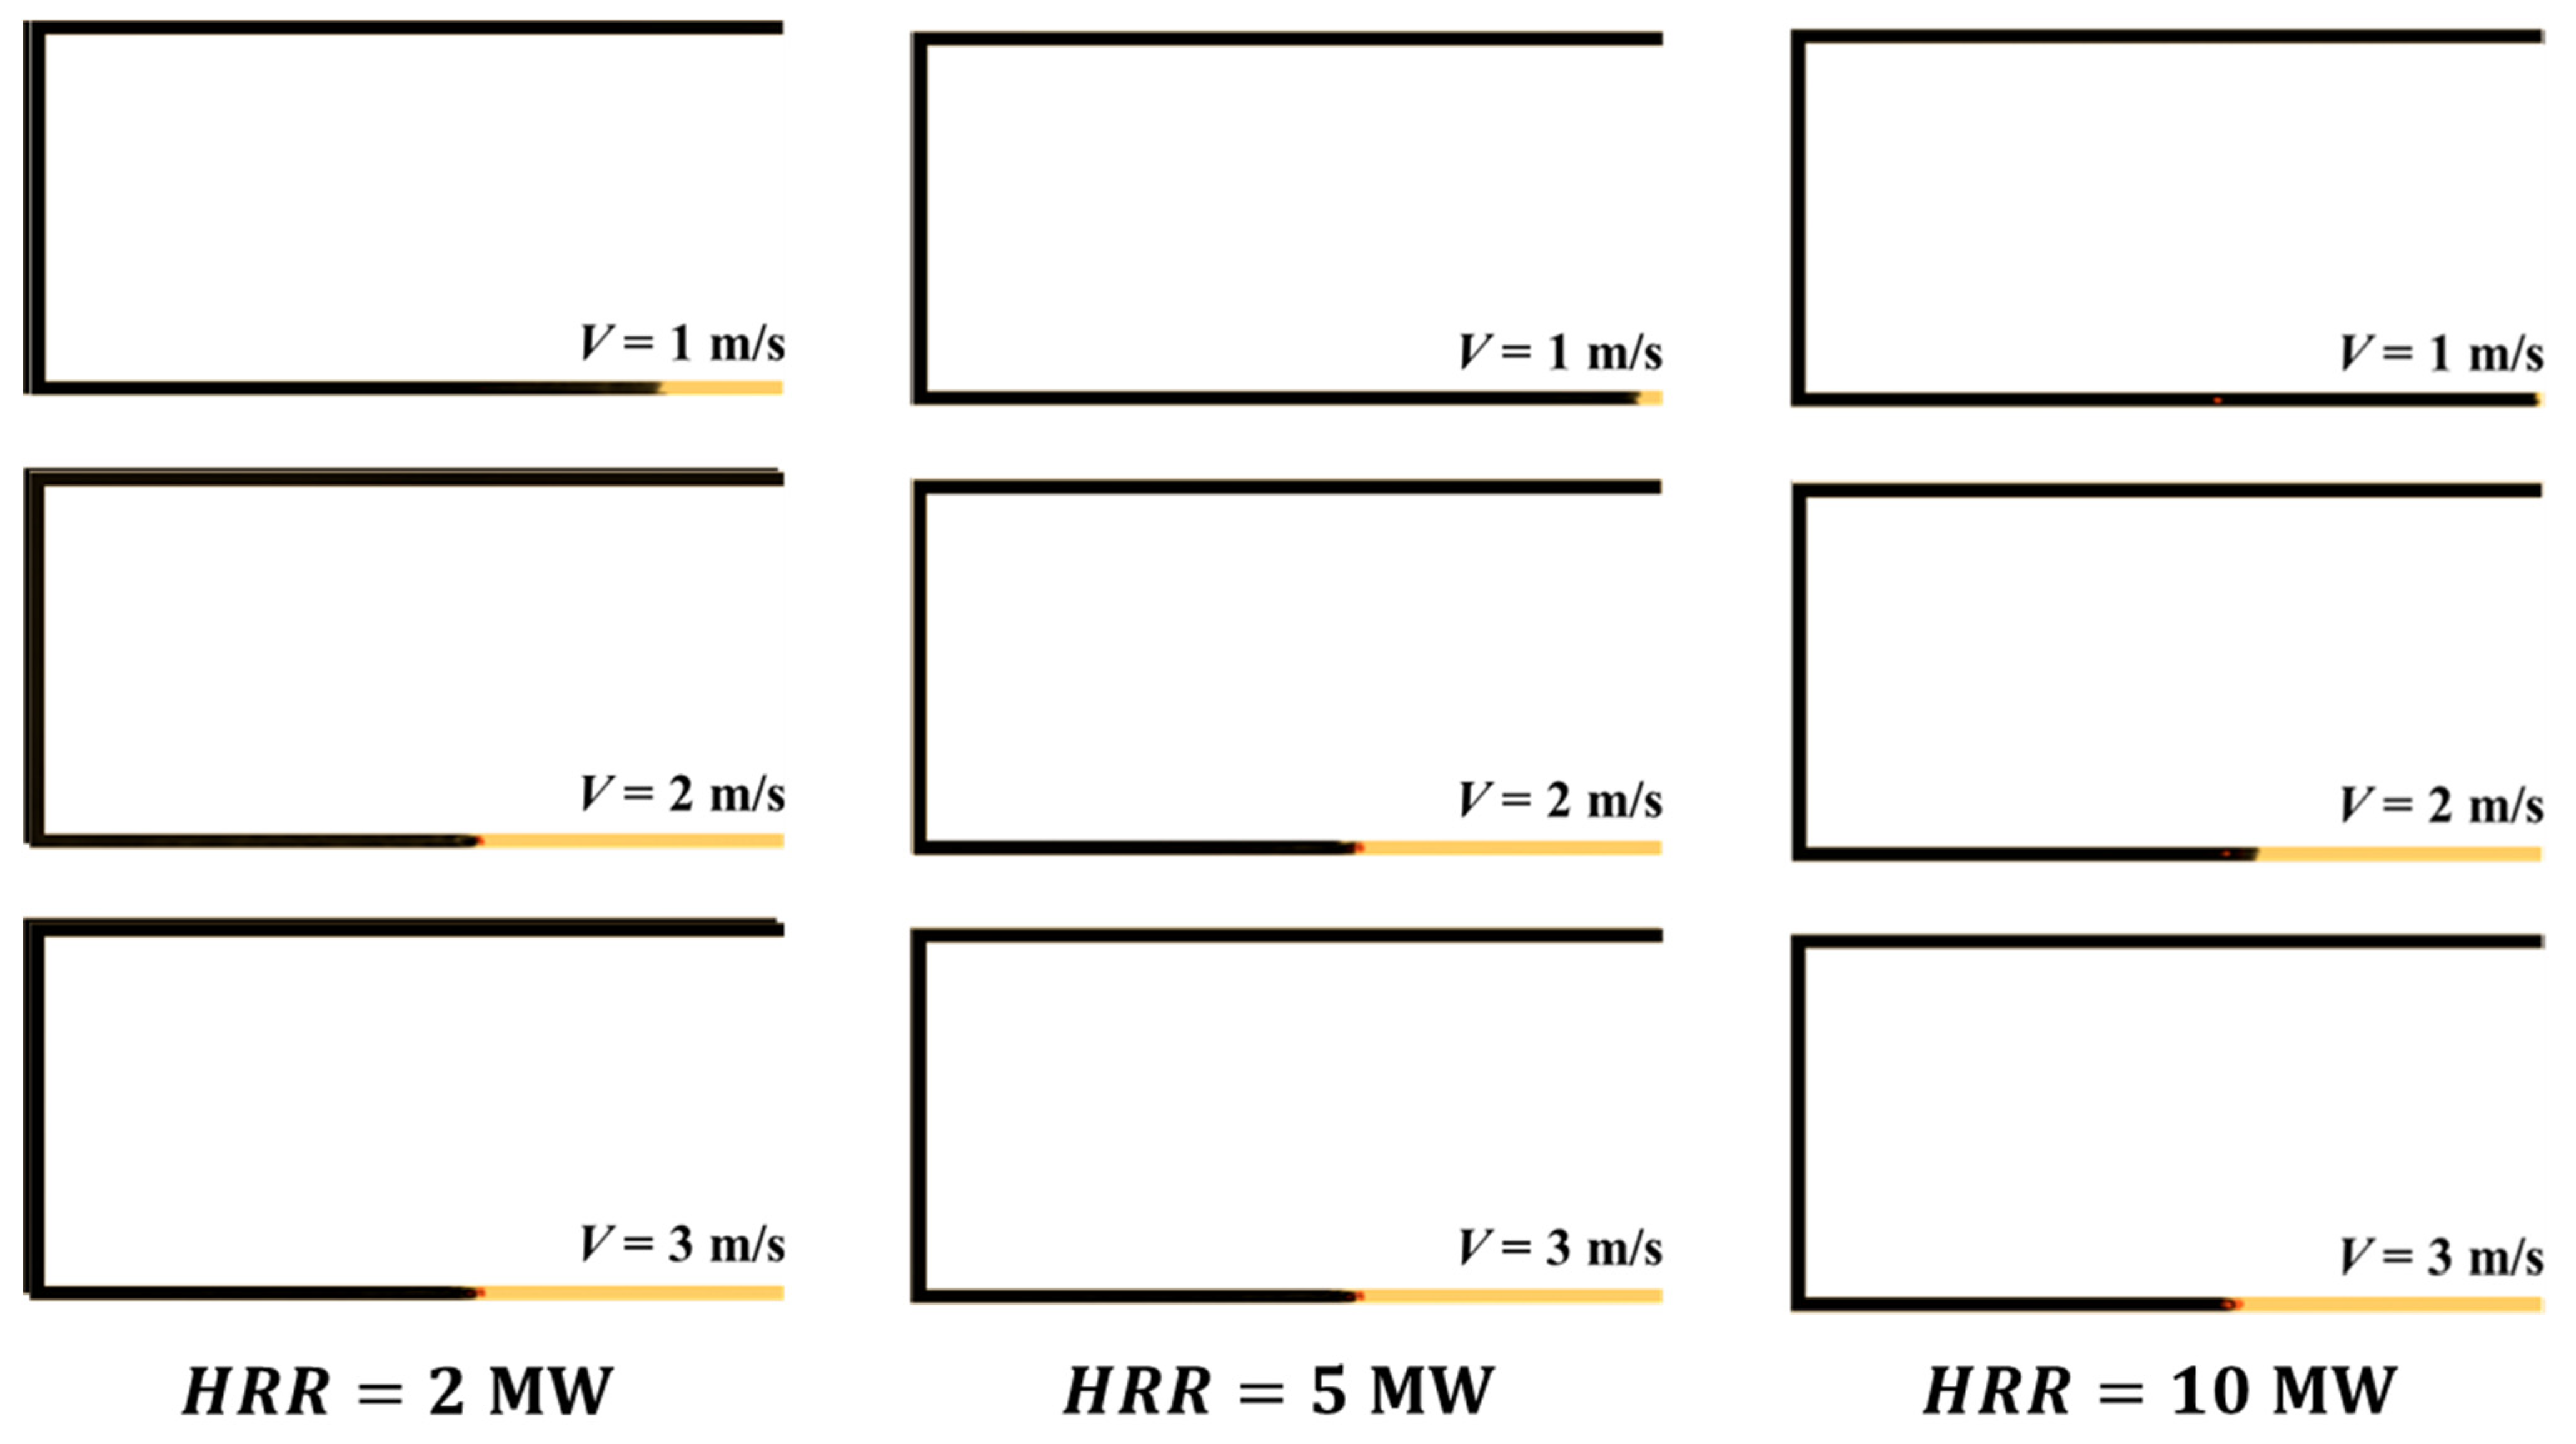
3.1. Smoke Spread Characteristics

In Figure 2, the illustration depicts the length of smoke flow at HRR = 5 MW and ventilation velocities ( V ) ranging from 1 to 3 m/s, considering two different fire locations at X f = 40 m and 120 m. At V = 1 m/s, it is evident that the smoke consistently flows backward, leading to the accumulation of toxic and hot gases in the upstream section. This exacerbates air quality issues and poses a significant obstacle to personnel evacuation. Under the conditions of X f = 120 m and V = 1 m/s, forced ventilation appears to partially mitigate the backflow of smoke. However, it cannot completely prevent this phenomenon at this ventilation speed. When the ventilation speed is increased to the range of 1 to 2 m/s, the backlayering of smoke diminishes. This indicates that the upstream air becomes cleaner, providing a viable escape route for people in this direction.
It is noteworthy that the critical ventilation speed, where the backflow is effectively mitigated, falls within the range of 2 to 3 m/s. This observation holds true regardless of the specific fire location, suggesting that this range of ventilation speeds is crucial for effective smoke control and personnel safety. These findings underscore the importance of maintaining adequate ventilation rates to ensure a safe escape path and enhance the overall air quality during fire emergencies in underground spaces.
Foremost, it is evident that the fire’s location has a negligible impact on the smoke flow. Thus, the primary focus of this section is the relationship between the Heat Release Rate (HRR) and ventilation speed ( V ). Using X f = 80 m as an illustrative example, as shown in Figure 3, a clear trend emerges where the backlayering increases as the HRR rises, and it is particularly noticeable at V = 1 m/s. This phenomenon can be explained by the heightened horizontal inertial forces resulting from increased smoke production during combustion.
An intriguing observation is that, at a ventilation speed of V = 2 m/s, the smoke predominantly advances forward, regardless of the specific HRR. This suggests that this ventilation speed effectively mitigates smoke backflow issues. It implies that such a ventilation rate could efficiently address smoke backflow incidents originating from fires initiated by belts in the inlet lane, ensuring the safe rescue of personnel from the upstream direction. This finding holds significant implications for devising effective ventilation strategies in underground environments during fire emergencies.

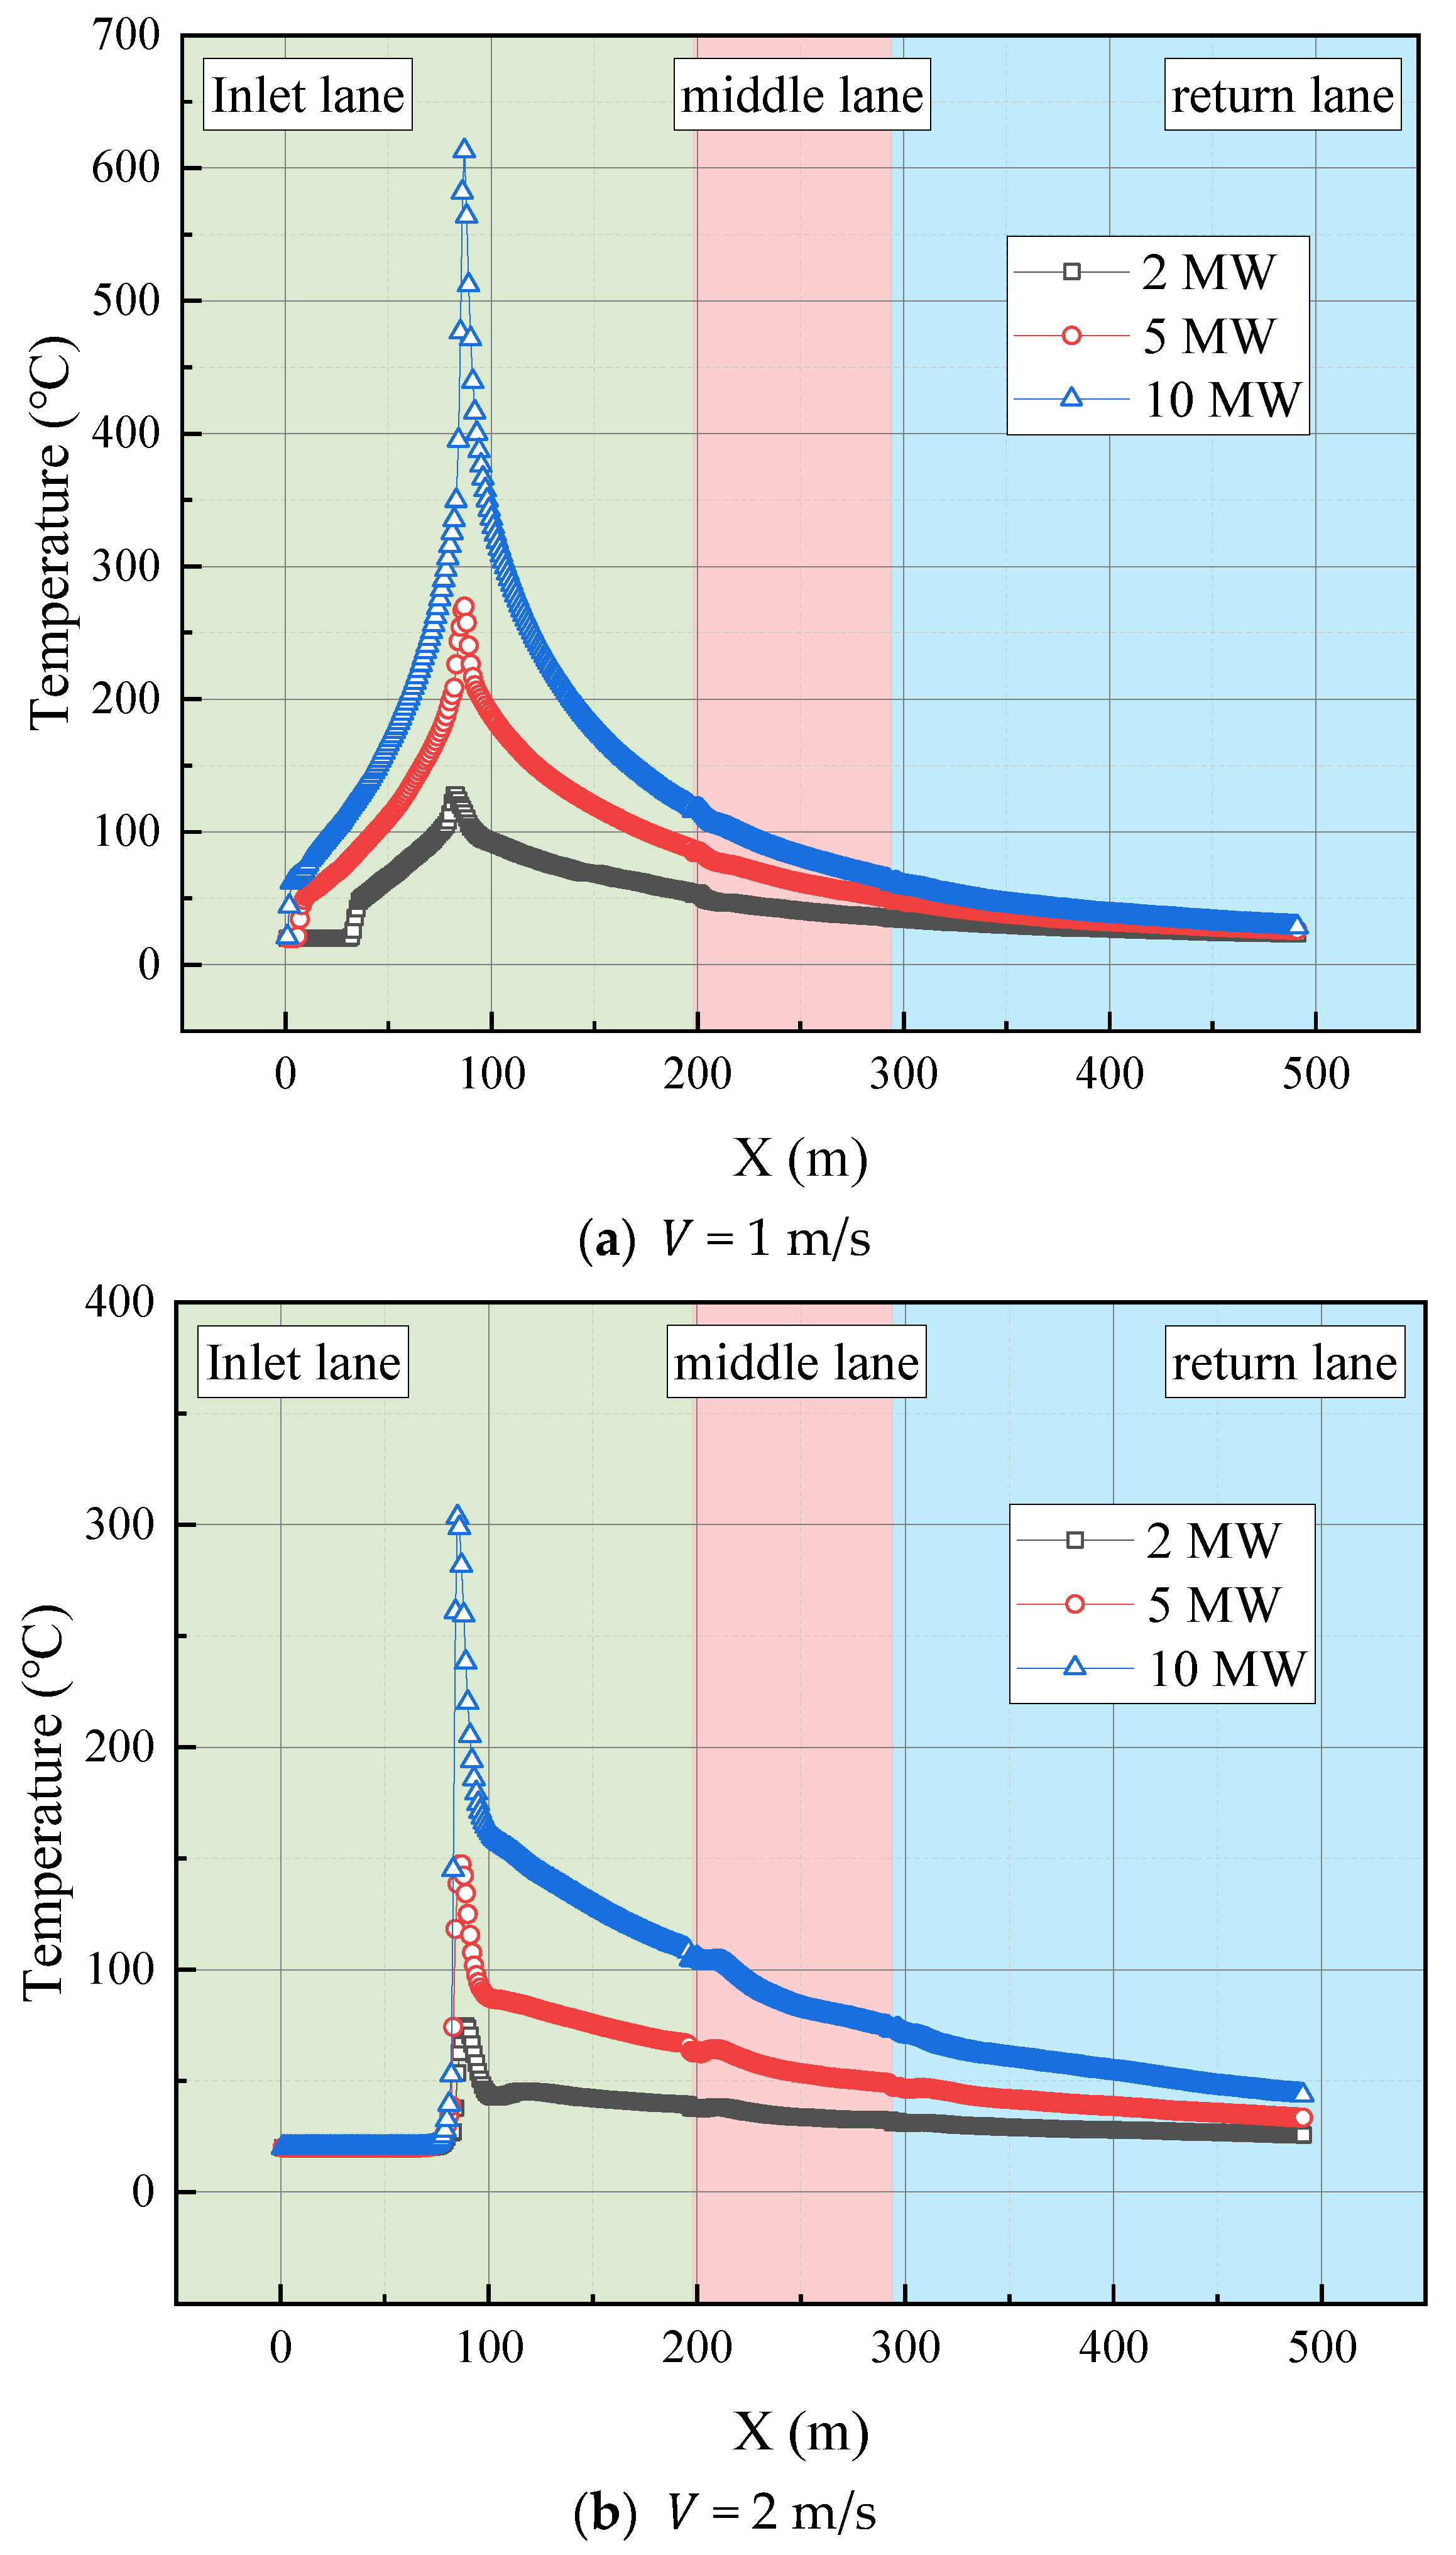
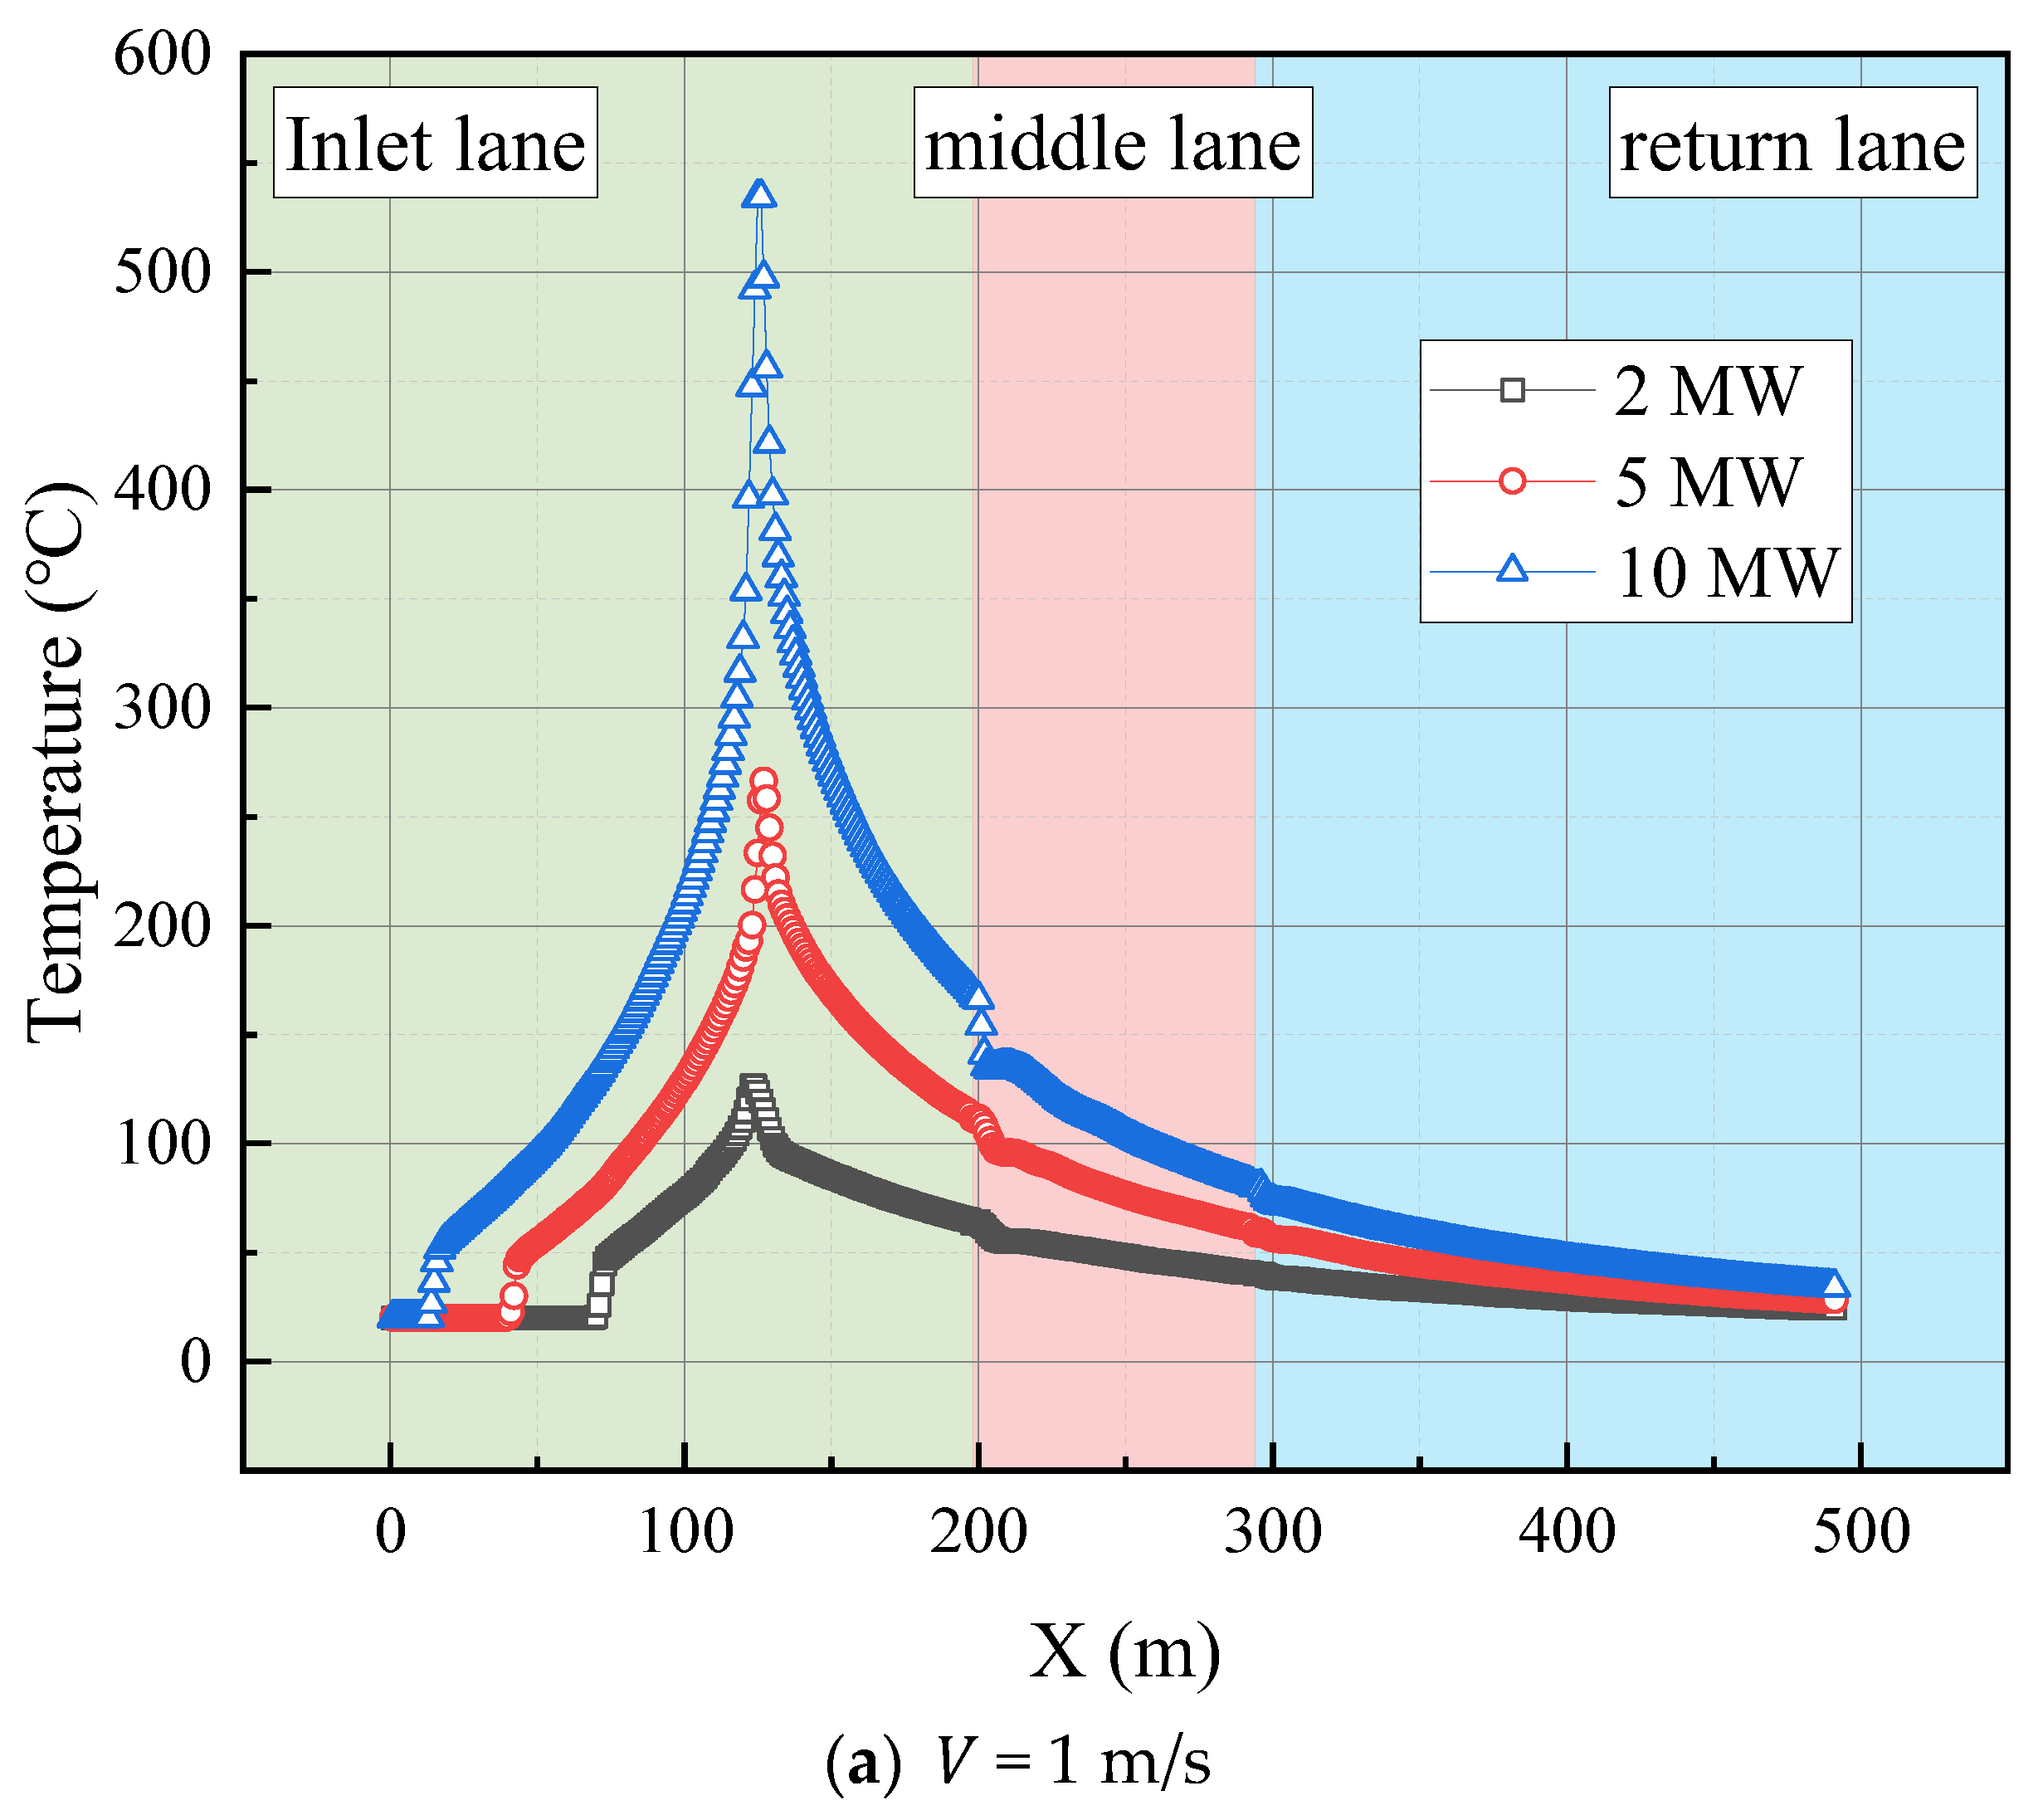
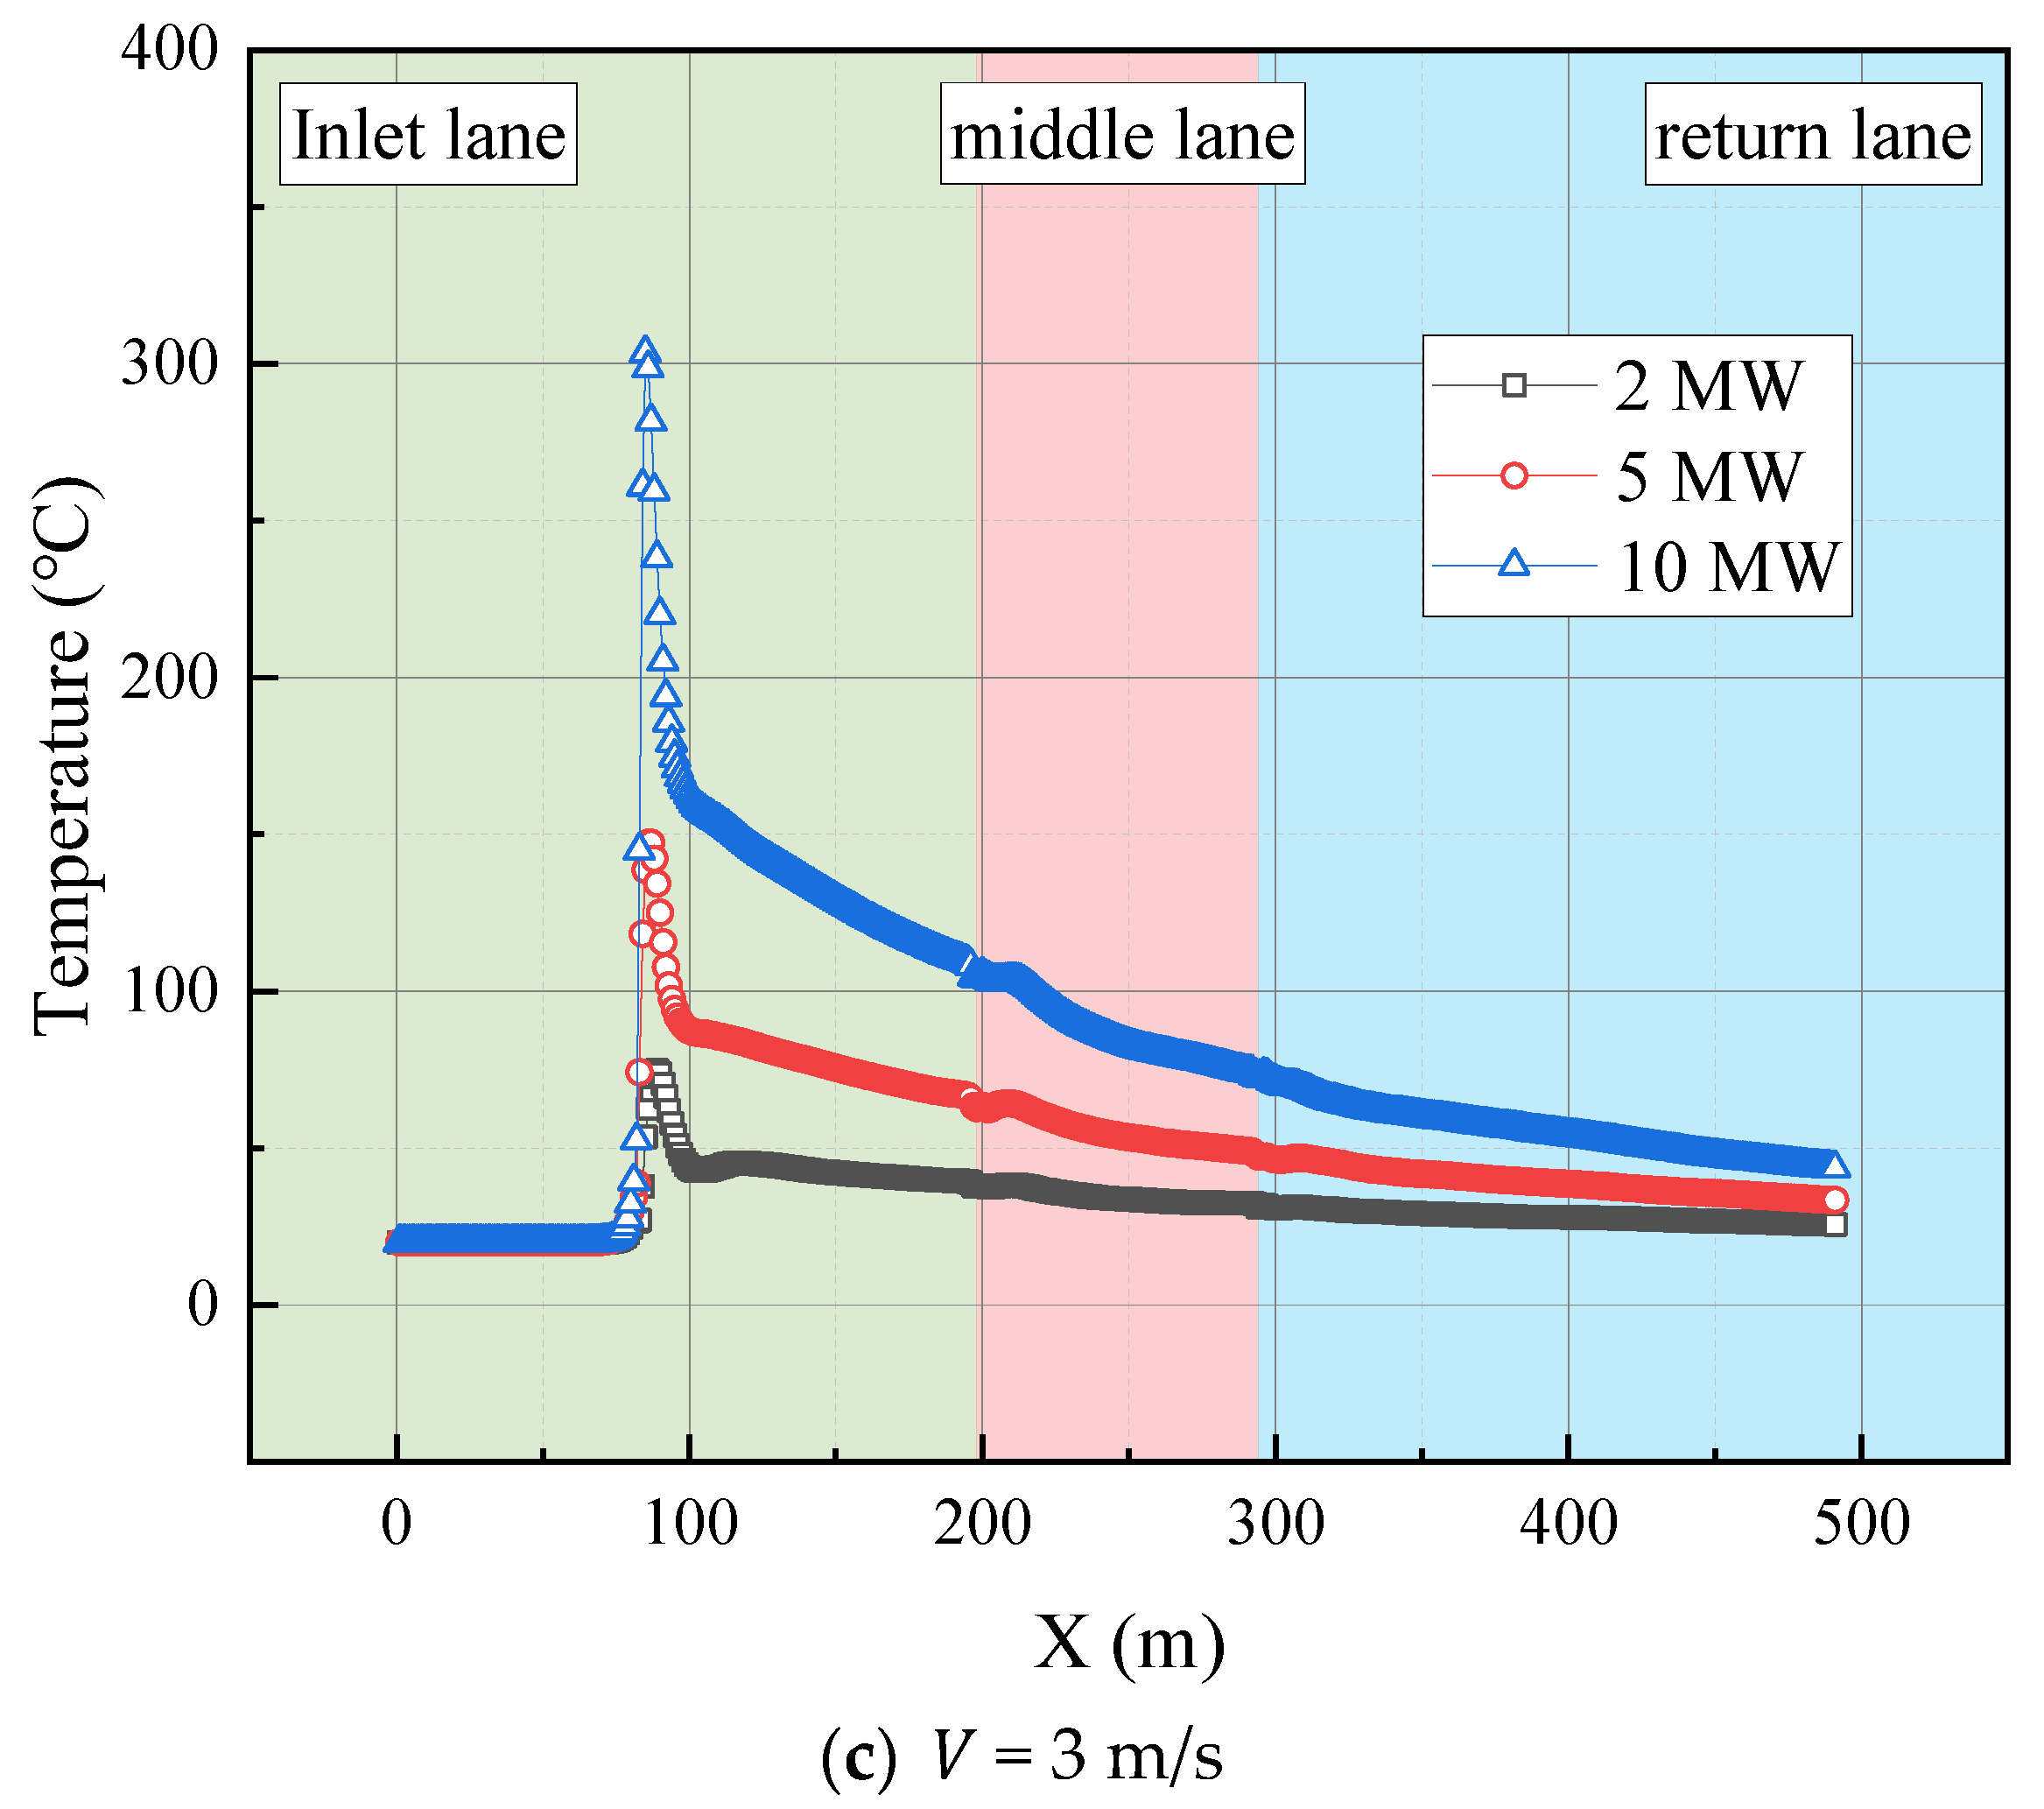
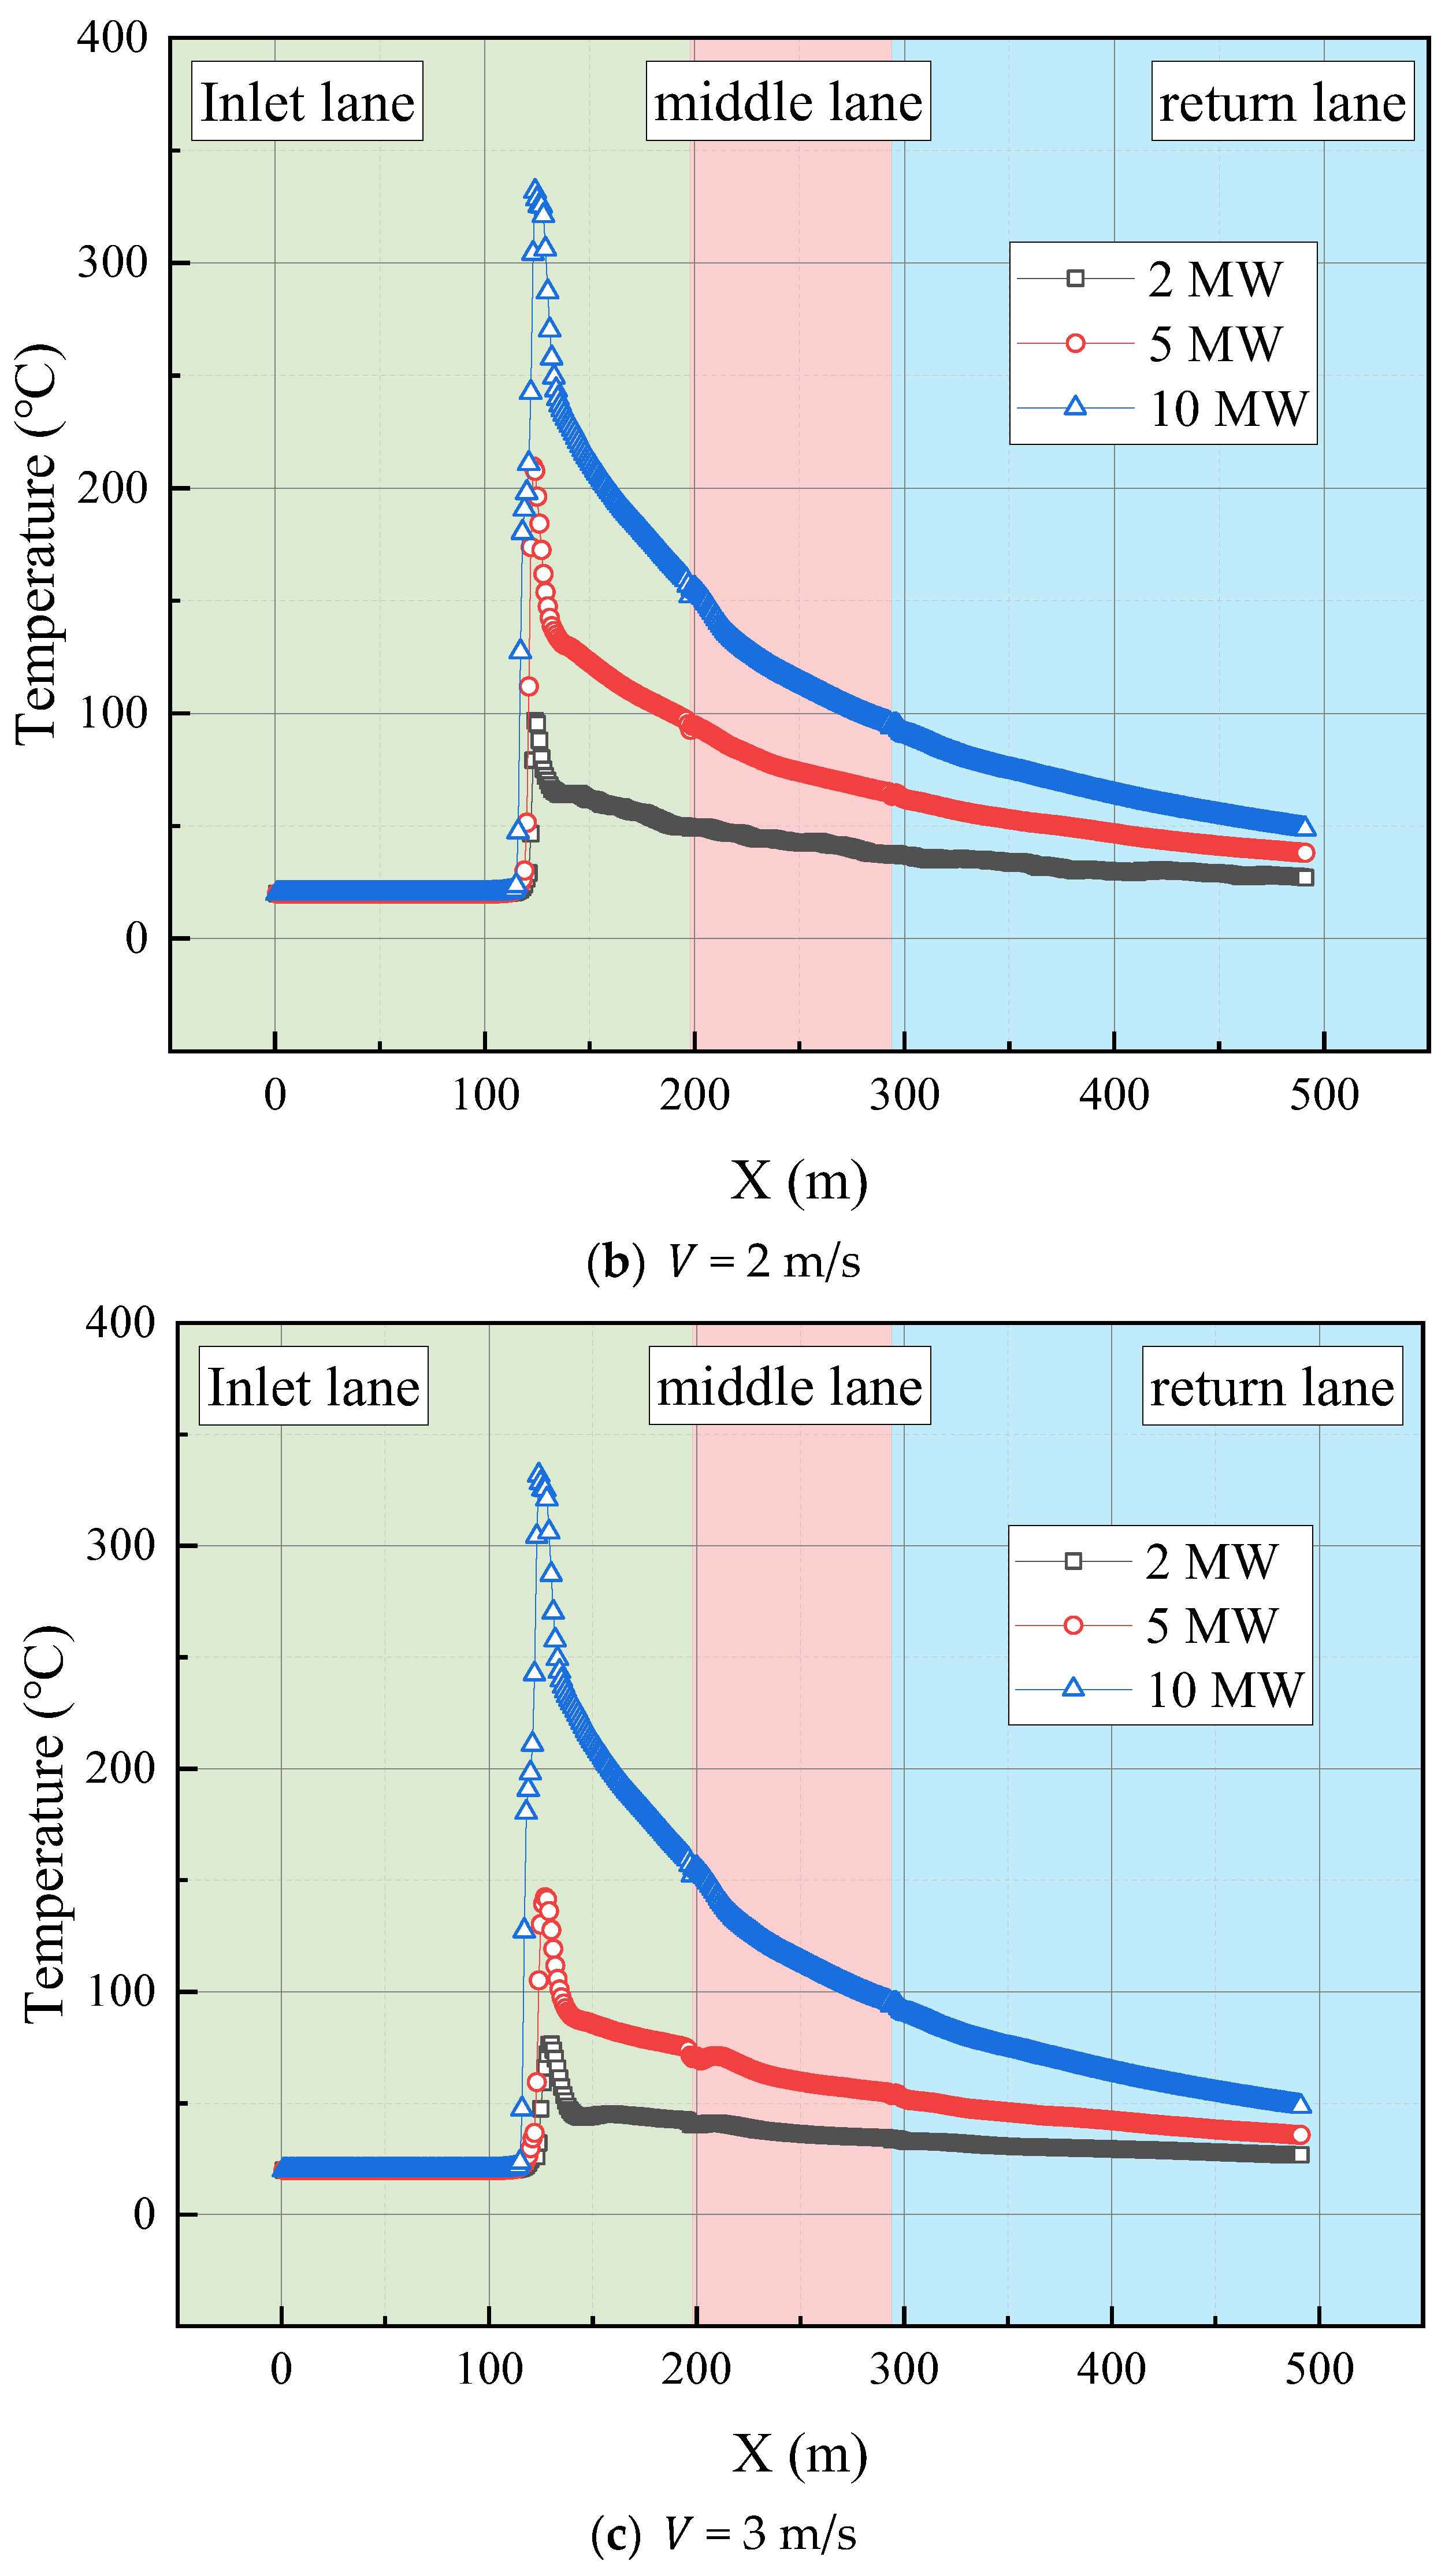
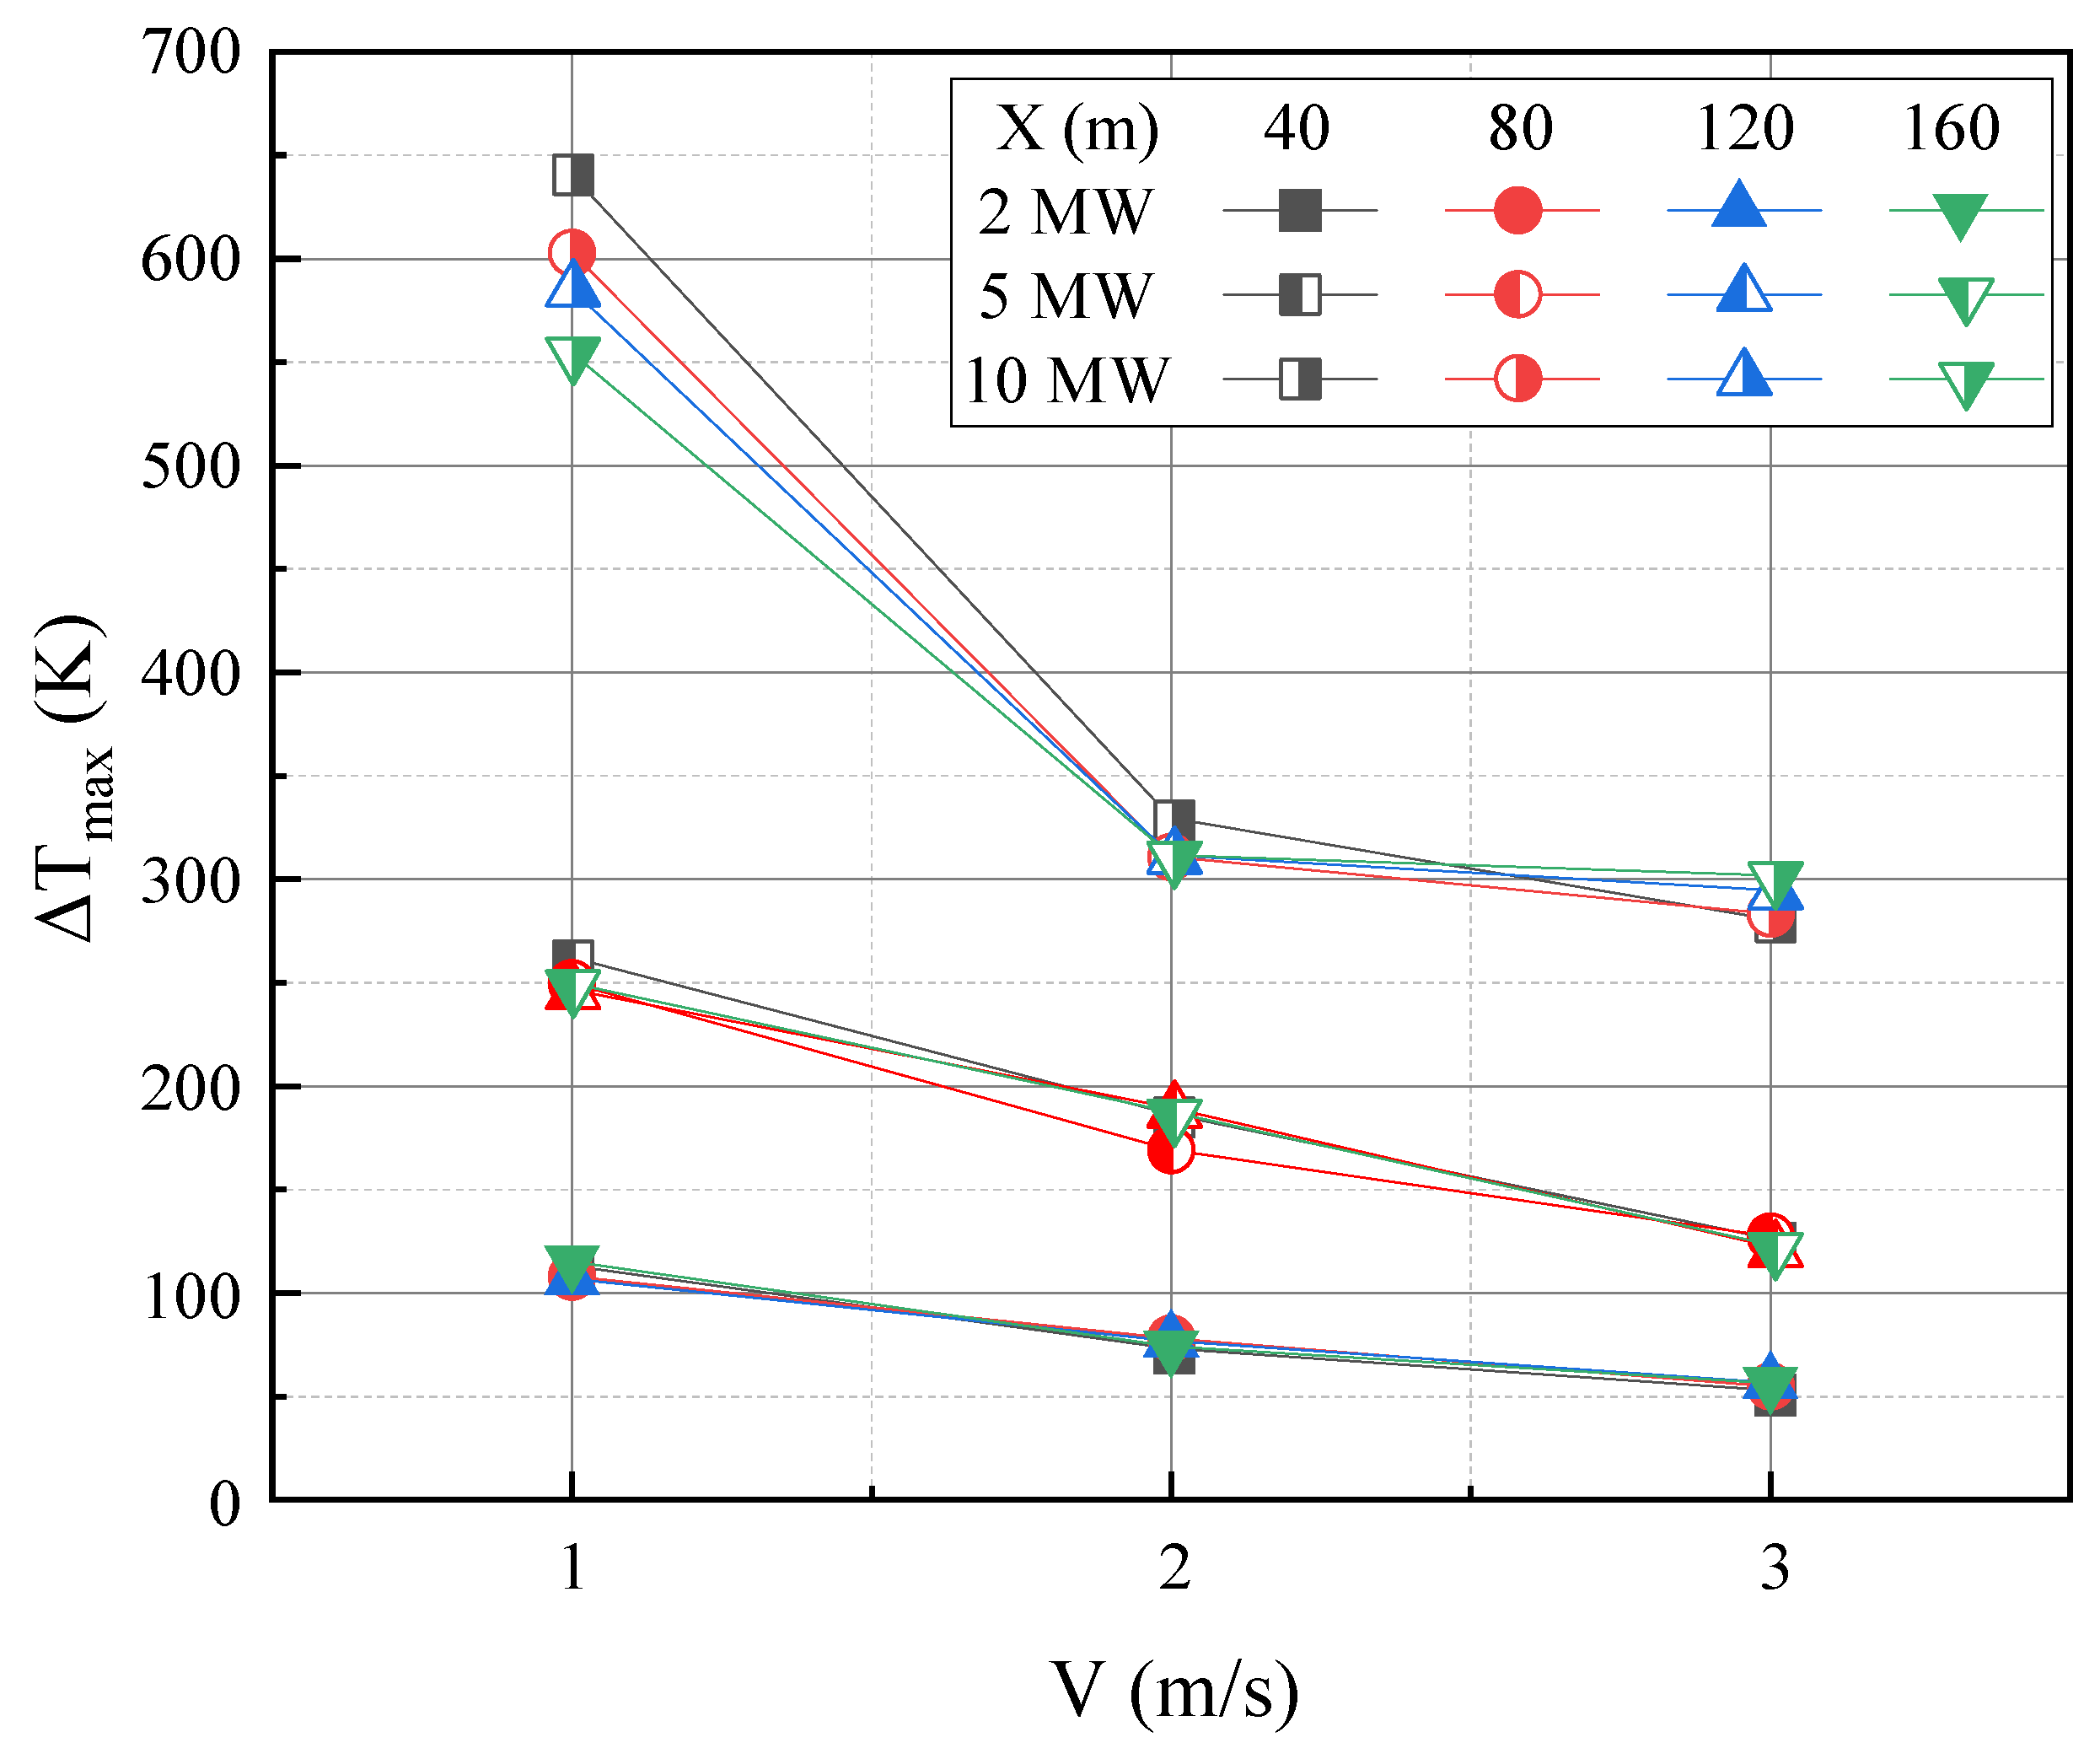
3.2. Temperature Distribution

As discussed in the previous section, the combustion of fire within the inlet lane produces a substantial amount of hot smoke that travels downstream, posing a significant thermal hazard to personnel in the middle lane or return lane. Therefore, it is essential to thoroughly investigate the temperature distribution in underground structures, considering factors such as the Heat Release Rate (HRR), ventilation speed, and fire location.
Figure 4 and Figure 5 provide insights into the temperature distributions concerning X f = 40 m and 160 m. It becomes evident that the highest temperature points are directly above the fire source. As highlighted earlier, the extent of smoke backlayering diminishes as the ventilation speed ( V ) increases. When V = 1 m/s, the maximum temperature reaches approximately 600 °C. However, with higher ventilation rates, the maximum temperature progressively decreases.
This phenomenon can be attributed to the tilting angles of the fire plume, influenced by the increasing longitudinal inertia force. Consequently, the flame propagation length extends, and the hottest point shifts downstream [11]. Understanding these dynamics is crucial for devising effective fire safety strategies within underground environments.
The downstream temperature distribution significantly influences the safety of personnel within the tunnel, making it imperative to focus on this aspect. Upon a closer examination of the downstream temperature trends, it becomes evident that the temperatures within the inlet lane, middle lane, and return lane predominantly follow an exponential decay pattern. Despite distinct corners at the junctions between these zones, they exert a minimal influence on the overall temperature trends.
A comparison between the conditions of X f = 40 m and X f = 160 m reveals that the temperatures in the middle lane are generally higher for the latter scenario. Specifically, when the HRR reaches 10 MW, the average temperatures exceed 100 °C, posing a significant risk of skin and respiratory tract burns for pedestrians in the middle lane. Consequently, ensuring personnel safety requires proactive measures to prevent large-scale fires from occurring in close proximity to the middle lane.
In contrast, temperatures within the return lane, across all scenarios, do not exceed 100 °C, providing a safer environment for pedestrians in that area.
In our subsequent analysis, we chose to utilize the maximum excess temperature as our quantitative parameter. As illustrated in Figure 6, it is evident that the maximum excess temperature decreases as the ventilation speed increases. This indicates that the ventilation speed ( V ) exerts a more significant influence on the maximum temperature, aligning with the conclusions discussed earlier [11,31,32,33], which emphasized the importance of accelerated longitudinal winds.
It is noteworthy that the maximum temperature rise shows relatively minor variations with different fire locations. This contrasts sharply with the smoke temperature distribution discussed previously. Therefore, in the context of underground fire conditions, the influence of the fire location on the maximum temperature is considered negligible.
On the other hand, when considering the Heat Release Rate (HRR), it is crucial to highlight that the maximum excess temperature reaches up to 650 K. With intensifying wind speeds, particularly under the condition of HRR = 10 MW, the temperature gradually decreases to approximately 300 K. This decrease is notably more significant when compared to scenarios involving 2 MW or 5 MW. Hence, we can preliminarily conclude that the impact of the wind speed on the maximum temperature rise, especially under high HRR conditions, is clearly evident.
Based on the analysis of the plume entrainment physics, Li et al. [11,34] derived a model, as shown in Equation (5).
Δ T m a x = Q ˙ u r 1 / 3 H d 5 / 3 V > 0.19 17.5 Q ˙ 2 / 3 H d 5 / 3 V 0.19
V = V V *
V * = Q ˙ c g r ρ a c p T a 1 / 3
where V is the longitudinal ventilation speed (m/s), r is the radius of the fire (m), H d is the effective tunnel height (m), Q ˙ c is the convective heat release rate (kW), g is the gravity acceleration (m/s2), ρ a is the ambient density (kg/ m3), and c p is the thermal capacity of air (kJ/(kg·K)).
By combining Equation (8) and our test results, we established a prediction formula to correlate the maximum excess temperature with the ventilation speed as follows:
Δ T m a x = 0.088 Q ˙ V r 1 / 3 H d 5 / 3 V > 0.19 7.78 Q ˙ 2 / 3 H d 5 / 3 V 0.19
The comparison between the maximum excess temperature derived from our simulation results and the predictions generated by Equation (8) is depicted in Figure 7. Overall, the agreement between the two is considered to be generally acceptable.

3.3. CO Density and Visibility

Due to the continuous downstream flow of smoke, hazardous gases accumulate in the middle and return lanes. The concentration of carbon monoxide (CO) in these areas can exceed safe levels, posing a significant threat to trapped personnel who may lose consciousness before being able to escape. Additionally, the presence of soot particles transported by the smoke flow significantly reduces visibility in the working area, hindering the safe evacuation of underground workers.
Under the most adverse conditions, as illustrated in Figure 8 (HRR = 10 MW, X f = 40 m), it is evident that the CO mass fraction generally decreases with the increasing ventilation speed. Particularly noteworthy is the uniformity of CO densities across all lanes, especially at V = 2 m/s and 3 m/s. It is essential to observe that within each lane, the CO density in the first half of the lane exceeds that in the second half. For example, in the middle lane, the CO mass fraction decreases to approximately 0.0003 at X = 280 m, contrasting with the value of 0.0006 at X = 220 m. Consequently, it can be inferred that the CO density decreases with higher ventilation rates, and in cases of relatively low ventilation speeds, such as 1 m/s, the CO concentrations rapidly diminish toward the end of the roadway. These observations highlight the critical role of the ventilation speed in mitigating hazardous CO levels and emphasize the importance of optimizing ventilation strategies to enhance the safety of underground personnel during fire events.
Regarding visibility, Figure 9 illustrates conditions when HRR = 10 MW and X f = 40 m. In the inlet lane, it is evident that as the backlayering length decreases, the visibility remains relatively unaffected by smoke when V = 3 m/s. However, in all other scenarios, the visibility is significantly compromised, consistently dropping below 1 m due to smoke obscuration.
In both the middle and return lanes, the visibility consistently falls below 1 m across all ventilation velocities ranging from 1 to 3 m/s. Interestingly, the return lane experiences a slight reduction in visibility compared to the middle lane. Figure 9c demonstrates that with slower ventilation, such as V = 1 m/s, smoke stagnates at the end of the channel ( X = 475 m). Conversely, the smoke is more dispersed at the end of the opening, resulting in better visibility at lower heights. Moreover, except for the specific case of V = 1 m/s at X = 475 m, the visibility remains relatively stable at different heights without significant variations.
Therefore, it can be concluded that as the ventilation speed increases, the visibility gradually improves, reaching approximately 0.7 m when V = 3 m/s. However, it is crucial to consider that an excessive wind speed could hinder the movement of personnel during their escape. Consequently, this factor should be taken into account when determining the optimal ventilation speed, ensuring a delicate balance between improved visibility and personnel mobility in emergency situations.

4. Conclusions

Through a meticulous analysis and thorough investigation, this paper delved into the intricate dynamics of underground fires, illuminating the crucial factors that influence safety and emergency response strategies within complex underground spaces. The key findings of this study are summarized as follows:
  • This study pinpointed the critical role of ventilation speed in mitigating the risks associated with smoke backflow and temperature control. The identification of a specific ventilation speed range, from 2 to 3 m/s, represents a significant contribution to fire safety. This range ensures efficient smoke management and facilitates personnel evacuation in scenarios ranging from 2 MW to 10 MW.
  • The research emphasized the impacts of accelerated longitudinal winds on temperature profiles, especially in high Heat Release Rate (HRR) scenarios. Understanding wind effects is crucial to devise effective fire response strategies. Notably, in cases where X f = 160 m, temperatures in the middle lane were consistently higher. For instance, when the HRR reached 10 MW, the average temperatures exceeded 100 °C, posing a significant threat to pedestrians in the middle lane.
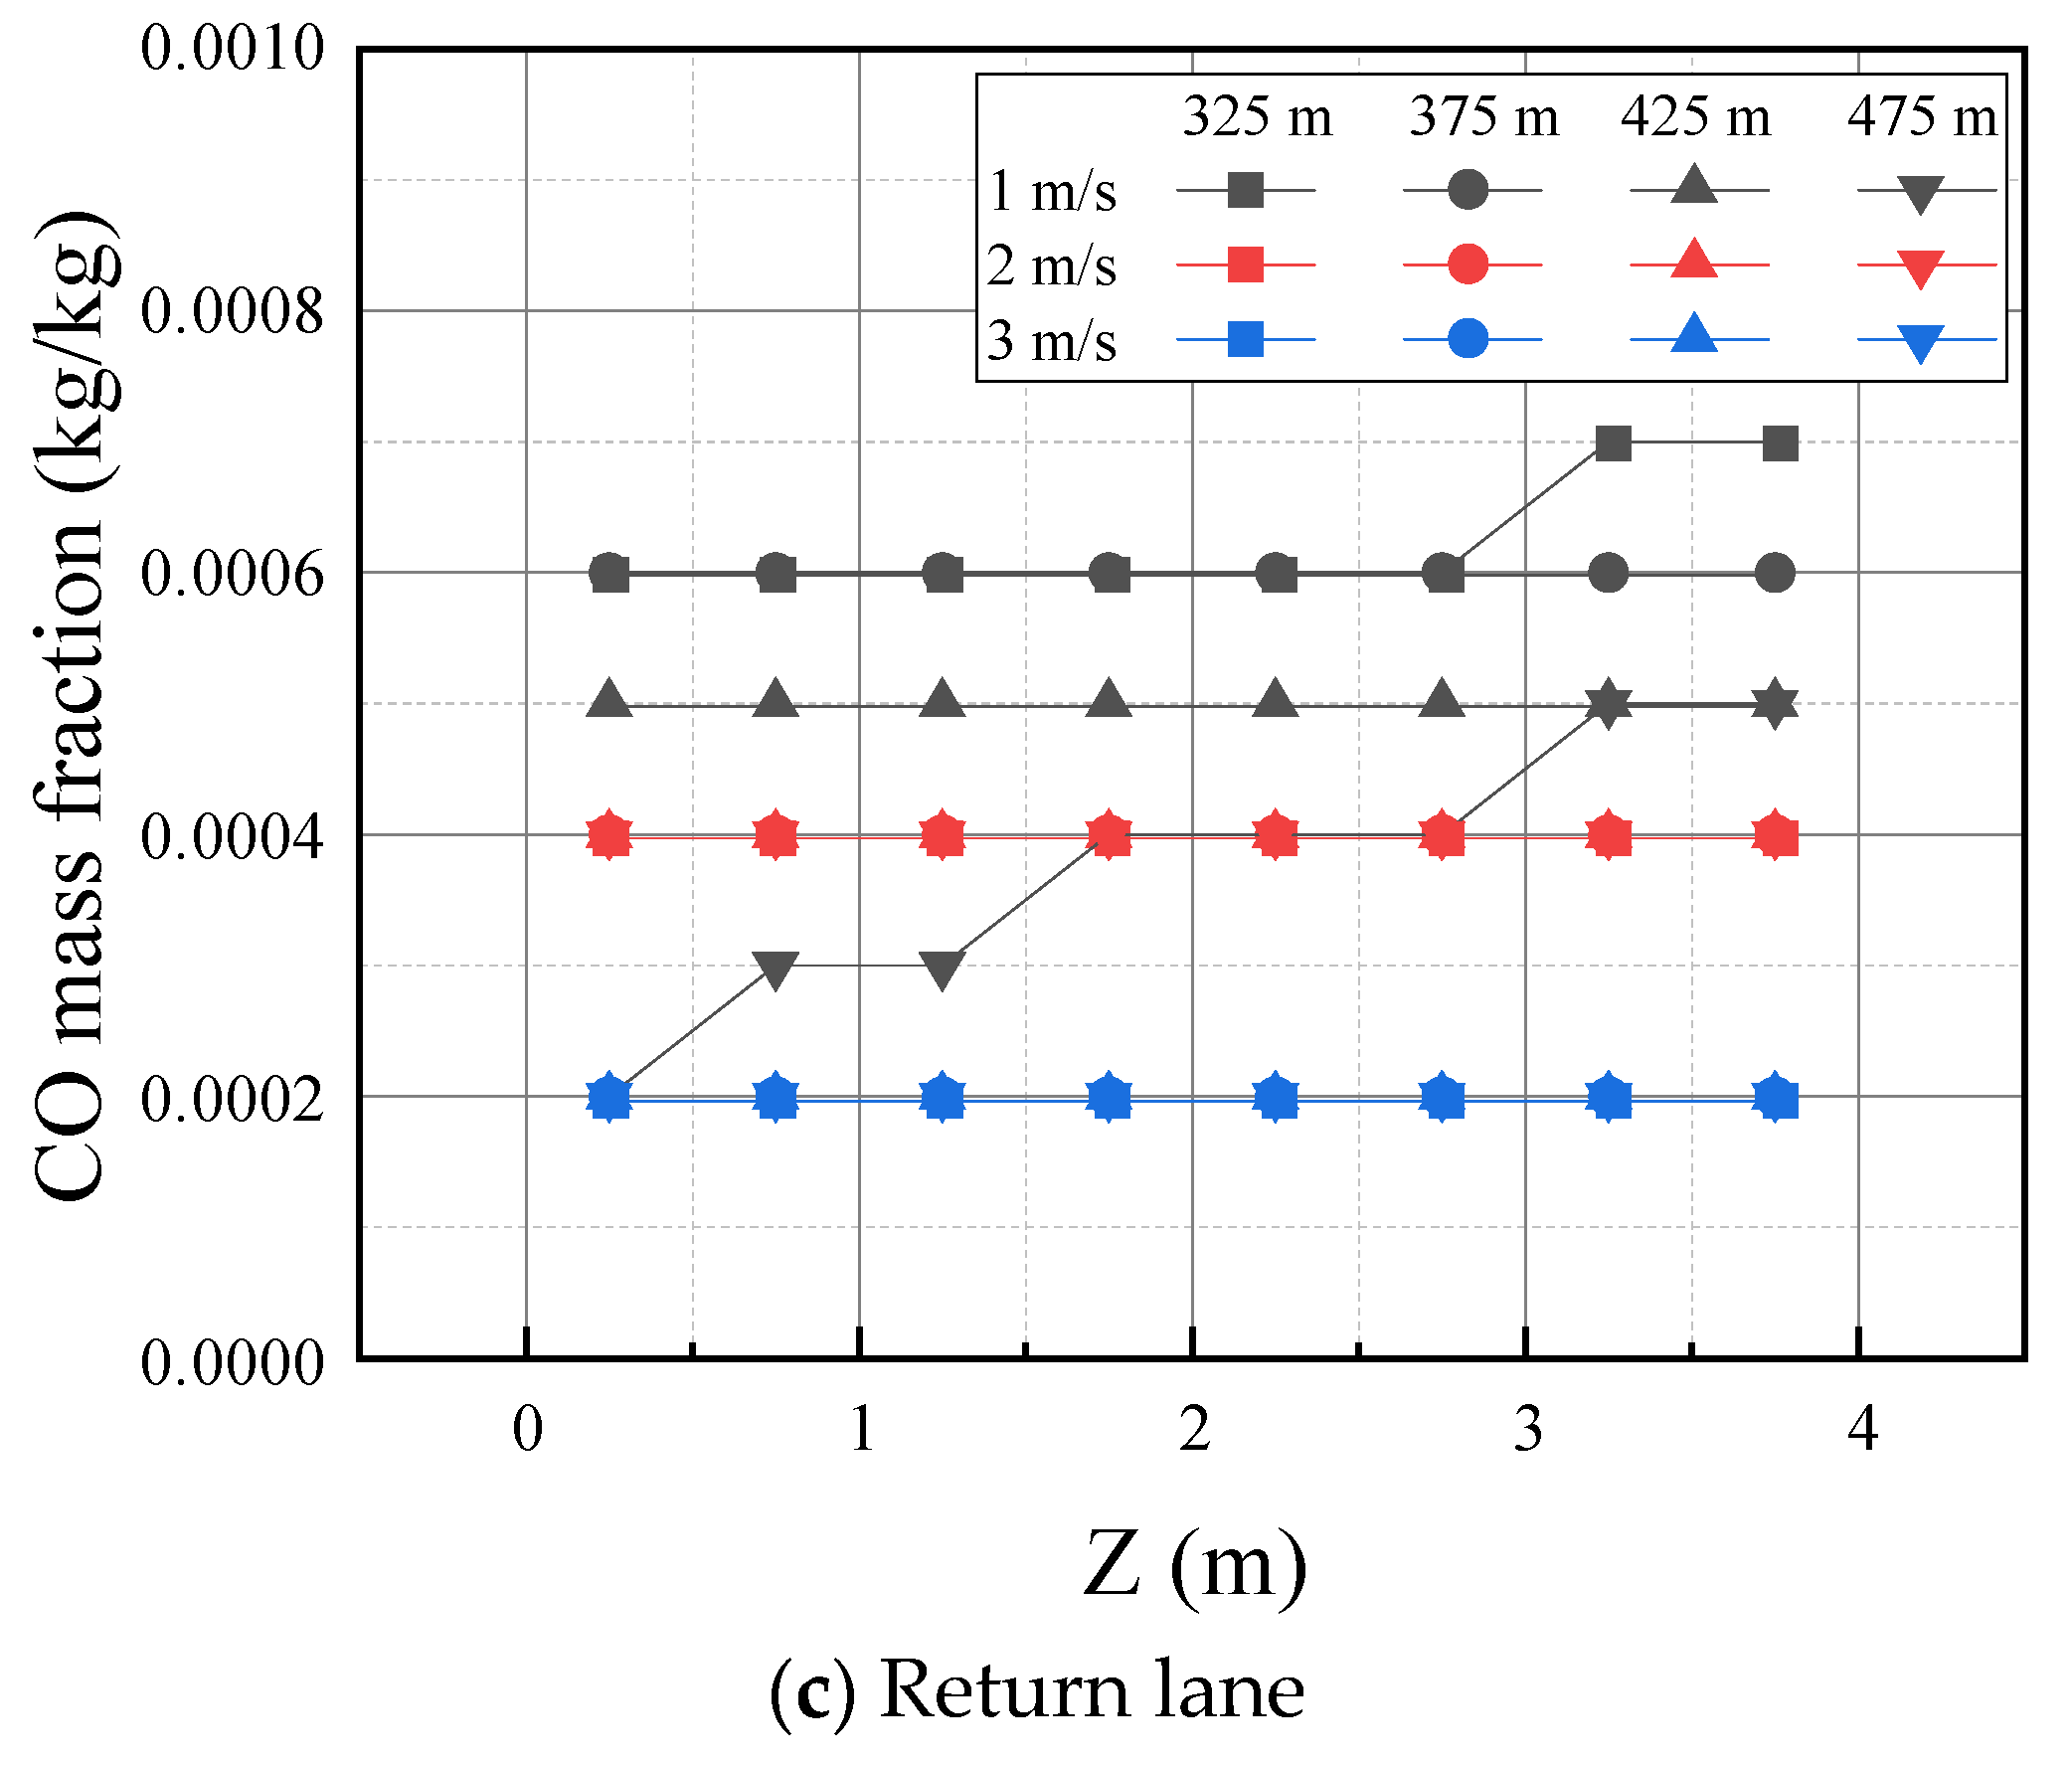
  • This paper addressed the pressing issue of the CO concentration, highlighting the dangers associated with downstream gas accumulation. Higher ventilation speeds were found to be effective in reducing the CO levels and in enhancing the overall safety measures. The CO concentrations remained consistent across heights when V = 2 or 3 m/s, underscoring the importance of an optimal ventilation speed.
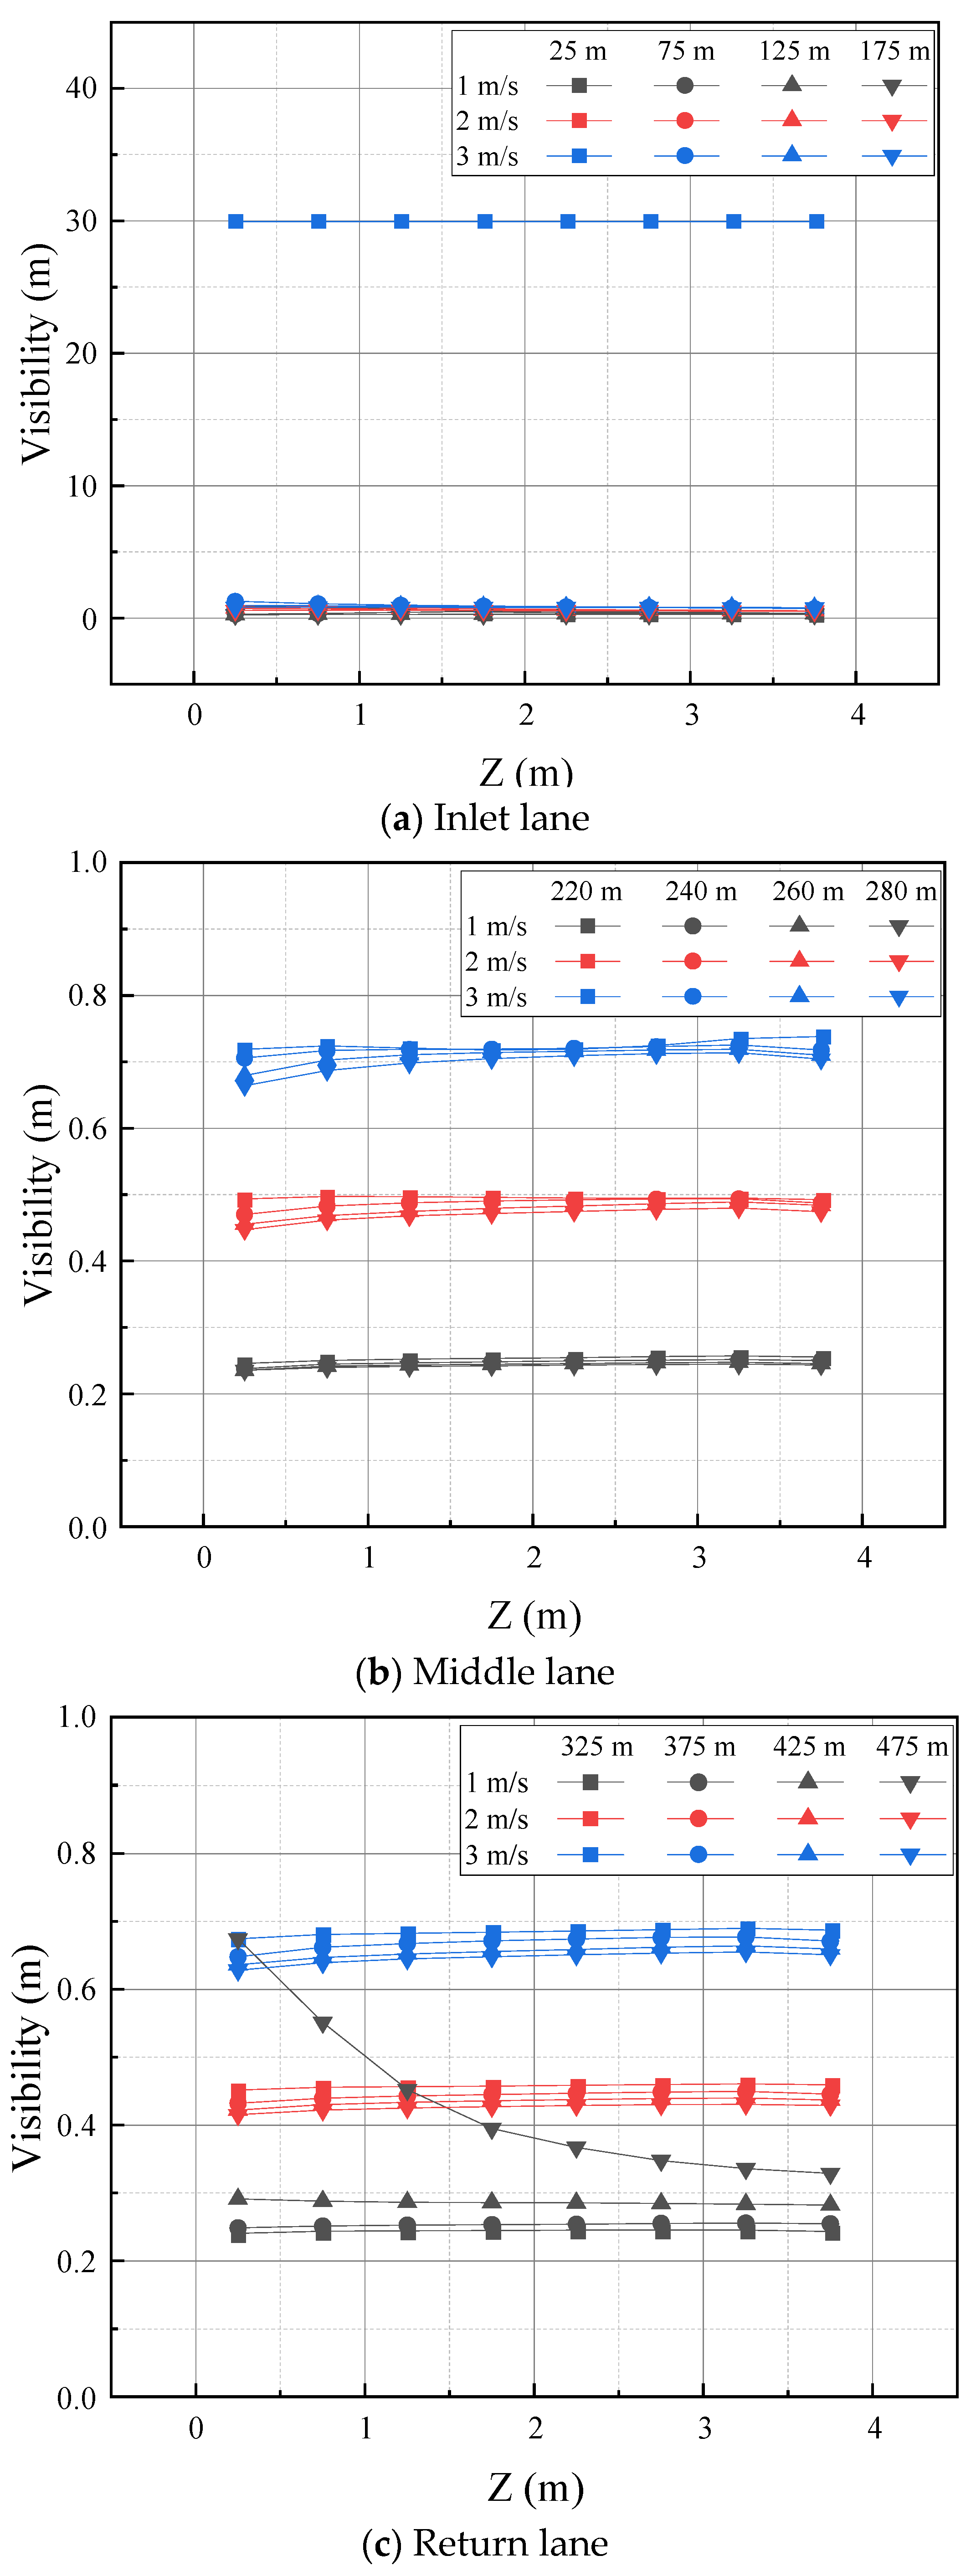
  • This study examined visibility, revealing that higher ventilation speeds improve visibility. However, the potential impact of excessive wind speed on personnel evacuation warrants careful consideration. In the middle and return lanes, the visibility steadily rose with the increasing wind speed, reaching approximately 0.7 m at V = 3 m/s, indicating the need for a balanced approach to ventilation.
In summary, this paper advances our understanding of underground fire dynamics and highlights the pivotal role of ventilation speed in ensuring personnel safety. The study’s findings, which are applicable to complex structures with multiple turnings, indicate similarities in the temperature and smoke characteristics to those observed in tunnels. Moreover, the research underscores the ongoing significance of the ventilation speed in mitigating heat hazards, managing CO levels, and improving visibility. These insights serve as a foundational framework for refining fire safety protocols in urban underground complex structures, ultimately enhancing the security and well-being of personnel during emergency operations.

Author Contributions

Conceptualization, J.O.; methodology, X.W.; software, Y.M.; validation, J.O.; formal analysis, Y.M.; investigation, Y.M.; resources, X.W.; data curation, X.W.; writing—original draft preparation, Y.M.; writing—review and editing, J.O.; visualization, X.S.; supervision, X.W.; project administration, X.W.; funding acquisition, J.O. All authors have read and agreed to the published version of the manuscript.

Funding

This research was funded by the National Natural Science Foundation of China grant number [51974305].

Institutional Review Board Statement

Not applicable.

Informed Consent Statement

Not applicable.

Data Availability Statement

Data will be made available on request.

Acknowledgments

Thank State Key Laboratory of Coal Resources and Safe Mining of China University of Mining and Technology for the basic research conditions provided for this study.

Conflicts of Interest

The authors declare no conflict of interest.

References

  1. Meng, N.; Wang, Q.; Liu, Z.; Li, X.; Yang, H. Smoke flow temperature beneath tunnel ceiling for train fire at subway station: Reduced-scale experiments and correlations. Appl. Therm. Eng. 2017, 115, 995–1003. [Google Scholar] [CrossRef]
  2. Peng, M.; Cheng, X.; He, K.; Cong, W.; Shi, L.; Yuen, R. Experimental study on ceiling smoke temperature distributions in near field of pool fires in the subway train. J. Wind Eng. Ind. Aerodyn. 2020, 199, 104135. [Google Scholar] [CrossRef]
  3. Zhong, W.; Li, Z.; Wang, T.; Liang, T.; Liu, Z. Experimental Study on the Influence of Different Transverse Fire Locations on the Critical Longitudinal Ventilation Velocity in Tunnel Fires. Fire Technol. 2015, 51, 1217–1230. [Google Scholar] [CrossRef]
  4. Hu, L.H.; Huo, R.; Peng, W.; Chow, W.K.; Yang, R.X. On the maximum smoke temperature under the ceiling in tunnel fires. Tunn. Undergr. Space Technol. 2006, 21, 650–655. [Google Scholar] [CrossRef]
  5. Rosema, A.; Guan, H.; Veld, H. Simulation of spontaneous combustion, to study the causes of coal fires in the Rujigou Basin. Fuel 2001, 80, 7–16. [Google Scholar] [CrossRef]
  6. Rowland, J.H.; Verakis, H.; Hockenberry, M.A.; Smith, A.C. Effect of Air Velocity on Conveyor Belt Fire Suppression Systems; Society for Mining, Metallurgy, and Exploration, Incorporated: Englewood, CO, USA, 2009. [Google Scholar]
  7. Vauquelin, O.; Michaux, G.; Lucchesi, C. Scaling laws for a buoyant release used to simulate fire-induced smoke in laboratory experiments. Fire Saf. J. 2009, 44, 665–667. [Google Scholar] [CrossRef]
  8. Wang, K.; Jiang, S.; Ma, X.; Wu, Z.; Zhang, W.; Shao, H. Study of the destruction of ventilation systems in coal mines due to gas explosions. Powder Technol. 2015, 286, 401–411. [Google Scholar] [CrossRef]
  9. Yao, Y.; Wang, J.; Jiang, L.; Wu, B.; Qu, B. Numerical study on fire behavior and temperature distribution in a blind roadway with different sealing situations. Environ. Sci. Pollut. Res. 2023, 30, 36967–36978. [Google Scholar] [CrossRef]
  10. Hansen, R.; Ingason, H. Heat release rate measurements of burning mining vehicles in an underground mine. Fire Saf. J. 2013, 61, 12–25. [Google Scholar] [CrossRef]
  11. Li, Y.Z.; Lei, B.; Ingason, H. The maximum temperature of buoyancy-driven smoke flow beneath the ceiling in tunnel Fires. Fire Saf. J. 2011, 46, 204–210. [Google Scholar] [CrossRef]
  12. Ng, Y.W.; Chow, W.K.; Cheng, C.H.; Chow, C.L. Scale modeling study on flame colour in a ventilation-limited train car pool fire. Tunn. Undergr. Space Technol. 2019, 85, 375–391. [Google Scholar] [CrossRef]
  13. Xi, Y.; Zhou, Z.; Mao, J.; Chow, W.; Tang, F. Maximum ceiling temperature and longitudinal distribution in a corridor-like enclosure with opening. Tunn. Undergr. Space Technol. 2023, 134, 104994. [Google Scholar] [CrossRef]
  14. Xi, Y.; Zhou, Z.; Lian, H.; Mao, J.; Chow, W.; Tang, F. Temperature variation inside a corridor-like enclosure under limited ventilation. Tunn. Undergr. Space Technol. 2022, 126, 104539. [Google Scholar] [CrossRef]
  15. Vauquelin, O.; Wu, Y. Influence of tunnel width on longitudinal smoke control. Fire Saf. J. 2006, 41, 420–426. [Google Scholar] [CrossRef]
  16. Wang, K.; Jiang, S.; Ma, X.; Wu, Z.; Shao, H.; Zhang, W.; Cui, C. Information fusion of plume control and personnel escape during the emergency rescue of external-caused fire in a coal mine. Process Saf. Environ. Prot. 2016, 103, 46–59. [Google Scholar] [CrossRef]
  17. Wu, E.; Huang, R.; Wu, L.; Shen, X.; Li, Z. Numerical Study on the Influence of Altitude on Roof Temperature in Mine Fires. IEEE Access 2020, 8, 102855–102866. [Google Scholar] [CrossRef]
  18. Chow, W.K.; Gao, Y.; Zou, J.F.; Liu, Q.K.; Chow, C.L.; Miao, L. Numerical Studies on Thermally-Induced Air Flow in Sloping Tunnels with Experimental Scale Modelling Justifications. Fire Technol. 2018, 54, 867–892. [Google Scholar] [CrossRef]
  19. Gannouni, S.; Maad, R.B. Numerical study of the effect of blockage on critical velocity and backlayering length in longitudinally ventilated tunnel fires. Tunn. Undergr. Space Technol. 2015, 48, 147–155. [Google Scholar] [CrossRef]
  20. Huang, Y.; Li, Y.; Dong, B.; Li, J.; Liang, Q. Numerical investigation on the maximum ceiling temperature and longitudinal decay in a sealing tunnel fire. Tunn. Undergr. Space Technol. 2018, 72, 120–130. [Google Scholar] [CrossRef]
  21. Liu, C.; Zhong, M.; Tian, X.; Zhang, P.; Xiao, Y.; Mei, Q. Experimental and numerical study on fire-induced smoke temperature in connected area of metro tunnel under natural ventilation. Int. J. Therm. Sci. 2019, 138, 84–97. [Google Scholar] [CrossRef]
  22. Liu, Q.; Xu, Z.; Fan, C.; Tao, H.; Zhao, J.; He, L. Experimental and Numerical Study of Plug-Holing with Lateral Smoke Exhaust in Tunnel Fires. Fire Technol. 2022, 45, 1–21. [Google Scholar] [CrossRef]
  23. Tian, X.; Liu, C.; Zhong, M. Numerical and experimental study on the effects of a ceiling beam on the critical velocity of a tunnel fire based on virtual fire source. Int. J. Therm. Sci. 2021, 159, 106635. [Google Scholar] [CrossRef]
  24. Ming, Y.; Zhu, G.; He, L.; Liu, X.; Zhou, Y.; Ding, J. Study on the maximum excess temperature and temperature distribution under the influence of lateral smoke exhaust in tunnel fires. Therm. Sci. Eng. Prog. 2023, 40, 101713. [Google Scholar] [CrossRef]
  25. He, L.; Liao, K.; Zhou, Y.; Tao, H.; Ming, Y.; Wang, X.; Zhang, H.; Zhu, G. Study on the influence of the longitudinal position of the fire source on the movement behavior of the asymmetric flow field. Therm. Sci. Eng. Prog. 2023, 39, 101753. [Google Scholar] [CrossRef]
  26. McGrattan, K.B.; Forney, G.P. Fire Dynamics Simulator (Version 5): User’s Guide; National Institute of Standards and Technology: Gaithersburg, MD, USA, 2004. [CrossRef]
  27. Drożdżol, K. Zapewnienie bezpieczeństwa w systemach odprowadzania spalin w budownictwie mieszkaniowym. Bezpieczeństwo Tech. Pożarnicza 2016, 41, 67–73. [Google Scholar] [CrossRef]
  28. Sedda, A.F.; Rossi, G. Death scene evaluation in a case of fatal accidental carbon monoxide toxicity. Forensic Sci. Int. 2006, 164, 164–167. [Google Scholar] [CrossRef]
  29. Tekbaş, Ö.F.; Vaizoglu, S.A.; Evci, E.D.; Yüceer, B.; Güler, Ç. Carbon Monoxide Levels in Bathrooms Using Hot Water Boilers. Indoor Built Environ. 2001, 10, 167–171. [Google Scholar] [CrossRef]
  30. Cohen, R.; Novak, B.L.; Sineno, E. A New Method for the Prevention of Carbon Monoxide Poisoning. Sanitarian 1962, 24, 350–353. Available online: http://www.jstor.org/stable/44512952 (accessed on 31 March 2016).
  31. Tang, F.; Mei, F.Z.; Wang, Q.; He, Z.; Fan, C.G.; Tao, C.F. Maximum temperature beneath the ceiling in tunnel fires with combination of ceiling mechanical smoke extraction and longitudinal ventilation. Tunn. Undergr. Space Technol. 2017, 68, 231–237. [Google Scholar] [CrossRef]
  32. Yao, Y.; He, K.; Peng, M.; Shi, L.; Cheng, X. The maximum gas temperature rises beneath the ceiling in a longitudinal ventilated tunnel fire. Tunn. Undergr. Space Technol. 2021, 108, 103672. [Google Scholar] [CrossRef]
  33. Zhu, Y.; Tang, F.; Zhao, Z.; Wang, Q. Effect of lateral smoke extraction on transverse temperature distribution and smoke maximum temperature under ceiling in tunnel fires. J. Therm. Anal. Calorim. 2022, 147, 4275–4284. [Google Scholar] [CrossRef]
  34. Li, Y.Z.; Ingason, H. The maximum ceiling gas temperature in a large tunnel fire. Fire Saf. J. 2012, 48, 38–48. [Google Scholar] [CrossRef]
Figure 1. Model schematic.
Fire 06 00436 g001
Figure 2. Smoke flow characteristics under 5 MW and V = 1–3 m/s.
Fire 06 00436 g002
Figure 3. Smoke flow characteristics with X f = 80 m.
Fire 06 00436 g003
Figure 4. Temperature distributions with X f = 80 m.
Fire 06 00436 g004aFire 06 00436 g004b
Figure 5. Temperature distributions with X f = 160 m.
Fire 06 00436 g005aFire 06 00436 g005b
Figure 6. Maximum excess temperature under various V .
Fire 06 00436 g006
Figure 7. Comparison of simulation results with predictions of Equation (8).
Fire 06 00436 g007
Figure 8. CO mass fraction when HRR = 10 MW and X f = 40 m.
Fire 06 00436 g008aFire 06 00436 g008b
Figure 9. Visibility when HRR = 10 MW and X f = 40 m.
Fire 06 00436 g009
Table 1. Test conditions.
No.HRRs (MW)Ventilation Speeds (m/s)Fire Locations in Middle Lane (m)
1–122140, 80, 120, 160
240, 80, 120, 160
340, 80, 120, 160
13–245140, 80, 120, 160
240, 80, 120, 160
340, 80, 120, 160
25–3610140, 80, 120, 160
240, 80, 120, 160
340, 80, 120, 160
Table 2. The calculation results of D* and D*/D.
HRR (MW)D*D*/D
21.265445.06177
51.825657.30262
102.203268.81306
Disclaimer/Publisher’s Note: The statements, opinions and data contained in all publications are solely those of the individual author(s) and contributor(s) and not of MDPI and/or the editor(s). MDPI and/or the editor(s) disclaim responsibility for any injury to people or property resulting from any ideas, methods, instructions or products referred to in the content.

