1. Introduction
Studying a combustion process is a very complex task [
1]. However, the characterization of a flame is essential to improve the combustion process’s efficiency and reduce pollutant emissions. Measuring several variables in a flame is used to monitor the efficiency of combustion processes. Generally, some measured variables are flame temperature, soot concentration, radical intensities, flame size, luminosity, and flickering [
2,
3,
4,
5,
6,
7,
8,
9,
10,
11,
12,
13,
14,
15,
16,
17,
18,
19,
20,
21,
22]. Full-field optical techniques are usually used to make this kind of measurement because they give a global description of the process and do not disturb the sample. On the other hand, simultaneously measuring several variables is preferable because this avoids the lack of correlation between them [
9,
16,
17,
18,
19]. However, a complex optical setup is usually employed for measurement in such cases, making the task costly and challenging [
16,
18].
The flame equivalence ratio (
) is an adimensional variable used to determine if a fuel-oxidizer mixture is rich, lean, or stoichiometric [
1]. When
, it denotes a fuel-rich mixing process; on the other hand,
is related to fuel-lean mixtures, and the last
in the ratio relationship is the value for stoichiometric mixing. This relation is intrinsically linked to determining a system’s performance. This study, as in others, corroborates that the maximum temperature value is obtained at a value of
for LPG fuel. Other variables that can be connected directly to the flame equivalence ratio are the temperature and radical intensities (chemiluminescence) [
10,
11,
12,
13,
14,
15,
16,
17,
18,
19]. In a combustion process, some released species are OH, CH, CH
2O, and C
2, which have a specific emission spectrum [
10,
11,
12,
13,
14,
15,
16,
17,
18,
19]. In these combustion flames, the presence of radicals
and
are inherent in the reaction zone. These two chemical species are most abundant within the flame. Furthermore, these radicals emit in the visible region of the electromagnetic spectrum, centered at wavelengths 430 nm and 525 nm, respectively [
14]. For this reason, digital color cameras play an essential role in chemiluminescence measurements [
11,
12,
13,
14,
15,
16,
17,
18]. In this analysis, each color channel contributes specific information about the object under study. However, most digital color cameras suffer from the crosstalk effect; this occurs when sensors have overlapping sensibilities, contaminating the recorded data and needing correction [
15,
17].
There are few works in which chemiluminescence and flame temperature are measured [
3,
16,
17,
18]. In one of the works, the optical system is simple; they only use a camera, and the temperature is measured using two-color pyrometry. However, temperature measurement is applicable only for sooty flames [
3]. In other research, two-color pyrometry is also used to determine the flame’s temperature; however, the optical arrangement is complex [
16,
18]. In [
17], the optical configuration is simple to implement, and Digital Laser Speckle Displacement (DLSD) is used to determine the temperature fields. However, the chemiluminescence measurements are contaminated with speckle noise, making determining these values difficult.
On the other hand, in an axisymmetric object, it is well-known that 2D temperature and chemiluminescence values are converted to 3D values through the Abel transforms [
17,
23,
24,
25]. Unfortunately, applying Abel transforms requires noise-free experimental data (smooth experimental curves). Therefore, to achieve proper chemiluminescence measurements in this work, it is necessary to remove the speckle noise to use Abel transforms appropriately. Some studies propose a Fourth-Order Partial Differential Equation (PDE) [
26,
27]. However, an adverse effect is the elimination of borders on the images and a residual stagger effect impact that creates a blurred image. However, utilizing a Gaussian basis to reconstruct the integrating data image and mitigating the blurring effect is a viable solution [
28].
Based on the above, in this work, an image-processing algorithm is applied to recreate the image intensity profile on the object plane by eliminating the speckle effect using a PDE of Fourth Order and a set of Gaussian bases to reconstruct the intensity; furthermore, an Abel transform is applied to the intensity values and a crosstalk correction process is necessary. Therefore, the novelty of this work is to propose an image-processing algorithm to perform the deconvolution of the radiation profiles related to the presence of radicals as and . This has not been performed previously due to the corrupted data derived from speckle phenomena for temperature calculations. This new process implies the possibility of calculating their deconvolution by Abel transform, decreasing the presence of noise by a PDE, and a better profile quality of the radiation from the flame through curve-fitting using a set of Gaussian Bases. In a DLSD system, the temperature values are subject to the refractive index of the gas; then, this approach can be applied to different kinds of flames. In order to calculate the variations in refractive index, correlation algorithms can be used; this limits the number of points from the calculation of temperature profiles and derives in profiles without well-defined borders. In this case, using Gaussian Basis for curve fitting helps increase the number of points and obtain a better representation of temperature calculations numerically. In the setup, no optical filters are needed; the system has low vibration and variable sensitivity. All the data acquisition is made simultaneously so that a relationship between the fuel flow, the temperature, and the chemical emissions can be directly established from the data, circumventing the difficulties that arise when synchronizing two distinct sets of data from two different experimental setups.
3. Experimental Setup
This work aims to describe a new processing algorithm for the set of images obtained in a previous study from the color spectrum and temperature of an axisymmetric flame [
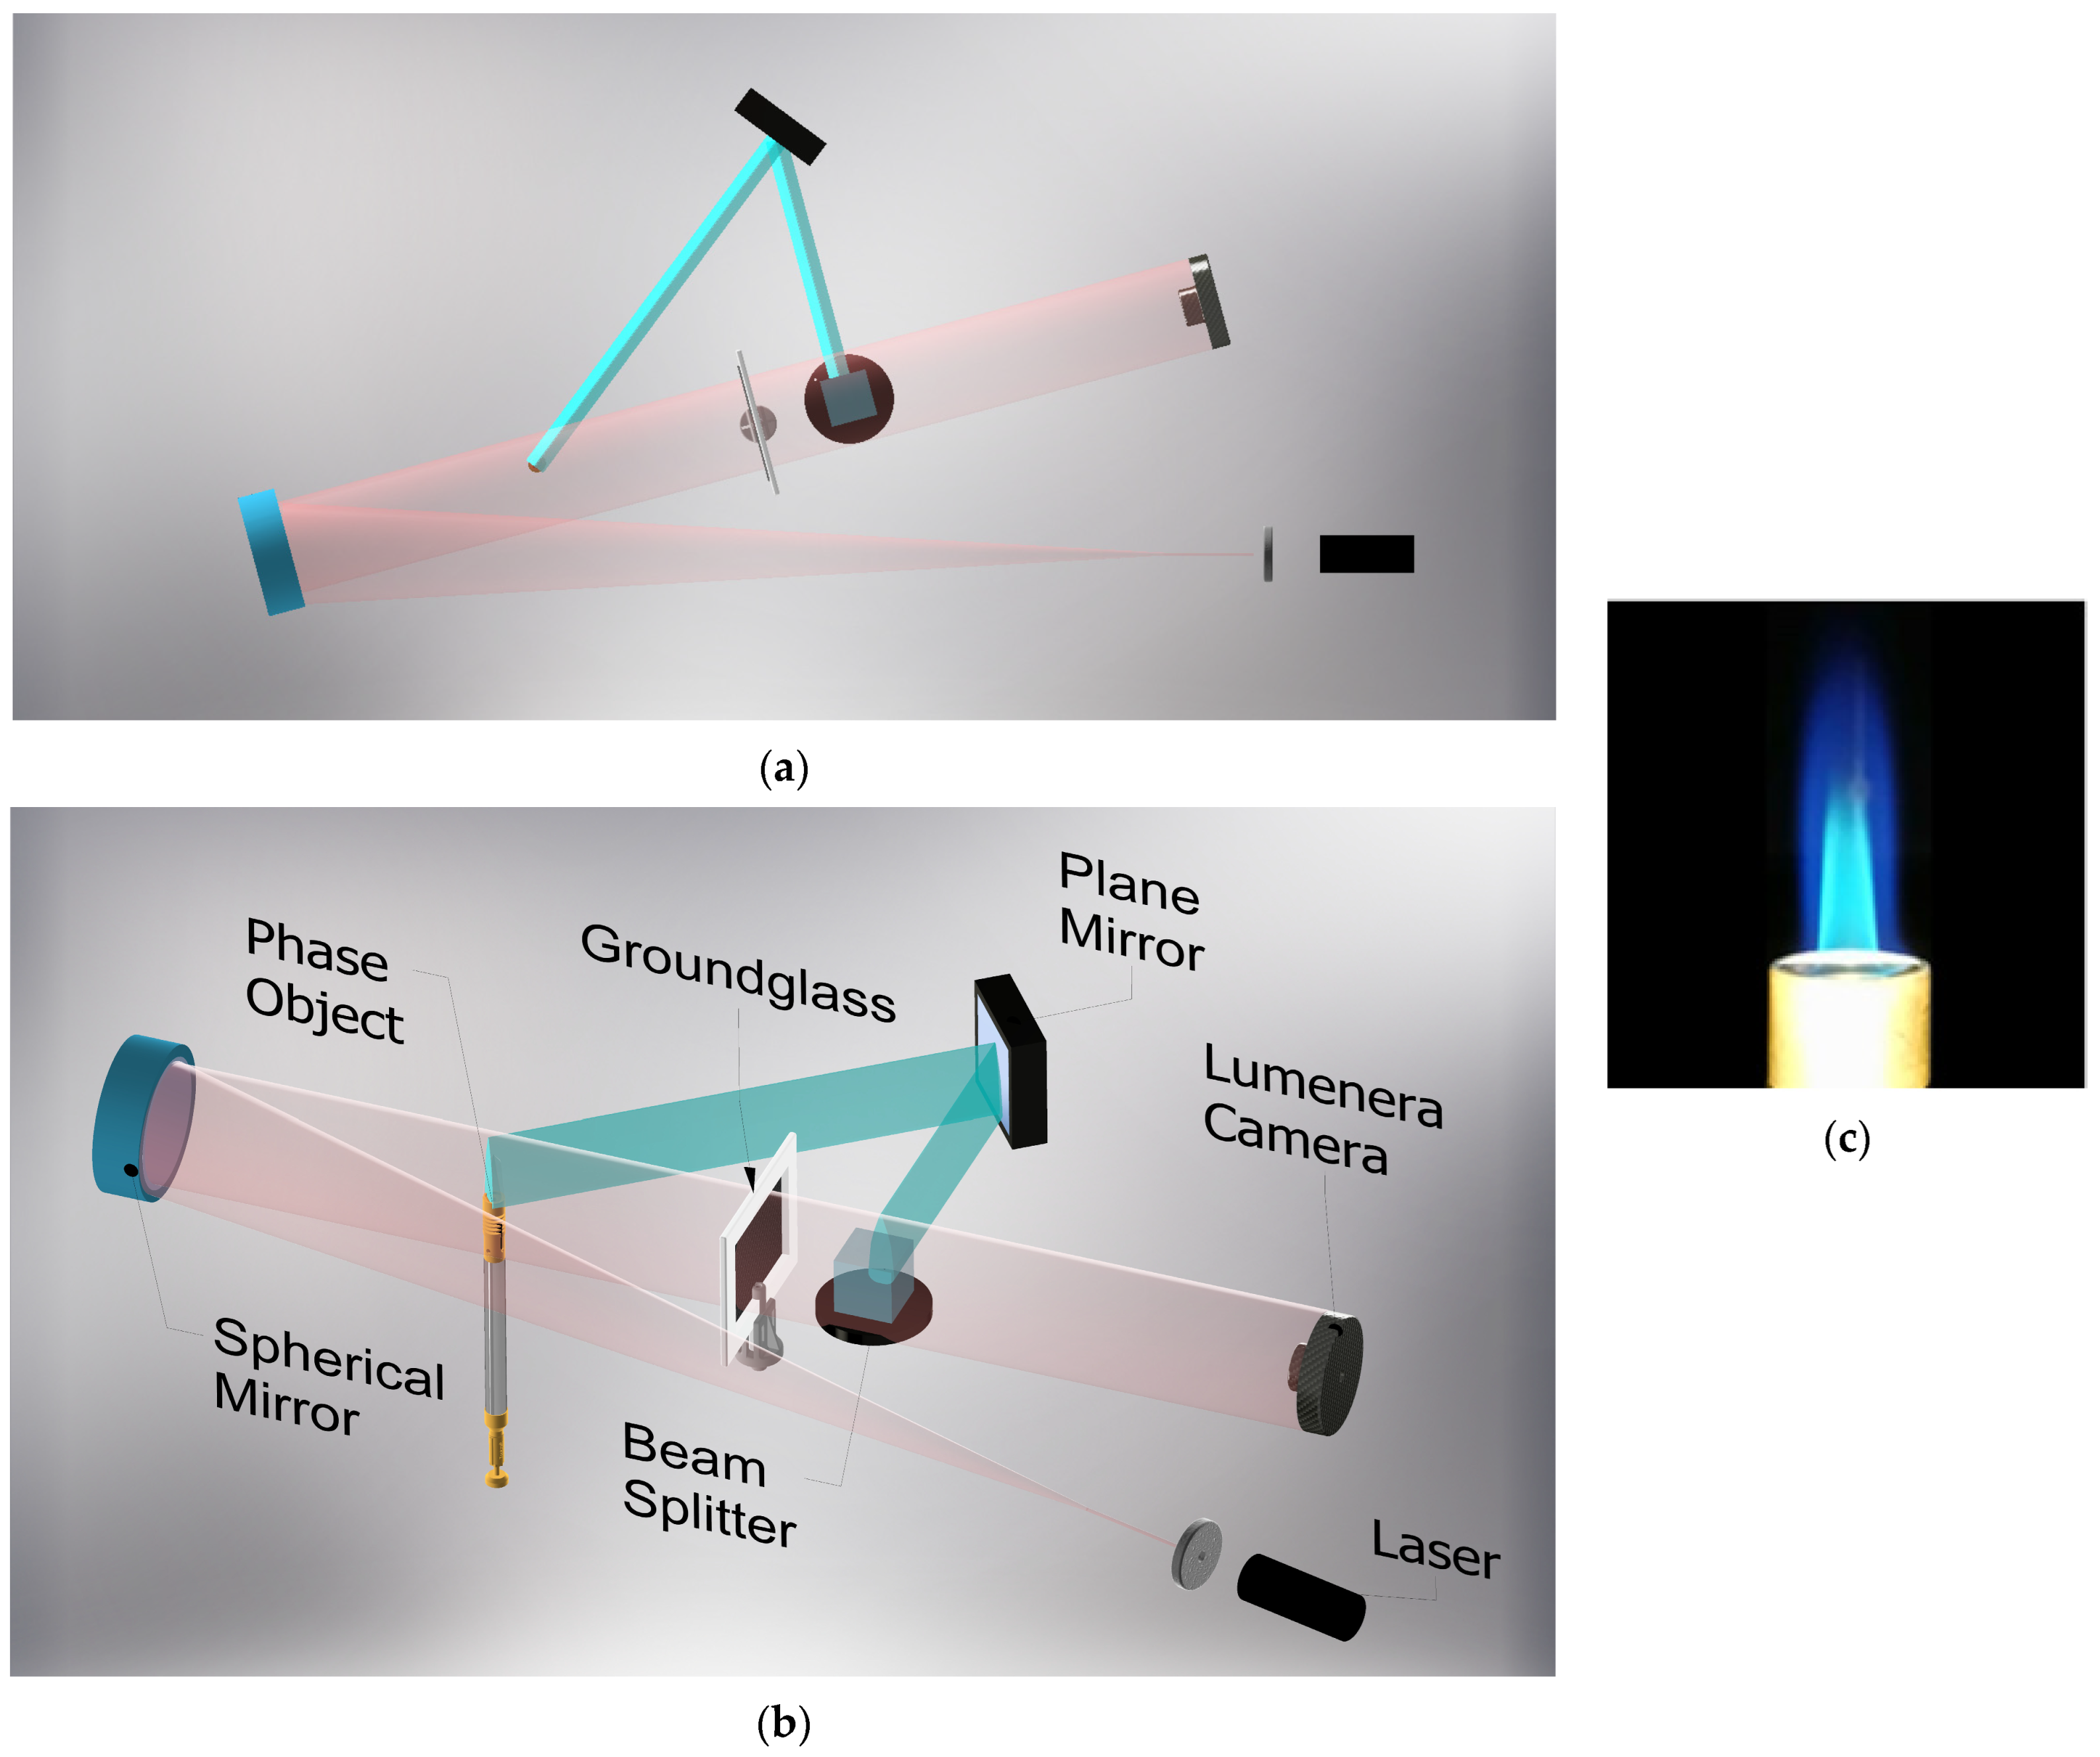
17]. These data were obtained using the optical setup shown in
Figure 2. The system consists of a 25 mW He-Ne laser
as the illumination source, and a spatial filter with a microscope objective and a pinhole of 40× and 25
m, respectively, a spherical mirror with focal distance f = 120 cm and a diameter d = 10 cm, a butane torch with axisymmetric cylindrical configuration with an inner and outer diameter of 0.5 cm and 1.9 cm, correspondingly, the torch is presented in
Figure 2c. Furthermore, to ensure flame temperature control on the head torch, the torch has four slots to admit air into the steam via the Venturi effect. In addition, ground glass of a standard glass of 12.5 × 9.5 cm and polished 25
m works as a project surface to generate the speckle phenomena. The last components are a square plane mirror (M2, 6.0 × 6.0 cm), a beam splitter with a transmission rate of 50/50, and the vision system, which is a Lumenera camera model LT225c color digital camera from Lumenera Corporation capable of capturing 170 frames per second in an 8-bit scale of intensity. All the image data are stored in BMP format. The image data were obtained by driving the camera by a semiautomatic subroutine using the manufacturer’s software, which allows capturing single or multiple frames. The spectral response of the pixels provided by the manufacturer and used in this work is shown in
Figure 3.
Furthermore, two main paths are used to obtain this data due to the nature of the optical setup and the measurement variables. First, a virtual image of the flame is obtained in the blue path from the plane mirror (M2) and afterward combined on the beam splitter. This trajectory is necessary to measure the chemiluminescence of the flame (
and
). On the other hand, the red path contains all the data from speckle measurements used to calculate the temperature fields. In the experiments, six cases with different fuel ratios were performed using this optical setup; then, the experimental parameters of mixing are concentrated in
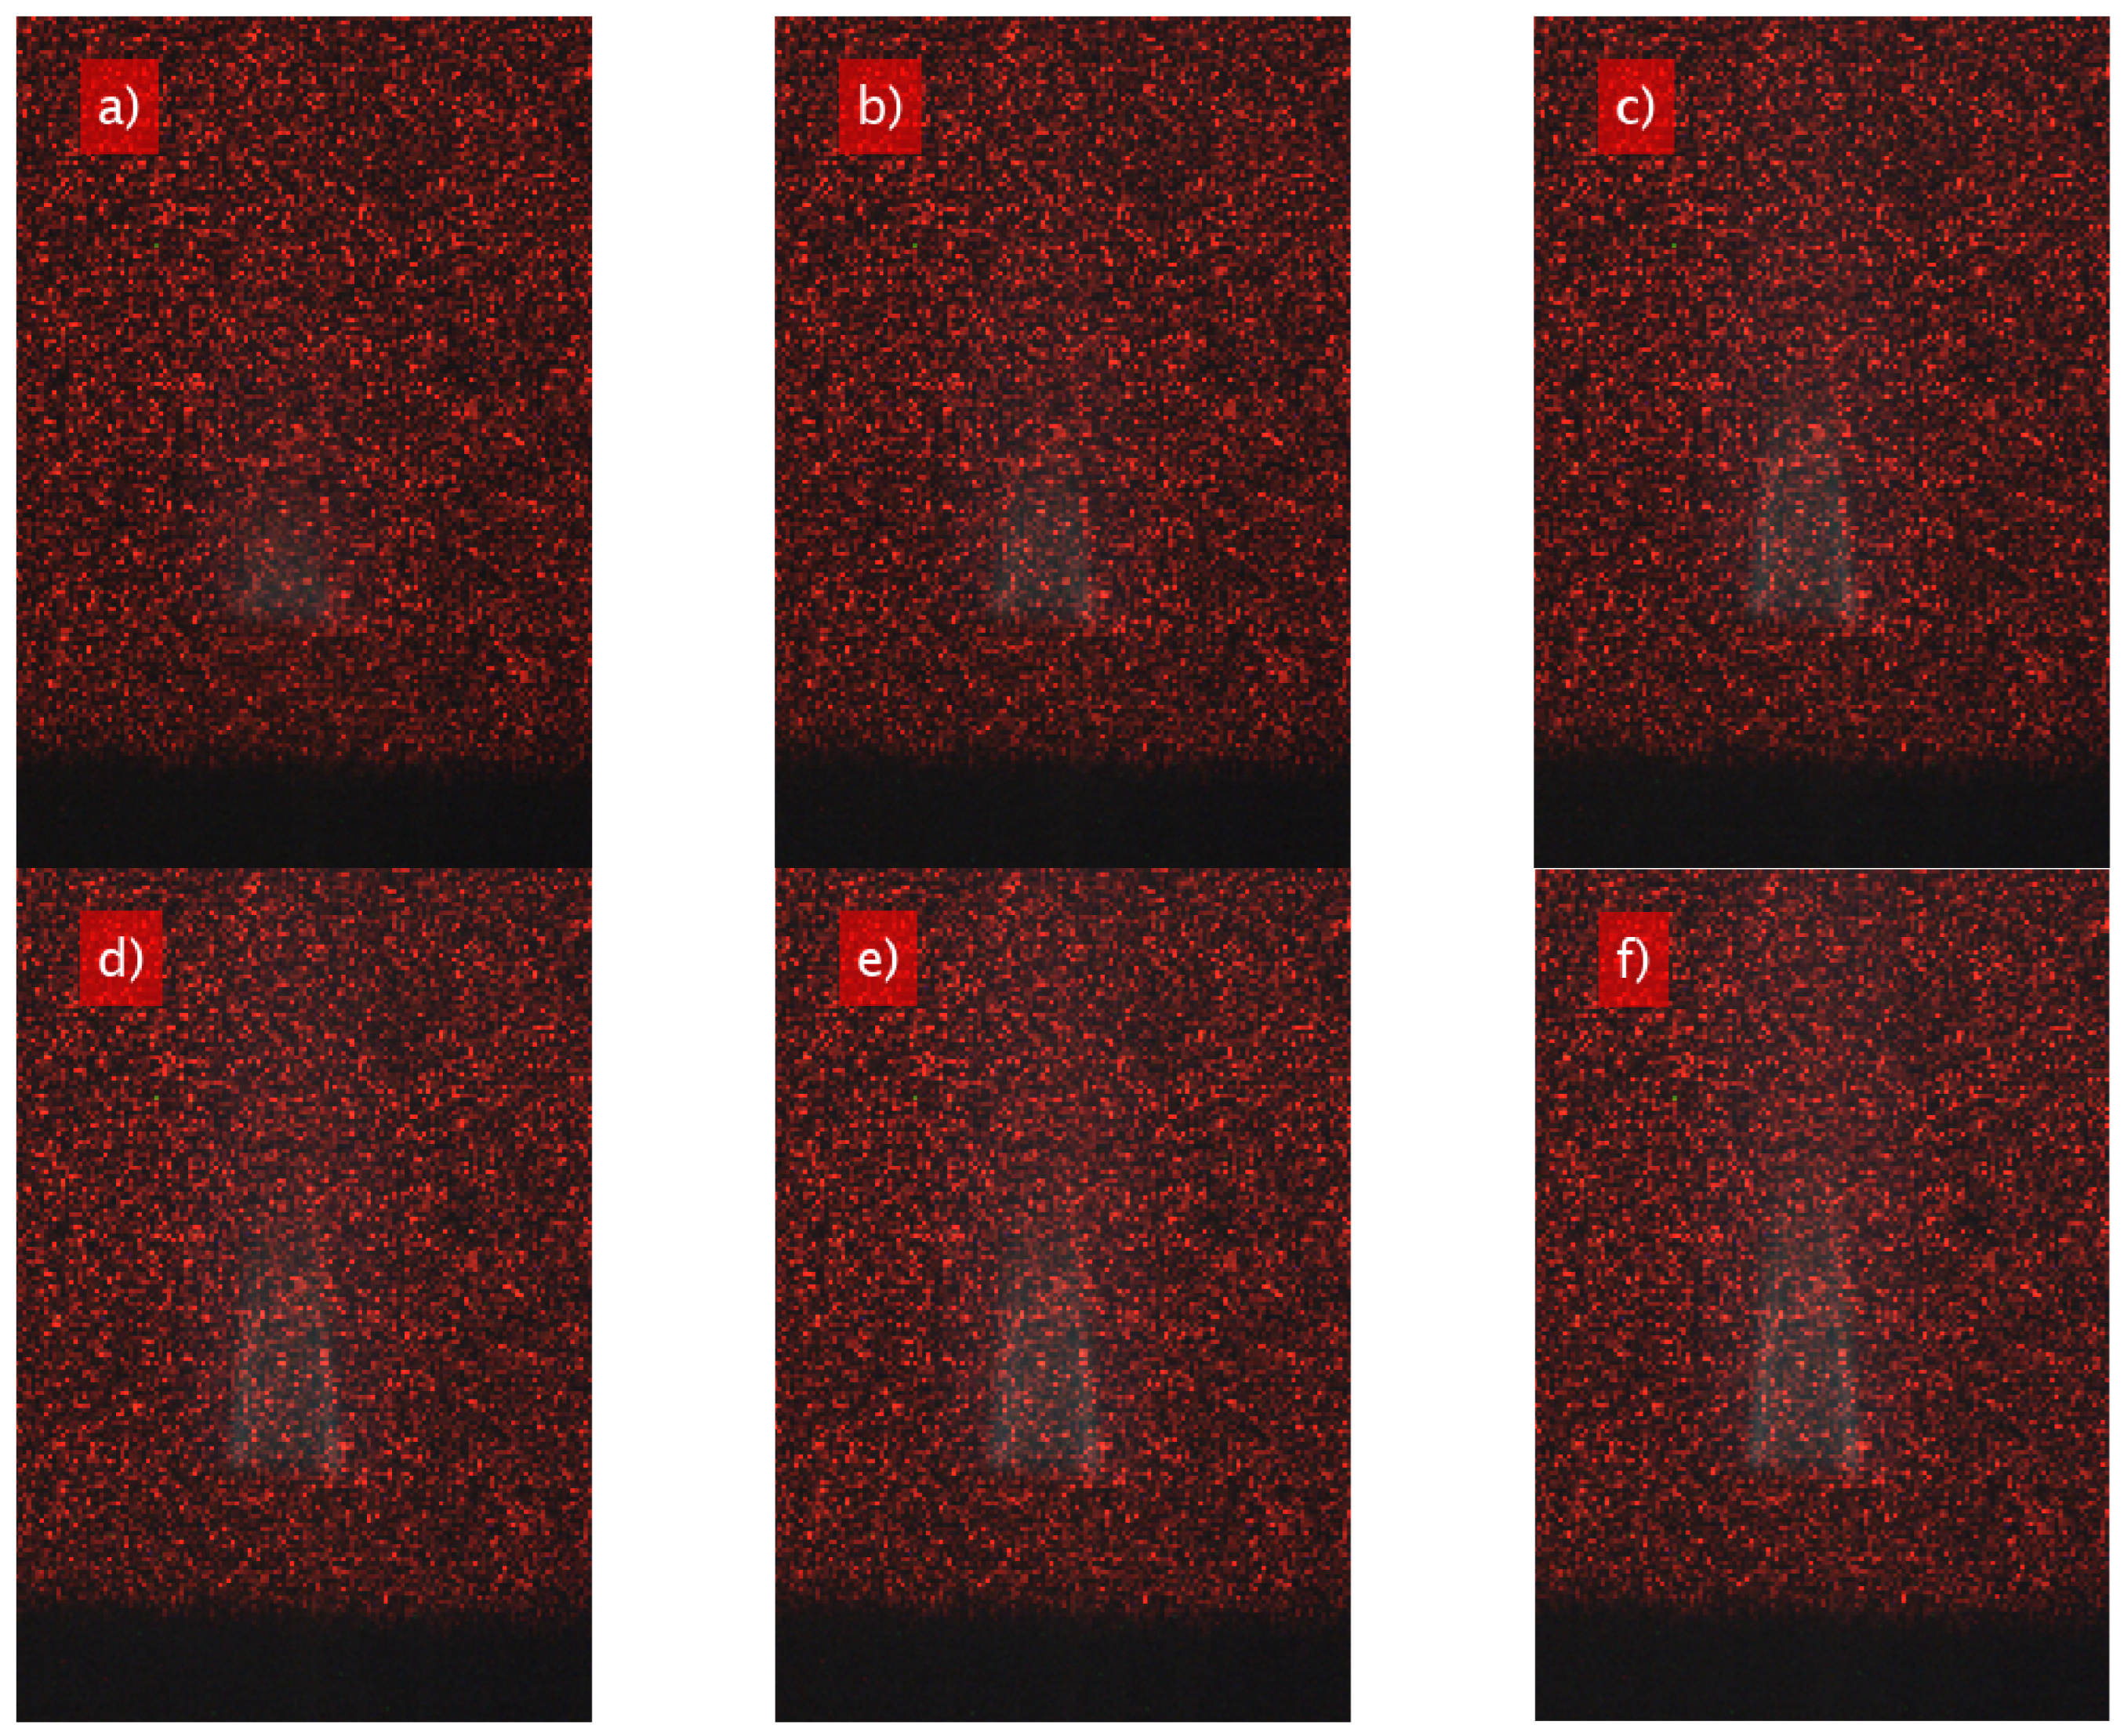
Table 1; while all the RGB images for each case are present in
Figure 4. The figures show a speckled background overlapping with the combination of green and blue color channels that represent the shape of the flame. On the figure can be observed flame size and a residual intensity appearance of the flame, but as was discussed before, a speckle denoising process by applying the procedure presented in
Section 2.2 is required to obtain regions of radical presence. The data analysis from radicals and temperatures was performed for all six cases; however, in this work, the results presented in the following are referred to in case f of
Figure 4. This discussion is presented in the next section.
4. Data Analysis
In this section, a flowchart of the image processing algorithm for chemiluminescence as to temperature analysis is presented in
Figure 5. It shows that the algorithm is divided into two sections, one for temperature measurements in the red channel (red box) and the other for the green and blue channel for chemiluminescence analysis (blue-green box). All these processes can be realized with only two frames, a reference frame and a frame in the presence of the phase object (gray box). In the following paragraphs, a detailed description of each step is covered.
All the data analysis presented in this section is for
. As a first step to denoising the signal, the subtraction of the image of the object
, minus the reference image
, is performed. Afterward, the image decomposition on each color channel is performed.
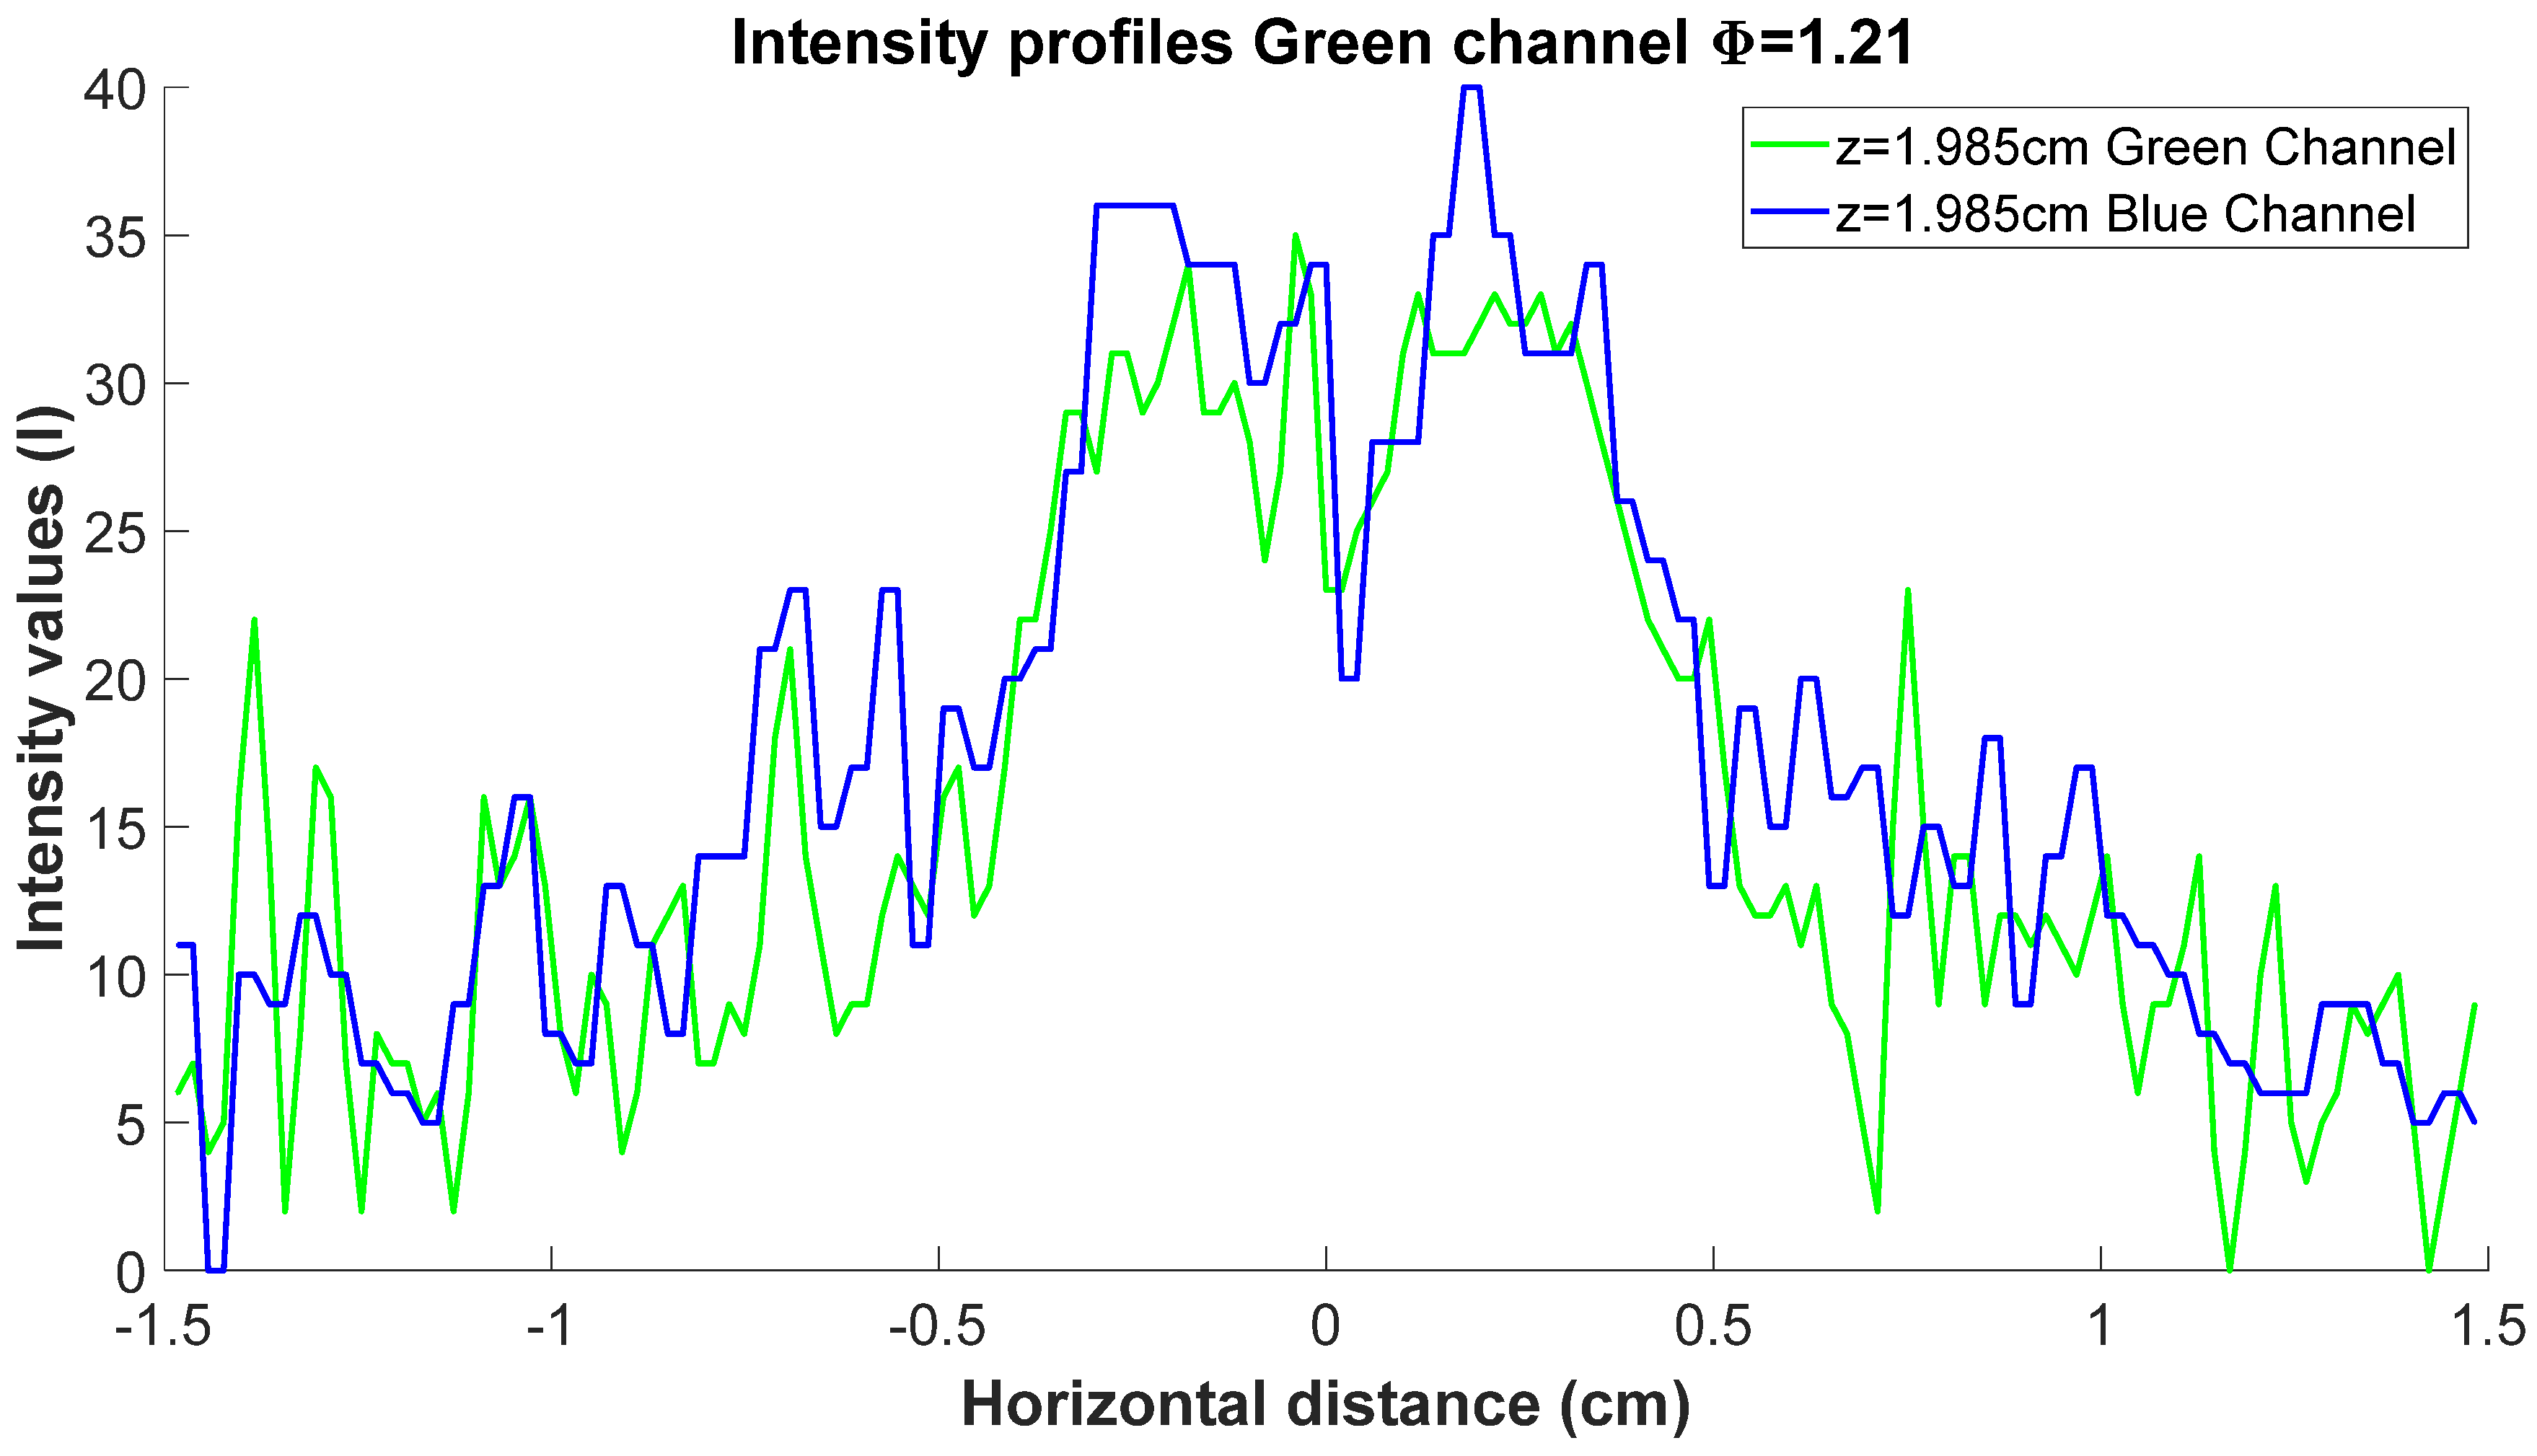
Figure 6 presents two profiles with noise from the green and blue channels of the data images for a fixed height taken from the outlet of the head torch. For all this data calculation, the
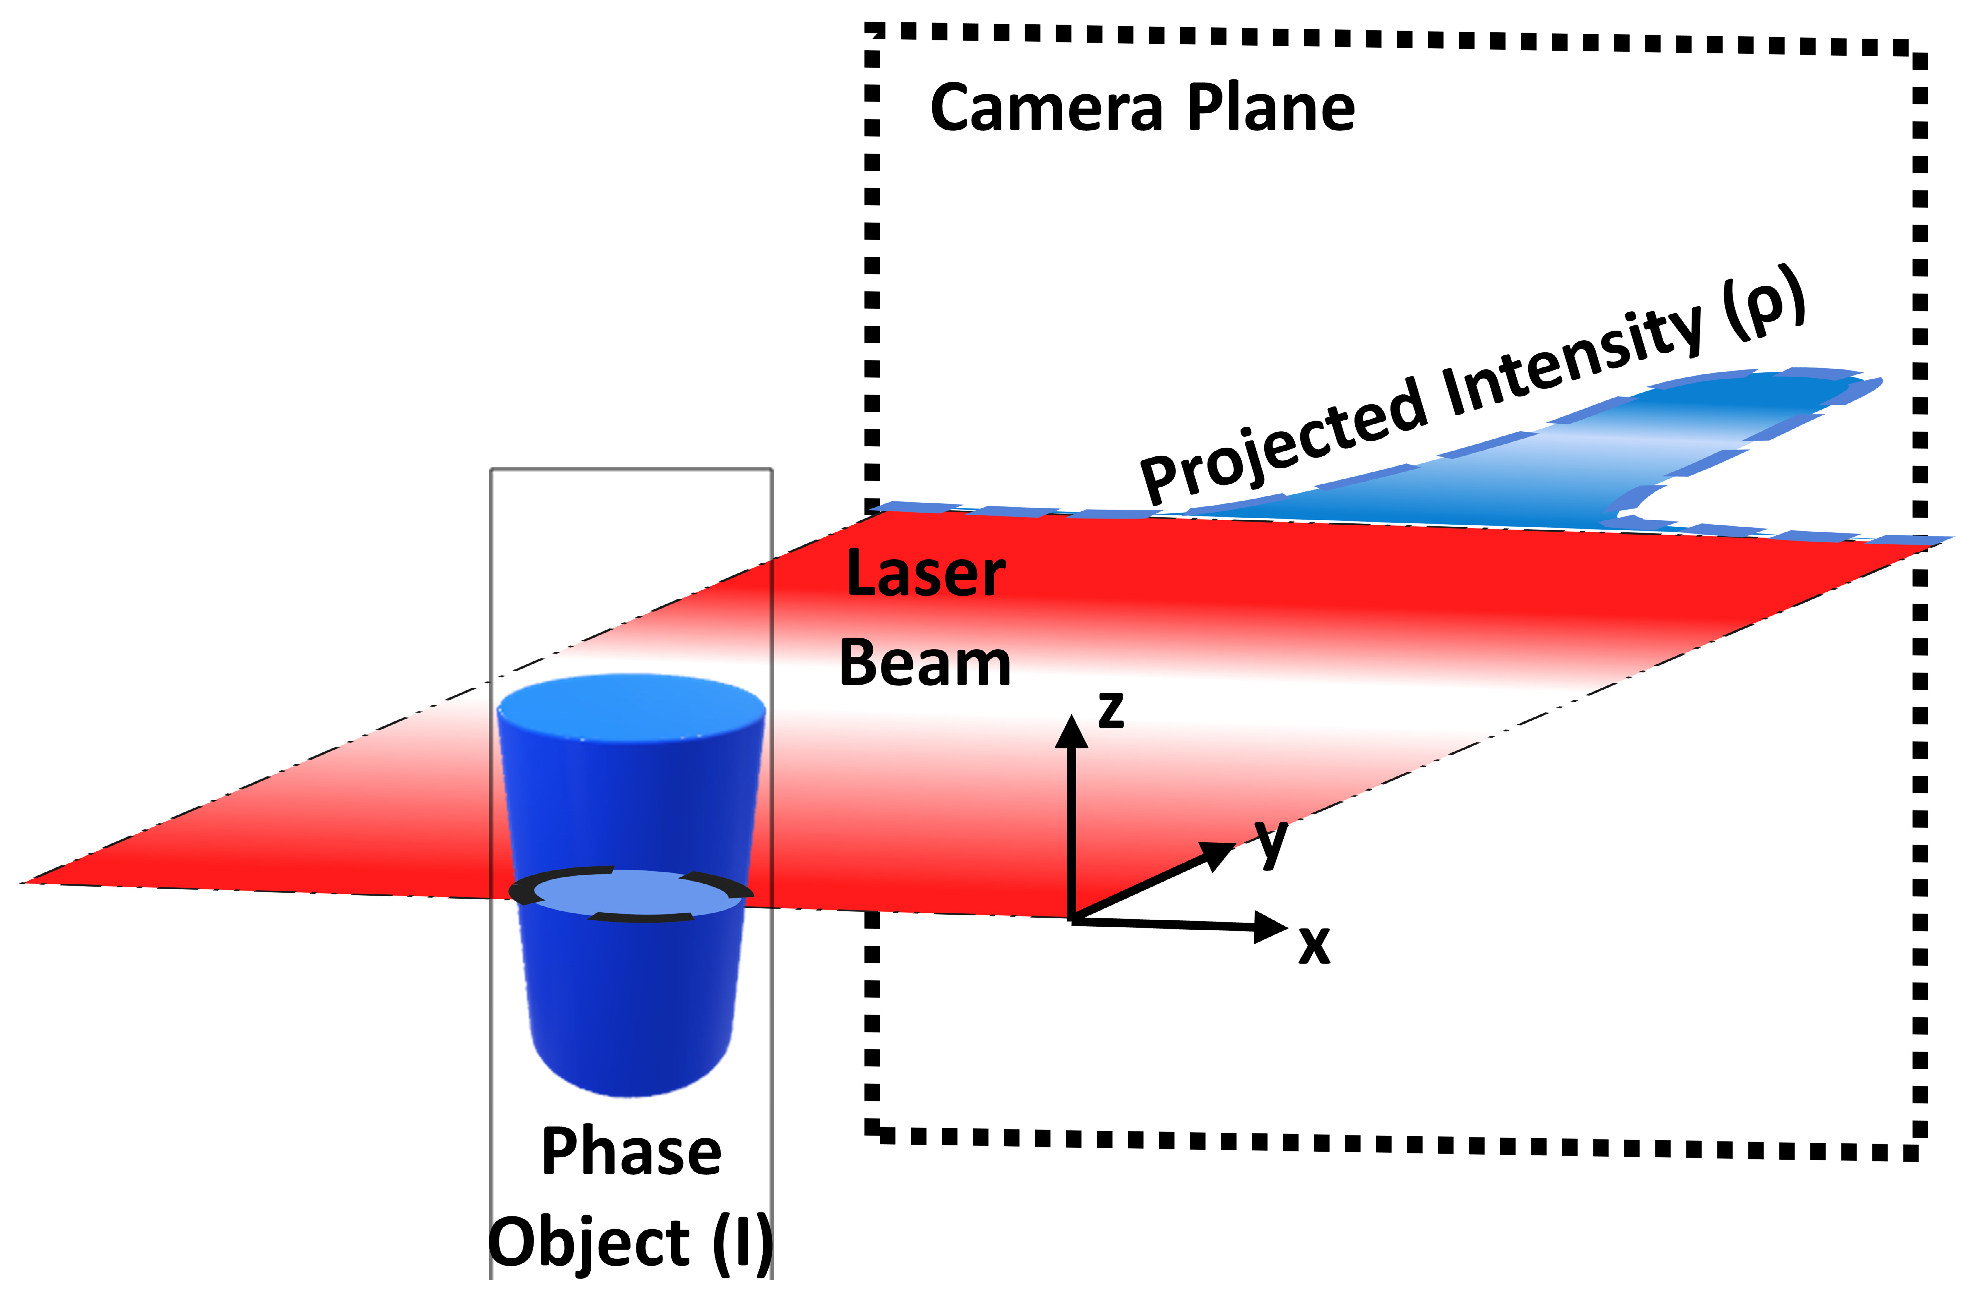
z-axis represents the flame height coordinates (see
Figure 1).
In order to improve the processing time and reduce undesirable data, the original size of images is reduced (see
Figure 4). To determine this region, a process to eliminate the background from the flame data is necessary, using the iterative algorithm described in the theoretical background section (see Equation (4)); a subregion of 151 × 201 pixels was determined to contain all the flame intensity information.
In a second instance, speckle denoising was realized to improve the results for numerical integration (Abel transform application). The solution from PDE of fourth order was applied to image intensity data, only blue and green channels. The results are shown in dashed line form in
Figure 7a,b for each color channel and three different distances of the
z-axis.
In
Figure 7a,b, the presence of a stagger effect is undeniable; this effect presence is natural due to the discretization process of solving the PDE of intensity by finite differences. However, it can be observed that the speckle effect has disappeared completely, and the borders on image profiles are conserved (dashed line). These profiles were obtained after 40 algorithm iterations to solve the fourth-order PDE. At this point, the intensity profiles are corrected against speckle phenomena. However, the nature of the data can rely on a complicated integrated process due to the stagger effect and discretized values from speckle data. In order to improve the calculation of intensity values by the deconvolution process, a set of Gaussian bases is used to perform the curve fitting of the data.
Figure 7a,b in dotted line form represents these curve fitments using the Gaussian basis. It can be observed that the stagger effect has disappeared; the serialized points represent this calculation to obtain the profile in all the values of a specific distance r, the relative error between the radiation intensity after noise reduction and the measured radiation intensity has a maximum of approximately
for both channels.
Nevertheless, near the center of the flame, the fitment adjustment process presents a discrepancy; this phenomenon is natural by the proximity of the singularity r = 0, but it can be interpolated to avoid this problem [
24]. The advantage of performing a curve fitment by a set of Gaussian bases is that the borders are prevalent on the image, and a set of well-defined continuous math functions is obtained to define the pixel values of the profiles, which can be used to represent the data on the three-dimensional form using the Abel transform (volume visualization). As a visual aspect, after applying the Abel transform,
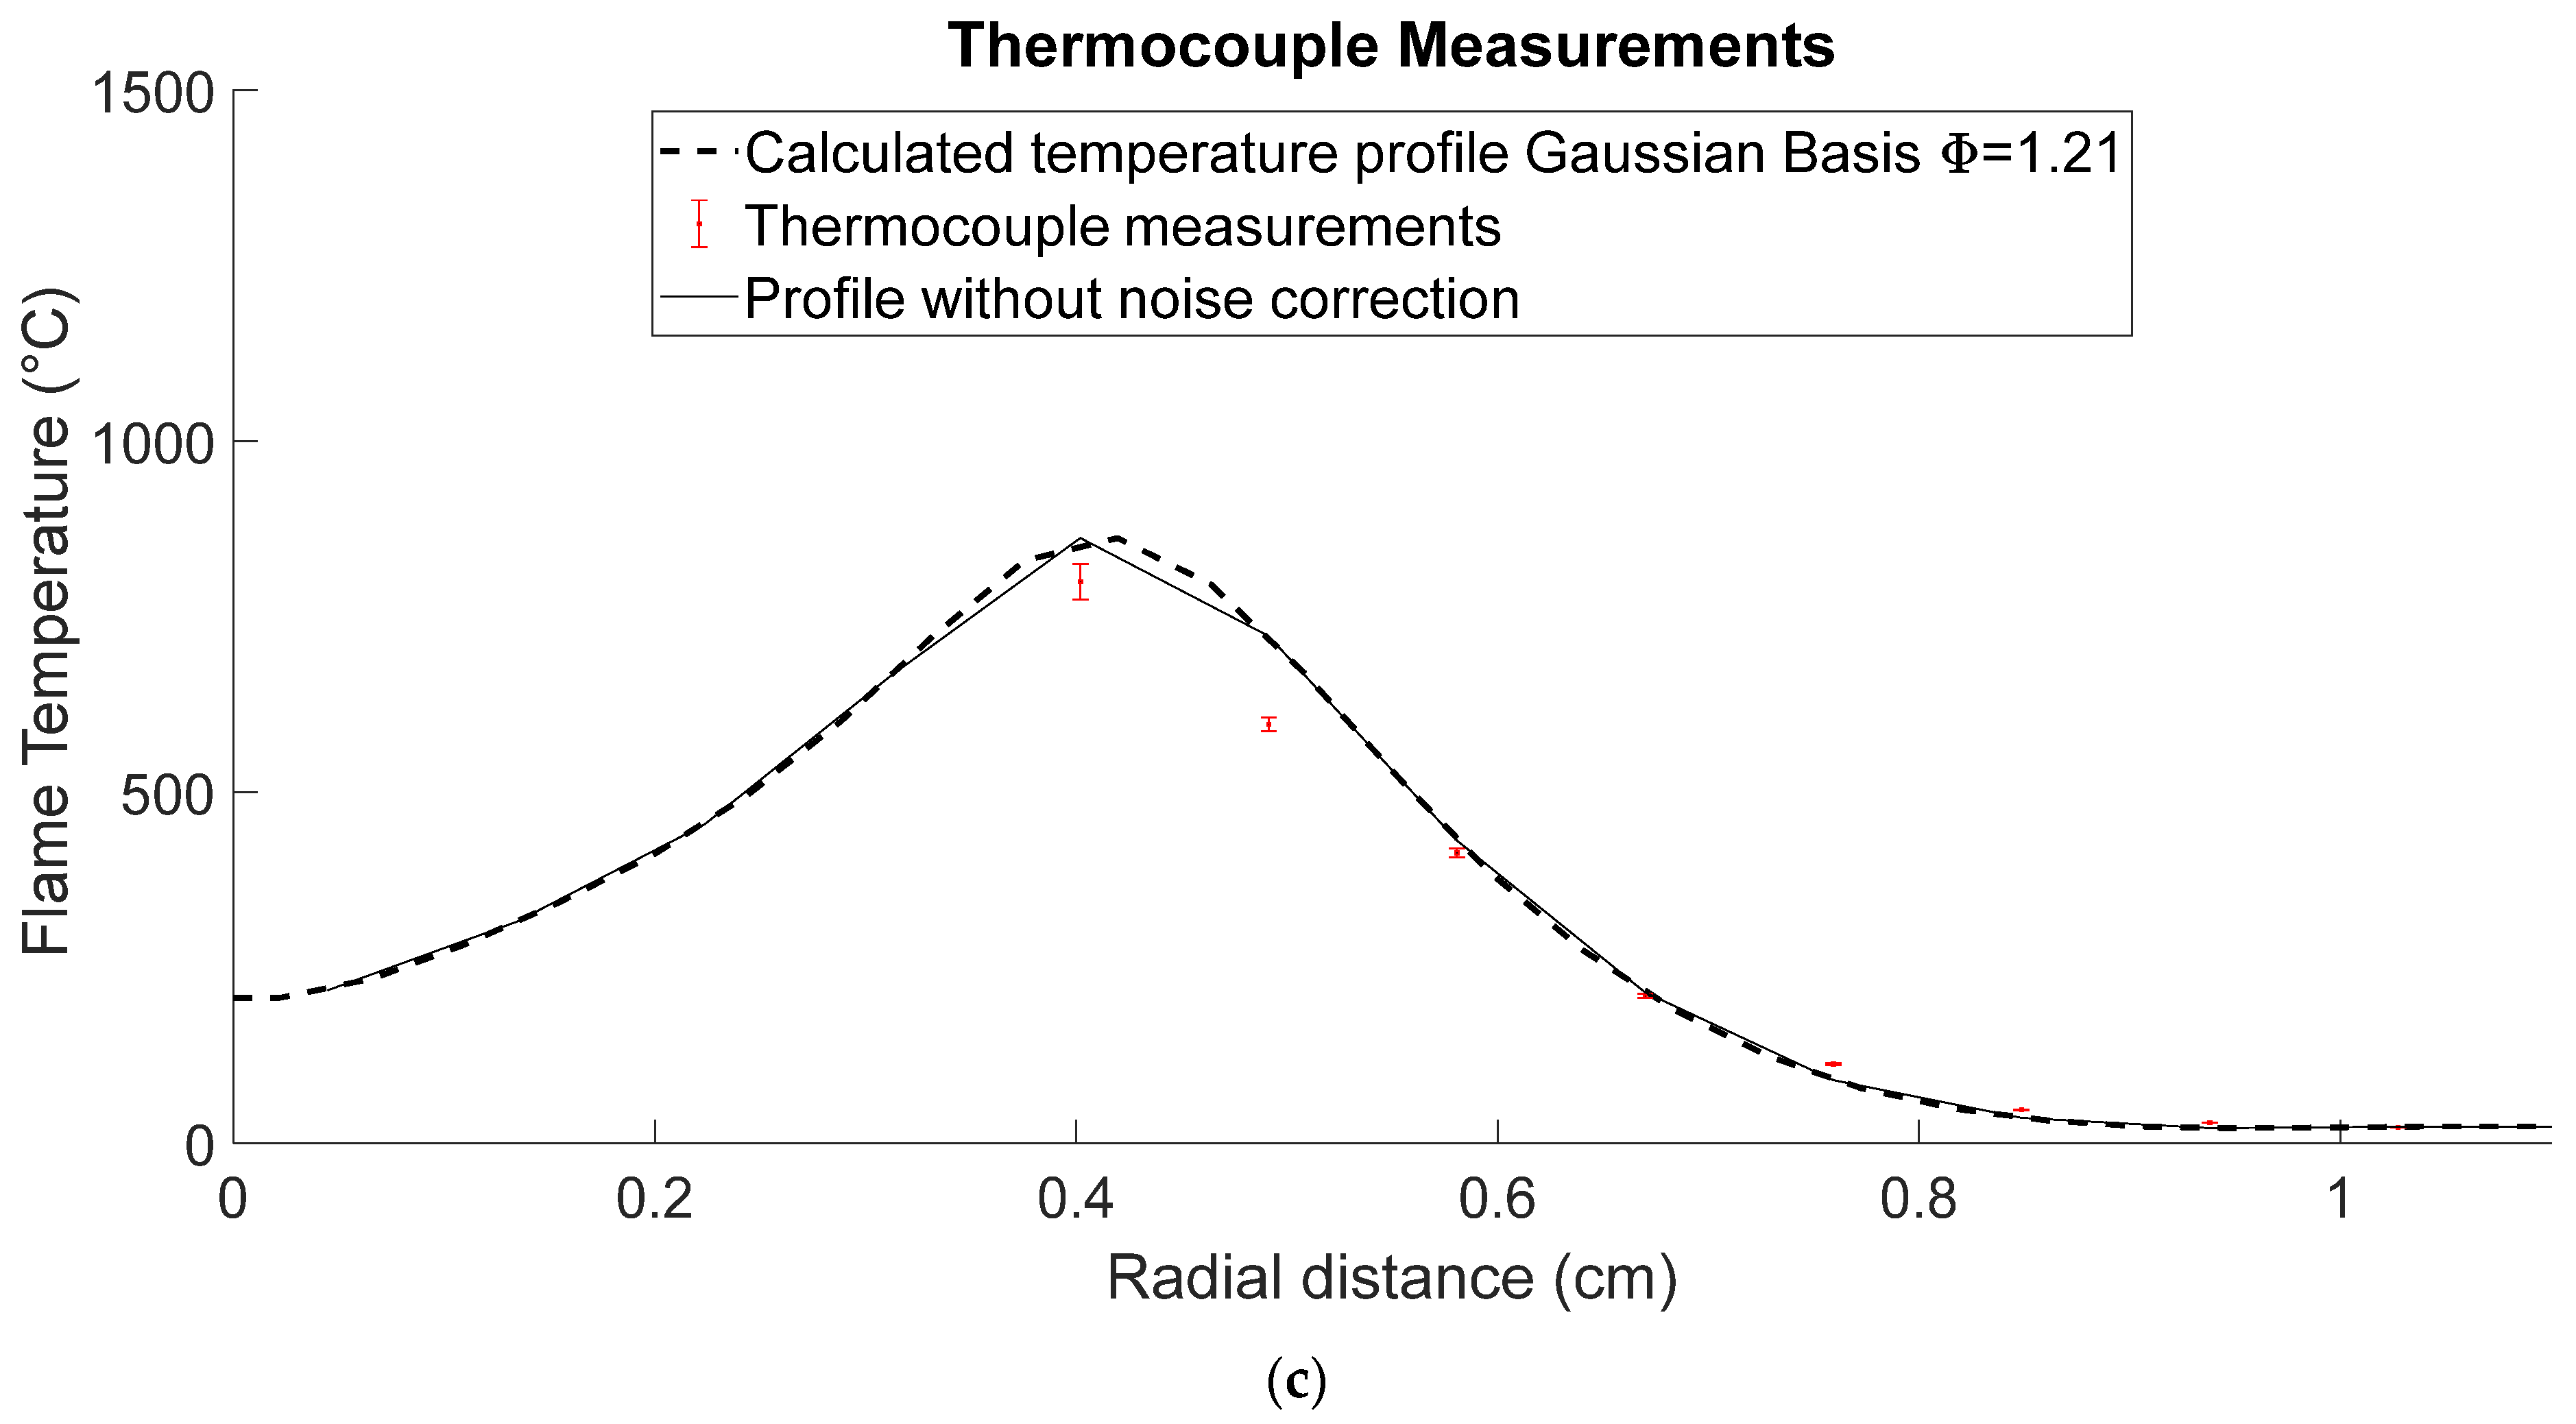
Figure 7a,b exhibits a difference between the profiles that rely on a clear distinction of regions for concentrations of radicals (continuous line form). Another fact is that this fitment algorithm can be used for temperature calculation from the data obtained by speckle displacements, as shown in
Figure 7c. Due to the nature of limited data from correlation algorithms and the use of an interrogation window, the algorithm helps improve the calculation of integration values, eliminating this limitation on data. However, this method can create a synthetic number of points to enhance the estimates of intensity and temperature cases [
17]. In the same
Figure 7c, a K-type thermocouple was used to corroborate different points’ temperature profile measurements. In
Figure 7c, the thermocouple measurements consider the error due to the direct contact between the thermocouple and the flame and exhibit a nonlinear behavior since, near the center of the flame, the error has a value approximately of
up to a minimum value of
in areas where the temperature is practically the ambient value. This is represented in the figure with their respective error bars.
As was expected, the results on the lobes with radical concentration are softened, and the mathematic function that describes the profile is calculated. Furthermore, the limited data are avoided by creating any number of calculated points without corruption on the original data. Another critical point is that the fitment curves shown in
Figure 7a,b have a mean discrepancy of less than 2% concerning each color channel and a coefficient of correlation of
, which gives certain trust in the calculated values.
In the next step, the crosstalk correction is applied to obtain the intensity values on the object plane. From
Figure 3, which has the spectral response of the camera, the
A coefficients using this graph can be determined as
,
and
. As a result, the system of Equation (12) can be rewritten as:
This crosstalk correction is applied to each color image (green and blue channel) for every case under analysis. Then, the reconstructed intensity profiles for each color channel for case
are shown in
Figure 8a,b; all the intensity values were normalized from zero to one on each color channel. This figure shows the regions with the presence of radicals
and
, in
Figure 8a, in the interval of height between 2–3.5 cm, approximately the presence of
is higher than
, while in
Figure 8b, the top of the flame has more appearance of
, which gives a visual result of the presence of these radicals. Another fact to consider is that results exhibit in all the flames a higher proportion of
. These results can be explained as a consequence of the camera construction that uses a Bayer filter, allowing a higher sensibility on this channel. In this study, all the camera settings were configured by default. Additionally, in
Figure 8c, the temperature field was obtained using the double amount of data in the Gaussian fitment proposed in this study. Note that the temperature field occupies a larger area than the flame because the convection flow around the flame is also considered in the calculation.
After applying the procedure to reduce the speckle noise and fit the profiles with a set of Gaussian functions to a specific case (
Φ = 1.21), we now determine the chemiluminescence values to the other experimental conditions shown in
Table 1. Note that the temperature fields are discussed elsewhere [
17]. Now, to determine the chemiluminescence values of each case under study (see
Table 1), the Lumenera Camera registered a set of 500 images to calculate the average intensities of the reconstructed profiles for the six cases related to the emissions of radicals
and
with the new improvement of PDE and gaussian basis, corresponding to green and blue color channels. These intensity values were normalized using the green channel’s maximum value.
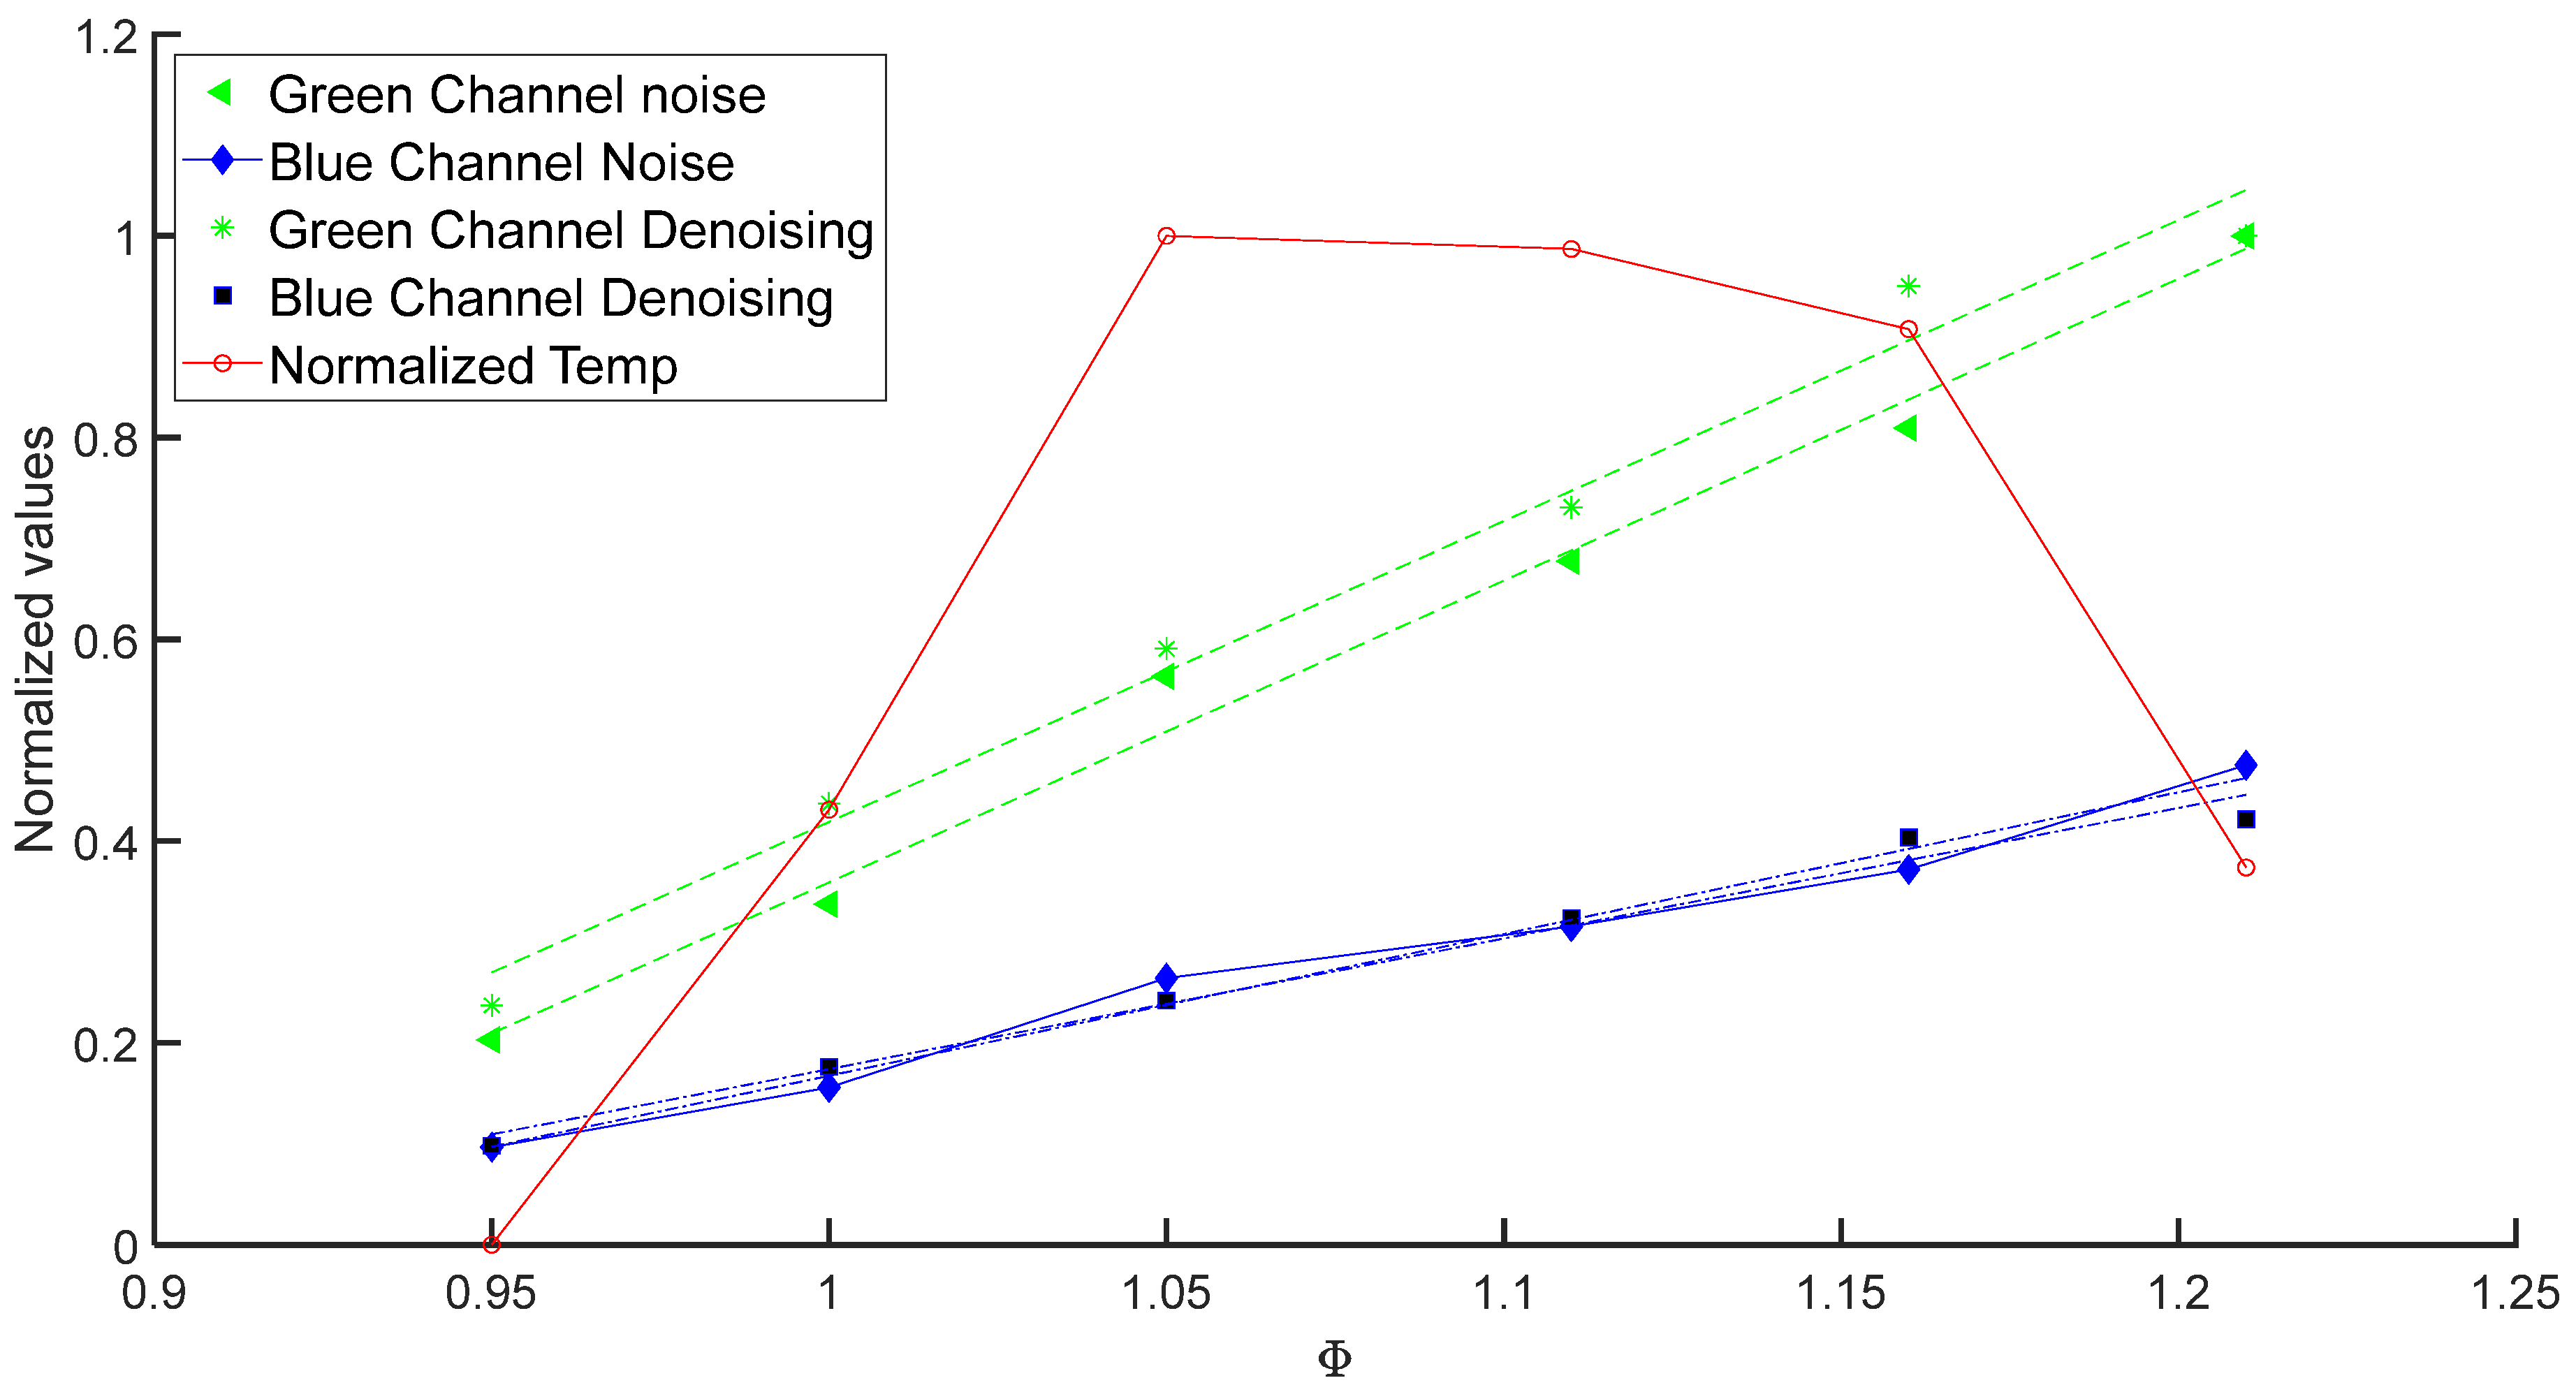
Figure 9 exhibits a linear behavior and a difference between the measurement of noising and denoising data from the green and blue channels, which in turn can improve monitoring of
and
at low ratios of the combustion process. Furthermore, the new measurements are from the deconvoluted intensity radiation that represents the three-dimensionality of the flame.
The maximum temperature value calculated for each experimental case is plotted in the same figure. As was expected, the maximum temperature value corresponds to a value of
[
1].
In this way, the approach presented in this work can simplify the monitoring temperature values,
and
at low ratios of a combustion process. The linearity fitment of the data has a value of
for each channel and the temperature case has a value of
.
Equation (14a–c) corresponds to a numerical fit of a first- and second-degree numerical function for chemiluminescence and temperature measurements, respectively. The fit was done considering normalized maximum chemiluminescence intensity and temperature.
Finally, this work’s optical system can measure temperatures ranging from 100 °C to 1800 °C. Moreover, chemiluminescence detection is of the order of four and forty-two intensity levels approximately. Fixed exposure time and camera gain values are assumed to register all cases studied. The present work is aimed at the study of flames with axial symmetry.
