Article

Technological Aspects of Methane–Hydrogen Mixture Transportation through Operating Gas Pipelines Considering Industrial and Fire Safety

1
Department of Petroleum Engineering, Saint Petersburg Mining University, 2, 21st Line, 199106 Saint Petersburg, Russia
2
Department of System Analysis and Management, Saint Petersburg Mining University, 199106 Saint Petersburg, Russia
*
Author to whom correspondence should be addressed.
Fire 2023, 6(10), 409; https://doi.org/10.3390/fire6100409
Submission received: 1 September 2023 / Revised: 18 October 2023 / Accepted: 19 October 2023 / Published: 23 October 2023
(This article belongs to the Special Issue Hydrogen Safety: Challenges and Opportunities)

Abstract

:
Pipeline transportation is widely regarded as the most cost-effective method for conveying substantial volumes of hydrogen across extensive distances. However, before hydrogen can be widely used, a new pipeline network must be built to reliably supply industrial users. An alternative way to rather expensive investments in new infrastructure could be to use the existing pipeline network to add pure hydrogen to natural gas and further transport the gas mixture in an industrially safe way. The new solution necessities will be examined for compression, transportation, and fire hazard accidents, which have not been scrutinized by other scholars. This study presents the results of a comprehensive analysis of the methane–hydrogen mixture compression process and a mathematical description of the main pipeline operation during gas mixture transportation, considering industrial fire safety issues. By examining a case study involving a main gas pipeline and its associated mathematical model for hydrogen transportation, it becomes feasible to assess the potential hazards associated with various leakage areas and the subsequent occurrence of fires. The findings of this investigation demonstrate that the spontaneous combustion of hydrogen due to leakage from a natural gas pipeline is directly influenced by the proportion of hydrogen present in the gas mixture. If the hydrogen percentage reaches a balanced ratio of 50–50%, it is plausible that the equipment at the compressor station could be subject to detrimental consequences, potentially leading to accidents and fires. Furthermore, the obtained results from modeling in ANSYS Fluent software propose two practical scenarios, which demonstrate that despite the limited research conducted on the safety aspects and the occurrence of fires during the operation of hydrogen gas pipelines, industrial and fire safety necessitate the inclusion of hydrogen transport infrastructure as a pivotal element within the broader framework of hydrogen infrastructure development.

1. Introduction

Hydrogen is widely recognized as a significant prospective energy carrier that holds promise for providing sustainable, dependable, and economically viable potential energy for industrial applications. Applications include the use of hydrogen for the long-term balancing of electricity production with grid needs by utilizing locally available resources such as wind, biogas, solar, or nuclear resources, depending on the production regions and industry sectors [1,2,3]. Hydrogen possesses the capability to be employed in hydrogen fuel cells or to facilitate the restoration of electricity in gas turbines [4,5]. One of the major obstacles to the transition to a hydrogen economy is the difficulty of developing a reliable and cost-effective hydrogen delivery system [6,7,8]. The hydrogen gas delivery pathway includes compression, storage, and transport [6]. Some operations, such as compression, occur at multiple points between the production facility and the consumer. Pipeline transmission appears to be the most economical means of transporting large quantities of hydrogen over long distances [9,10,11]. According to a comprehensive analysis of the existing literature, it has been determined that the cost of transporting hydrogen through pipelines is approximately 30–50 percent higher in comparison to natural gas [12,13]. One way to reduce the cost of pipeline transport for hydrogen is to blend it with natural gas [14,15,16]. Several variants of hydrogen market development are possible: 1. a hydrogen-containing gas mixture can be transported for export through pipeline systems to end users, and 2. hydrogen can be extracted and used to meet the needs of industry in the domestic market. Under appropriate conditions and relatively low concentrations of hydrogen, blending may require little change in the operation and maintenance of the pipeline system. Based on existing research, it has been observed that incorporating less than 10% to 25% hydrogen by volume into natural gas blends generally leads to only minor challenges, contingent upon specific conditions and the composition of the natural gas. Further investigations have been conducted in previous studies [17,18,19] to provide a more comprehensive analysis of the volume of hydrogen admixture in natural gas. More significant problems arise at higher hydrogen volume fractions in the range of 25–50%. Fractions above 50% present various challenges across multiple domains, encompassing considerations such as the selection of appropriate piping materials, ensuring safety measures, and implementing necessary system modifications to accommodate end-use devices. Thus, Lurie [20] considered the underwater section of the main gas pipeline “Nord Stream” as an example. In their study, they outlined the theory of the calculation of methane–hydrogen mixture movement in gas pipelines, including those with a large difference in altitude and high and ultra-high pressures (from 10 to 25 MPa). The calculation theory considers the fractional composition of the transported mixture. In a different study by Golunov [21], they proposed their own variation of the calculation of methane–hydrogen mixture transportation along the section of the Nord Stream-2 gas trunkline. The calculation of methane–hydrogen mixture transportation can be represented in the system of equations for the unsteady operation of a high-pressure gas pipeline, which was thoroughly expanded upon by Lurie et al. in their publication [22].
The overall findings derived from the outcomes of the studies presented in the papers regarding the introduction of hydrogen in low concentrations to pre-existing gas pipeline systems, specifically at levels not exceeding 25 percent, indicate that this blending approach is associated with marginal elevation in the potential for ignition.
However, adding more hydrogen to a pipeline line results in a significant increase in overall transport safety risk. Furthermore, these levels of risk are associated with the introduction of hydrogen mixtures into existing gas pipelines and do not apply to new pipelines specifically designed to transport hydrogen, which require necessary design and management, unlike existing hydrogen pipelines in Europe and the USA. Any introduction of hydrogen mixture concentrations will require extensive research, testing on existing pipelines, mixture compression processes, monitoring, and the maintenance of pipeline systems.
One of the subsequent significant challenges involves the careful consideration and implementation of a dependable compression technology that is both economically viable and energy efficient. This technology should be capable of handling high hydrogen concentrations and achieving a minimum mass flow rate [23]. In the studied case which was conducted by Bolobov et al., the minimum mass flow rate was 1.03 kg/s. There are two compression technologies available for hydrogen: reciprocating compressors and centrifugal compressors. For gas compression, reciprocating compressors are typically used for volume flow rates less than 0.472 m3/s [24]. Centrifugal compressors are the recommended choice for applications involving high flow rates. However, centrifugal compressors pose more operational problems than reciprocating compressors. Because of the low molecular weight of the mixed gas with a high hydrogen concentration, higher circumferences are required, which in turn requires the use of different materials [25]. To achieve high hydrogen pressures, these compressors require multiple stages operating at high rotational speeds, as well as special seals and high mechanical tolerances. Centrifugal compressors designed to handle hydrogen are under development under an EU program called “The Hy Under Project” [26].
For process modeling, they used the Aspen Plus software package [27] to calculate the thermodynamic properties of the gas mixture flow under the required conditions and to quantify performance and transport [27,28]. The Peng–Robinson equation of state [29] and the newly developed Klaus Ludtke-modified Lee–Kesler equation of state [30] were both used to accurately calculate the thermodynamic parameters of the methane–hydrogen mixture under real gas behavior. These equations of state parameters are the most suitable and applicable equations for the appropriate calculation of the thermodynamic parameters of the methane–hydrogen gas mixture under real gas behavior conditions. Because the pressure losses during the transport of a methane–hydrogen mixture under conditions of real gas behavior were estimated using the Beggs and Brill empirical correlation method, they had more efficient results in their studies.
Even though numerous investigations have been conducted to examine the phenomenon of hydrogen ignition resulting from gas pipeline leakage within a confined environment, the results obtained through modeling in ANSYS Fluent software coincided with the patterns observed in other scientific studies that investigated the scenario of hydrogen propagation resulting from the rupture of a methane gas pipeline. The primary objective of the initial scenario is to generate a volumetric fire by simulating a gas pipeline explosion. This outcome is contingent upon the propagation of both the shock wave and the thermal field. The second calculation involves examining the interdependencies between the hydrogen concentration in the gas mixture and natural gas. It focuses on analyzing the effects of hydrogen concentration, temperature, and pressure on the system.
The structure of this study is organized as follows: Section 2 provides research methods and describes the possibility of hydrogen transportation through the existing gas pipeline network with due regard to fire safety and the proposed model. Section 3 presents the results of the study and discusses fire risk assessment. Section 4 and Section 5 are devoted to the discussion and the conclusions and recommendations for further studies respectively.

2. Materials and Methods

2.1. Possibilities of Hydrogen Transportation through the Existing Gas Pipeline Network with due Regard to Fire Safety

In the process of transporting a methane–hydrogen mixture, the most important problem is finding the maximum safe transport distance. At a given pressure, the pressure drop along the pipeline depends on the flow velocity, ambient temperature, insulation layer, and geometrical characteristics of the pipeline, such as diameter, length, and height variation [31,32,33]. Pressure drops and temperature changes along the pipeline reduce the gas density and increase the velocity, which in turn increases the pressure drop and therefore creates throttling conditions over a certain distance [34,35]. Any optimization must consider the effect of ambient temperature [36,37] due to the importance of heat transfer between the gas in the pipe and the environment along the pipeline [38,39]. In gas transport, the pipeline can be buried and insulated to minimize heat losses [40,41]. The implementation of an underground pipeline mitigates pressure drops and subsequently minimizes energy [42,43] losses within the system, albeit at the cost of heightened investment and operational expenditures. In this study, maximum and minimum ambient temperatures were assumed, which can reach +45 and −65 °C. A layer of thermal insulation was also assumed on the outer surface of the pipe to prevent corrosion by preventing direct contact with the steel [44,45]. The pipeline is assumed to be at least 0.8 m underground. As an example, an underground insulated gas pipeline with an internal diameter of 1000 mm, insulated with 5 cm of foam glass, is considered. The following formula determines the heat transfer coefficient from gas to the environment for an underground main gas pipeline [46]:
K m = R i n + 1 α g 2 ,
a g = λ g 10 3 · d m · 0.65 + 10 3 · d m H 0 + λ g a B 2 ,
α a i r = 6.2 + 4.2 v ,
where R i n is the thermal resistance of the pipeline insulation, m2K/W; a a i r is the heat transfer coefficient from the pipeline to the ground, W/m2K; H 0 is the depth of the pipeline axis from the ground surface, m; λ g is the heat transfer coefficient of the ground, W/mK; and α a i r is the heat transfer coefficient from the ground surface to the atmosphere, W/m2K.
It is assumed that the temperatures of the inner wall of the pipe and the gas in the same cross-section are equal. The pipe wall thickness g in meters is given as:
g = p m a x · d 2 2 S E F ,
where p m a x is the maximum working pressure in the pipeline (MPa); d2 is the outside diameter of the pipeline (m); S is the specific yield strength of the pipe material (MPa); E is the longitudinal weld coefficient (reflecting the different types of longitudinal welds in the pipe); and F is the design factor (introduced to add a safety margin to the wall thickness calculation).
For estimating the pipe wall thickness in this study, the maximum pressure is assumed to be 9.8 MPa, the longitudinal weld coefficient is 1.0; and the design factor is 0.72. The pipe strength class K 5, yield strength N/mm2 (kgf/mm2) σ T = 343 (35), is set in the range of 483 MPa. Based on the above data, the calculated pipe wall thickness g is 30 mm for a 1000 mm pipeline, and the distance between the ground surface and the center of the pipe is z = 1.25 m. The heat transfer coefficient k between the air and the mixture calculated by Equation (1) is 1.5 W/m2, Figure 1.

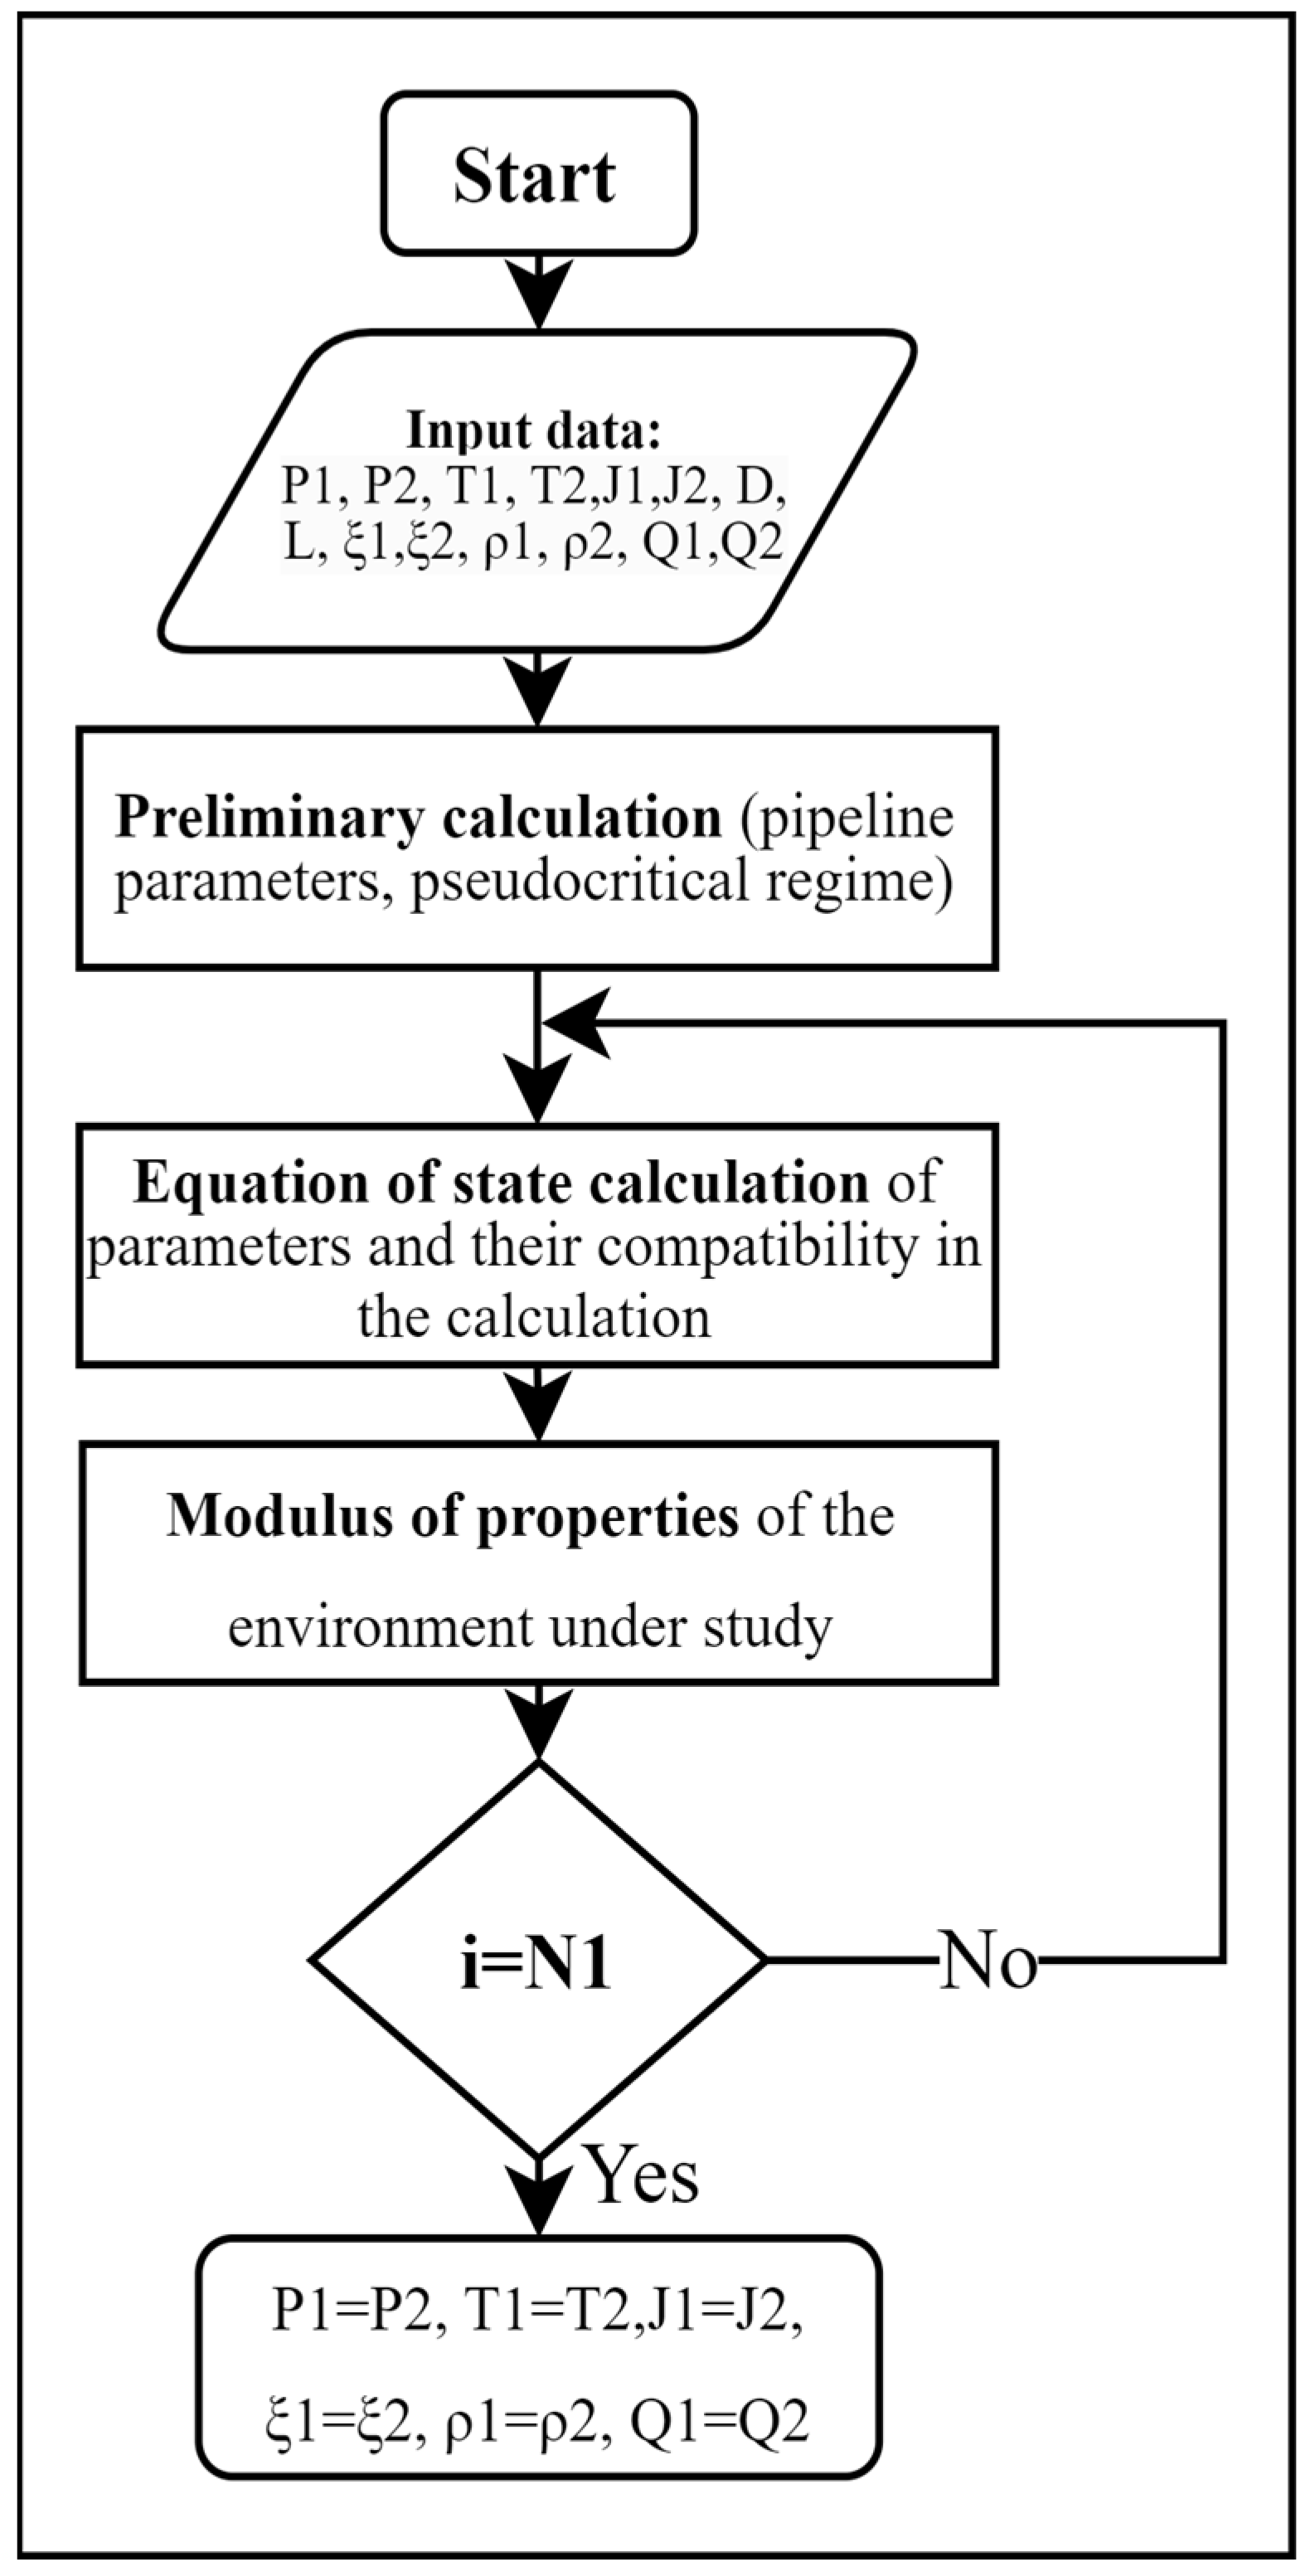
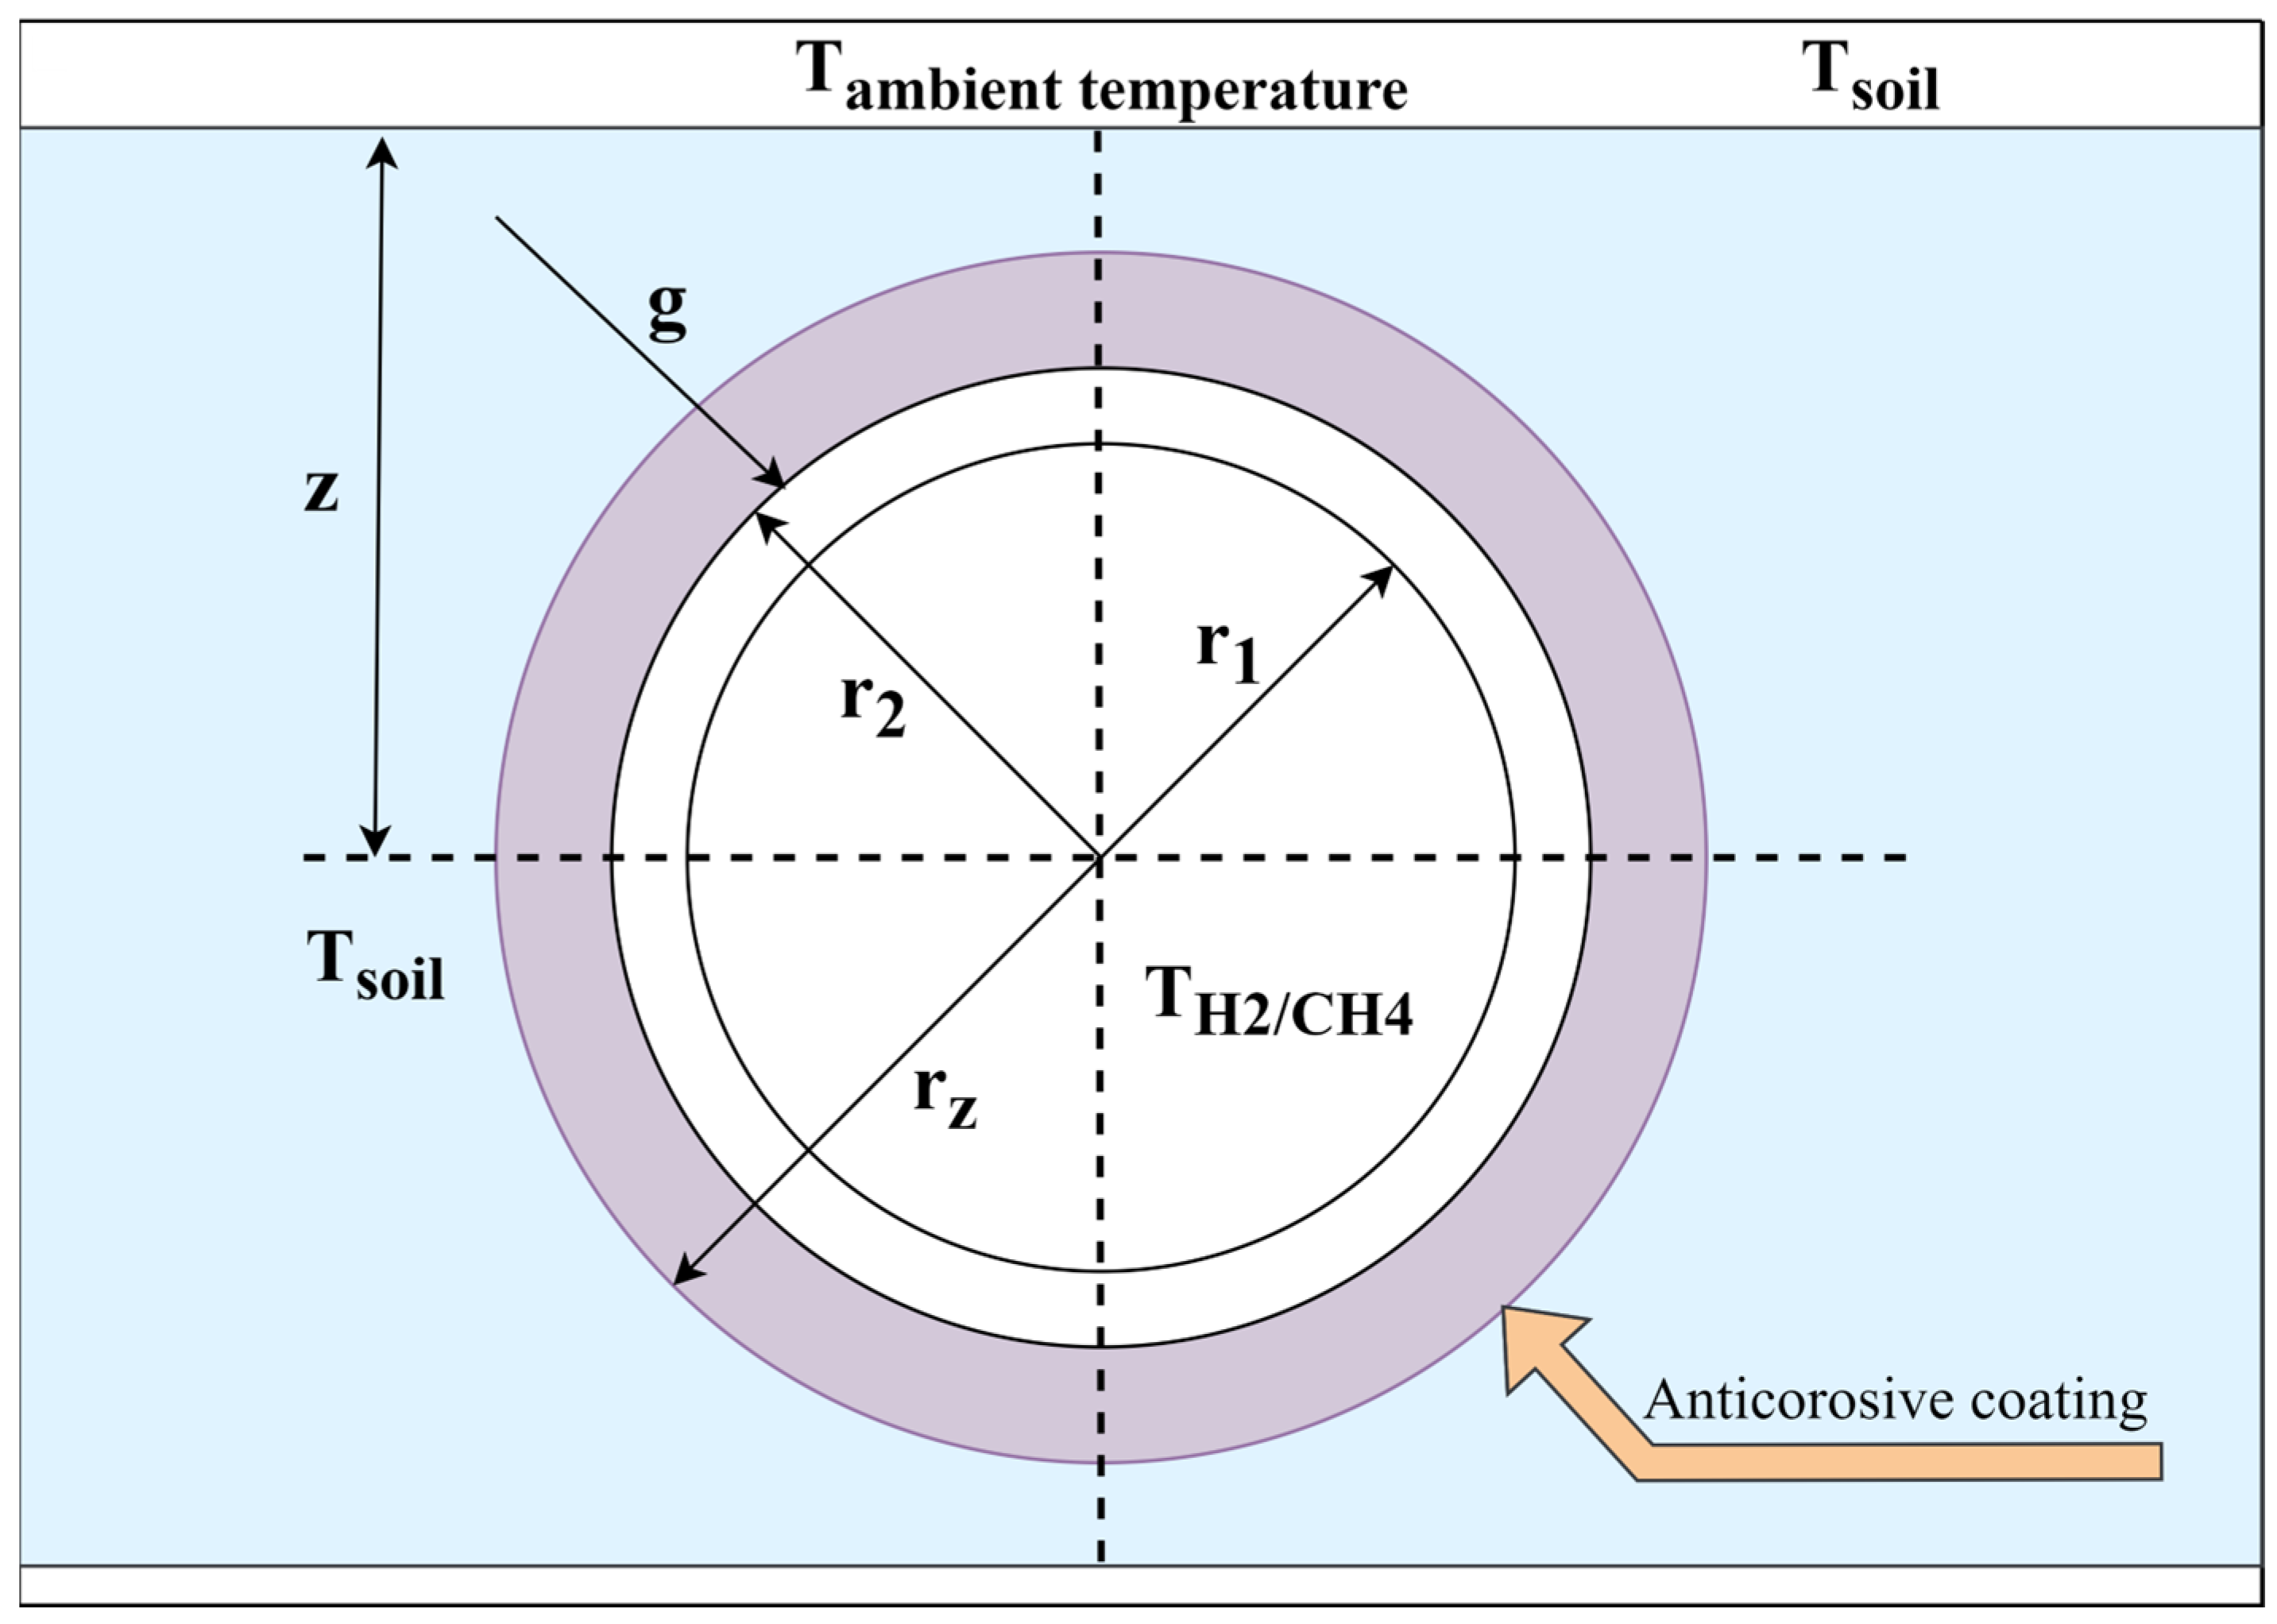
2.2. Model of Methane–Hydrogen Mixture Transportation

As an important step in the use of pure hydrogen in the smooth operation of an existing gas pipeline designed to transport natural gas exclusively, it is necessary to know the hydrogen volume content ratio. For this purpose, a hydrodynamic model is calculated to quantify the friction losses and energy efficiency of the transport of methane–hydrogen mixtures along a linear section of the pipeline. Simultaneously, it is important to acknowledge that the adoption of hydrogen as an energy source may result in elevated energy expenses due to the displacement of methane, which possesses a higher density compared to hydrogen’s lower density.
When conducting a model of the stationary mode of a compressor station for the transportation of methane–hydrogen mixtures, the following independent variables can be utilized: P H 2 i 1 is the pressure at the inlet to the centrifugal blower, and J H 2 i 1 is the mass flow rate of the methane–hydrogen mixture in the process working pipe at the compressor station, which is represented in the following equations:
J H 2 i 1 P H 2 i 1 = S r i 1 P i n 2 P i 1 2 P H 2 i n · ρ H 2 i n ;
S r i j = π D i j 2 4 l i j ξ i j ,
jH2 = 1, 2;
where ρ H 2 i n is the density of the methane–hydrogen mixture at the inlet of the compressor station and is estimated using the applied simplified equation of state for natural gas considering the addition of pure hydrogen in the gas pipeline, and i is the number denoting the belonging of this parameter to the branch with the i-th centrifugal blower.
Equation (8) below uses the pressure variable P H 2 i 1 of Formula (3) in the augmented form:
P H 2 i 1 J H 2 i 1 = P H 2 i n 2 P i n 2 J i 1 2 ρ H 2 i n S r i 1 2 ;
In modeling, when hydrogen and methane flows are separated at the inlet group of gas pumping units, the process is isothermal. Local resistances in the branching zone of process gas pipelines are neglected to avoid throttling. The pressure distribution in the branching zone is static, i.e., the pressure after the branching zone is equal to the pressure before the branching zone P H 2 i n . The temperature T H 2 i n of the methane–hydrogen mixture before and after the branching zone will take the form of a constant value. Provided that the mass flow rates before and after separation NH2 of the gas mixture flows in the inlet manifold are kept constant, it will take the following form:
J H 2 i n i = 1 N H 2 J H 2 i 1 = 0 ;  
P H 2 i n > P H 2 i 1 J H 2 i 1 > 0 i = N ¯ H 2 .
Provided that there are no countercurrents, inequalities (9) and (10) represent Kirchhoff’s first law. To exclude the occurrence of counterflows in the gas mixture and to analyze the situation at the shutdown of gas compressor units, inequalities (9) and (10), depending on the set of independent variables, can be applied alternately. In the case of the stationary operation of the compressor station pipeline system, the mass flow rates are equal in accordance with the law of conservation of mass. With the help of the Stepanov A.’s mathematical model and considering the isothermal mode of operation, it is possible to establish functional, unambiguous dependencies.
P H 2 i 2 = P H 2 i 2 n H 2 i , T H 2 i n , P H 2 i 1 J H 2 i 1 ρ H 2 i 1 P i H 21 ,
i = N ¯ 1 ;
T H 2 i 2 = T H 2 i 2 n H 2 i , T H 2 i n , P H 2 i 1 , J H 2 i 1 ρ H 2 i 1 P H 2 i 1 ,
i = N ¯ H 2 ;
N H 2 d r i v e , i = N H 2 d r i v e , i n H 2 i , T H 2 i n , P H 2 i 1 , J H 2 i 1 ρ H 2 i 1 P H 2 i 1
i = N ¯ H 2 ;
ρ H 2 i 2 = ρ H 2 i 2 P H 2 i 2 = ρ H 2 i 2 n H 2 i , T H 2 i n , P H 2 i 1 , J H 2 i 1 ρ H 2 i 1 P H 2 i 1 ,
i = N ¯ H 2 ;
where P H 2 i 2 is the pressure of the methane–hydrogen mixture at the outlet of the i-th centrifugal blower; n H 2 i is the shaft speed of the i-th centrifugal blower; T H 2 i n is the temperature of the methane–hydrogen mixture at the outlet of the i-th centrifugal blower; ρ H 2 i 1 is the density of the methane–hydrogen mixture at the inlet of the i-th centrifugal blower, which is determined by the equation of state; N H 2 d r i v e , i is the power supplied to the shaft of the i-th centrifugal blower from the gas turbine unit through the coupling; and ρ H 2 i 2 is the density of the methane–hydrogen mixture at the outlet of the i-th centrifugal blower, which is determined by the equation of state.
Behind the centrifugal blower, considering the isothermal process, the temperature of the methane–hydrogen mixture, which is delivered in portions in the outlet manifold, will have different limits.

3. Results

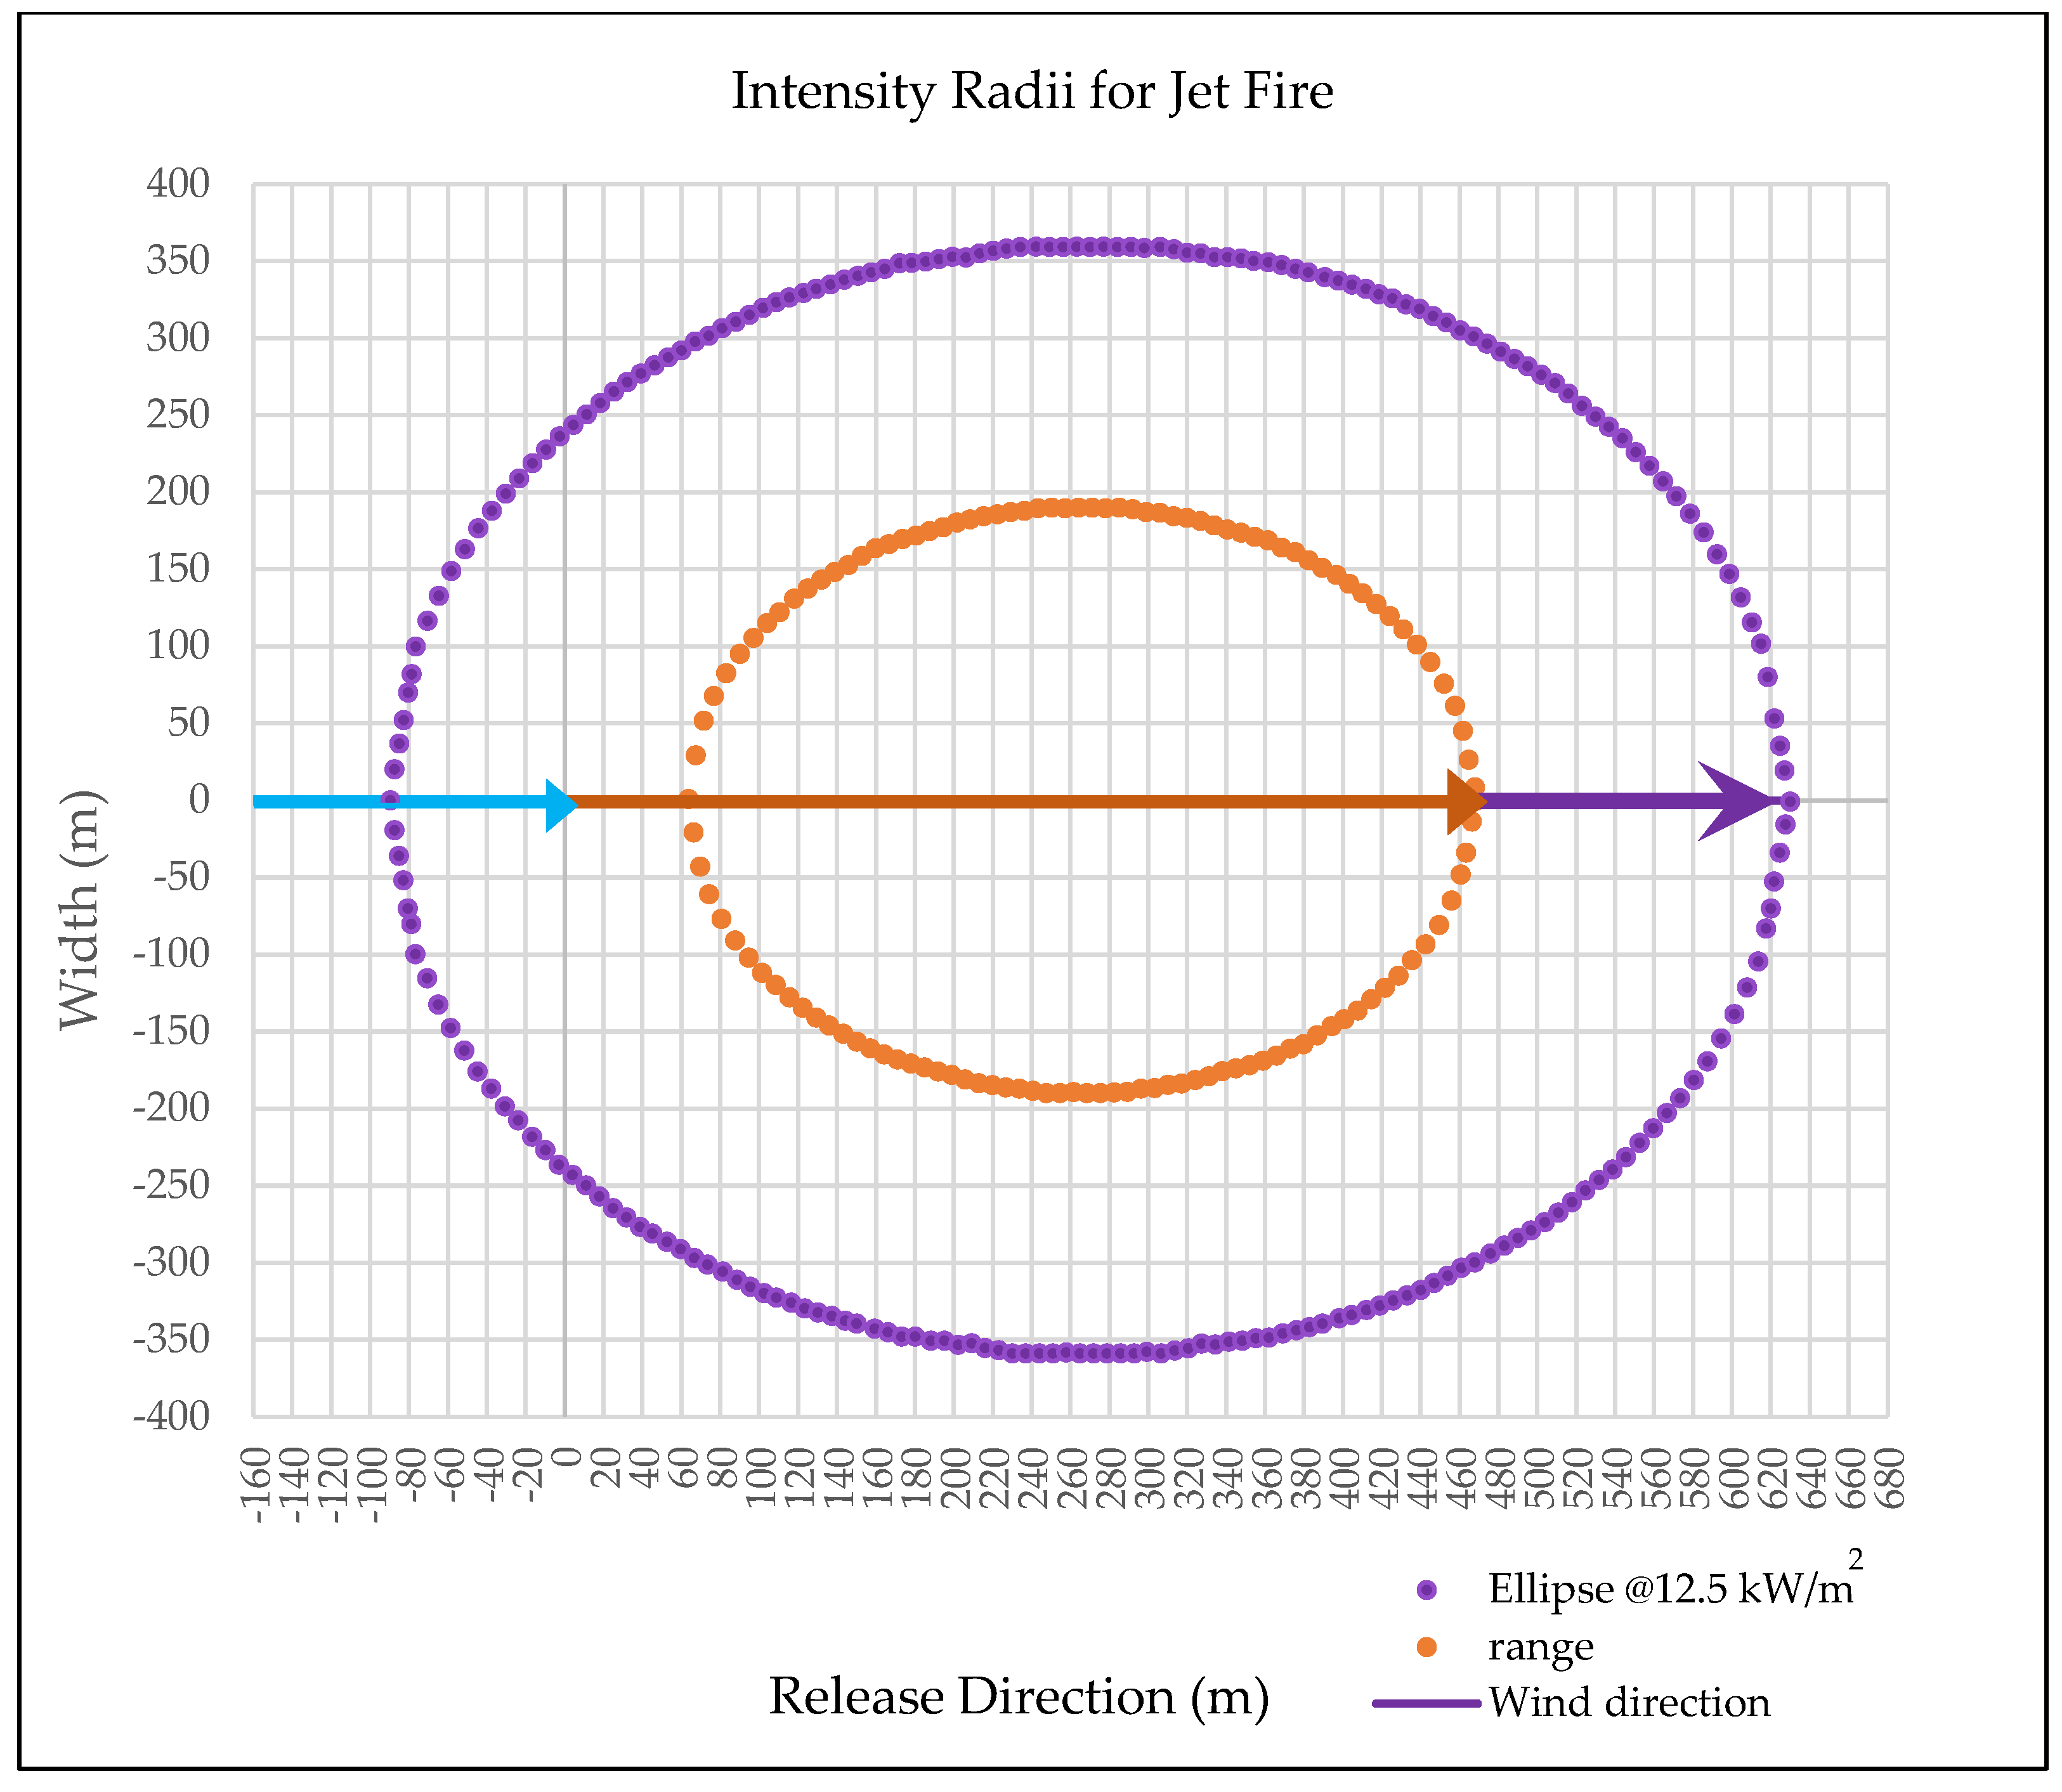
Fire Risk Assessment Considering Industrial Safety in Case of Hydrogen Leakage on the Pipeline

To evaluate the potential fire hazard associated with the operation of a gas pipeline designed for the transportation of a methane–hydrogen mixture, it is imperative to conduct hydraulic calculations pertaining to the pipeline. To achieve this, the computation was executed utilizing the algorithm depicted in Figure 2.
Figure 2. The algorithm for performing calculations.
Fire 06 00409 g002
where P 1 is the pressure in the upstream gas pipeline; P 2 is the pressure at the end of the pipe; Q 1 is the gas mixture flow rate at the beginning of the leak; and Q 2 is the gas mixture flow rate at the full pipeline rupture.
The first step of the presented algorithm is to enter the values of several input parameters, such as inlet pressure, pipeline length, linear length, internal diameter, ground temperature, inlet and outlet gas temperature, gas mixture flow rate, natural gas composition, thermodynamic parameters for each component of the gas mixture, average gas temperature, and hydrogen and methane density. In the next step, the outlet pressure (at the end of each pipeline section) and other gas parameters such as density and velocity are calculated in Table 1. The calculation process is repeated until the last section of the pipeline, after which the results obtained for each section of the pipeline are compared with the results for the entire length of the pipeline. The algorithm can be modified or extended with additional parameters or dependencies, such as changes in gas mixture components and temperature at each pipeline section.
To carry out a comparative assessment of fire risks on an operating gas pipeline, an assessment was carried out between different hydrogen concentrations with the same gas velocity in the pipe at the inlet (=20 m/s) and temperature (=300 K), with the internal diameter of the pipeline DN = 1000 mm.
Hydrogen jet fires due to gas pipeline ruptures have an inherently smaller flame size and emissivity and, consequently, thermal radiation compared to natural gas. And the distance of thermal radiation (the estimation of thermal radiation is significantly influenced by the presence of wind) decreases due to the decrease in the view factor and the increase in atmospheric radiation for a certain distance, m. In a pipeline accident, when hydrogen is present, the heat emission region is lower than that of natural gas, which affects the level of damage to infrastructure and people. Damage to the surrounding area (buildings, the environment, and people) decreases much faster with distance. In the open-source analysis, hydrogen exposure is 300–400 m from the accident site; in the case of a ruptured natural gas pipeline, this value is 500–800 m.
To be able to see the process occurring in the pipeline and after the rupture, the authors carried out modeling using the software ANSYS Fluent, and by comparing the data, they obtained a calculation of the time and distance of flame propagation. To solve this problem, the authors analyzed some interesting papers on pure hydrogen and methane–hydrogen leakage fires. Thus, in a scientific paper [47], the authors presented their technical ideas to the reader and analyzed accidents in hydrogen pipeline structures. The authors of [48,49,50] modeled the fire jet of a methane–hydrogen mixture using CFD Fire FOAM and calculated the flame length that results from an accident in which the reflectivity does not affect the surface emissivity or radiant fraction [51]. The authors, in their work [52,53], showed the use of a new thermal radiation method for calculating large fires using the methods of shear stress transfer and eddy dissipation. And in another work [54,55], the authors modeled and calculated the dangerous distance in various cases of accidents on the gas pipeline and its consequences. Kuibin et al. [56] carried out numerical modeling using the accident analysis equation for a pipeline transporting hydrogen.
During the research, a section of a pipeline with a pipe diameter of 1000 mm was modeled, which runs along a country road with an internal pressure of 7.5 MPa, the result of an accident, a leak from a crack, and a wind speed of 5–6 m/s, the direction of the methane leak is the hydrogen mixture is vertical, ignition occurs within 0.10 s after the gas pipeline ruptures, and the atmospheric temperature is 25 °C. The main buildings are auxiliary premises for organizing gas pipeline measurement; along the gas pipeline, there are water crossings 100 m long and 10 m wide, and there are emergency valves every 50 m. The flame and the temperature-dependent range of heat flow change because of a pipeline rupture (Figure 3 and Figure 4). The parameters are also presented in Table 1.
The flame variation and heat flow range are represented by a region moving vertically upward, and after the pipe ruptures, the hydrogen volume fraction contours in the X, Y, and Z planes are released into the atmosphere from the inlet section of the pipe. However, the modeling did not consider diffusion during a sharp decrease in pressure in the pipe. This is clearly visible in Figure 4. The calculation results and subsequent calculations in ANSYS Fluent are based on a small transient process, that is, 10 s after the start of the fire, the temperature begins to rise (a) and then decreases (b), as shown in Figure 4. Further along the temperature trend (Figure 5), you can see the spread of the shell of a dangerous fire, while the vibrations are turbulent in nature.
The orange line indicates thermal radiation exposure over 480 m, and the purple line indicates thermal radiation exposure over 680 m.
From Figure 4 and Figure 5, the height of the flame that is ejected from the pipe and the distance at which the effect of thermal radiation is accompanied (the orange line) are directly related to the wind speed (the blue line) at which the accident occurred. Obviously, the flames of the fire will be tilted by the wind in the direction in which they blow, and because of this, thermal radiation will expand and have a not-clearly round shape, represented in the figure by a violet line. At the same time, it must be considered that with an increase in wind speed, the height of the flame decreases, but the impact of thermal radiation increases significantly.

4. Discussion

There are multiple factors that can contribute to explosions and fires occurring during the operation of main gas pipelines while pumping methane–hydrogen mixtures. These can be third-party interference in the pipeline system operation, as well as problems of a technological nature, corrosion, flange joint defects, factory defects, environmental impact, and human factors.
According to the length of the pipeline, the presented algorithm for calculating hydrogen pipeline transport is a straightforward tool for determining the main thermodynamic parameters of the transported gas medium. This algorithm is useful for calculating the pressure drop and predicting the occurrence of an emergency to prevent pipeline ruptures. The presented algorithm can be improved or modified by introducing some other additional elements affecting the pipeline transport of hydrogen or a mixture of methane and hydrogen that will increase its safe operation and the accuracy of the calculated parameters. Since the mole fraction of H2 in the H2/CH4 mixture causes smaller pressure drops during pipeline transport, it leads to a smaller increase in the flow rate of the methane–hydrogen mixture. The question of the efficiency of hydrogen transport through pipelines may possibly be considered along with the question of its safety.
In further research, all these issues need to be addressed to answer questions on the safety and energy efficiency of the entire pipeline system more accurately, through which hydrogen is to be transported.

5. Conclusions

This article presents a study of the use of the main gas pipeline as a transport medium for a methane–hydrogen mixture considering the issues of industrial fire safety. The study examined the possible influence of the methane–hydrogen mixture in the operation of an existing gas pipeline and calculated the distance of impact of an accident when a gas pipeline ruptures, which is determined by the magnitude of the thermal field. These data can provide technical support in determining the safe distance from gas pipelines that have been converted to transport a methane–hydrogen mixture.
The thermal field was changed considering changes in wind speed. The calculations considered the following parameters: leakage rates of the methane–hydrogen gas mixture, wind speed, and the percentage of the hydrogen mixture in natural gas. From the results obtained, we can conclude that the intensity of the change in the thermal field depends on the level of intensity of thermal radiation as a result of a pipeline rupture with the following parameters: % hydrogen concentration in natural gas (comparative assessment and calculation of the risks of fire in and rupture of the pipeline, the influencing factor of which is the percentage of hydrogen content), the pressure created in the pipeline section, and the diameter of the pipe through which the gas mixture is transported.
It is imperative to address the following limitations: the insufficiency and need for additional advancement of regulatory frameworks that govern the specifications for hydrogen transportation; concerns regarding safety [57,58,59]; expenses related to the establishment of technological infrastructure (“ensuring safety in production, transportation, storage, and distribution”); fire safety in industrial emissions; and the energy consumption associated with the hydrogen transportation process.
Despite the economic advantages of hydrogen transportation via pipelines, limited research has been conducted on the safety aspects and the occurrence of fires during the operation of hydrogen gas pipelines.
Simultaneously, it is important to acknowledge that when the volume fractions of hydrogen in natural gas reach higher levels within the range of 15% to 25%, notable concerns regarding industrial and fire safety may arise. These concerns encompass various aspects such as the suitability of pipeline materials, the assurance of safe transportation, and the necessity for equipment upgrades at compressor stations.

Author Contributions

Conceptualization, methodology, validation, formal analysis, investigation, resources, data curation, writing—original draft preparation, visualization, supervision, project administration, and funding acquisition, V.F.; writing—review and editing and visualization, H.D.; supervision, V.M. All authors have read and agreed to the published version of the manuscript.

Funding

This research received no external funding.

Institutional Review Board Statement

Not applicable.

Informed Consent Statement

Not applicable.

Data Availability Statement

Not applicable.

Conflicts of Interest

The authors declare no conflict of interest.

References

  1. Deymi-Dashtebayaz, M.; Ebrahimi-Moghadam, A.; Pishbin, S.I.; Pourramezan, M. Investigating the effect of hydrogen injection on natural gas thermo-physical properties with various compositions. Energy 2019, 167, 235–245. [Google Scholar] [CrossRef]
  2. Ebrahimi-Moghadam, A.; Farzaneh-Gord, M.; Deymi-Dashtebayaz, M. Correlations for estimating natural gas leakage from above-ground and buried urban distribution pipelines. J. Nat. Gas Sci. Eng. 2016, 34, 185–196. [Google Scholar] [CrossRef]
  3. De Boer, H.S.; Grond, L.; Moll, H.; Benders, R. The application of power-to-gas, pumped hydro storage and compressed air energy storage in an electricity system at different wind power penetration levels. Energy 2014, 72, 360–370. [Google Scholar] [CrossRef]
  4. Farzaneh-Gord, M.; Arabkoohsar, A.; Dasht-bayaz, M.D.; Farzaneh-Kord, V. Feasibility of accompanying uncontrolled linear heater with solar system in natural gas pressure drop stations. Energy 2012, 41, 420–428. [Google Scholar] [CrossRef]
  5. Colbertaldo, P.; Guandalini, G.; Campanari, S. Modelling the integrated power and transport energy system: The role of power-to-gas and hydrogen in long-term scenarios for Italy. Energy 2018, 154, 592–601. [Google Scholar] [CrossRef]
  6. Pellegrino, S.; Lanzini, A.; Leone, P. Greening the gas network—The need for modelling the distributed injection of alternative fuels. Renew. Sustain. Energy Rev. 2017, 70, 266–286. [Google Scholar] [CrossRef]
  7. Guandalini, G.; Colbertaldo, P.; Campanari, S. Dynamic modeling of natural gas quality within transport pipelines in presence of hydrogen injections. Appl. Energy 2017, 185, 1712–1723. [Google Scholar] [CrossRef]
  8. Abeysekera, M.; Wu, J.; Jenkins, N.; Rees, M. Steady state analysis of gas networks with distributed injection of alternative gas. Appl. Energy 2016, 164, 991–1002. [Google Scholar] [CrossRef]
  9. Babyr, N.V.; Babyr, K.V. To improve the contact adaptability of mechanical roof support. E3S Web Conf. 2021, 266, 03015. [Google Scholar] [CrossRef]
  10. Korsakas, V.; Melaika, M.; Pukalskas, S.; Stravinskas, P. Hydrogen Addition Influence for the Efficient and Ecological Parameters of Heavy-Duty Natural Gas Si Engine. Procedia Eng. 2017, 187, 395–401. [Google Scholar] [CrossRef]
  11. Yue, J. Effect of hydrogen addition on performance of low heat value gas engine. Int. J. Hydrogen Energy 2016, 41, 15800–15804. [Google Scholar] [CrossRef]
  12. Marinina, O.; Nechitailo, A.; Stroykov, G.; Tsvetkova, A.; Reshneva, E.; Turovskaya, L. Technical and Economic Assessment of Energy Efficiency of Electrification of Hydrocarbon Production Facilities in Underdeveloped Areas. Sustainability 2023, 15, 9614. [Google Scholar] [CrossRef]
  13. Melaina, M.W.; Antonia, O.; Penem, M. Blending Hydrogen into Natural Gas Pipeline Networks: A Review of Key Issues. Technical Report NREL/TP-5600-51995. 2013. Available online: https://www.nrel.gov/docs/fy13osti/51995.pdf (accessed on 29 January 2023).
  14. Reynolds, R.A.; Slager, W.L. Pipeline Transportation of Hydrogen. In Hydrogen Energy; Veziroğlu, T.N., Ed.; Springer: Boston, MA, USA, 1975. [Google Scholar] [CrossRef]
  15. Liu, R.; Yuan, C.; Ma, W.; Liu, S.; Lu, S.; Zhang, H.; Gong, J. Simulation Study on Aircraft Fire Extinguishing Pipeline with Different Filling Conditions and Pipeline Characteristics. Fire 2022, 5, 86. [Google Scholar] [CrossRef]
  16. Nguyen, V.T.; Pham, T.V.; Rogachev, M.K.; Korobov, G.Y.; Parfenov, D.V.; Zhurkevich, A.O.; Islamov, S.R. A comprehensive method for determining the dewaxing interval period in gas lift wells. J. Petrol. Explor. Prod. Technol. 2023, 13, 1163–1179. [Google Scholar] [CrossRef]
  17. Ni, X.; Chen, Y.; Huang, Q.; Zhao, C.; Li, S.; Huang, J.; Wang, J. An Experimental Study on the Transportation Characteristics of Perfluoro(2-methyl-3-pentanone) in a Straight Pipe. Fire 2023, 6, 156. [Google Scholar] [CrossRef]
  18. Litvinenko, V.S.; Tsvetkov, P.S.; Dvoynikov, M.V.; Buslaev, G.V. Barriers to implementation of hydrogen initiatives in the context of global energy sustainable development. J. Min. Inst. 2020, 244, 428–438. [Google Scholar] [CrossRef]
  19. Hydro-Pac, Inc. High Pressure Hydrogen Compressors. Available online: http://hydropac.com/hydrogen-compression.html (accessed on 29 August 2023).
  20. Lurie, M.V. Transportation of Hydrogen Batches by a Gas Pipeline in the Flow of Natural Gas. Territ. “NEFTEGAS” Oil Gas Territ. 2020, 11–12, 84–88. (In Russian) [Google Scholar]
  21. Golunov, N.N.; Lurie, M.V.; Musailov, I.T. Transportation of Hydrogen through Gas Pipeline in the Form of Methane-Hydrogen Mixture. Territ. “NEFTEGAS” Oil Gas Territ. 2021, 1–2, 74–82. (In Russian) [Google Scholar]
  22. Lurye, M.V.; Musailov, I.T. Peculiarities of Gas Transportation via the Turkish Stream Gas Pipeline Impellers. Territ. “NEFTEGAS” Oil Gas Territ. 2018, 3, 42–50. (In Russian) [Google Scholar]
  23. Zhang, Y.; Wu, Y.; Savenok, O.V.; Yin, J.; Geng, H.; Li, D. Experimental Investigation on Cracking Characteristics of Dry and Saturated Shales in Nitrogen Fracturing after Liquid Nitrogen (LN2) Injection. Geofluids 2023, 2023, 8861524. [Google Scholar] [CrossRef]
  24. Bolobov, V.I.; Latipov, I.U.; Zhukov, V.S.; Popov, G.G. Using the Magnetic Anisotropy Method to Determine Hydrogenated Sections of a Steel Pipeline. Energies 2023, 16, 5585. [Google Scholar] [CrossRef]
  25. Mingazhev, A.; Shchipachev, A.; Mingazheva, A. Oil spill response technology for ice-covered waters in the Arctic. E3S Web Conf. 2023, 378, 05007. [Google Scholar] [CrossRef]
  26. The HyUnder Project. Available online: http://hyunder.eu/ (accessed on 29 January 2023).
  27. Aspen Plus, Version 8.0, User Guide. 2010. Available online: https://courses.washington.edu/overney/Aspen/Aspen_Tutorial.pdf (accessed on 29 August 2023).
  28. Tananykhin, D.S.; Struchkov, I.A.; Khormali, A.; Roschinp, V. Investigation of the influences of asphaltene deposition on oilfield development using reservoir simulation. Pet. Explor. Dev. 2022, 49, 1138–1149. [Google Scholar] [CrossRef]
  29. Zemenkova, M.Y.; Chizhevskaya, E.L.; Zemenkov, Y.D. Intelligent monitoring of the condition of hydrocarbon pipeline transport facilities using neural network technologies. J. Min. Inst. 2022, 258, 933–944. [Google Scholar] [CrossRef]
  30. Ludtke, K.H. Process Centrifugal Compressors. Basics, Operation, Design, Application; Springer: Berlin, Germany, 2004. [Google Scholar] [CrossRef]
  31. Shammazov, I.; Dzhemilev, E.; Sidorkin, D. Improving the Method of Replacing the Defective Sections of Main Oil and Gas Pipelines Using Laser Scanning Data. Appl. Sci. 2023, 13, 48. [Google Scholar] [CrossRef]
  32. Shammazov, I.A.; Sidorkin, D.I.; Batyrov, A.M. Ensuring the stability of above-ground main pipelines in areas of continuous permafrost distribution. Georesources Eng. 2022, 333, 200–207. [Google Scholar] [CrossRef]
  33. Afanaseva, O.; Bezyukov, O.; Pervukhin, D.; Tukeev, D. Experimental Study Results Processing Method for the Marine Diesel Engines Vibration Activity Caused by the Cylinder-Piston Group Operations. Inventions 2023, 8, 71. [Google Scholar] [CrossRef]
  34. Ignatenko, A.; Afanaseva, O. Application of system analysis methods for the research of mining enterprise activity. In Proceedings of the 2023 Sixth International Conference of Women in Data Science at Prince Sultan University (WiDS PSU), Riyadh, Saudi Arabia, 14–15 March 2023; pp. 180–184. [Google Scholar] [CrossRef]
  35. Arefiev, I.B.; Afanaseva, O.V. Implementation of Control and Forecasting Problems of Human-Machine Complexes on the Basis of Logic-Reflexive Modeling. In System Analysis in Engineering and Control. SAEC 2021; Vasiliev, Y.S., Pankratova, N.D., Volkova, V.N., Shipunova, O.D., Lyabakh, N.N., Eds.; Lecture Notes in Networks and Systems; Springer: Cham, Switzerland, 2022; Volume 442. [Google Scholar] [CrossRef]
  36. Jungmeister, D.A.; Gasımov, E.E.; Isaev, A.I. Substantiation of the design and parameters of the device for regulating the air flow in down-the-hole hammers of roller-cone drilling rigs. Min. Informational Anal. Bull. 2022, 2, 251–267. [Google Scholar] [CrossRef]
  37. Yungmeyster, D.; Isaev, A.; Gasymov, E. Substantiation of dth air drill hammer parameters for penetration rate adjustment using air flow. Gorn. Zhurnal 2022, 7, 72–77. [Google Scholar] [CrossRef]
  38. Kukharova, T.V.; Asadulagi, M.-A.M. Investigation of the OA-300M Electrolysis Cell Temperature Field of Metallurgical Production. Energies 2022, 15, 9001. [Google Scholar] [CrossRef]
  39. Karyakina, E.D.; Shammazov, I.; Shalygin, A.V. Main aspects of liquefied natural gas process line thermal and hydraulic calculations. IOP Conf. Ser. Earth Environ. Sci. 2021, 677, 052056. [Google Scholar] [CrossRef]
  40. Martirosyan, A.V.; Ilyushin, Y.V. Modeling of the Natural Objects’ Temperature Field Distribution Using a Supercomputer. Informatics 2022, 9, 62. [Google Scholar] [CrossRef]
  41. Pershin, I.M.; Papush, E.G.; Kukharova, T.V.; Utkin, V.A. Modeling of Distributed Control System for Network of Mineral Water Wells. Water 2023, 15, 2289. [Google Scholar] [CrossRef]
  42. Plotnikov, A.V.; Trushnikov, V.E.; Pervukhin, D.A.; Shestopalov, M.Y. Mathematical Simulation of the Formation Pressure Monitoring System in the Water-Drive Gas Reservoir. In Proceedings of the 2023 XXVI International Conference on Soft Computing and Measurements (SCM), Saint Petersburg, Russia, 24–26 May 2023; pp. 77–81. [Google Scholar] [CrossRef]
  43. Shammazov, I.A.; Batyrov, A.M.; Sidorkin, D.I.; Van Nguyen, T. Study of the Effect of Cutting Frozen Soils on the Supports of Above-Ground Trunk Pipelines. Appl. Sci. 2023, 13, 3139. [Google Scholar] [CrossRef]
  44. Katysheva, E. Analysis of the Interconnected Development Potential of the Oil, Gas and Transport Industries in the Russian Arctic. Energies 2023, 16, 3124. [Google Scholar] [CrossRef]
  45. Asadulagi, M.M. Synthesis of Lumped and Distributed Controllers for Control System of Hydrodynamic Process. In Proceedings of the 2019 International Multi-Conference on Industrial Engineering and Modern Technologies, FarEastCon 2019, Vladivostok, Russia, 1–4 October 2019; p. 8933859. [Google Scholar] [CrossRef]
  46. Ede, A.J. The heat transfer coefficient for flow in a pipe. Int. J. Heat Mass Transf. 1961, 4, 105–110. [Google Scholar] [CrossRef]
  47. Jang, C.B.; Choi, S.-W.; Baek, J.-B. CFD modeling and fire damage analysis of jet fire on hydrogen pipeline in a pipe rack structure. Int. J. Hydrogen Energy 2015, 40, 15760–15772. [Google Scholar] [CrossRef]
  48. Wang, C.J.; Wen, J.X.; Chen, Z.B.; Dembele, S. Predicting radiative characteristics of hydrogen and hydrogen/methane jet fires using FireFOAM. Int. J. Hydrogen Energy 2014, 39, 20560–20569. [Google Scholar] [CrossRef]
  49. Schefer, R.W.; Houf, W.G.; Bourne, B.; Colton, J. Spatial and radiative properties of an open-flame hydrogen plume. Int. J. Hydrogen Energy 2006, 31, 1332–1340. [Google Scholar] [CrossRef]
  50. Mashhadimoslem, H.; Ghaemi, A.; Palacios, A.; Behroozi, A.H. A new method for comparison thermal radiation on large-scale hydrogen and propane jet fires based on experimental and computational studies. Fuel 2020, 282, 118864. [Google Scholar] [CrossRef]
  51. Nobili, M.; Caruso, G. Comparative CFD simulations of a hydrogen fire scenario. IOP Conf. Ser. J. Phys. Conf. Ser. 2017, 796, 012035. [Google Scholar] [CrossRef]
  52. Zhou, C.; Yang, Z.; Chen, G.; Zhang, Q.; Yang, Y. Study on leakage and explosion consequence for hydrogen blended natural gas in urban distribution networks. Int. J. Hydrogen Energy 2022, 47, 27096–27115. [Google Scholar] [CrossRef]
  53. Froeling, H.A.J.; Dröge, M.T.; Nane, G.F.; Van Wijk, A.J.M. Quantitative risk analysis of a hazardous jet fire event for hydrogen transport in natural gas transmission pipelines. Int. J. Hydrogen Energy 2021, 46, 10411–10422. [Google Scholar] [CrossRef]
  54. Jo, Y.-D.; Ahn, B.J. Analysis of hazard area associated with hydrogen gas transmission pipelines. Int. J. Hydrogen Energy 2006, 31, 2122–2130. [Google Scholar] [CrossRef]
  55. Li, Y.; Kuang, Z.; Fan, Z.; Shuai, J. Evaluation of the safe separation distances of hydrogen-blended natural gas pipelines in a jet fire scenario. Int. J. Hydrogen Energy 2023, 48, 18804–18815. [Google Scholar] [CrossRef]
  56. Zhou, K.; Wang, X.; Liu, M.; Liu, J. A theoretical framework for calculating full-scale jet fires induced by high-pressure hydrogen/natural gas transient leakage. Int. J. Hydrogen Energy 2018, 43, 22765–22775. [Google Scholar] [CrossRef]
  57. Islamov, S.R.; Bondarenko, A.V.; Mardashov, D.V. A selection of emulsifiers for preparation of invert emulsion drilling fluids. Top. Issues Ration. Use Nat. Resour. 2020, 2, 1–9. [Google Scholar] [CrossRef]
  58. Zolotov, O.I.; Iliushina AN Novozhilov, I.M. Spatially Distributed System for Monitoring of Fields Technical Condition in Mineral Resources Sector. In Proceedings of the 2021 XXIV International Conference on Soft Computing and Measurements (SCM), St. Petersburg, Russia, 26–28 May 2021; pp. 93–95. [Google Scholar] [CrossRef]
  59. Vasiliev, G.G.; Dzhaljabov, A.A.; Leonovich, I.A. Analysis of the causes of engineering structures deformations at gas industry facilities in the permafrost zone. J. Min. Inst. 2021, 249, 377–385. [Google Scholar] [CrossRef]
Figure 1. Cross-section of an underground pipeline.
Fire 06 00409 g001
Figure 3. Range of heat flow and velocity vectors.
Fire 06 00409 g003
Figure 4. Temperature distribution contours resulting from a pipeline rupture.
Fire 06 00409 g004
Figure 5. Explosion propagation area in the event of a pipeline rupture due to pressure drops and gas mixture velocity.
Fire 06 00409 g005
Table 1. Effect of hydrogen volume concentration on the mass flow rate of the gas mixture at the existing pipeline inner diameter d = 1000 mm, transport length L = 1000 km, temperature of the transported gas T1 = 300 K, and pressure p1 = 9.8 MPa.
H2/CH4
%
M,
kg/s
P1,
MPa
ρ M 1 ,
kg/m3
C1,
m/s
VH2, m3/sVCH4,
m3/s
H2
kg/s
CH4
kg/s
P2
MPa
ρ M 2
kg/m3
C2
m/s
p
MPa
T2 KVΣ m3/s
10/904499.83210.447.254455,527204.53008
25/753839.84210.626133707,527173.52998
50/502699.85310.60.09426243824142.52998
Disclaimer/Publisher’s Note: The statements, opinions and data contained in all publications are solely those of the individual author(s) and contributor(s) and not of MDPI and/or the editor(s). MDPI and/or the editor(s) disclaim responsibility for any injury to people or property resulting from any ideas, methods, instructions or products referred to in the content.

