
Assessing Fire Risk in Wildland–Urban Interface Regions Using a Machine Learning Method and GIS data: The Example of Istanbul’s European Side


Abstract
1. Introduction
2. Materials and Methods
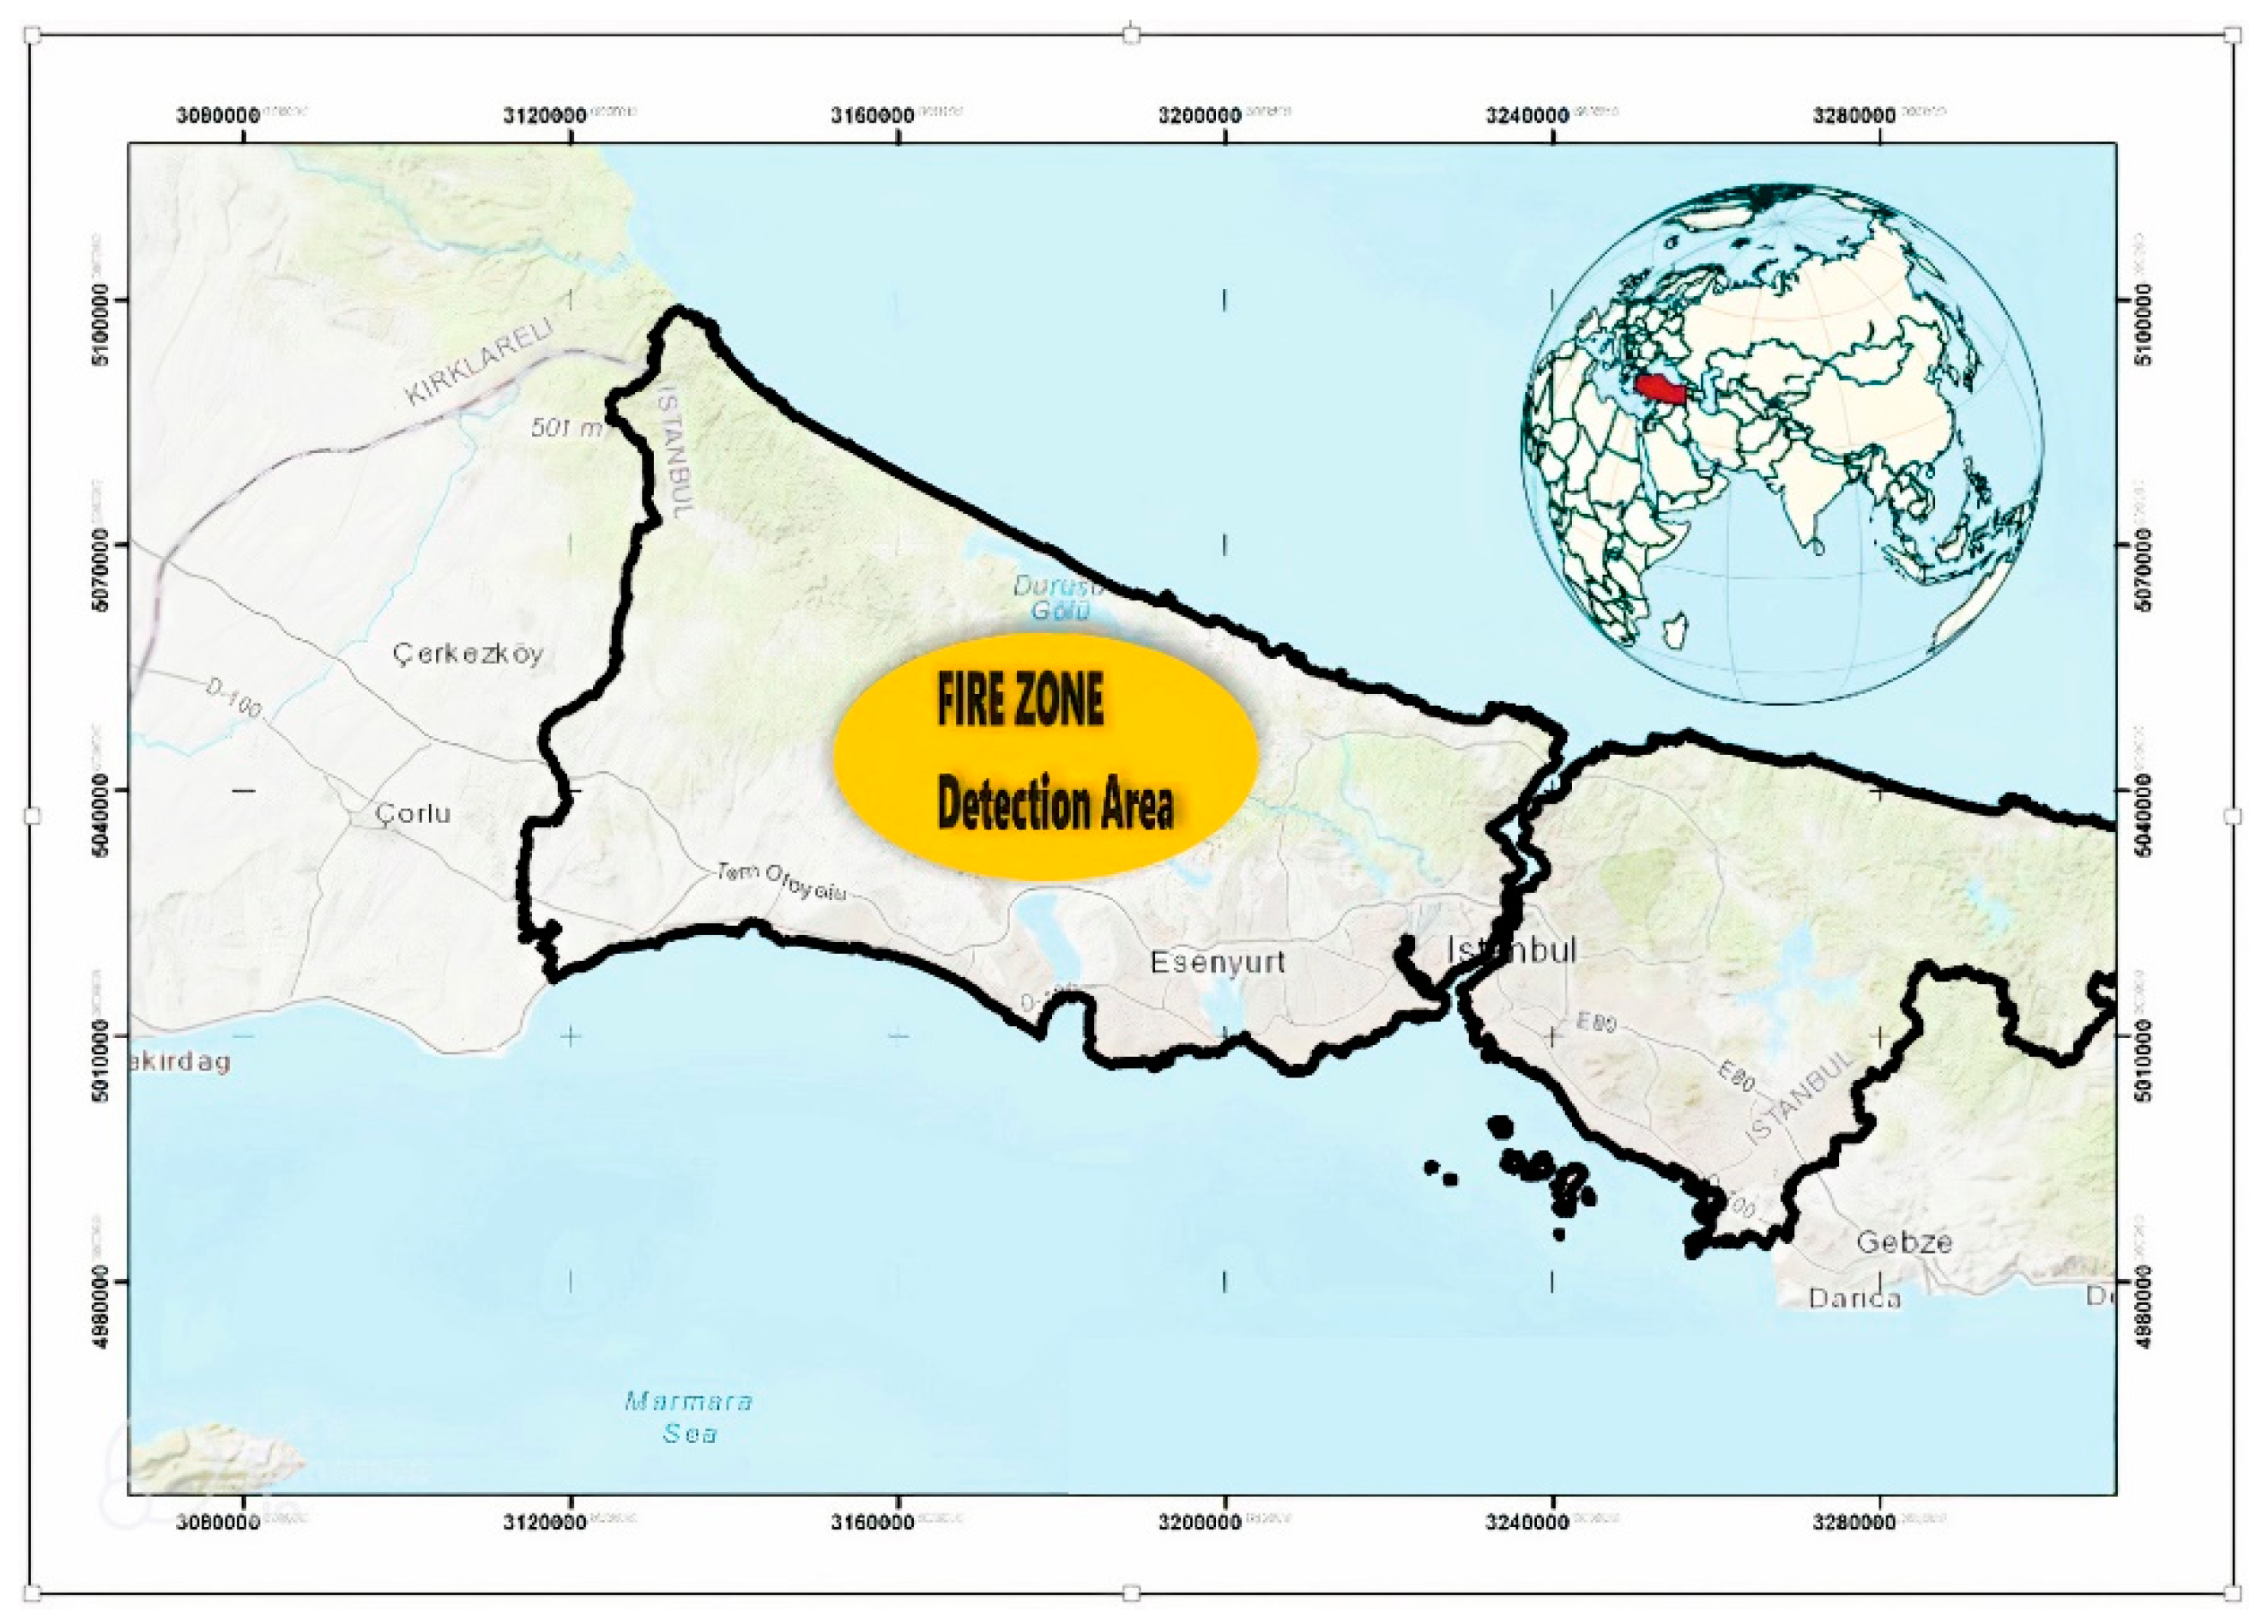
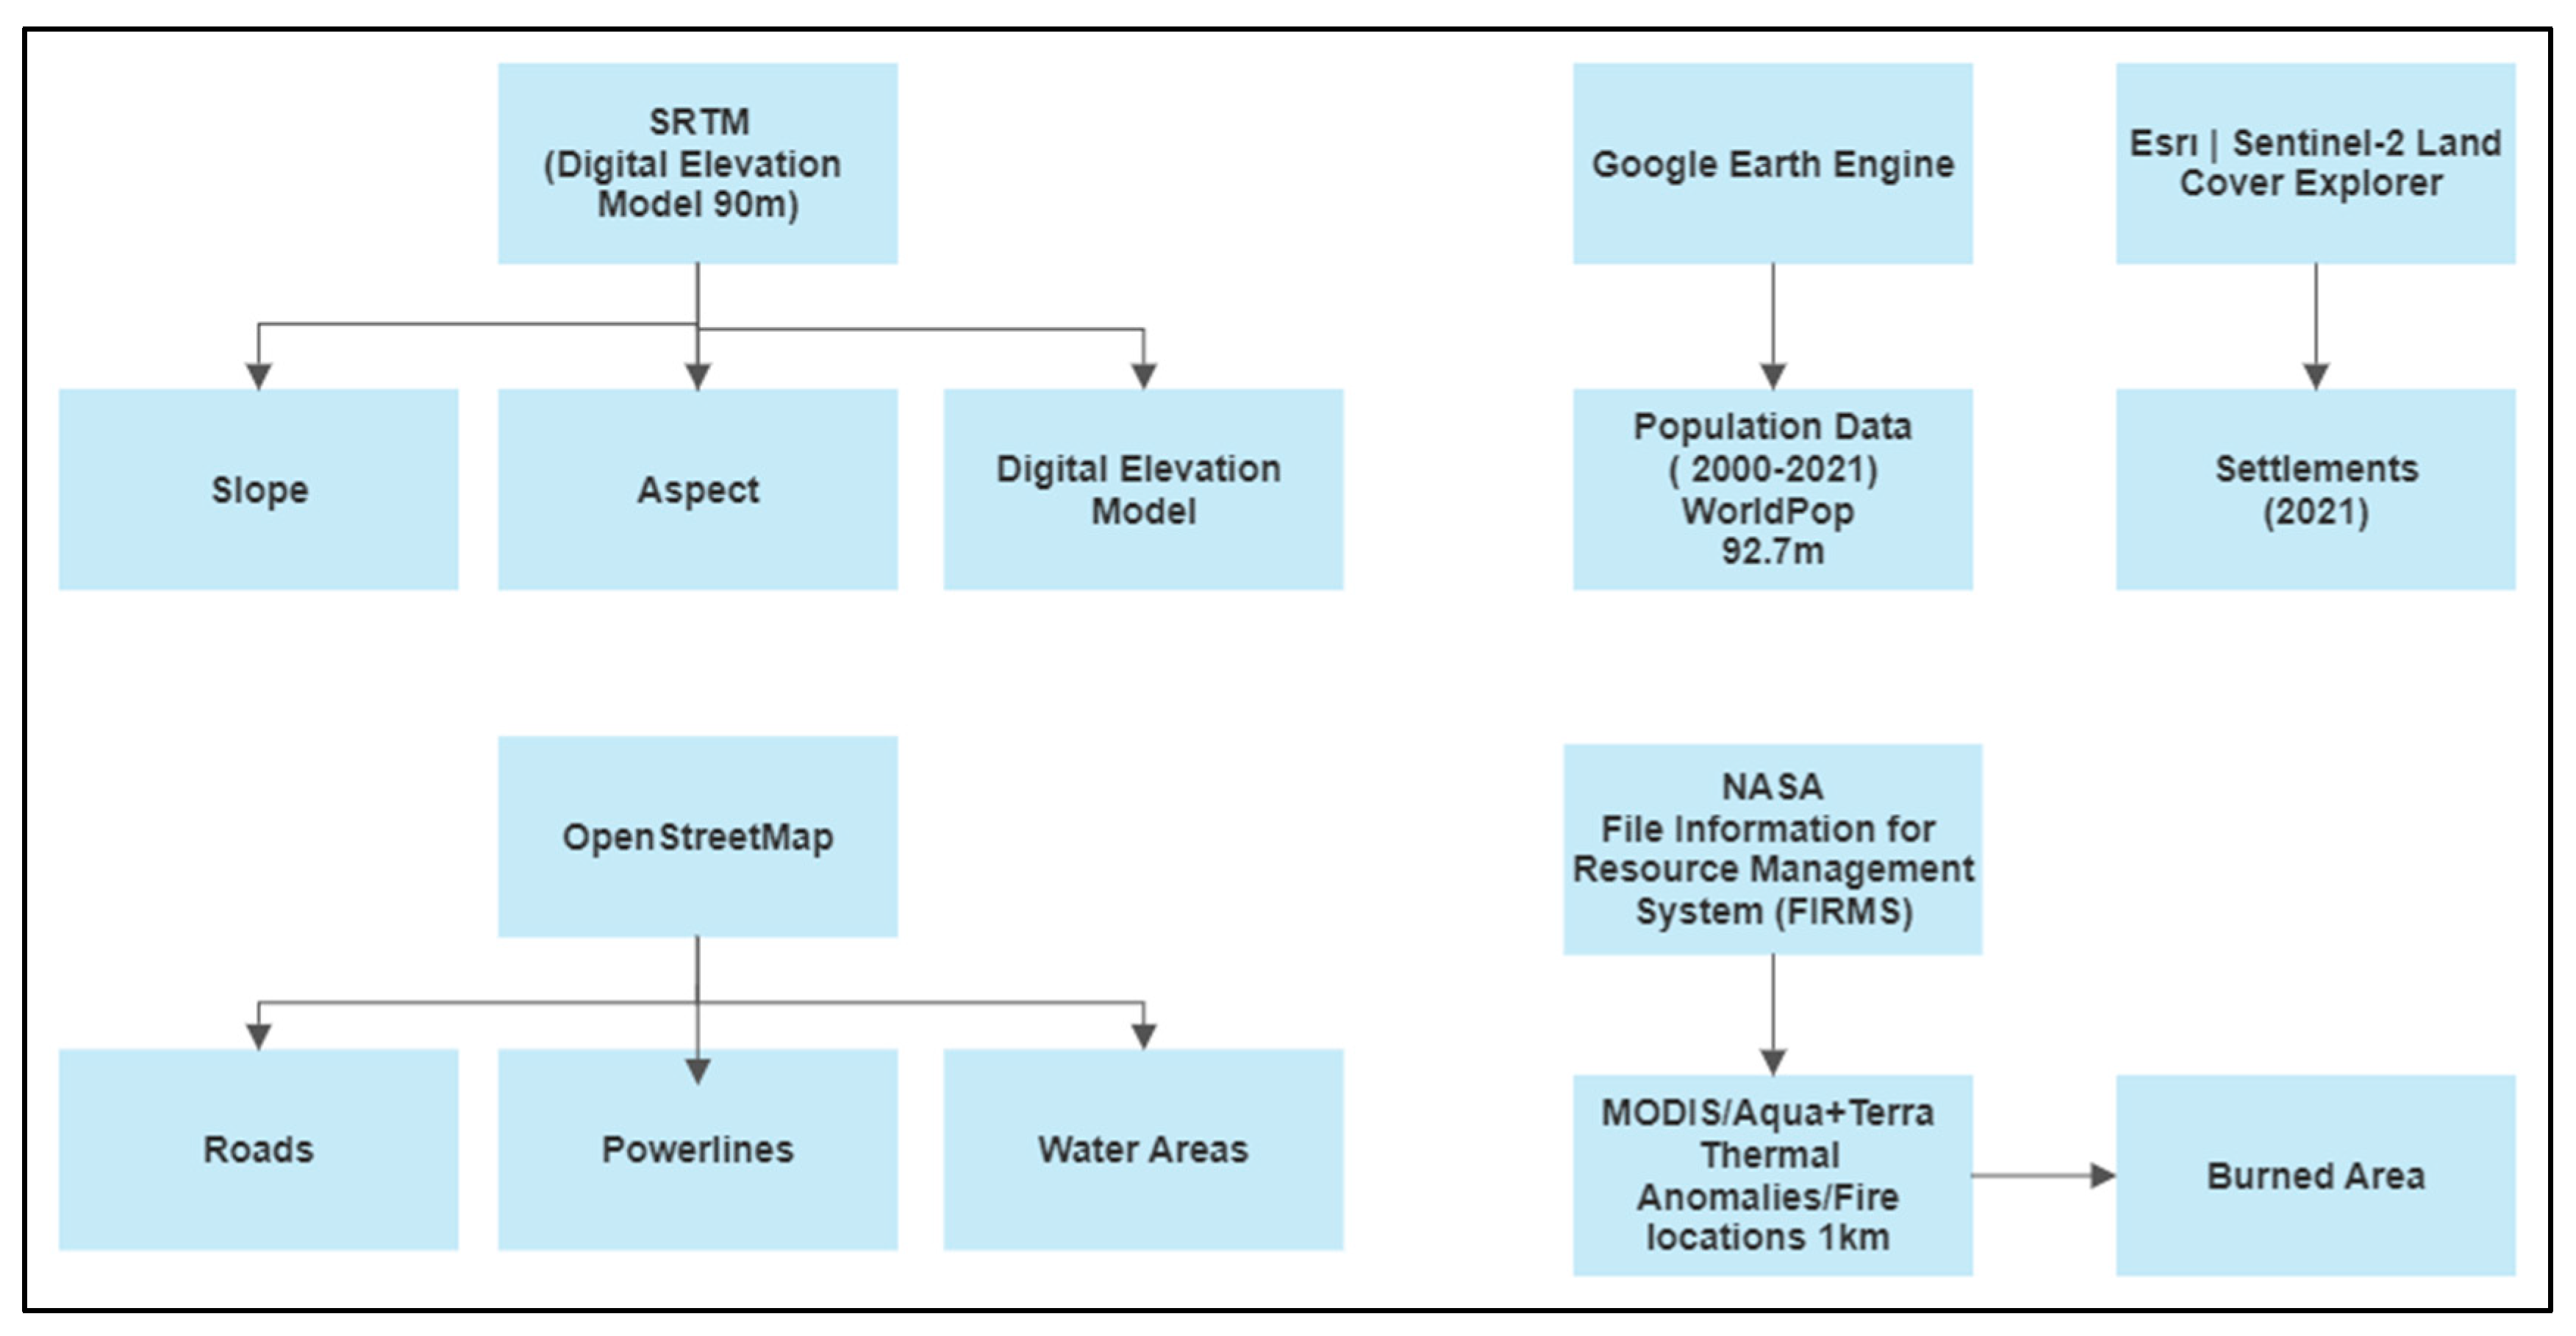
2.1. Research Site and Data Collection
2.2. Method
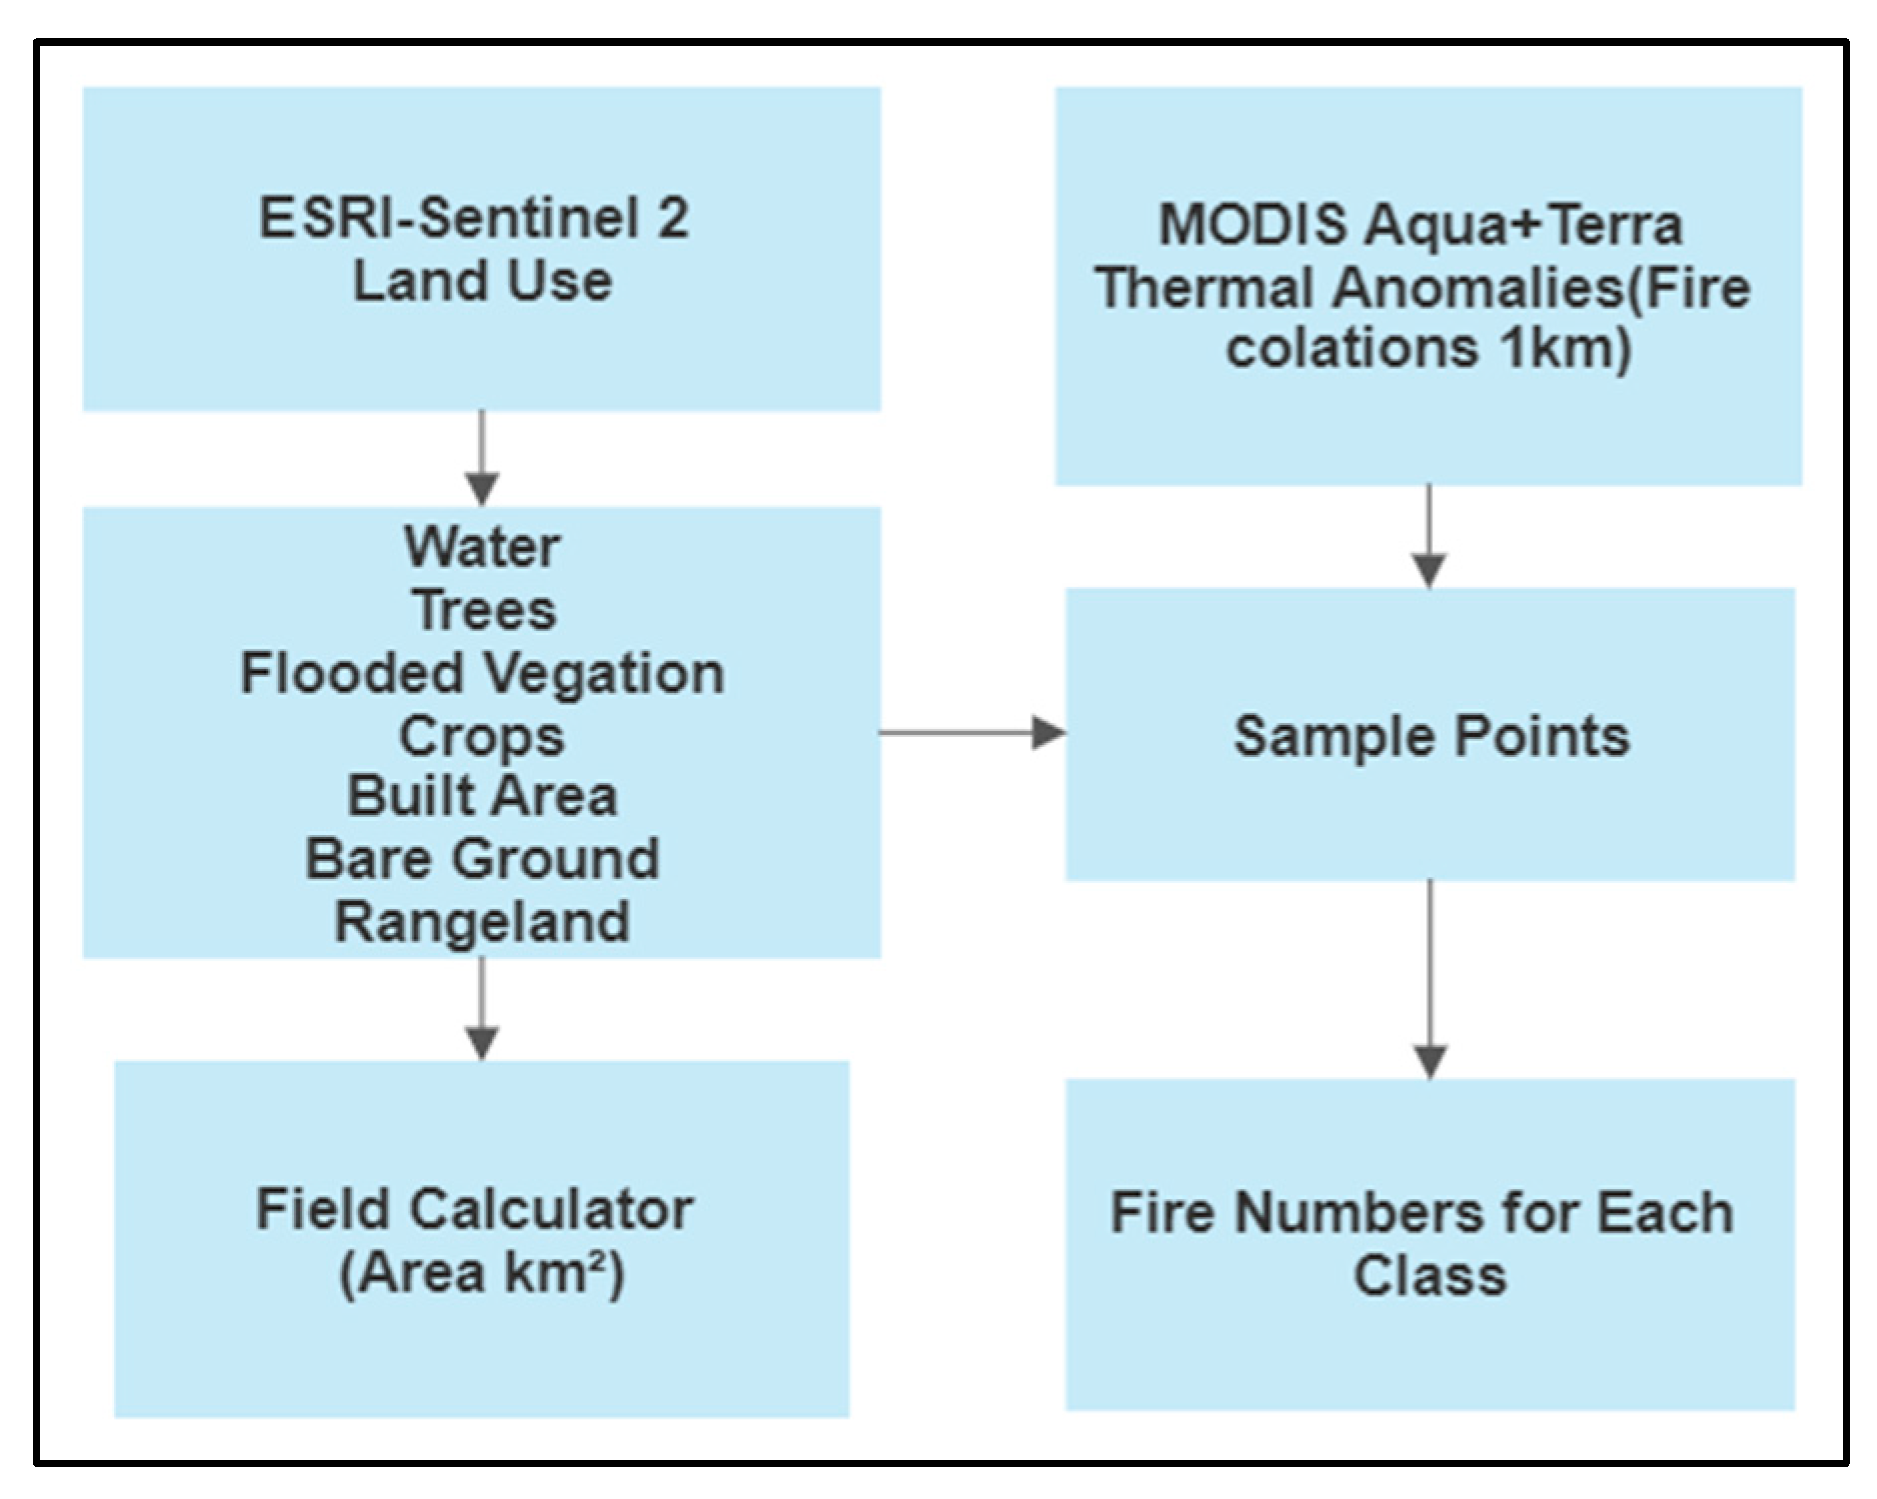
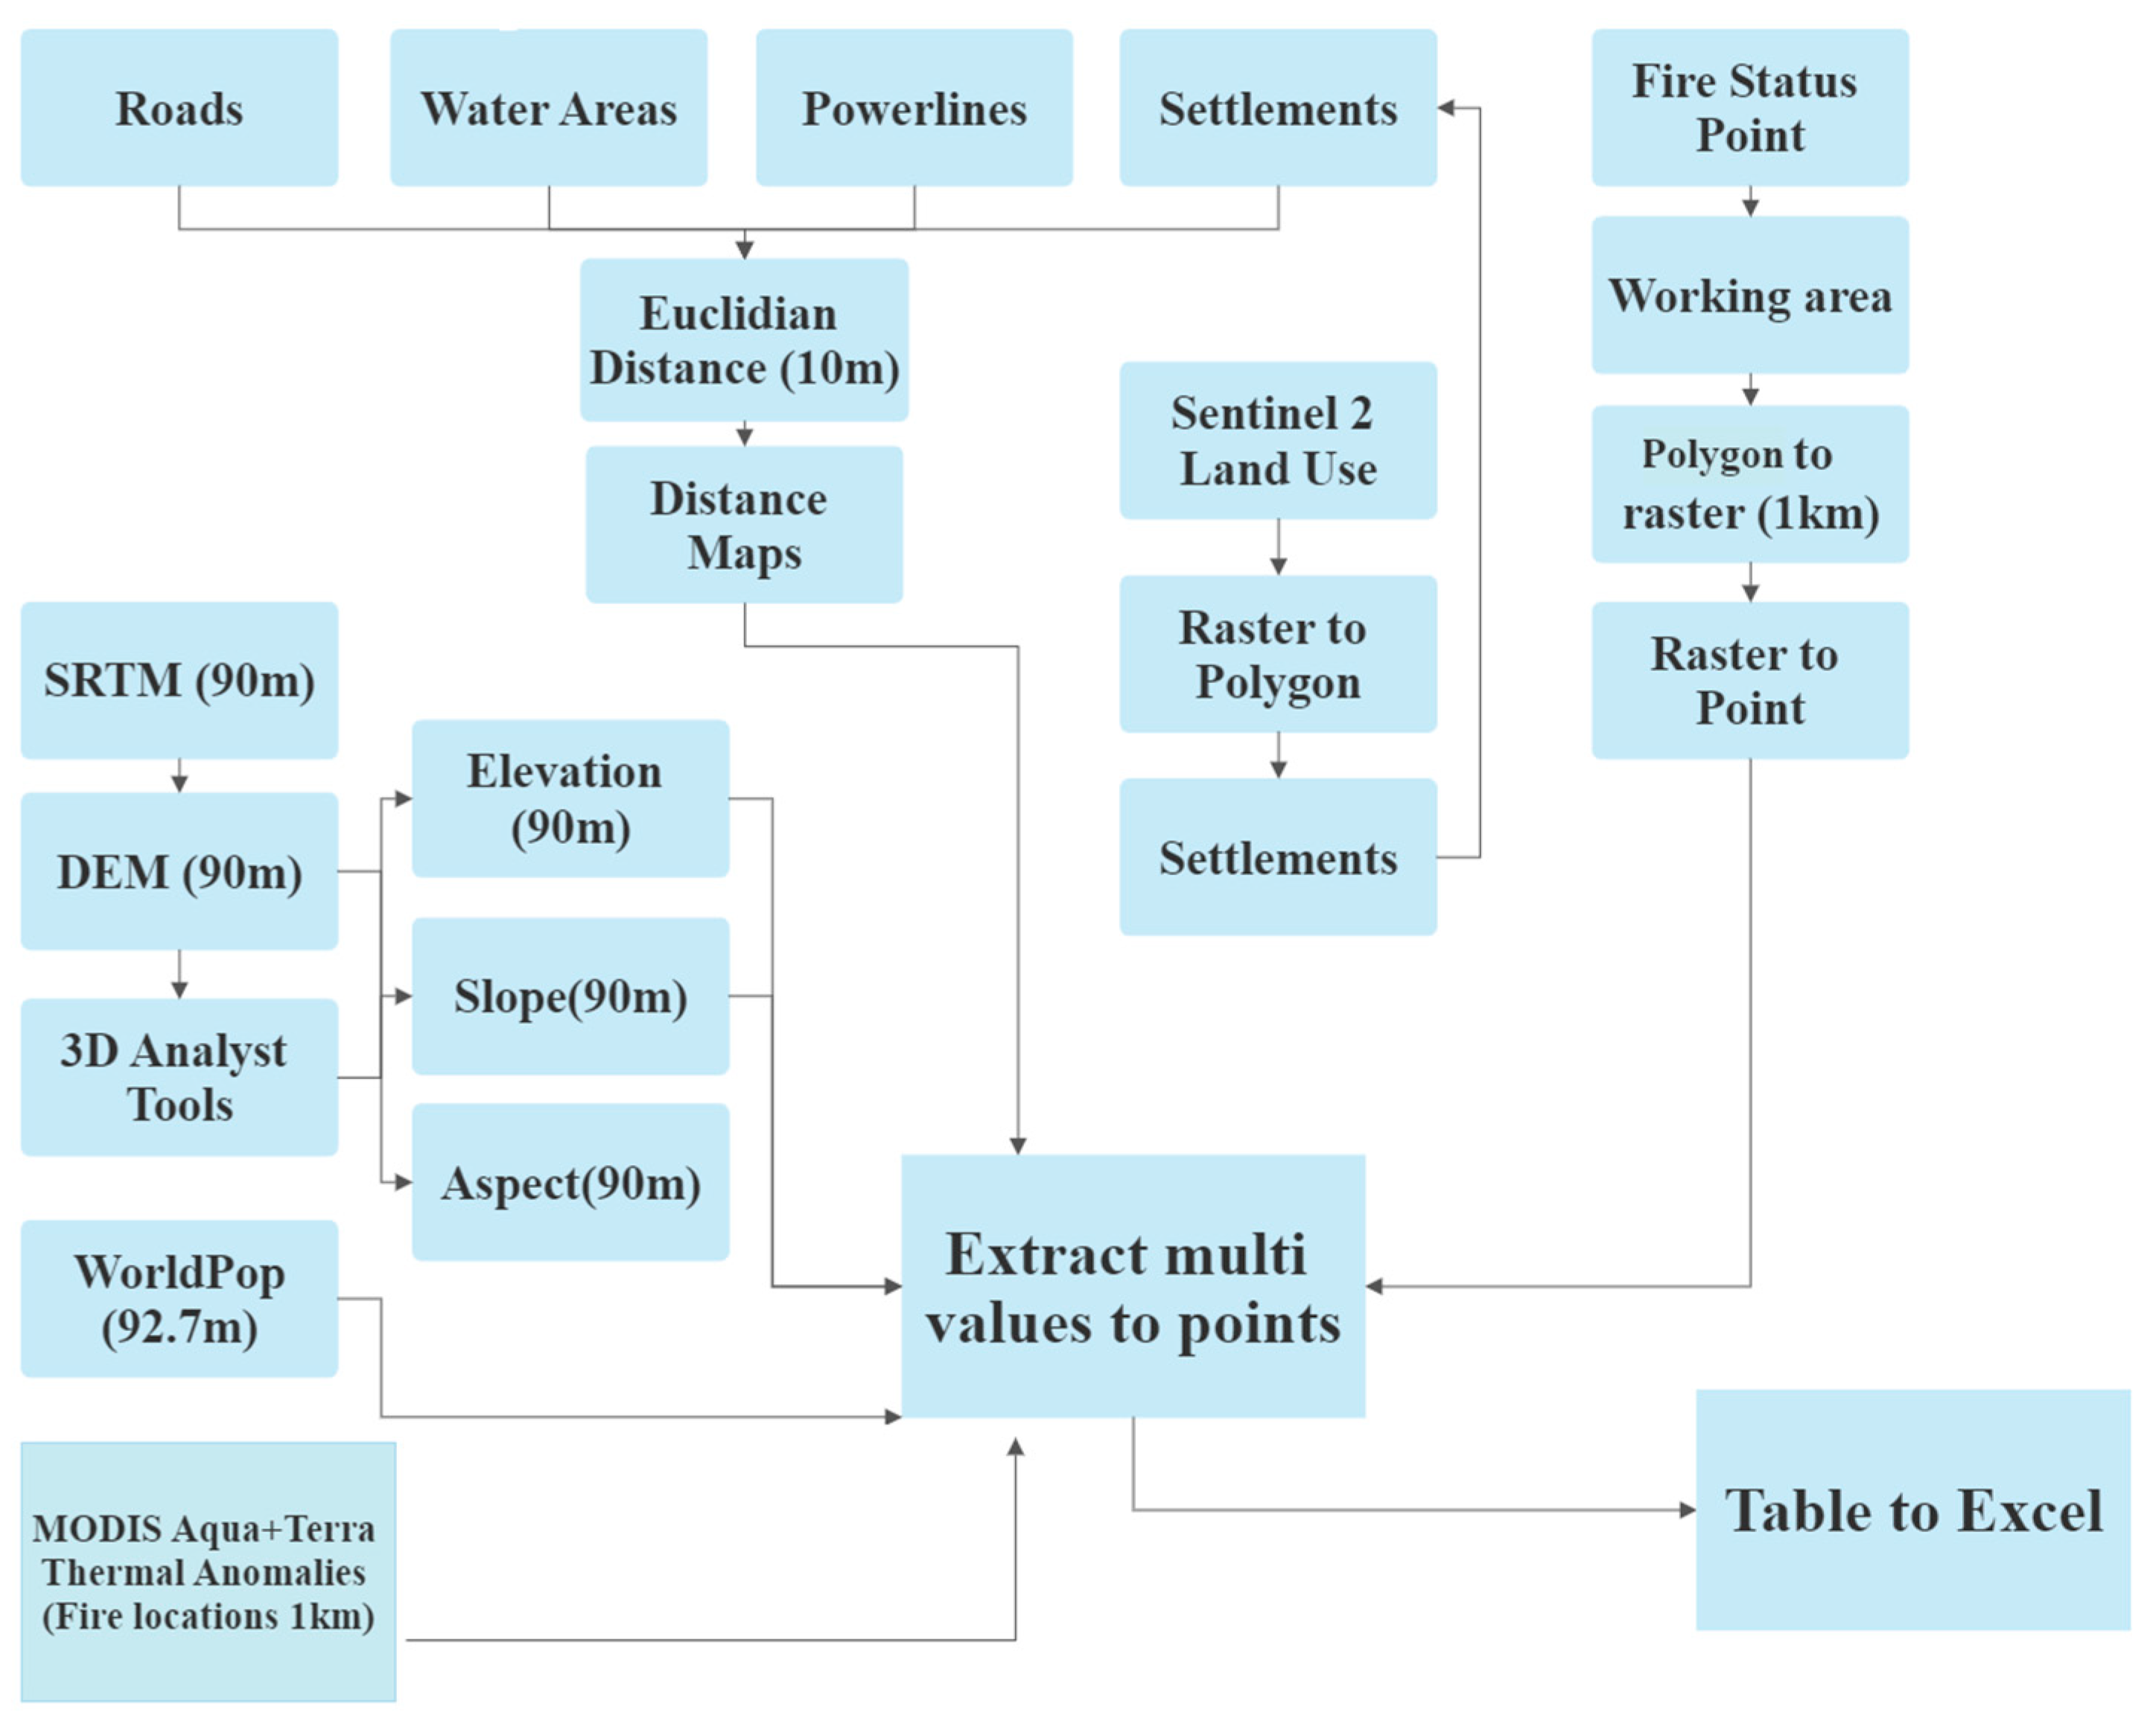
2.2.1. GIS-Based Processes
2.2.2. Machine Learning Methods
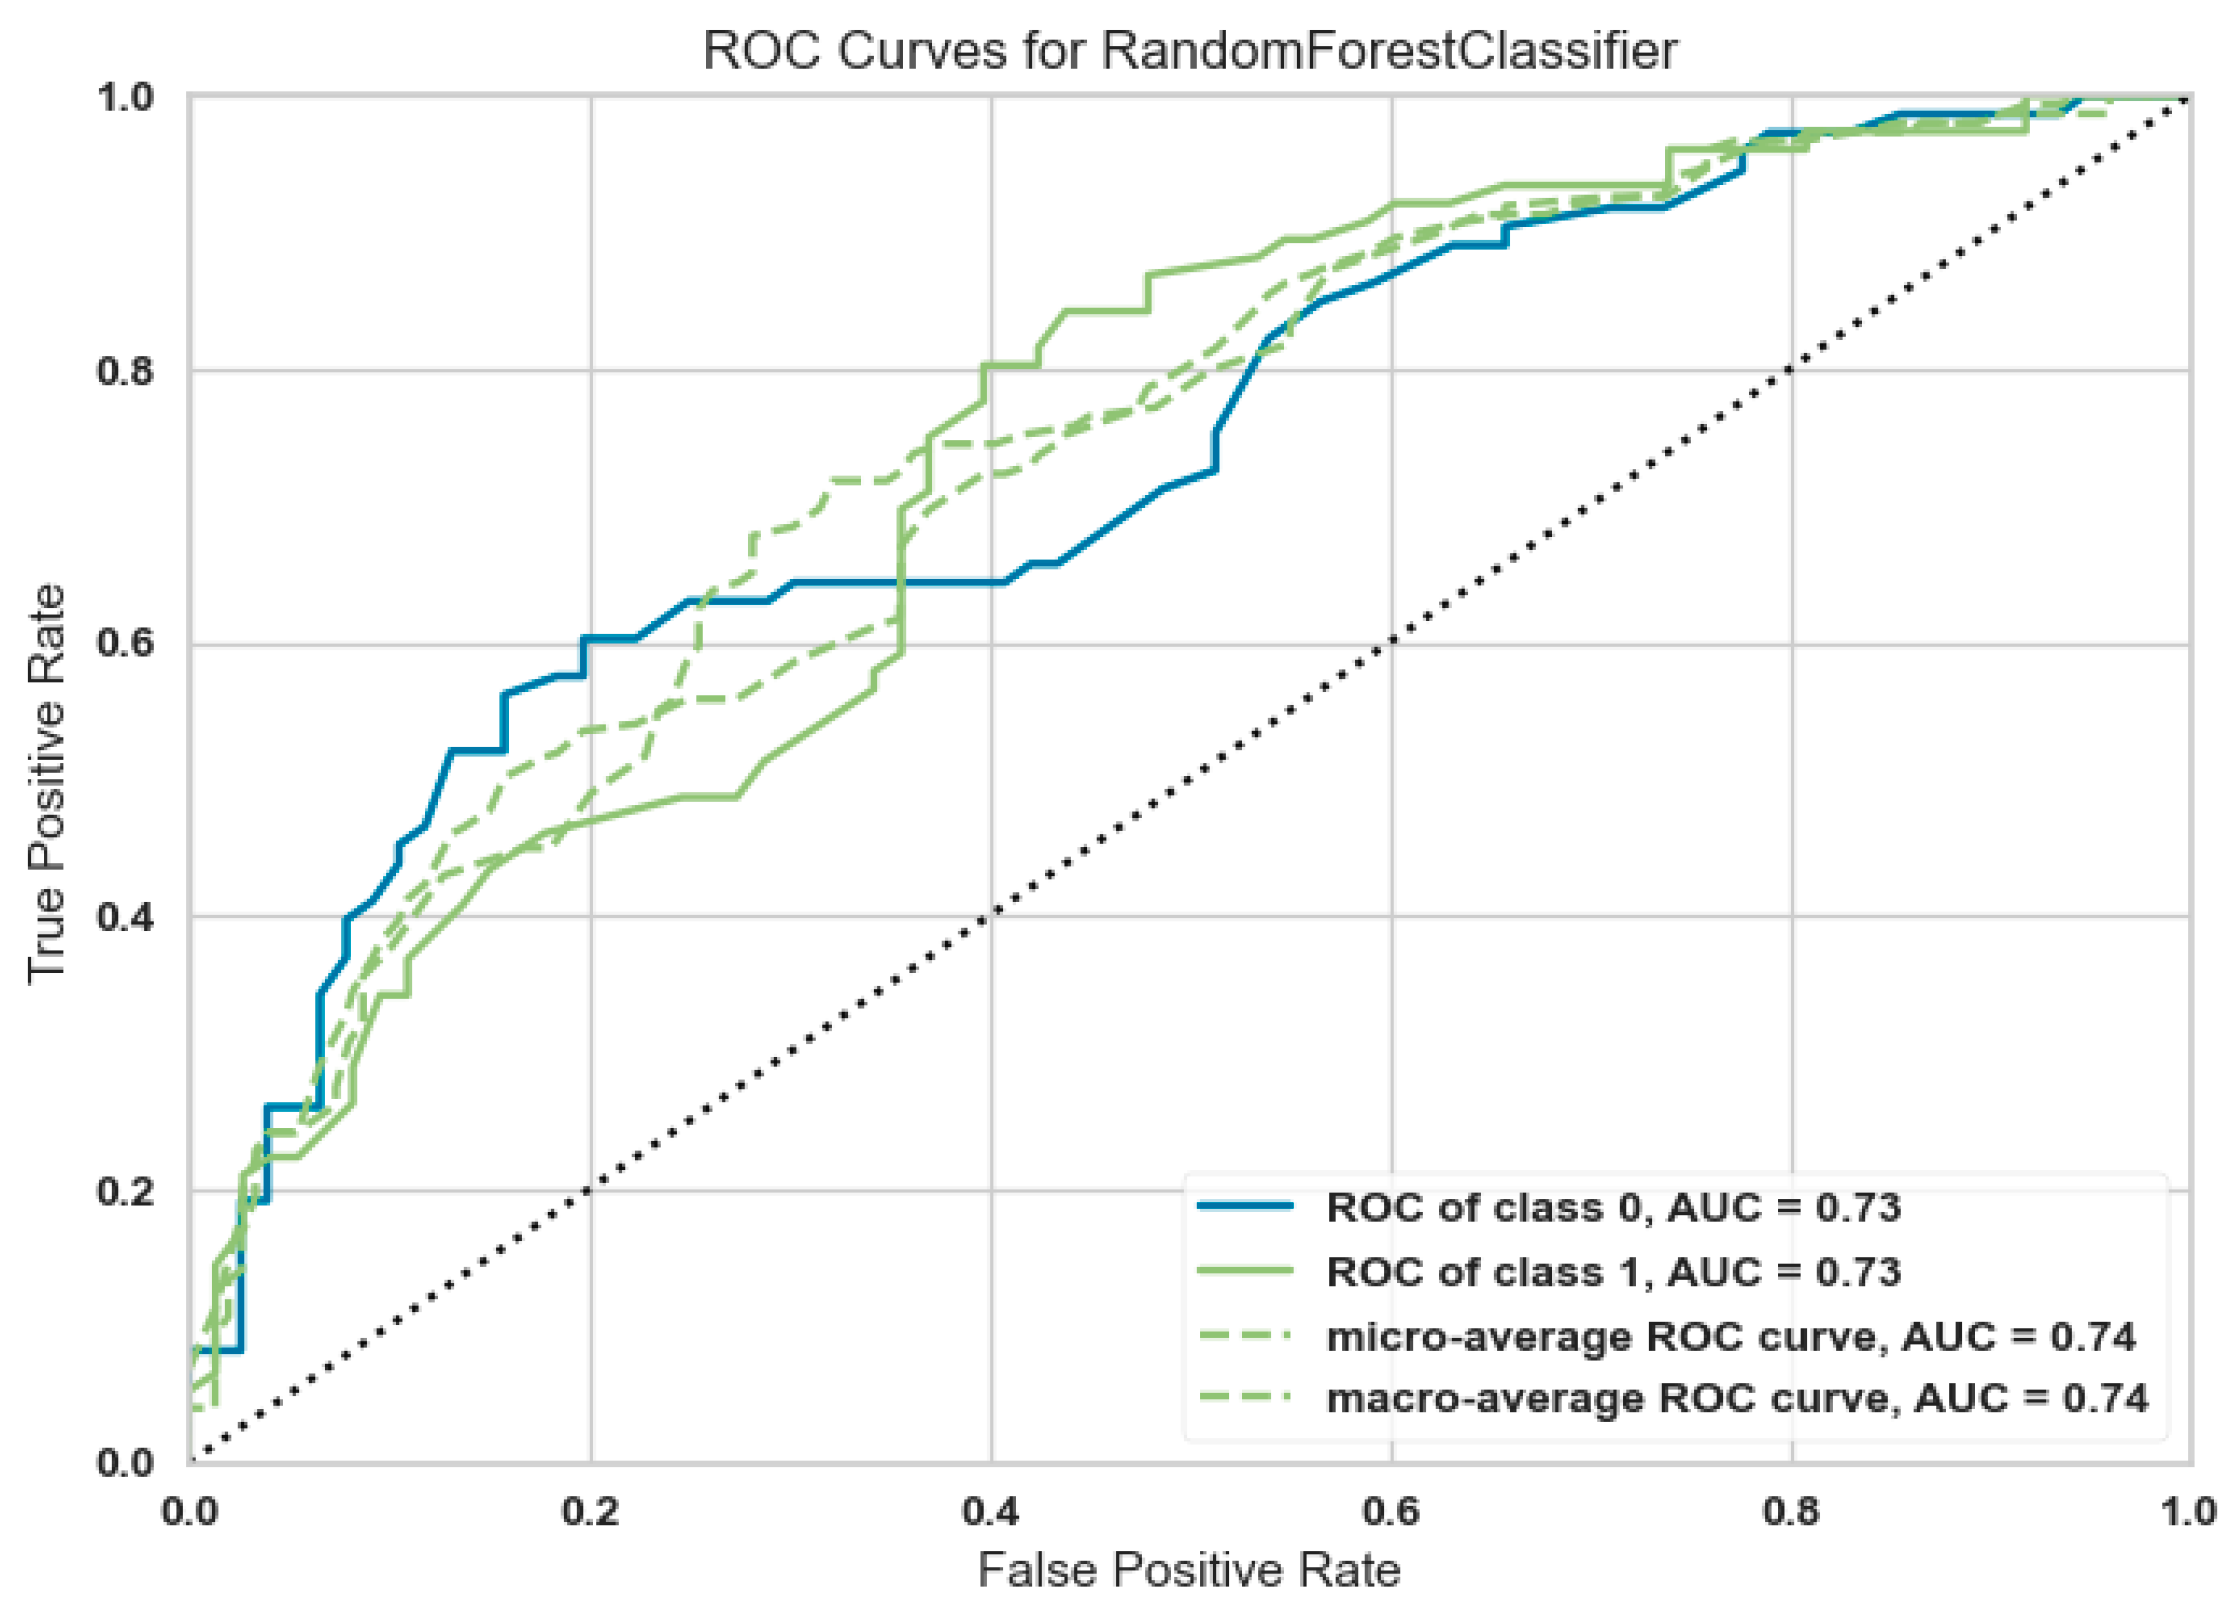
2.2.3. Random Forest (RF)
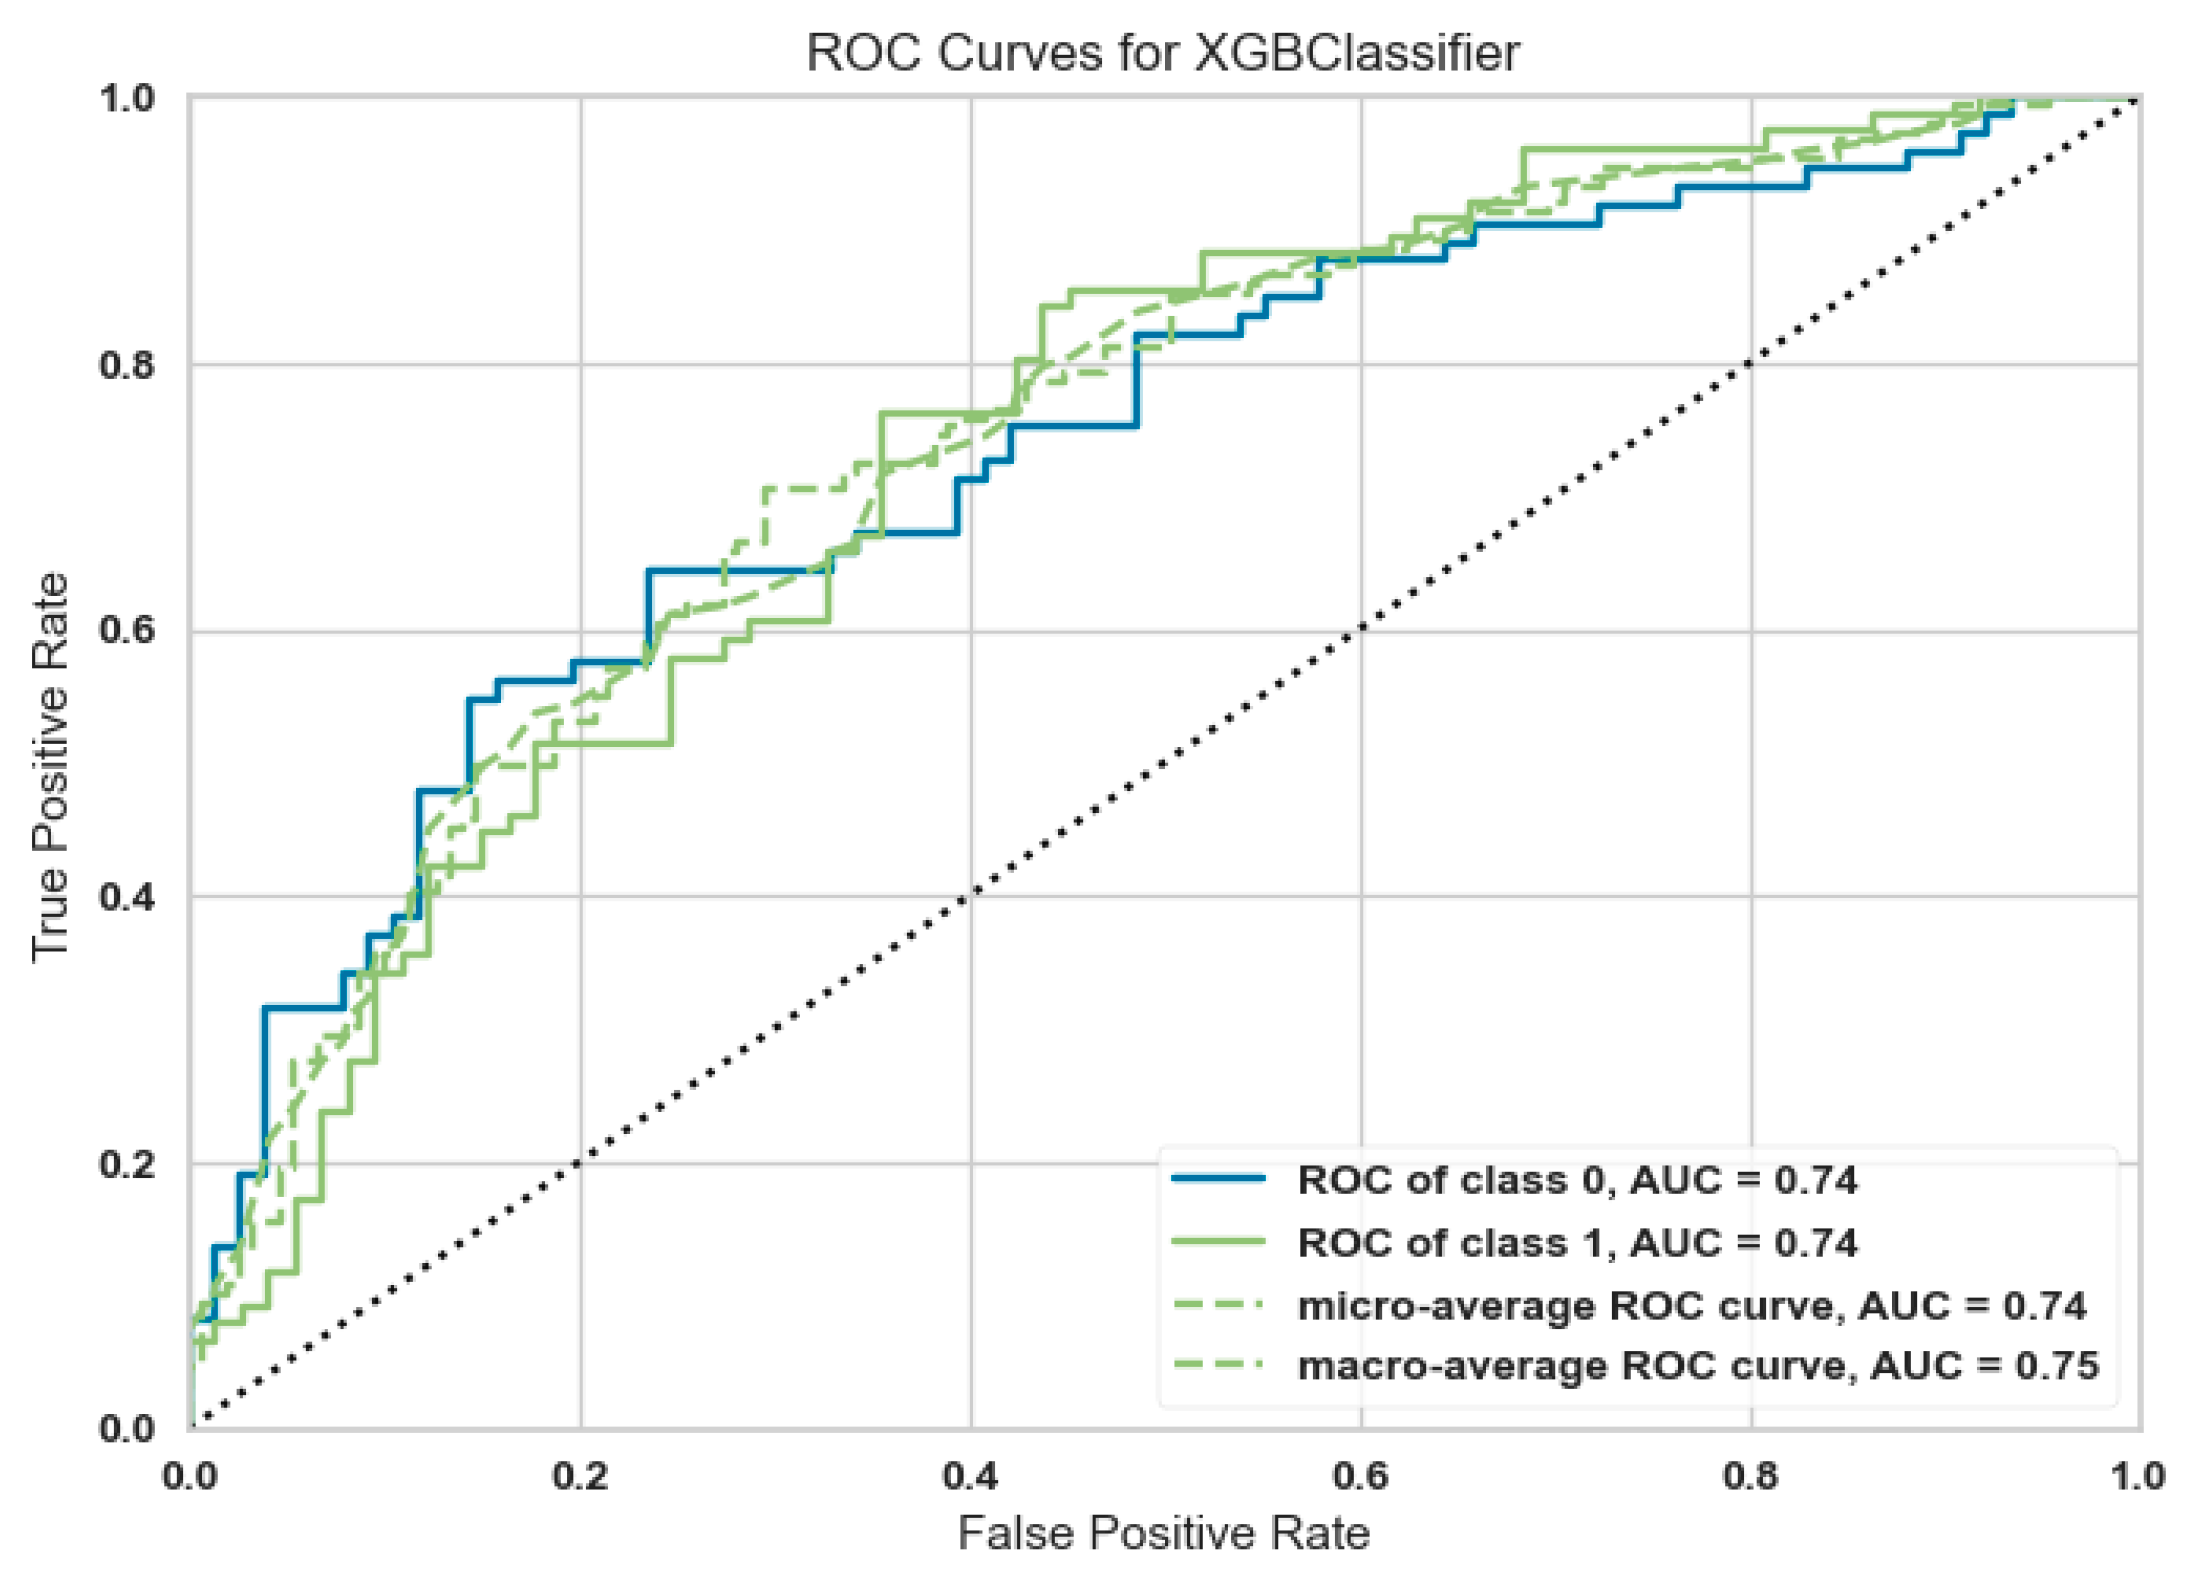
2.2.4. Extreme Gradient Boosting (XGB)
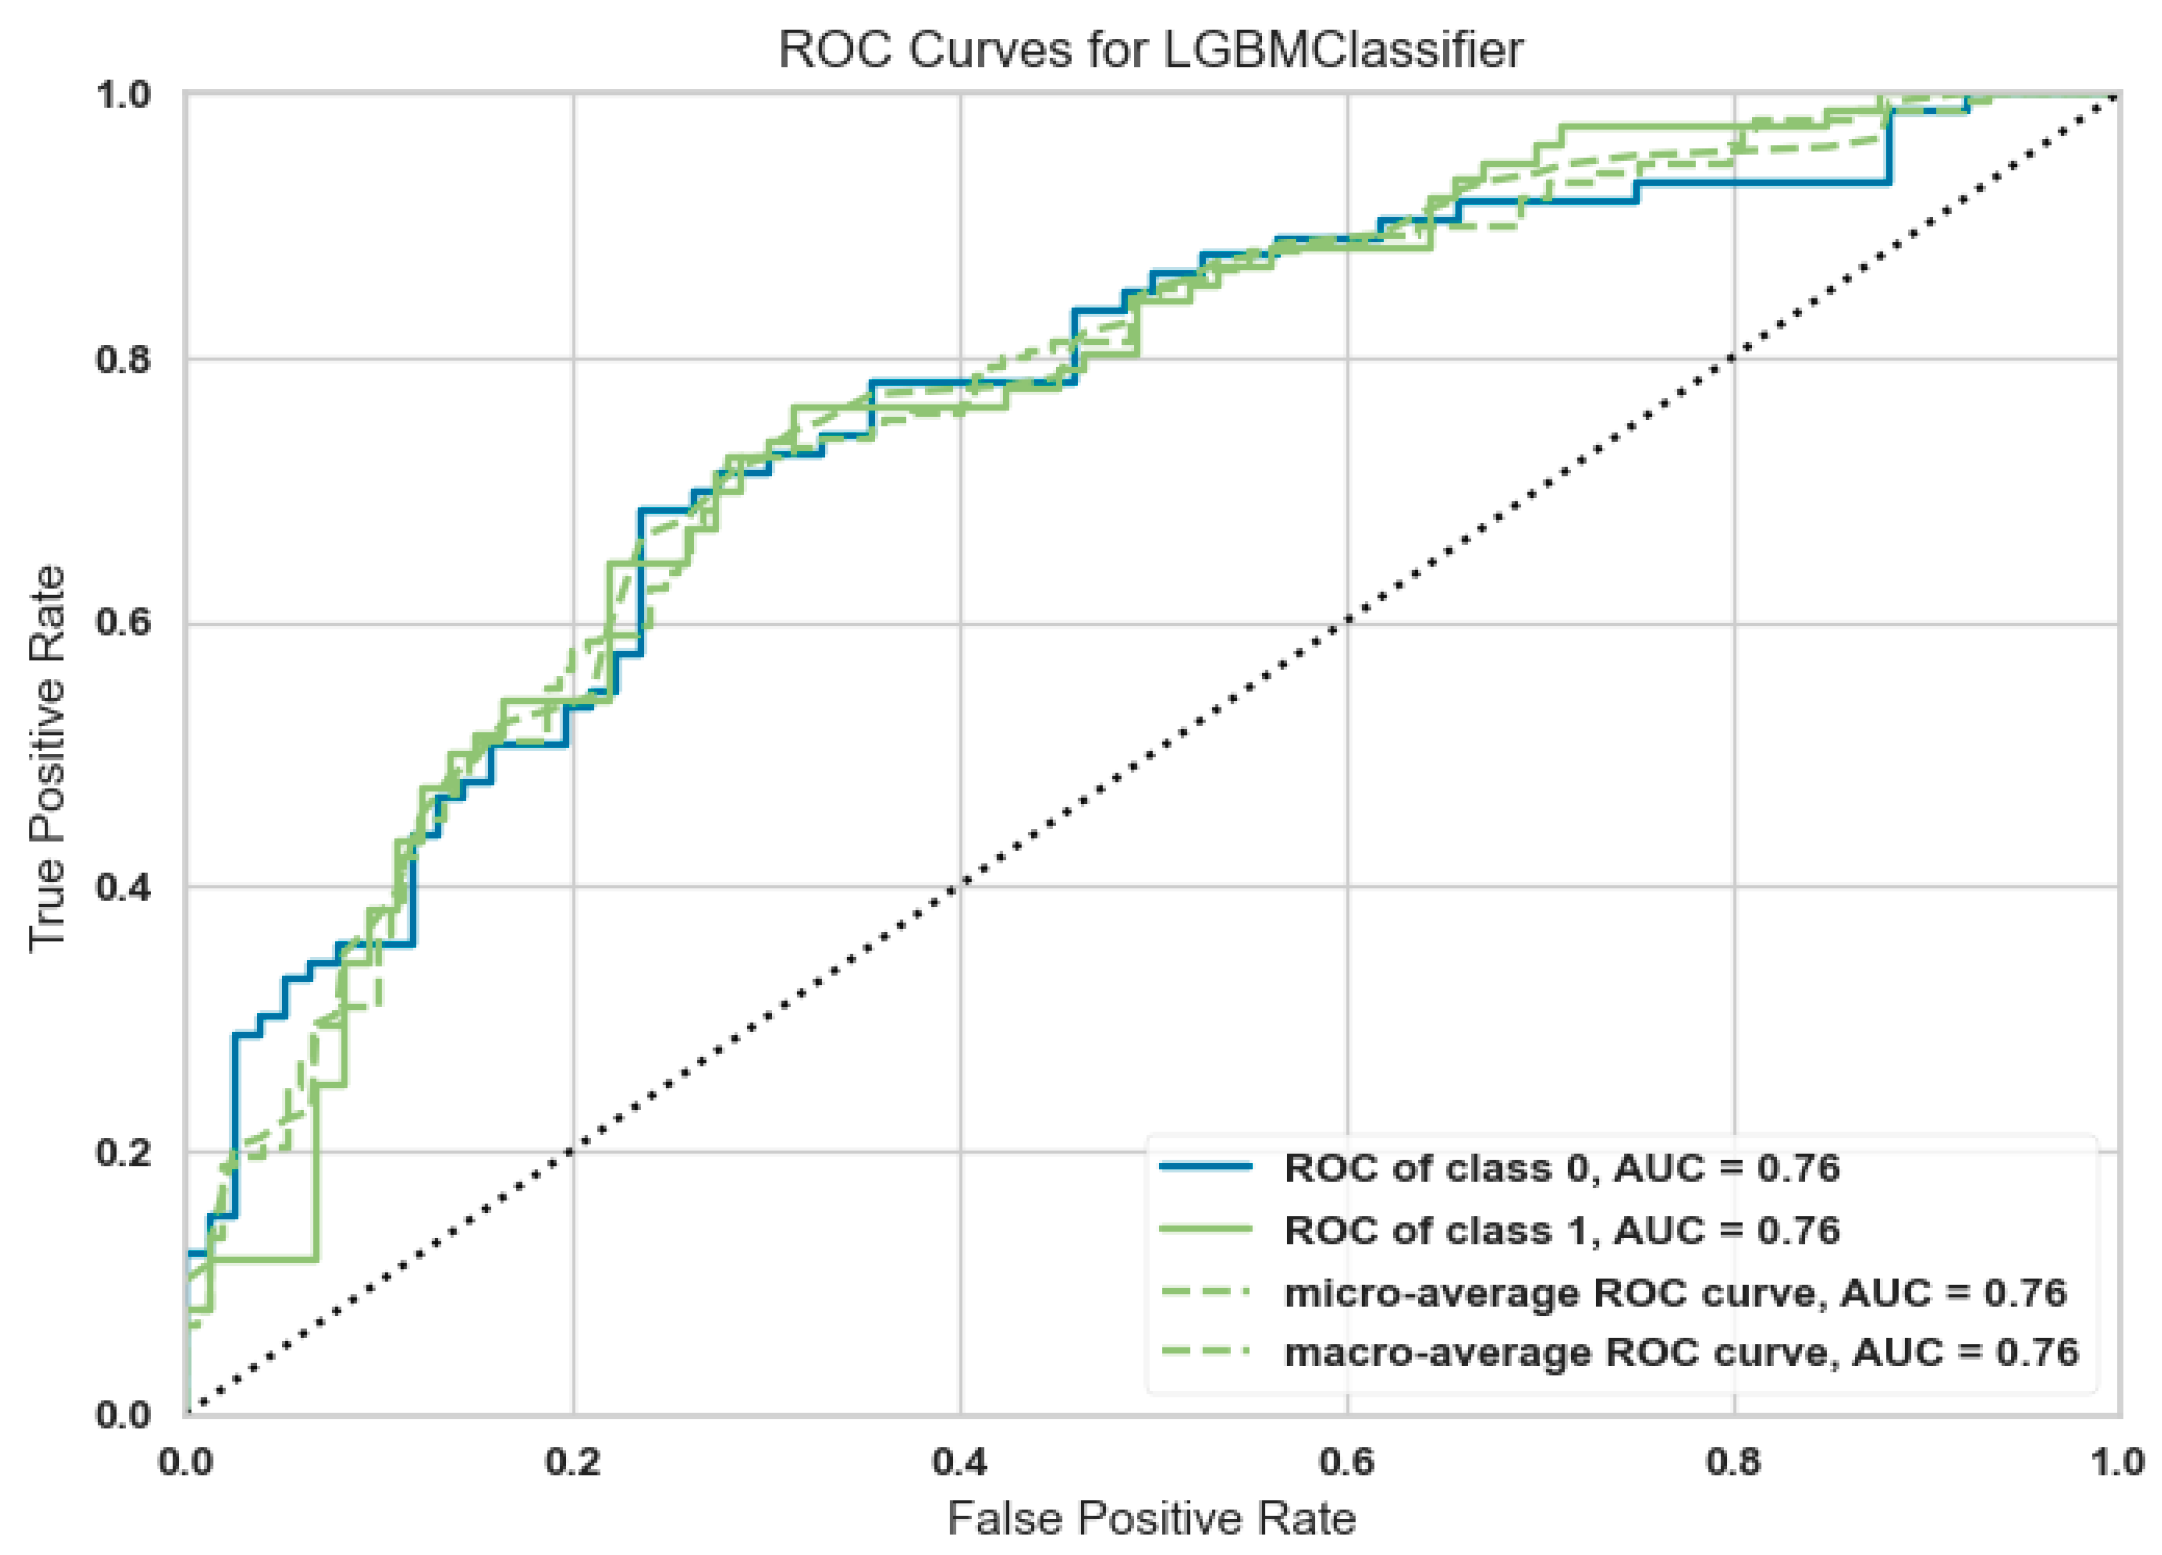
2.2.5. Light Gradient Boosting (LGB)
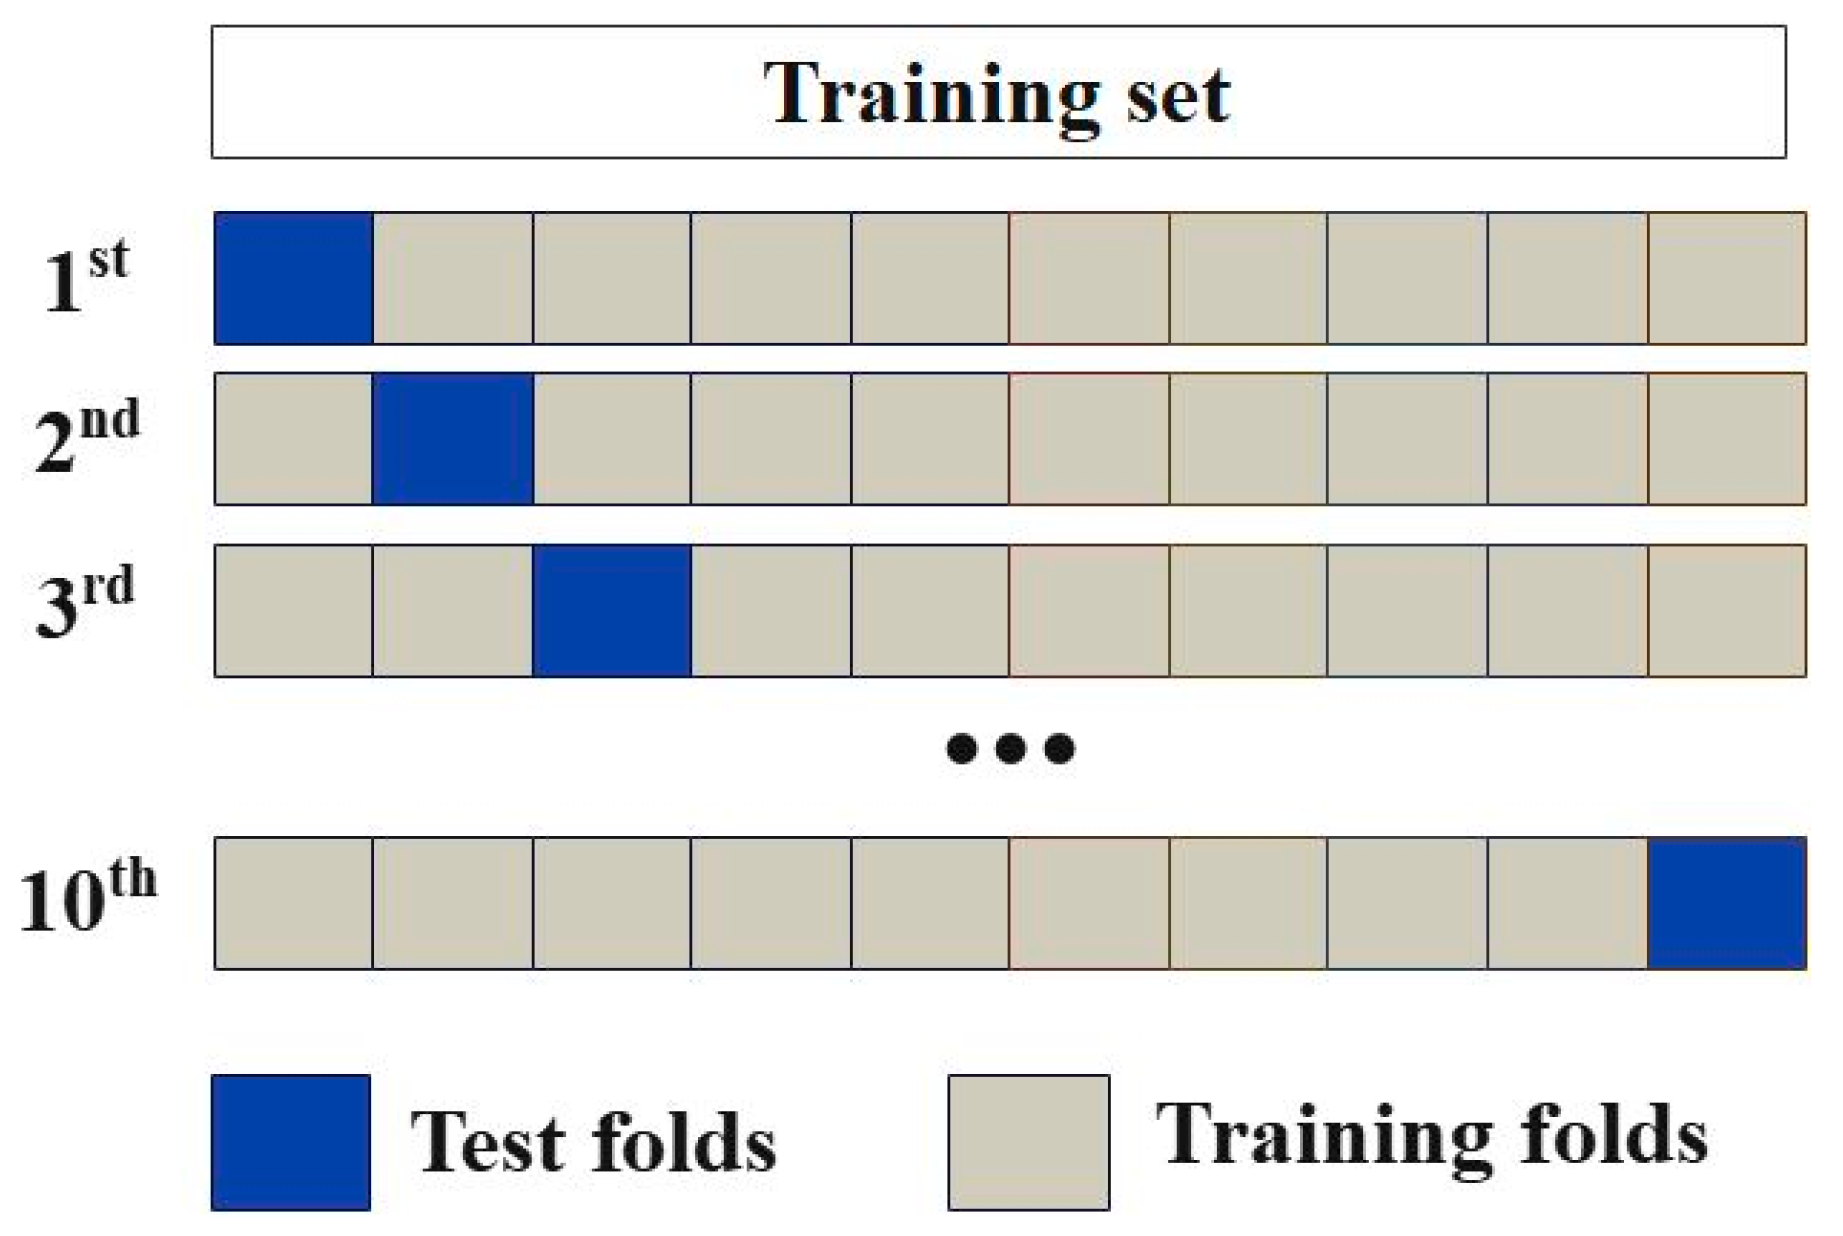
2.2.6. K-Fold cross-Validation
2.2.7. Model Evaluation
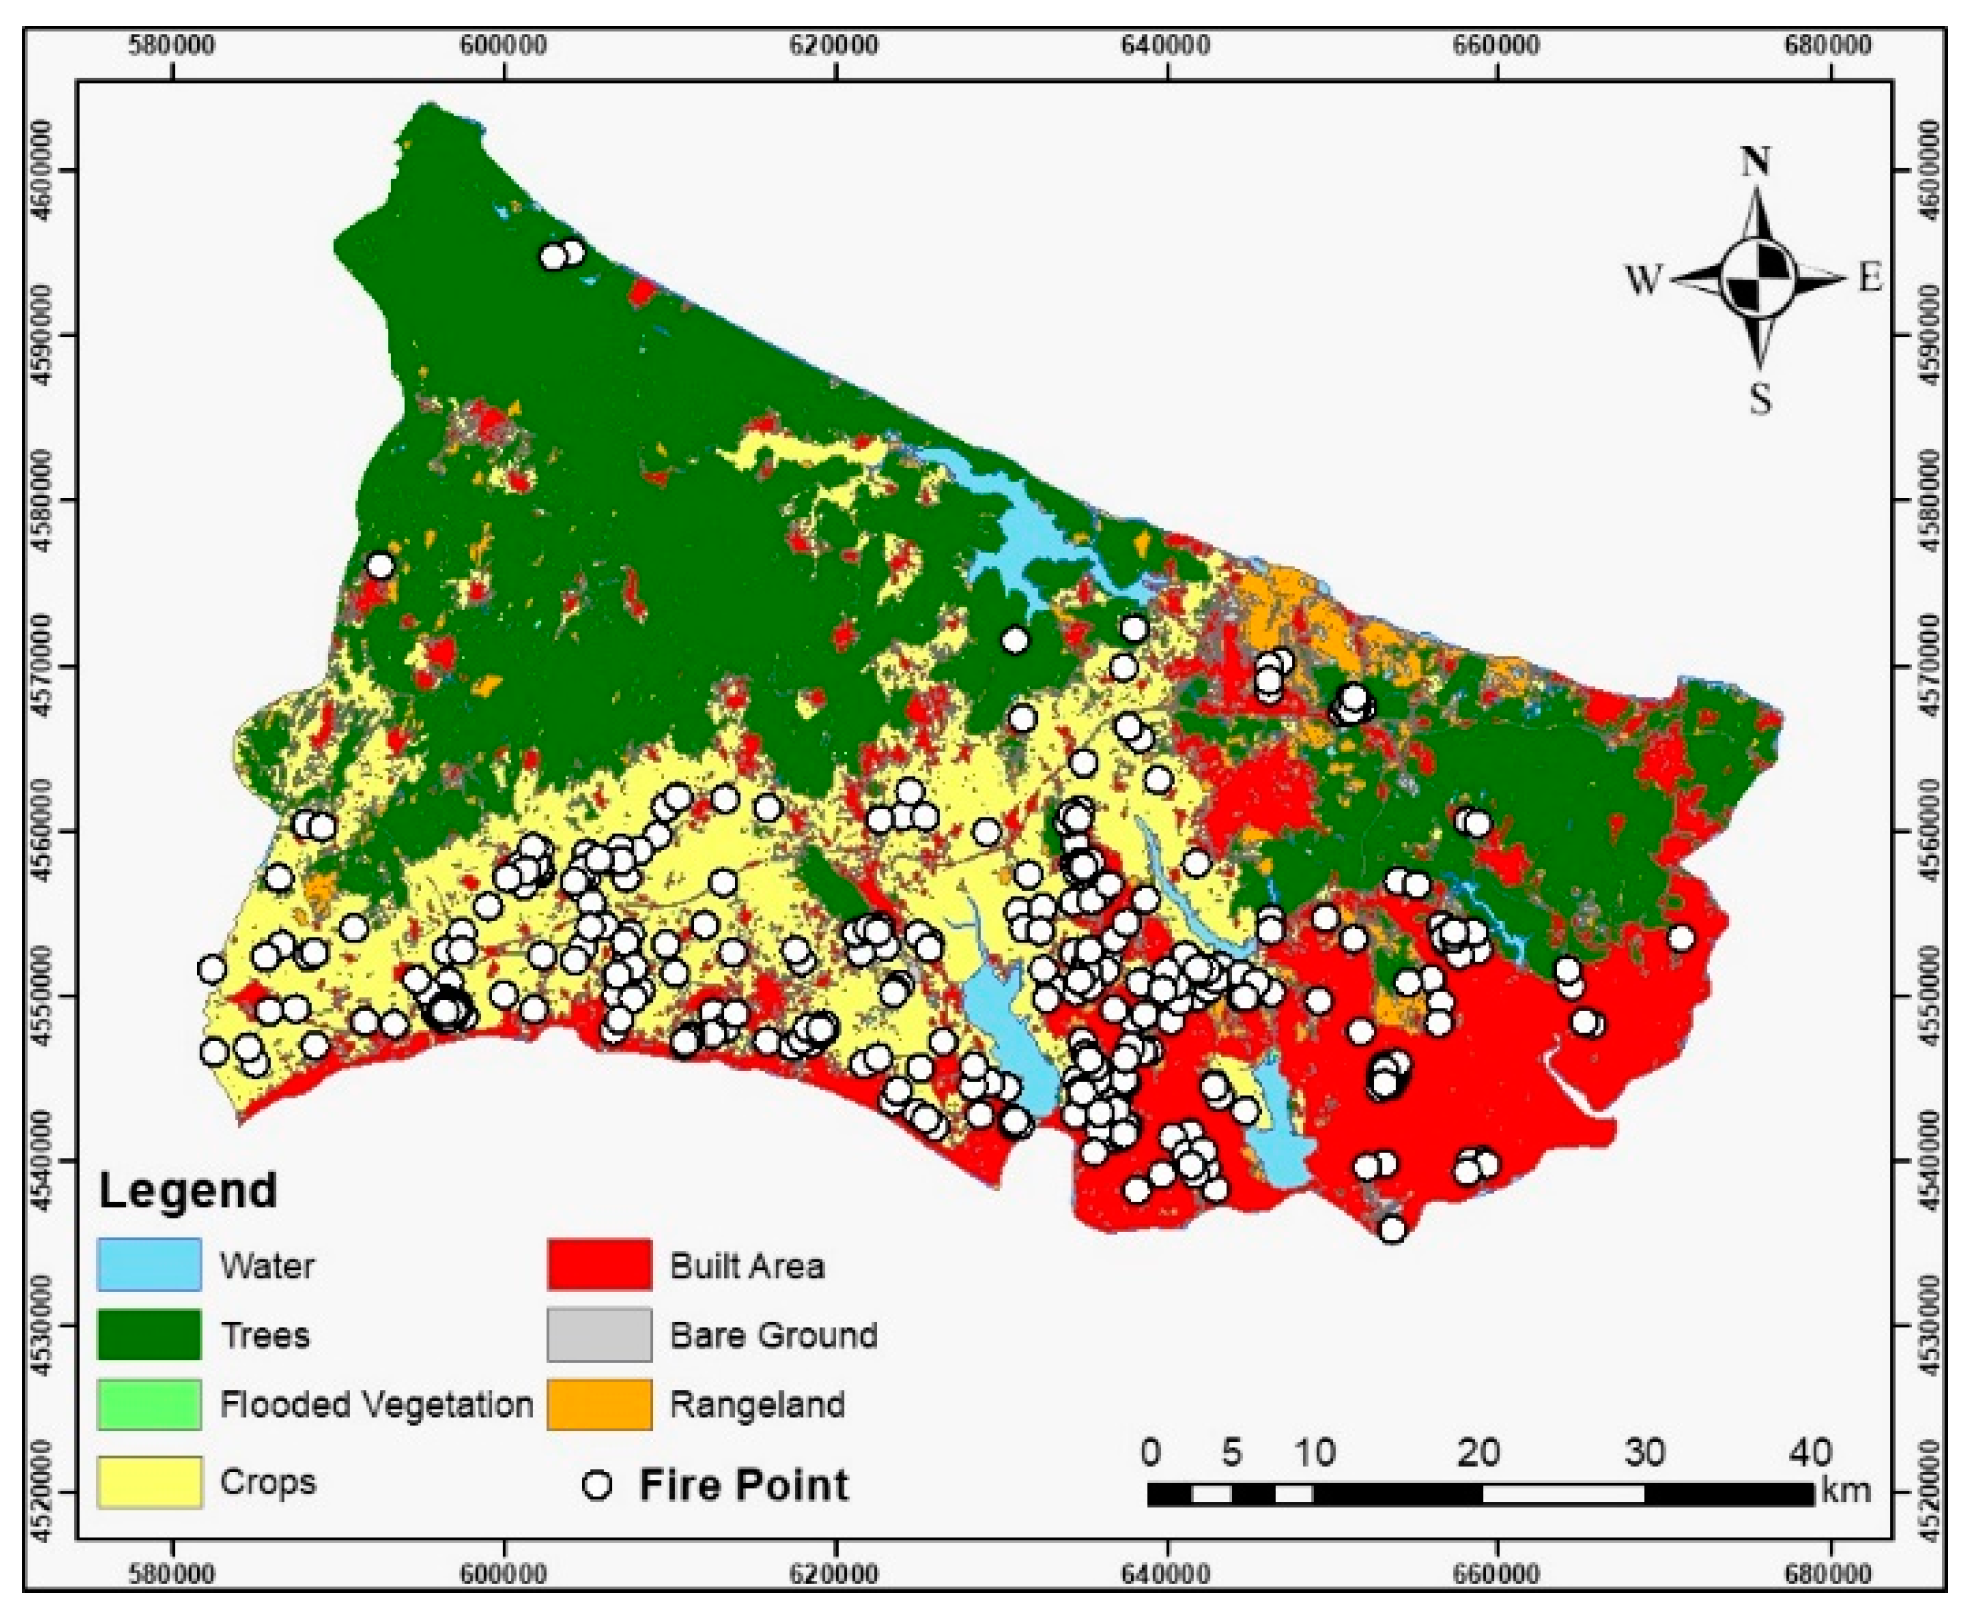
3. Results and Discussion
4. Conclusions
Author Contributions
Funding
Institutional Review Board Statement
Informed Consent Statement
Data Availability Statement
Conflicts of Interest
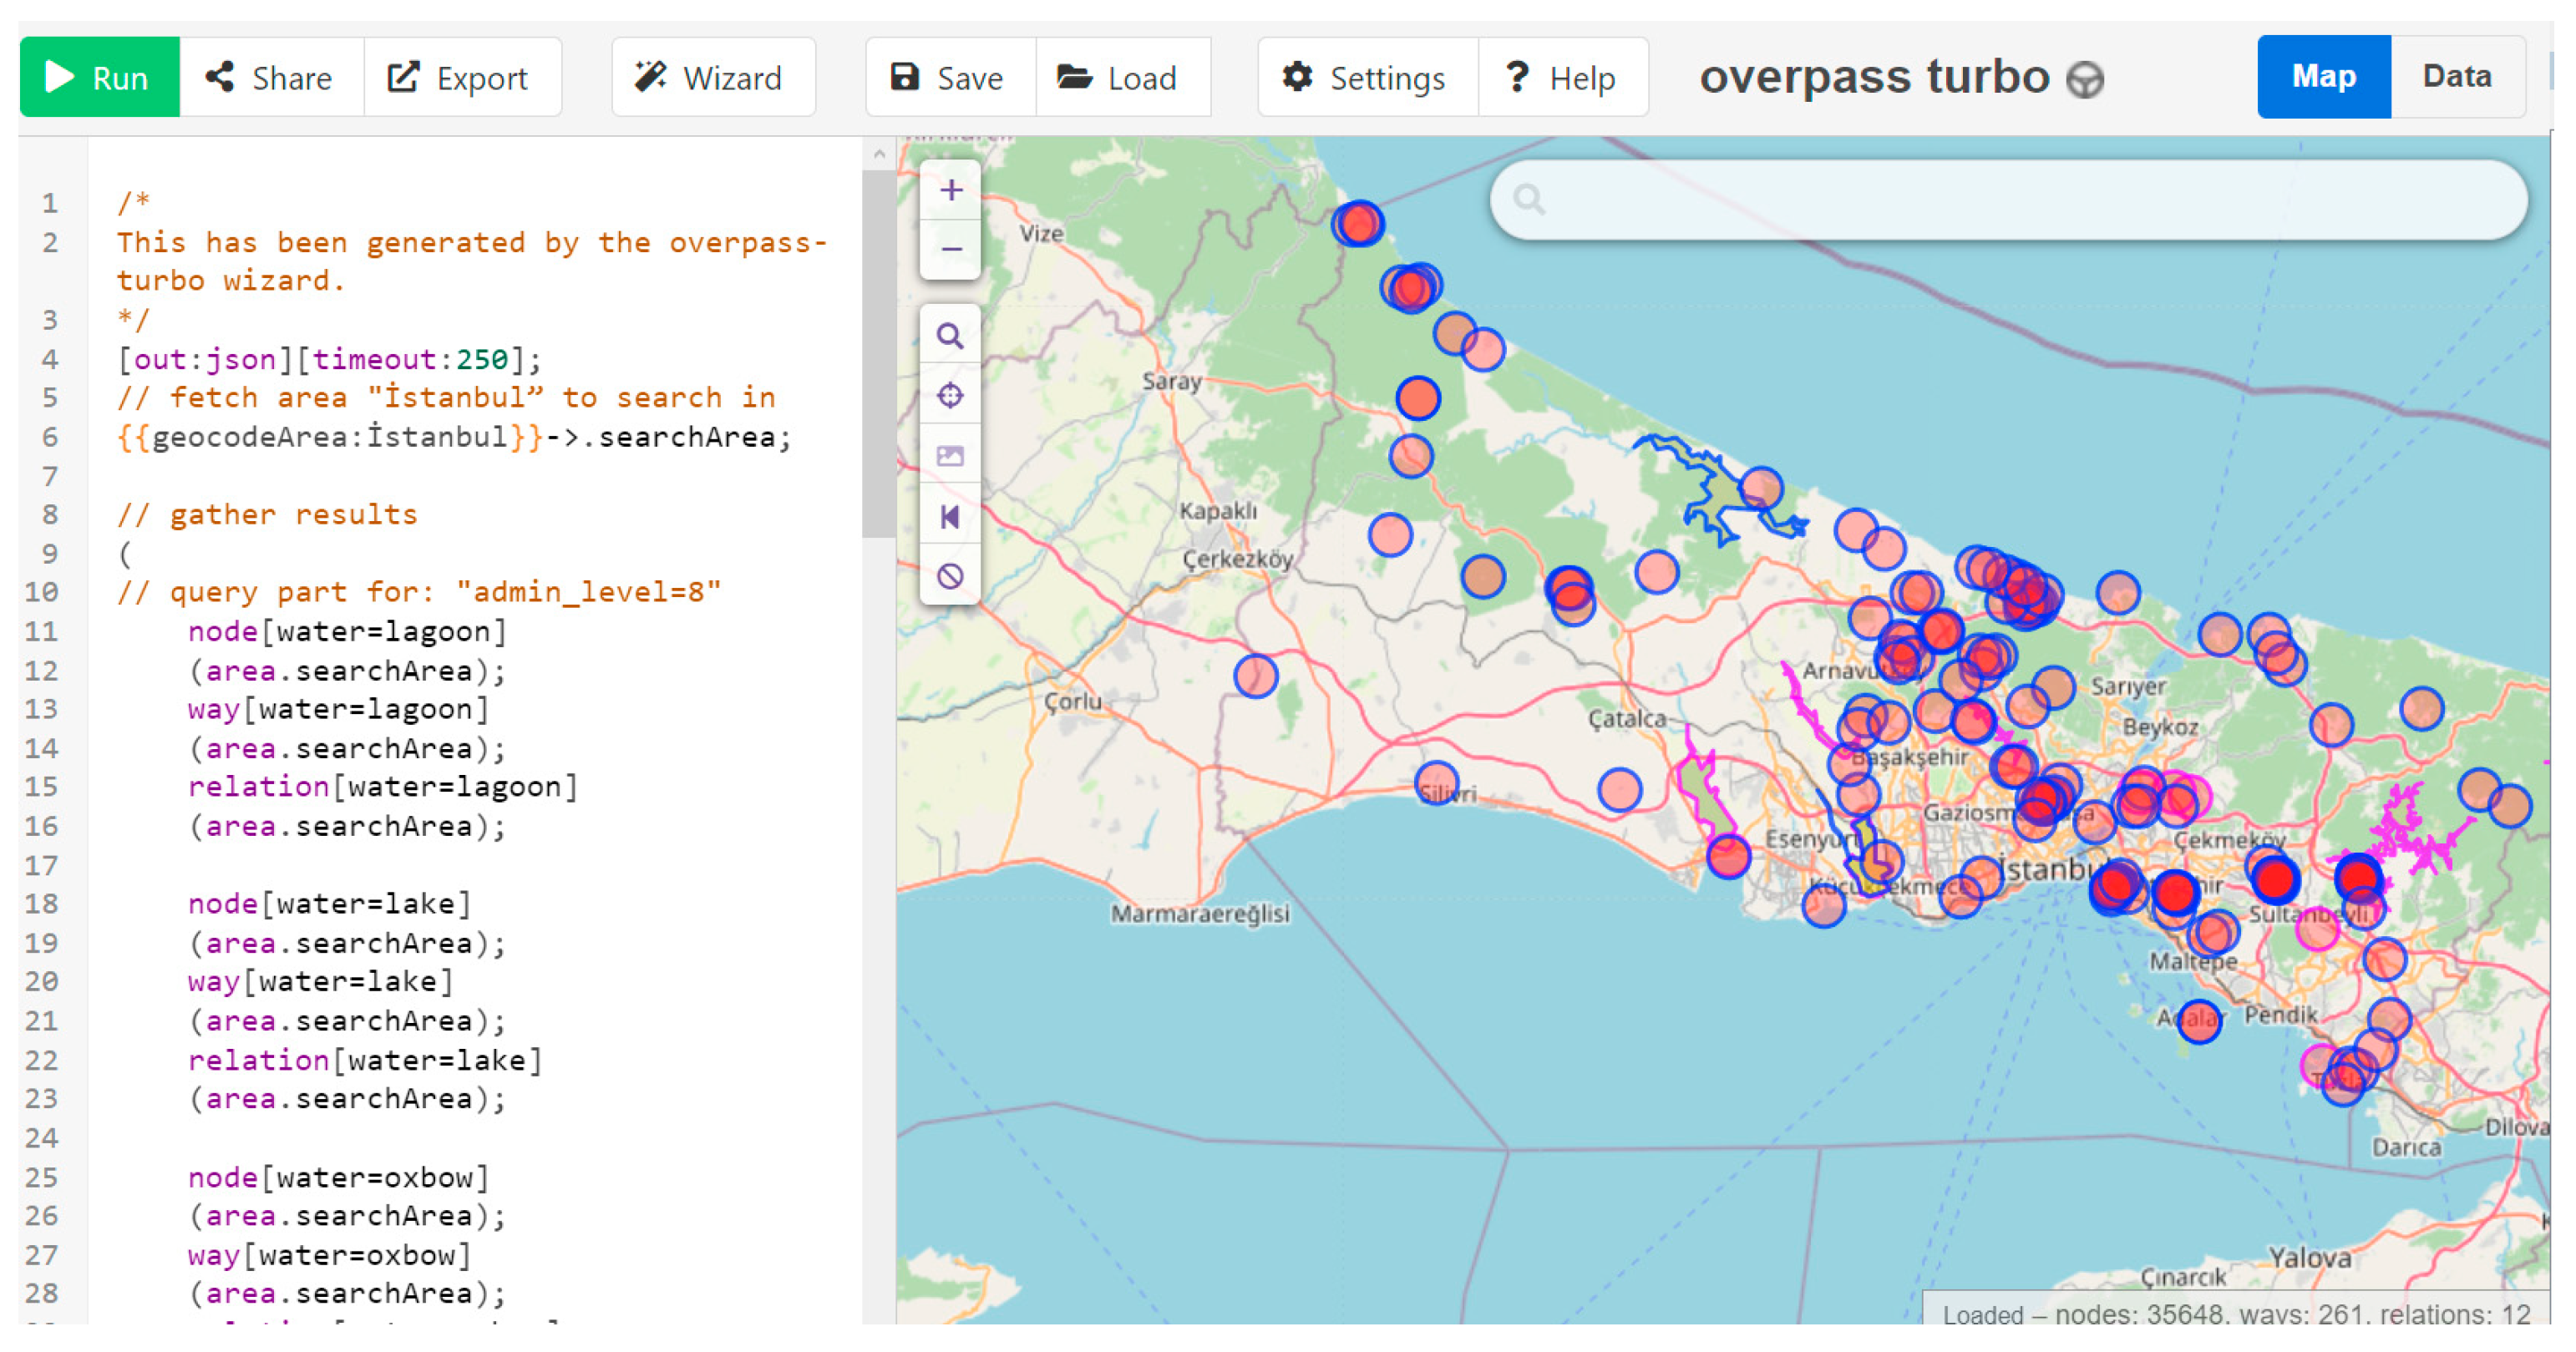
Appendix A. OSM Code Blocks
| Road | Water Areas | Power Line |
| */ [out:json][timeout:250]; // fetch area "İstanbul” to search in {{geocodeArea:İstanbul}}->.searchArea; // gather results ( // query part for: "admin_level=8" node[highway=motorway] (area.searchArea); way[highway=motorway] (area.searchArea); relation[highway=motorway] (area.searchArea); ); // print results out body; >; out skel qt; * The layers below, such as "lagoon" and "lake", have been obtained with the same method used in the code block above. node[highway=trunk] node[highway=primary] node[highway=secondary] node[highway=tertiary] node[highway=unclassified] node[highway=residential] | */ [out:json][timeout:250]; // fetch area "İstanbul” to search in {{geocodeArea:İstanbul}}->.searchArea; // gather results ( // query part for: "admin_level=8" node[water=lagoon] (area.searchArea); way[water=lagoon] (area.searchArea); relation[water=lagoon] (area.searchArea); node[water=lake] node[water=oxbow] ); // print results out body; >; out skel qt; * The layers below, such as "lagoon" and "lake", have been obtained with the same method used in the code block above. node[water=oxbow] node[water=rapids] node[water=river] node[water=stream] node[water=river] node[water=stream_pool] node[water=reservoir] node[water=drain] | */ [out:json][timeout:250]; // fetch area "İstanbul” to search in {{geocodeArea:İstanbul}}->.searchArea; // gather results ( // query part for: "admin_level=8" node[power=line] (area.searchArea); way[power=line] (area.searchArea); relation[power=line] (area.searchArea); ); // print results out body; >; out skel qt; |
References
- Burns, T.J.; Kick, E.L.; Murray, D.A. Demography, Development and Deforestation in a World-System Perspective. Int. J. Comp. Sociol. 1994, 35, 221–239. [Google Scholar] [CrossRef]
- Iftekhar, M.S.; Hoque, A.K.F. Causes of Forest Encroachment: An Analysis of Bangladesh. GeoJournal 2005, 62, 95–106. [Google Scholar] [CrossRef]
- Maja, M.M.; Ayano, S.F. The Impact of Population Growth on Natural Resources and Farmers’ Capacity to Adapt to Climate Change in Low-Income Countries. Earth Syst. Environ. 2021, 5, 271–283. [Google Scholar] [CrossRef]
- The State of the World Forests—Forests, Biodiversity and People, 2020, Food and Agriculture Organization of the United Nation. Available online: https://www.fao.org/3/ca8642en/ca8642en.pdf (accessed on 3 May 2023).
- González-Cabán, A. Findings and Conclusions of the Second International Symposium on Fire Economics, Planning, and Policy: A Global View. In Proceedings of the International Symposium on Fire Economics, Planning, and Policy: A Global View, Córdoba, Spain, 19–22 April 2008; p. 1. [Google Scholar]
- Sebastián-López, A.; Salvador-Civil, R.; Gonzalo-Jiménez, J.; SanMiguel-Ayanz, J. Integration of socio-economic and environmental variables for modelling long-term fire danger in Southern Europe. Eur. J. For. Res. 2008, 127, 149–163. [Google Scholar] [CrossRef]
- Sari, F. Identifying anthropogenic and natural causes of wildfires by maximum entropy method-based ignition susceptibility distribution models. J. For. Res. 2022, 34, 355–371. [Google Scholar] [CrossRef]
- Vacchiano, G.; Foderi, C.; Berretti, R.; Marchi, E.; Motta, R. Modeling anthropogenic and natural fire ignitions in an inner-alpine valley. Nat. Hazards Earth Syst. Sci. 2018, 18, 935–948. [Google Scholar] [CrossRef]
- Romps, D.M.; Seeley, J.T.; Vollaro, D.; Molinari, J. Projected increase in lightning strikes in the United States due to global warming. Science 2014, 346, 851–854. [Google Scholar] [CrossRef]
- Balch, J.K.; Bradley, B.A.; Abatzoglou, J.T.; Nagy, R.C.; Fusco, E.J.; Mahood, A.L. Human-started wildfires expand the fire niche across the United States. Proc. Natl. Acad. Sci. USA 2017, 114, 2946–2951. [Google Scholar] [CrossRef]
- Lampin-Maillet, C.; Mantzavelas, A.; Galiana, L.; Jappiot, M.; Long, M.; Herrero, G.; Karlsson, O.; Iossifina, A.; Thalia, L.; Thanassis, P. Wildland urban interfaces, fire behaviour and vulnerability: Characterization, mapping and assessment. In Towards Integrated Fire Management—Outcomes of the European Project Fire Paradox; Lampin-Maillet, C., Ed.; European Forest Institute: Joensuu, Finland, 2010; p. 21. [Google Scholar]
- Radeloff, V.C.; Hammer, R.B.; Stewart, S.I.; Fried, J.S.; Holcomb, S.S.; McKeefry, J.F. The wildland-urban interface in the United States. Ecol. Appl. 2005, 15, 799–805. [Google Scholar] [CrossRef]
- Bento-Gonçalves, A.; Vieira, A. Wildfires in the wildland-urban interface: Key concepts and evaluation methodologies. Sci. Total Environ. 2020, 707, 135592. [Google Scholar] [CrossRef]
- Van Hoang, T.; Chou, T.Y.; Fang, Y.M.; Nguyen, N.T.; Nguyen, Q.H.; Canh, P.X.; Toan, D.N.B.; Nguyen, X.L.; Meadows, M.E. Mapping Forest Fire Risk and Development of Early Warning System for NW Vietnam Using AHP and MCA/GIS Methods. Appl. Sci. 2020, 10, 4348. [Google Scholar] [CrossRef]
- Kumari, B.; Pandey, A.C. Geo-imformatics based multi-criteria decision analysis (MCDA) through analytic hierarchy process (AHP) for forast fire risk mapping in Palamau Tiger Reserve, Jharkhand state, India. J. Earth Syst. Sci. 2020, 129, 204. [Google Scholar] [CrossRef]
- Fekir, Y.; Hamadouche, M.A.; Anteur, D. Integrated approach for the assessment of forest fire risk and burn severity mapping using GIS, AHP method, and Google Earth Engine in Western Algeria. Euro-Mediterr. J. Environ. Integr. 2022, 7, 531–544. [Google Scholar] [CrossRef]
- Novo, A.; Fariñas-Álvarez, N.; Martínez-Sánchez, J.; González-Jorge, H.; Fernández-Alonso, J.M.; Lorenzo, H. Mapping Forest Fire Risk—A Case Study in Galicia (Spain). Remote Sens. 2020, 12, 3705. [Google Scholar] [CrossRef]
- Ajin, R.S.; Loghin, A.-M.; Vinod, P.G.; Jacob, M.K. Forest Fire Risk Zone Mapping Using RS and GIS Techniques: A Study in Achankovil Forest Division, Kerala, India. J. Earth Environ. Health Sci. 2016, 2, 109. [Google Scholar] [CrossRef]
- Akay, A.E. Integrated Use of AHP and GIS Techniques for Generating Forest Fire Risk Map in Karacabey Flooded Forest. Environ. Sci. Proc. 2021, 3, 62. [Google Scholar] [CrossRef]
- Akay, A.E.; Şahin, H. Forest Fire Risk Mapping by using GIS Techniques and AHP Method: A Case Study in Bodrum (Turkey). Eur. J. For. Eng. 2019, 5, 25–35. [Google Scholar] [CrossRef]
- Akbulak, C.; Tatlı, H.; Aygün, G.; Sağlam, B. Forest fire risk analysis via integration of GIS, RS and AHP: The Case of Çanakkale, Turkey. J. Hum. Sci. 2018, 15, 2127–2143. [Google Scholar] [CrossRef]
- Cetin, M.; Pekkan, I.; Kavlak, M.O.; Atmaca, I.; Nasery, S.; Derakhshandeh, M.; Cabuk, S.N. GIS-based forest fire risk determination for Milas district, Turkey. Nat. Hazards 2022, 1–22. [Google Scholar] [CrossRef]
- Chavan, M.E.; Das, K.K.; Suryawanshi, R.S. Forest fire risk zonation using Remote Sensing and GIS in Huynial watershed, Tehri Garhwal district, UA. Int. J. Basic Appl. Res. 2012, 2, 6–12. [Google Scholar]
- Jaiswal, R.K.; Mukherjee, S.; Raju, K.D.; Saxena, R. Forest fire risk zone mapping from satellite imagery and GIS. Int. J. Appl. Earth Obs. Geoinf. 2002, 4, 1–10. [Google Scholar] [CrossRef]
- Kayet, N.; Chakrabarty, A.; Pathak, K.; Sahoo, S.; Dutta, T.; Hatai, B.K. Comparative analysis of multi-criteria probabilistic FR and AHP models for forest fire risk (FFR) mapping in Melghat Tiger Reserve (MTR) forest. J. For. Res. 2020, 31, 565–579. [Google Scholar] [CrossRef]
- Lamat, R.; Kumar, M.; Kundu, A.; Lal, D. Forest fire risk mapping using analytical hierarchy process (AHP) and earth observation datasets: A case study in the mountainous terrain of Northeast India. SN Appl. Sci. 2021, 3, 425. [Google Scholar] [CrossRef]
- Mohammadi, F.; Bavaghar, M.P.; Shabanian, N. Forest Fire Risk Zone Modeling Using Logistic Regression and GIS: An Iranian Case Study. Small-Scale For. 2014, 13, 117–125. [Google Scholar] [CrossRef]
- Naskar, S.; Rahaman, A.; Biswas, B. Forest Fire Susceptibility Mapping of West Sikkim District, India using MCDA techniques of AHP & TOPSIS model. Res. Sq. 2022, 1–23. [Google Scholar]
- Nikhil, S.; Danumah, J.H.; Saha, S.; Prasad, M.K.; Rajaneesh, A.; Mammen, P.C.; Ajin, R.S.; Kuriakose, S.L. Correction to: Application of GIS and AHP Method in Forest Fire Risk Zone Mapping: A Study of the Parambikulam Tiger Reserve, Kerala, India. J. Geovisualization Spat. Anal. 2021, 5, 14. [Google Scholar] [CrossRef]
- Nuthammachot, N.; Stratoulias, D. Multi-criteria decision analysis for forest fire risk assessment by coupling AHP and GIS: Method and case study. Environ. Dev. Sustain. 2021, 23, 17443–17458. [Google Scholar] [CrossRef]
- Nuthammachot, N.; Stratoulias, D. A GIS- and AHP-based approach to map fire risk: A case study of Kuan Kreng peat swamp forest, Thailand. Geocarto Int. 2021, 36, 212–225. [Google Scholar] [CrossRef]
- Özşahin, E. Forest Fire Susceptibility Analysis Using Gis and Ahp: The Case of Antakya Forestry Operation Directorate. Route Educ. Soc. Sci. J. 2014, 1, 50–71. [Google Scholar] [CrossRef]
- Pandey, K.; Ghosh, S.K. Modeling of parameters for forest fire risk zone mapping. Int. Arch. Photogramm. Remote Sens. Spat. Inf. Sci. ISPRS Arch. 2018, 42, 299–304. [Google Scholar] [CrossRef]
- Qtaishat, K.; Shatnawi, N.; Habib, M. Forest Fire Risk Zonation Using Remote Sensing and GIS Technology. Case study in Jordan. For. Fire Int. J. Environ. Glob. Clim. Change 2017, 5, 1–8. [Google Scholar]
- Rahmani, S.; Benmassoud, H. Modelling of forest fire risk spatial distribution in the region of Aures, Algeria. Geoadria 2019, 24, 79–92. [Google Scholar] [CrossRef]
- Setiawan, I.; Mahmud, A.; Mansor, S.; Shariff, A.M.; Nuruddin, A. GIS-grid-based and multi-criteria analysis for identifying and mapping peat swamp forest fire hazard in Pahang, Malaysia. Disaster Prev. Manag. Int. J. 2004, 13, 379–386. [Google Scholar] [CrossRef]
- Sivrikaya, F.; Küçük, Ö. Modeling forest fire risk based on GIS-based analytical hierarchy process and statistical analysis in Mediterranean region. Ecol. Inform. 2022, 68, 101537. [Google Scholar] [CrossRef]
- Soydan, O. Determination of Forest Fire Risk Using GIS: A Case Study in Nigde, Turkey. Bartın Orman Fakültesi Derg. 2022, 24, 77–94. [Google Scholar] [CrossRef]
- Suryabhagavan, K.V.; Alemu, M.; Balakrishnan, M. Gis-based multi-criteria decision analysis for forest fire susceptibility mapping: A case study in Harenna forest, southwestern Ethiopia. Trop. Ecol. 2016, 57, 33–43. [Google Scholar]
- Chuvieco, E.; Congalton, R.G. Application of remote sensing and geographic information systems to forest fire hazard mapping. Remote Sens. Environ. 1989, 29, 147–159. [Google Scholar] [CrossRef]
- Eskandari, S.; Chuvieco, E. Fire danger assessment in Iran based on geospatial information. Int. J. Appl. Earth Obs. Geoinf. 2015, 42, 57–64. [Google Scholar] [CrossRef]
- Yakubu, I.; Mireku-Gyimah, D.; Duker, A. A Review of methods for modelling forest fire risk and hazard. Afr. J. Environ. Sci. Technol. 2015, 9, 155–165. [Google Scholar]
- Xie, Y.; Peng, M. Forest fire forecasting using ensemble learning approaches. Neural Comput. Appl. 2019, 31, 4541–4550. [Google Scholar] [CrossRef]
- Pourghasemi, H.R.; Kariminejad, N.; Amiri, M.; Edalat, M.; Zarafshar, M.; Blaschke, T.; Cerda, A. Assessing and mapping multi-hazard risk susceptibility using a machine learning technique. Sci. Rep. 2020, 10, 3203. [Google Scholar] [CrossRef]
- Rubí, J.N.; de Carvalho, P.H.; Gondim, P.R. Application of machine learning models in the behavioral study of forest fires in the Brazilian Federal District region. Eng. Appl. Artif. Intell. 2023, 118, 105649. [Google Scholar] [CrossRef]
- Lu, Y.; Fan, X.; Zhao, Z.; Jiang, X. Dynamic Fire Risk Classification Prediction of Stadiums: Multi-Dimensional Machine Learning Analysis Based on Intelligent Perception. Appl. Sci. 2022, 12, 6607. [Google Scholar] [CrossRef]
- Pang, Y.; Li, Y.; Feng, Z.; Feng, Z.; Zhao, Z.; Chen, S.; Zhang, H. Forest Fire Occurrence Prediction in China Based on Machine Learning Methods. Remote Sens. 2022, 14, 5546. [Google Scholar] [CrossRef]
- Mohajane, M.; Costache, R.; Karimi, F.; Bao Pham, Q.; Essahlaoui, A.; Nguyen, H.; Laneve, G.; Oudija, F. Application of remote sensing and machine learning algorithms for forest fire mapping in a Mediterranean area. Ecol. Indic. 2021, 129, 107869. [Google Scholar] [CrossRef]
- Dwiasnati, S.; Devianto, Y. Classification of forest fire areas using machine learning algorithm. World J. Adv. Eng. Technol. Sci. 2021, 3, 008–015. [Google Scholar] [CrossRef]
- Ercan, U. Estimating of Households Shopping on The Internet Using Random Forest Method. Kafkas Üniversitesi İktisadi Ve İdari Bilim Fakültesi Derg 2021, 12, 728–752. [Google Scholar] [CrossRef]
- Ercan, U. Determining Airline Customer Satisfaction with Ensemble Learning Methods. Alanya Acad. Rev. 2022, 6, 2763–2774. [Google Scholar] [CrossRef]
- Kalantar, B.; Ueda, N.; Idrees, M.O.; Janizadeh, S.; Ahmadi, K.; Shabani, F. Forest fire susceptibility prediction based on machine learning models with resampling algorithms on remote sensing data. Remote Sens. 2020, 12, 3682. [Google Scholar] [CrossRef]
- Atmiş, E.; Tolunay, D.; Erdönmez, C. Bölüm I-II Orman Yangınlarının Sayısal Analizi. In Orman Yangınları; Kavgacı, A., Başaran, M.A., Eds.; Türkiye Ormancılar Derneği Yayını: Ankara, Turkey, 2023; 422p, ISBN 978-605-71791-4-2. [Google Scholar]
- Üstün, A.K.; Angün, A.S. İstanbul'un ilçelerinin afet yönetimi açısından önem ağırlıklarının analitik hiyerarşi süreci kullanılarak belirlenmesi. Gazi Üniversitesi Mühendislik Mimar. Fakültesi Derg. 2016, 31, 119–128. [Google Scholar] [CrossRef][Green Version]
- Gürel, A.; Balta, Y. İstanbul’ un göç olayı ve etnik hayat üzerine. Marmara Sos. Araştırmalar Derg. 2011, 1, 1–15. [Google Scholar]
- Sentinel Hub Public Collections. 2021. Available online: https://collections.sentinel-hub.com/impact-observatory-lulc-map (accessed on 3 August 2023).
- Overpass Turbo. 2022. Available online: http://overpass-turbo.eu (accessed on 10 May 2023).
- Esri, Sentinel-2 Land Cover Explorer. 2022. Available online: https://livingatlas.arcgis.com/landcoverexplorer (accessed on 10 May 2023).
- Bayani, R.; Waseem, M.; Manshadi, S.D.; Davani, H. Quantifying the risk of wildfire ignition by power lines under extreme weather conditions. IEEE Syst. J. 2022, 17, 1024–1034. [Google Scholar] [CrossRef]
- Shi, S.; Yao, C.; Wang, S.; Han, W. A model design for risk assessment of line tripping caused by wildfires. Sensors 2018, 18, 1941. [Google Scholar] [CrossRef] [PubMed]
- Taylor, S.; Roald, L.A. A framework for risk assessment and optimal line upgrade selection to mitigate wildfire risk. Electr. Power Syst. Res. 2022, 213, 108592. [Google Scholar] [CrossRef]
- Breiman, L. Random forests. Mach. Learn. 2001, 45, 5–32. [Google Scholar] [CrossRef]
- Chen, T.; Guestrin, C. Xgboost: A scalable tree boosting system. In Proceedings of the 22nd Acm Sigkdd International Conference on Knowledge Discovery and Data Mining, San Francisco, CA, USA, 13–17 August 2016; pp. 785–794. [Google Scholar] [CrossRef]
- Fan, J.; Ma, X.; Wu, L.; Zhang, F.; Yu, X.; Zeng, W. Light Gradient Boosting Machine: An efficient soft computing model for estimating daily reference evapotranspiration with local and external meteorological data. Agric. Water Manag. 2019, 225, 105758. [Google Scholar] [CrossRef]
- Jain, P.; Coogan, S.C.; Subramanian, S.G.; Crowley, M.; Taylor, S.; Flannigan, M.D. A review of machine learning applications in wildfire science and management. Environ. Rev. 2020, 28, 478–505. [Google Scholar] [CrossRef]
- Rodrigues, M.; De la Riva, J. An insight into machine-learning algorithms to model human-caused wildfire occurrence. Environ. Model. Softw. 2014, 57, 192–201. [Google Scholar] [CrossRef]
- Tehrany, M.S.; Jones, S.; Shabani, F.; Martínez-Álvarez, F.; Tien Bui, D. A novel ensemble modeling approach for the spatial prediction of tropical forest fire susceptibility using LogitBoost machine learning classifier and multi-source geospatial data. Theor. Appl. Climatol. 2019, 137, 637–653. [Google Scholar] [CrossRef]
- Jahn, W.; Urban, J.L.; Rein, G. Powerlines and wildfires: Overview, perspectives, and climate change: Could there be more electricity blackouts in the future? IEEE Power Energy Mag. 2022, 20, 16–27. [Google Scholar]
- Parente, J.; Tonini, M.; Stamou, Z.; Koutsias, N.; Pereira, M. Quantitative Assessment of the Relationship between Land Use/Land Cover Changes and Wildfires in Southern Europe. Fire 2023, 6, 198. [Google Scholar] [CrossRef]


| Factors | Reference Number | |||||||||||||||||||||||||
|---|---|---|---|---|---|---|---|---|---|---|---|---|---|---|---|---|---|---|---|---|---|---|---|---|---|---|
| [33] | [24] | [27] | [36] | [30] | [39] | [29] | [31] | [14] | [21] | [20] | [25] | [15] | [26] | [37] | [16] | [17] | [23] | [19] | [38] | [35] | [18] | [34] | [32] | [22] | [28] | |
| Slope | x | x | x | x | x | x | x | x | x | x | x | x | x | x | x | x | x | x | x | x | x | x | x | x | x | x |
| Aspect | x | x | x | x | x | x | x | x | x | x | x | x | x | x | x | x | x | x | x | x | x | |||||
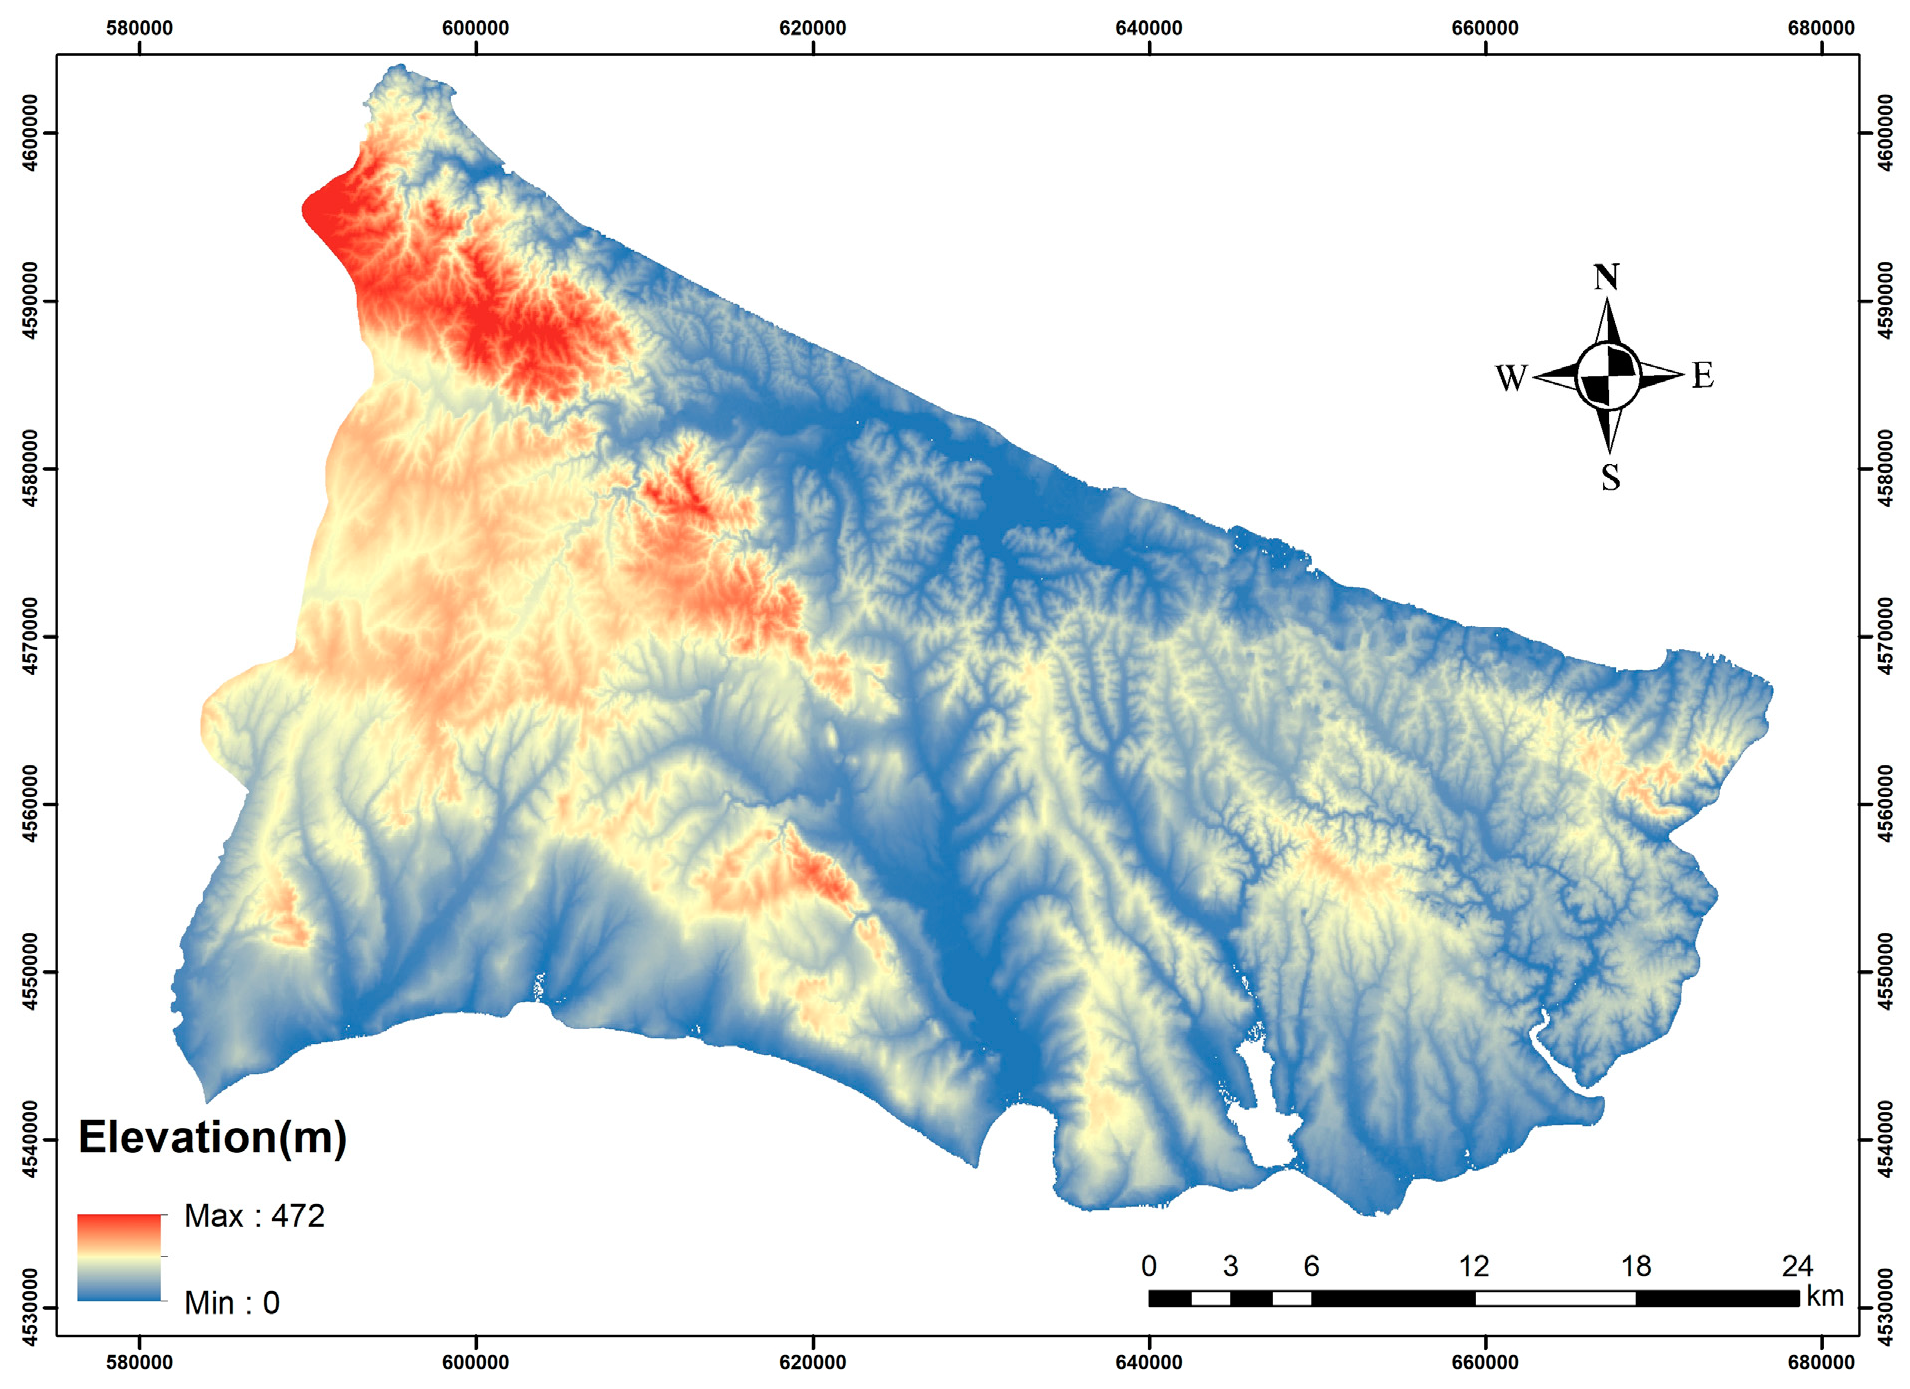
| Elevation | x | x | x | x | x | x | x | x | x | x | x | x | x | x | x | x | x | x | x | x | ||||||
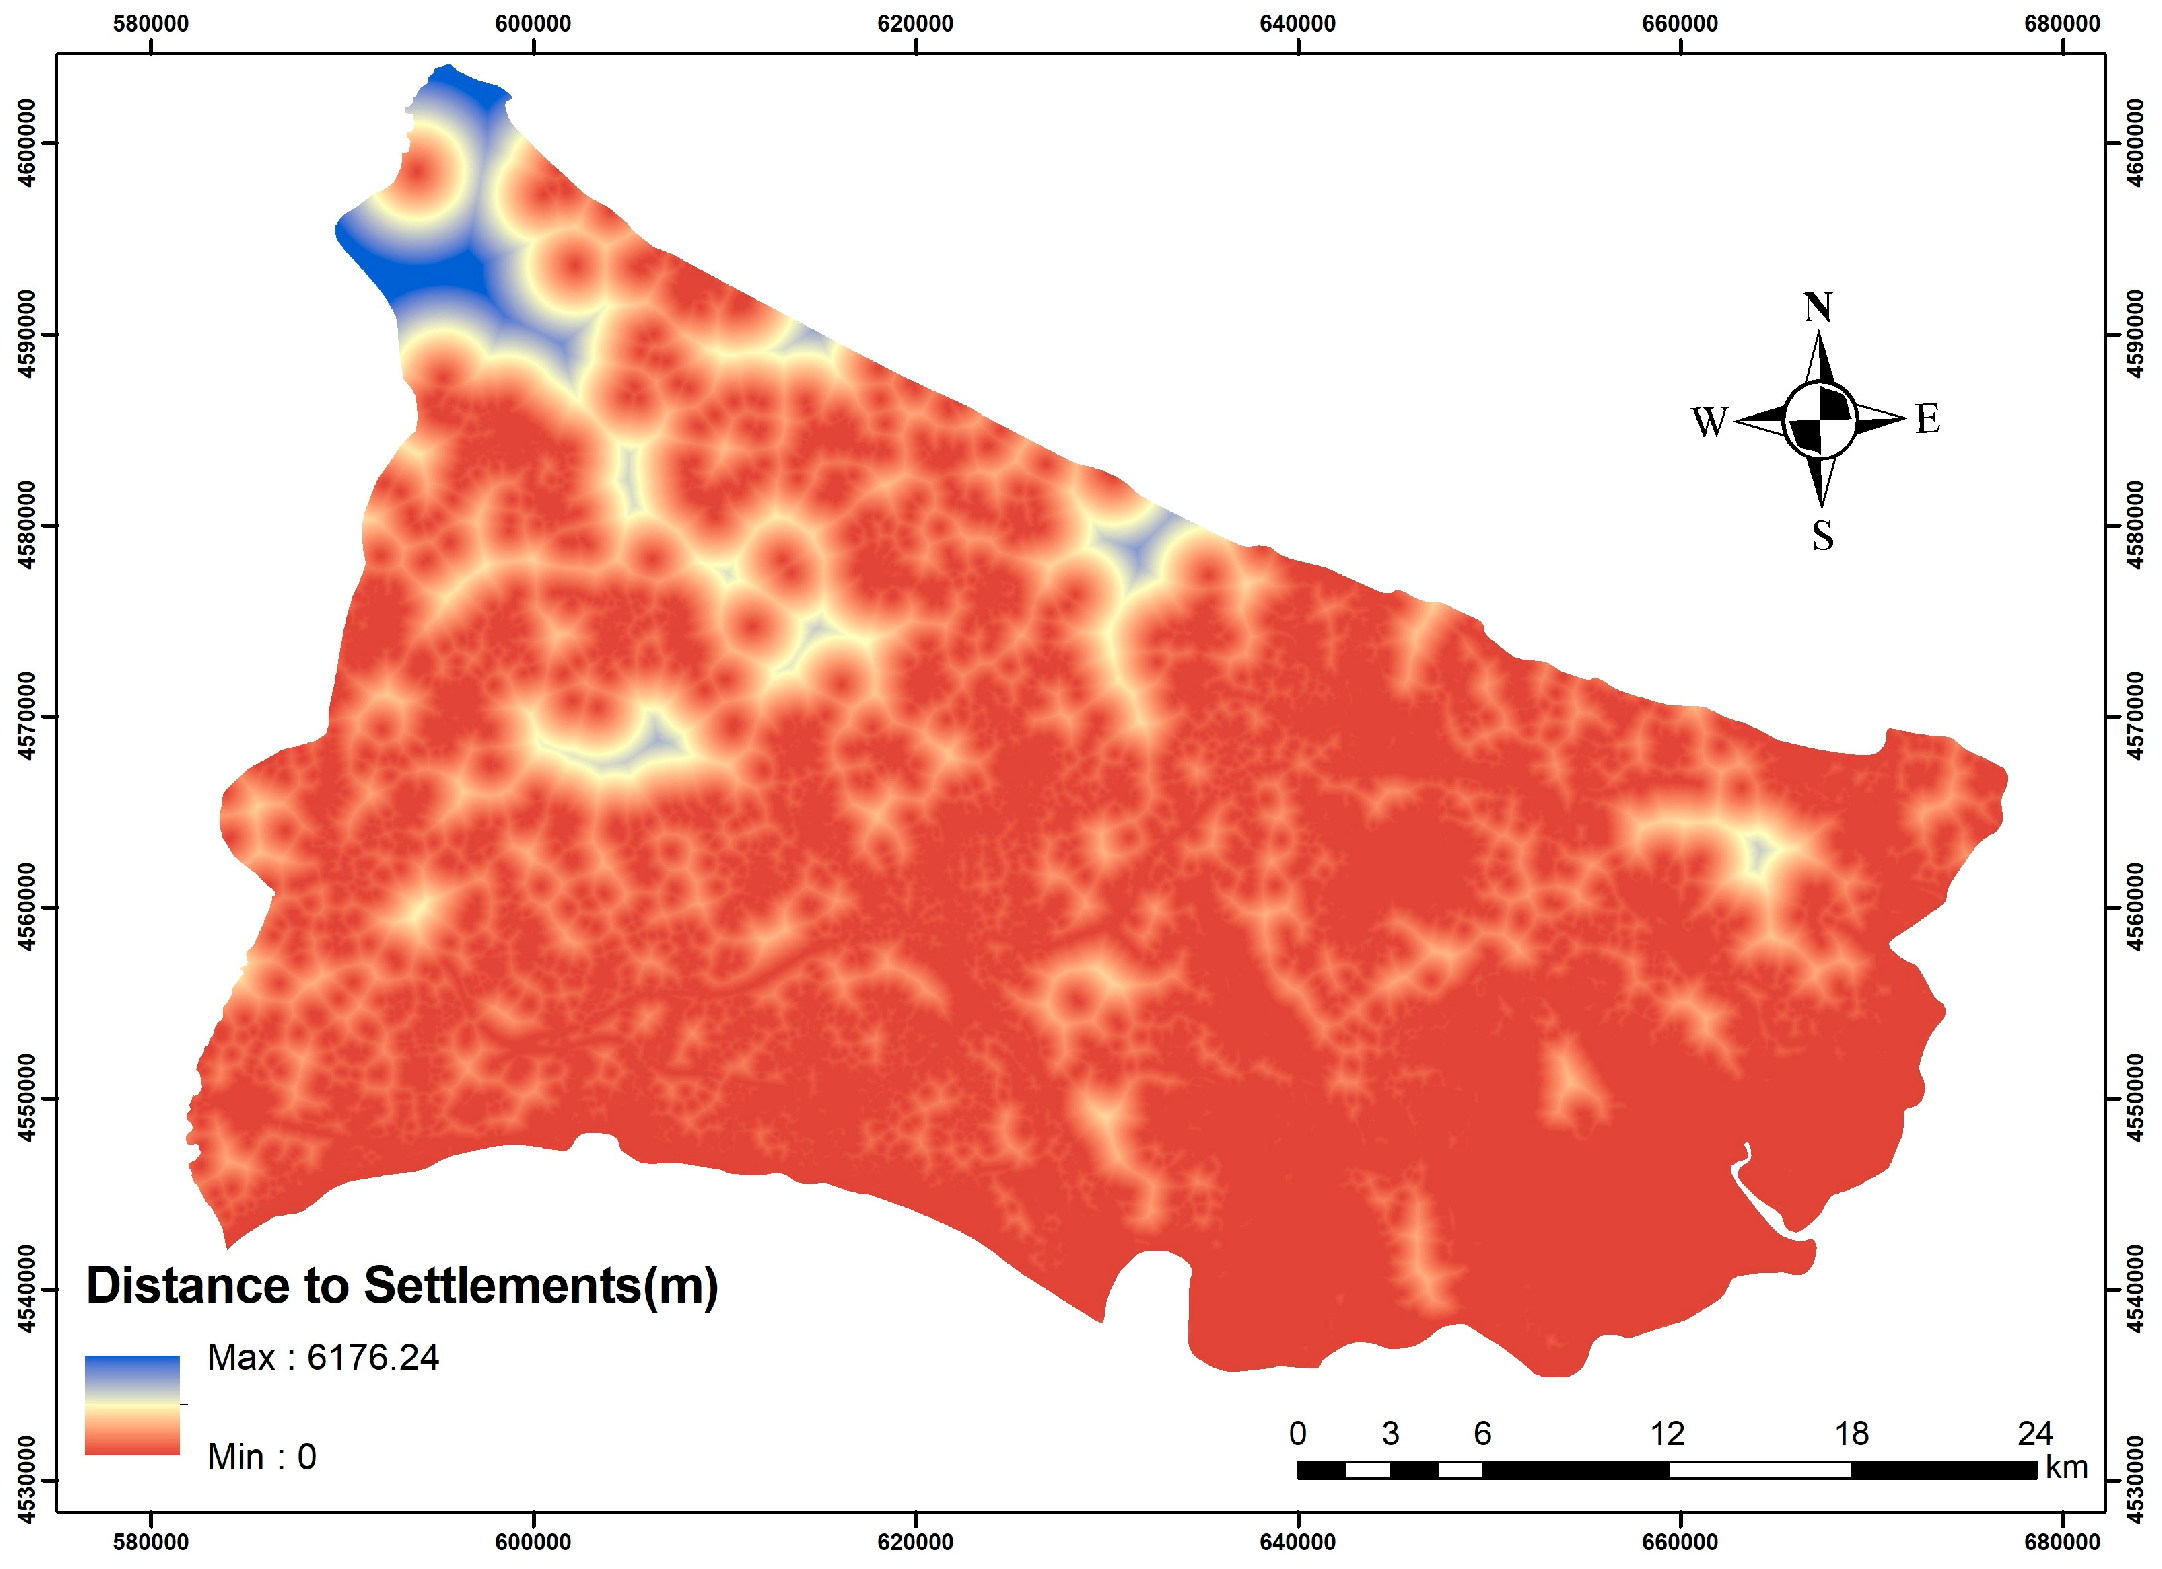
| Distance to settlements | x | x | x | x | x | x | x | x | x | x | x | x | x | x | x | x | x | x | x | x | ||||||
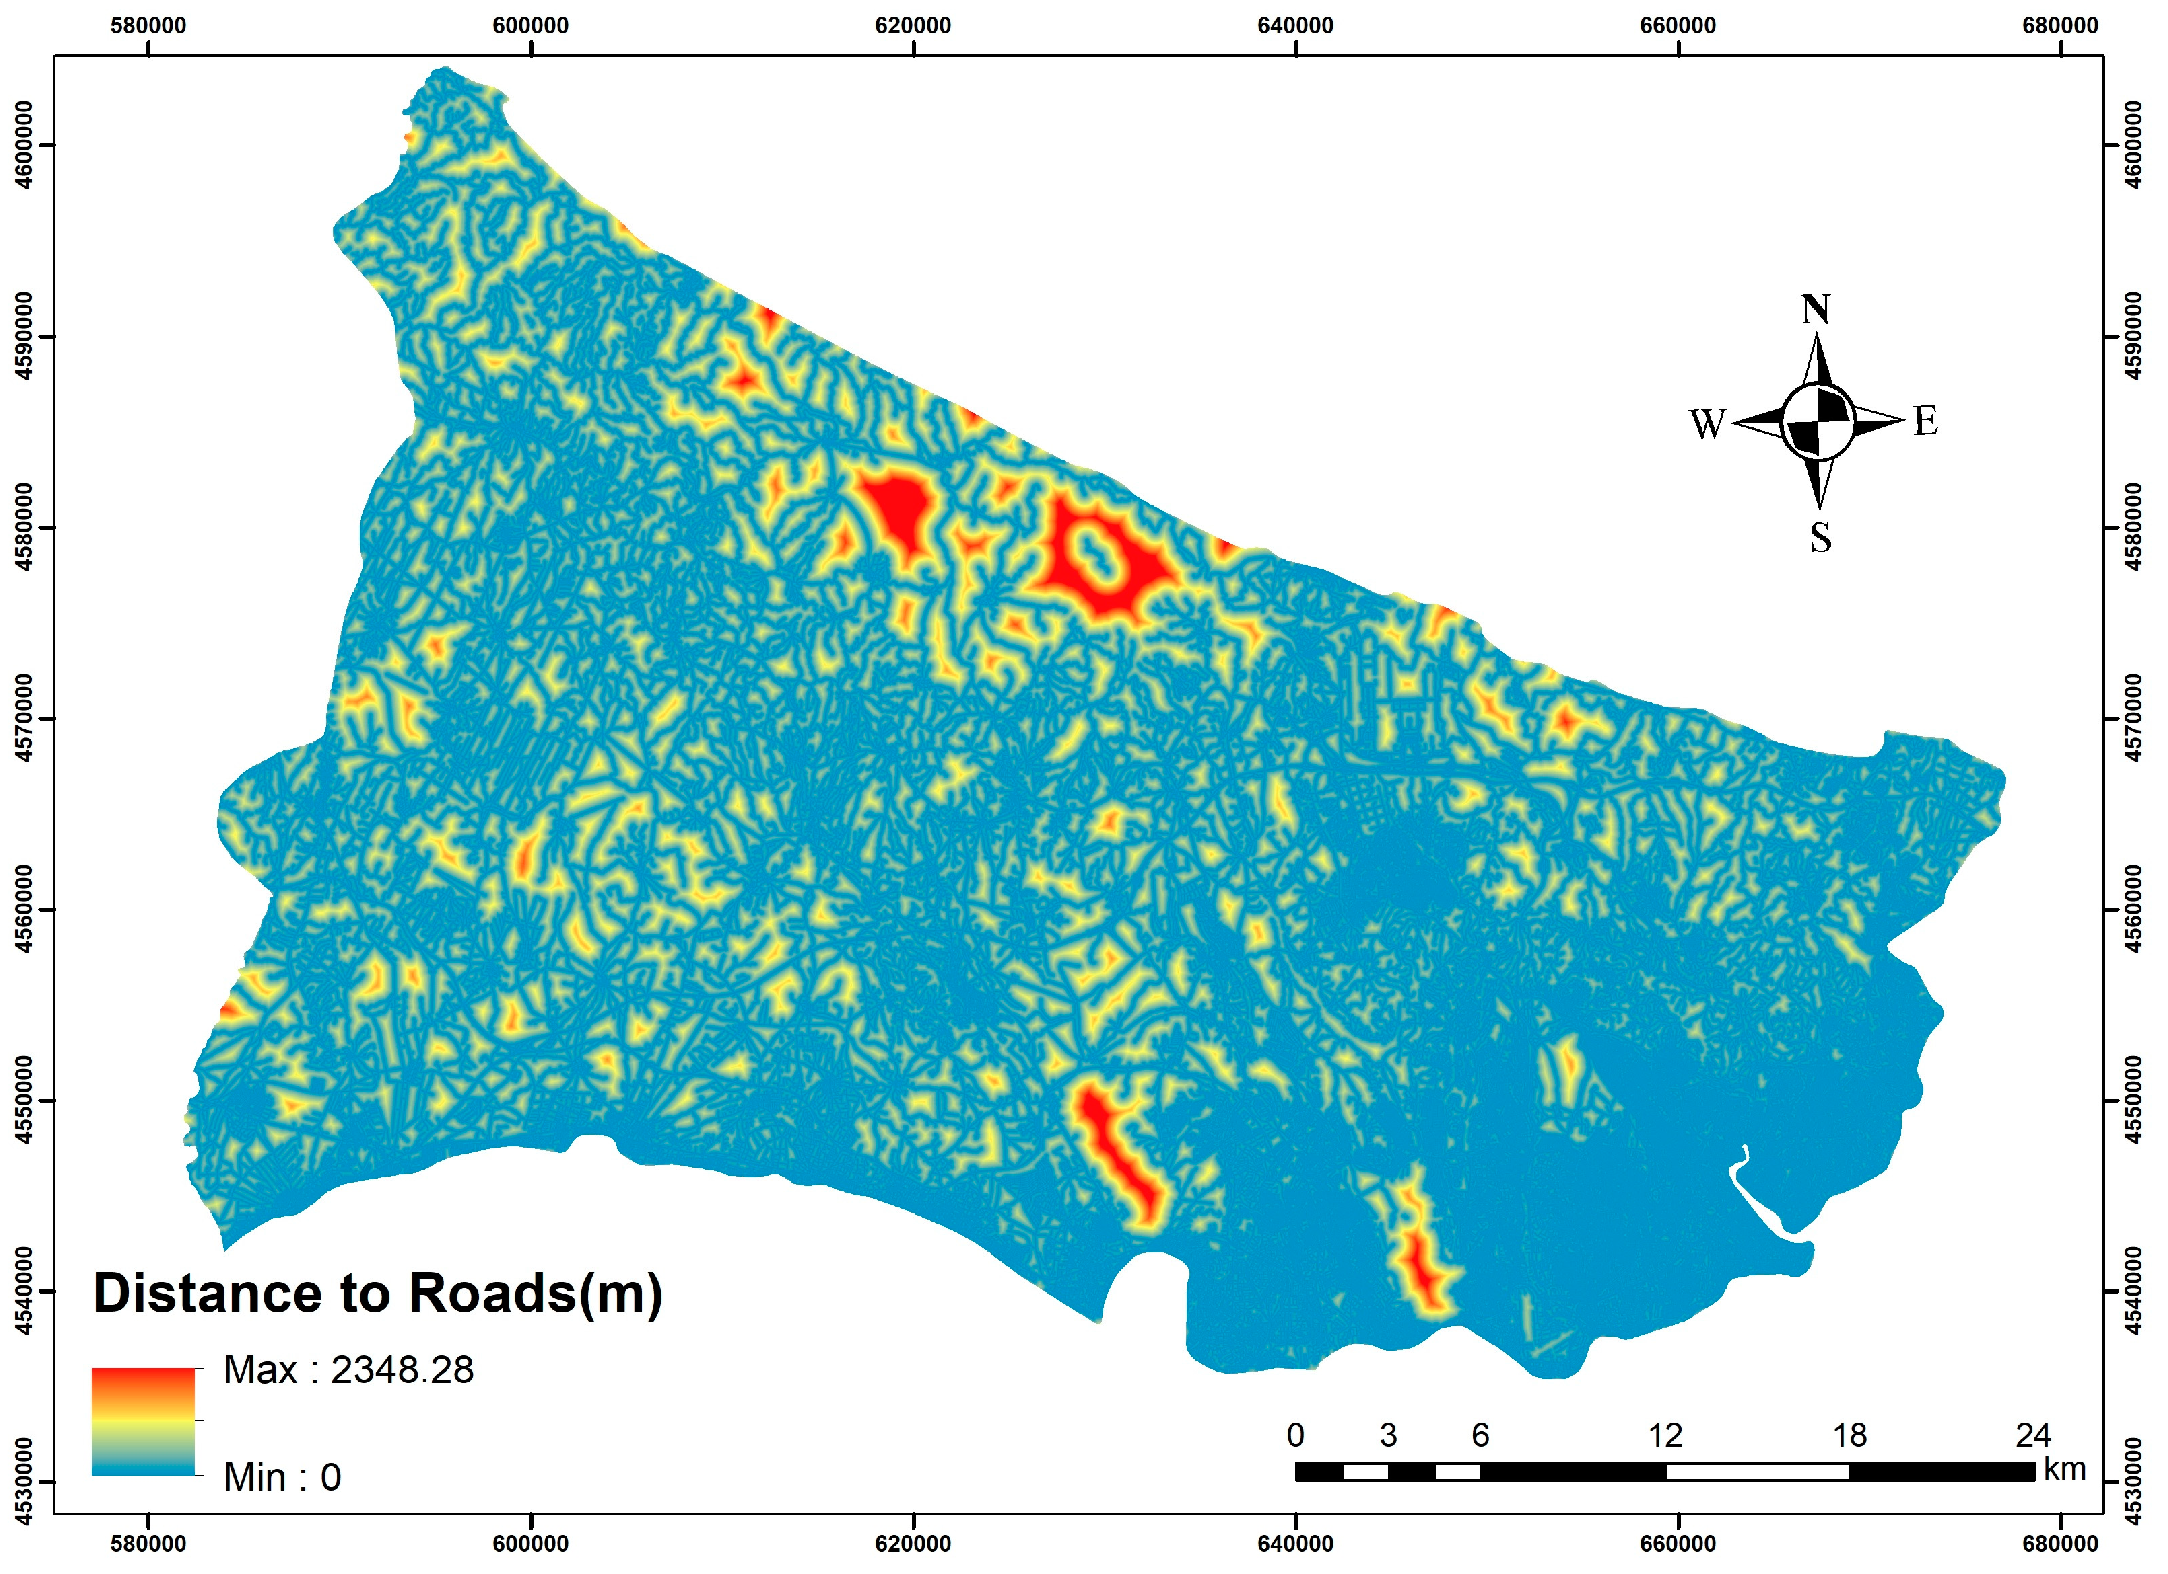
| Distance to roads | x | x | x | x | x | x | x | x | x | x | x | x | x | x | x | x | x | x | ||||||||
| Distance to water bodies | x | x | x | x | x | x | x | x | x | |||||||||||||||||
| Land use | x | x | x | x | x | x | x | x | x | |||||||||||||||||
| Precipitation | x | x | x | x | x | x | x | x | ||||||||||||||||||
| Vegetation density | x | x | x | x | x | |||||||||||||||||||||
| Temperature | x | x | x | x | x | |||||||||||||||||||||
| Plant type | x | x | x | x | x | |||||||||||||||||||||
| Distance from agricultural land | x | x | x | x | ||||||||||||||||||||||
| Wind speed | x | x | x | x | ||||||||||||||||||||||
| Stand crown closure | x | x | x | x | x | |||||||||||||||||||||
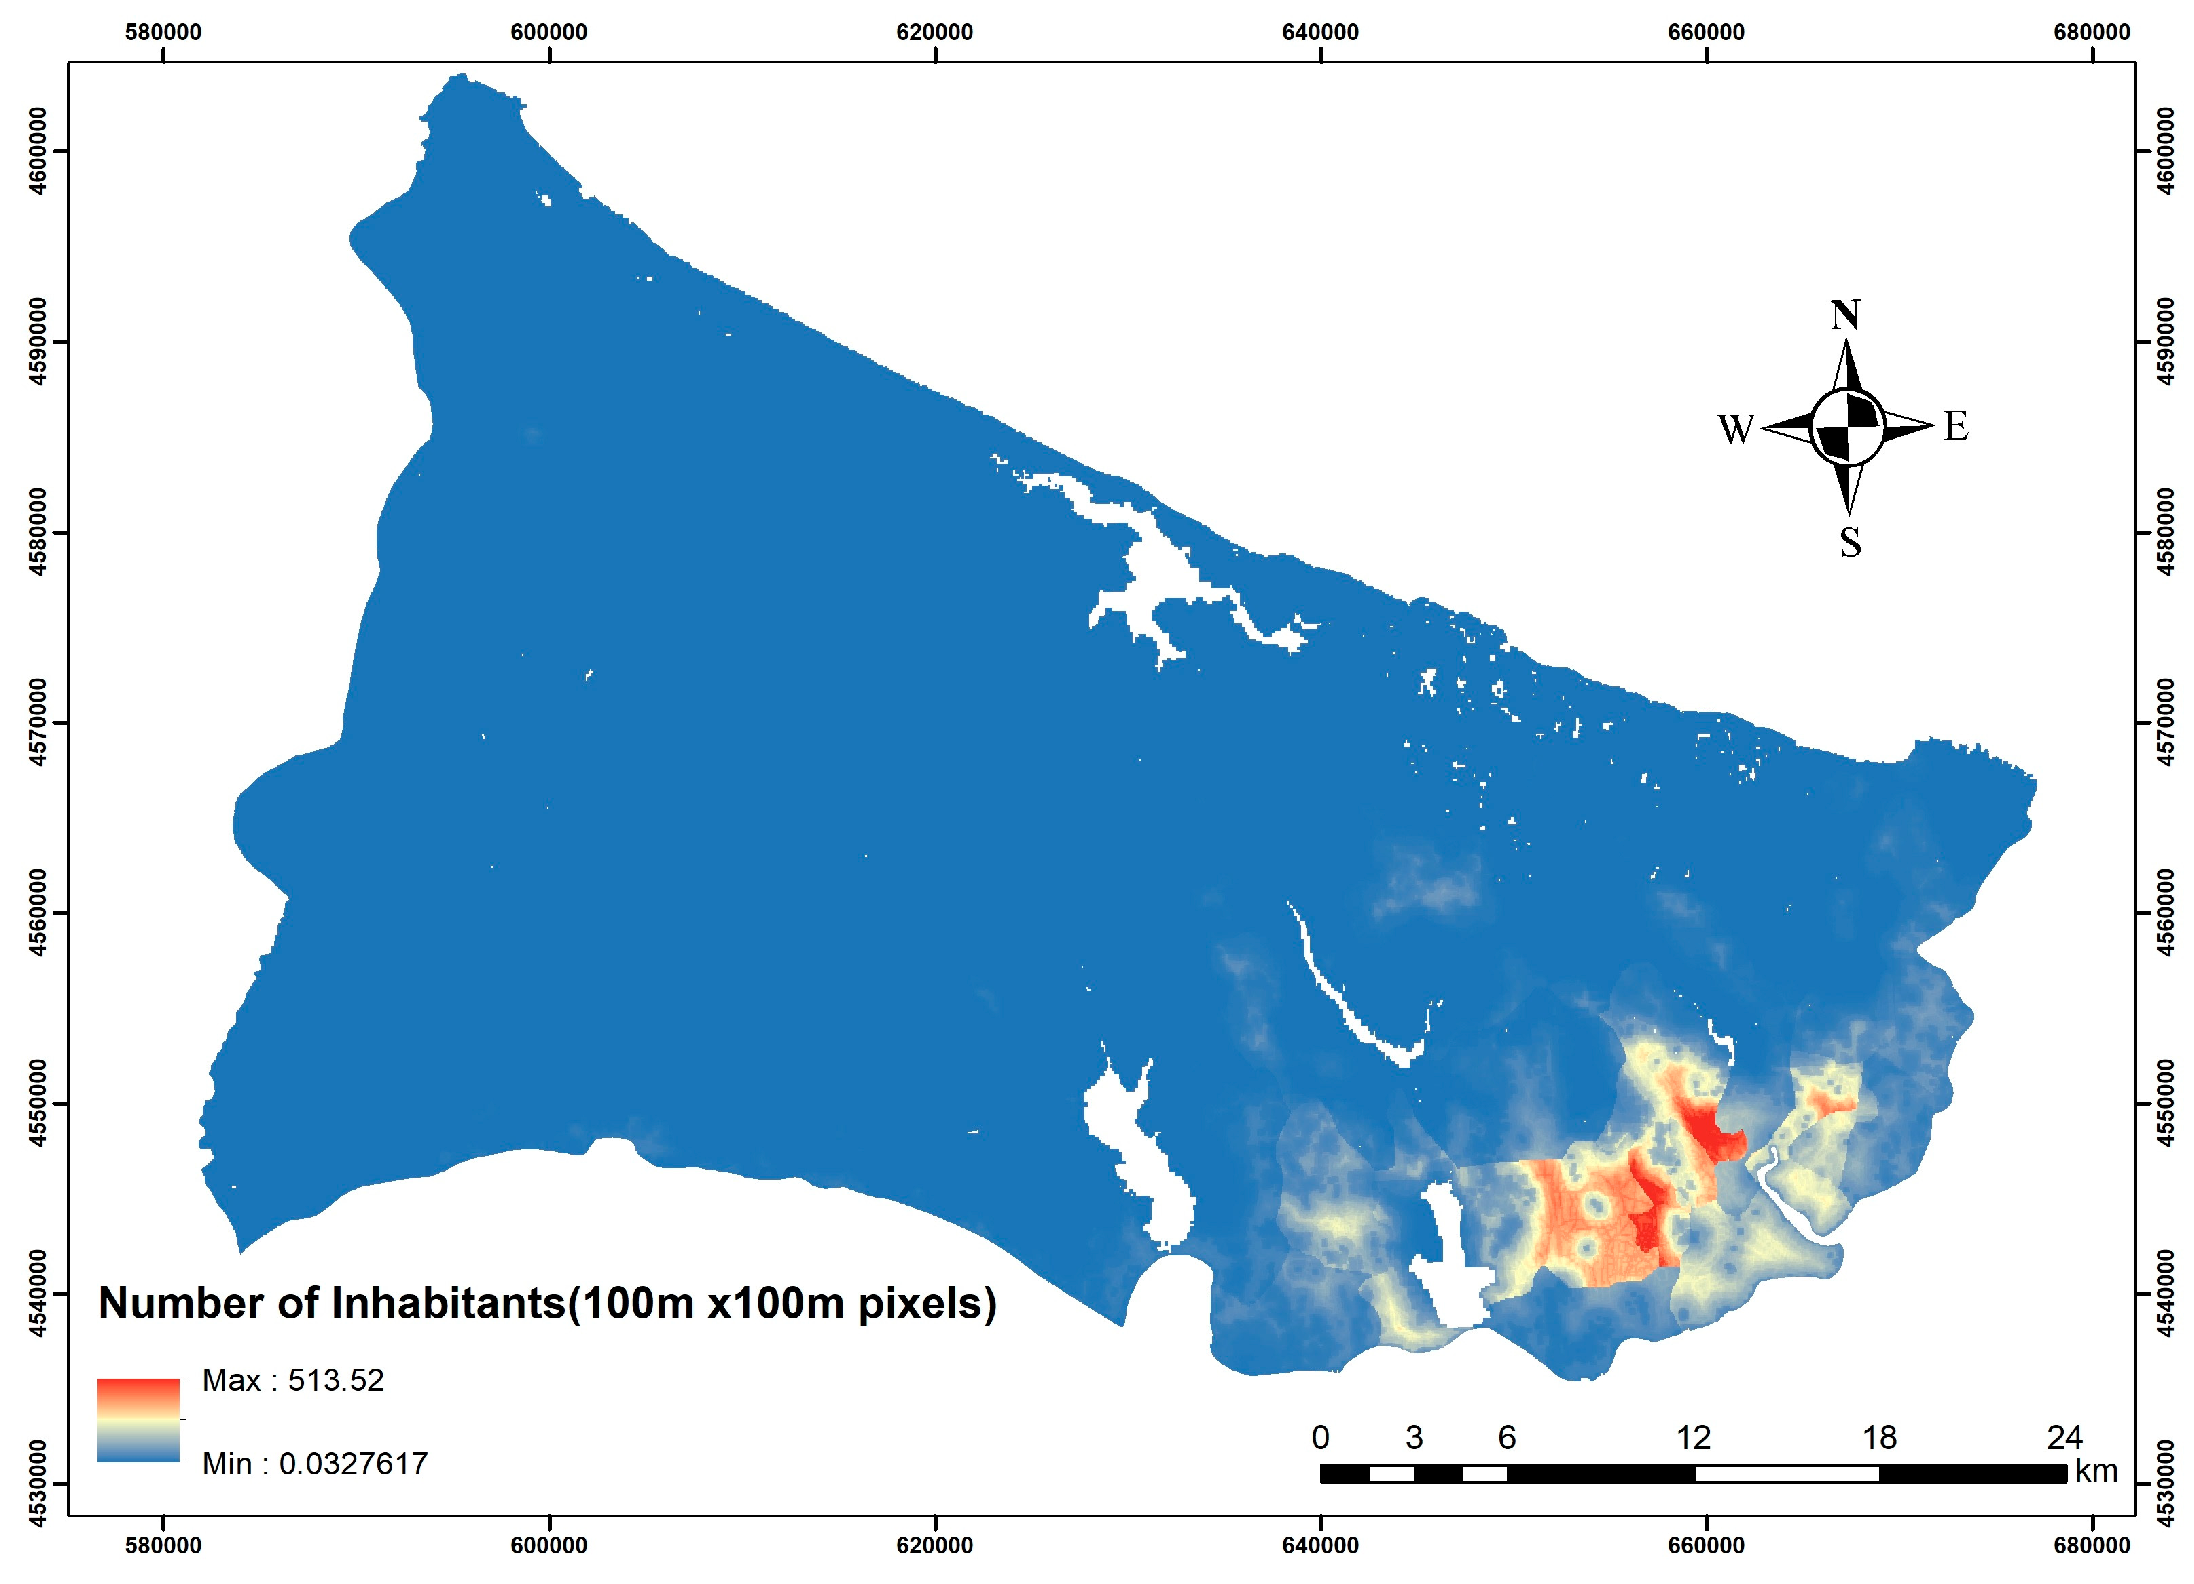
| Population | x | x | ||||||||||||||||||||||||
| Topographic Wetness Index | x | x | x | |||||||||||||||||||||||
| Canadian Forest Fire Weather Index (FWI) | x | x | ||||||||||||||||||||||||
| Tree stage | x | x | ||||||||||||||||||||||||
| Fuel type | x | x | ||||||||||||||||||||||||
| Humidity | x | x | ||||||||||||||||||||||||
| Forest type | x | |||||||||||||||||||||||||
| Distance to tourist places | x | |||||||||||||||||||||||||
| Distance from an anti-poaching camp shed | x | |||||||||||||||||||||||||
| Distance to fields | x | |||||||||||||||||||||||||
| Forest cover | x | |||||||||||||||||||||||||
| Distance to previous fire points | x | |||||||||||||||||||||||||
| Tree species | x | |||||||||||||||||||||||||
| Topographic Position Index (TPI) | ||||||||||||||||||||||||||
| Land surface temperature | x | |||||||||||||||||||||||||
| Bare soil index | x | |||||||||||||||||||||||||
| Species composition | x | |||||||||||||||||||||||||
| Development stage | x | |||||||||||||||||||||||||
| Solar radiation | x | |||||||||||||||||||||||||
| Fire regime (TSF-FR) | x | |||||||||||||||||||||||||
| Tree species composition | x | x | ||||||||||||||||||||||||
| Topomorphology | x | |||||||||||||||||||||||||
| Soil use | x | |||||||||||||||||||||||||
| Distance to fire response teams | x | |||||||||||||||||||||||||
| Distance to fire watch towers | x | |||||||||||||||||||||||||
| Visibility from fire watch towers | x | |||||||||||||||||||||||||
| Stand type | x | |||||||||||||||||||||||||
| Stand age | x | |||||||||||||||||||||||||
| Stand canopy density | x | |||||||||||||||||||||||||
| Human Index | x | |||||||||||||||||||||||||
| Count | Mean | Std | Min | Max | |
|---|---|---|---|---|---|
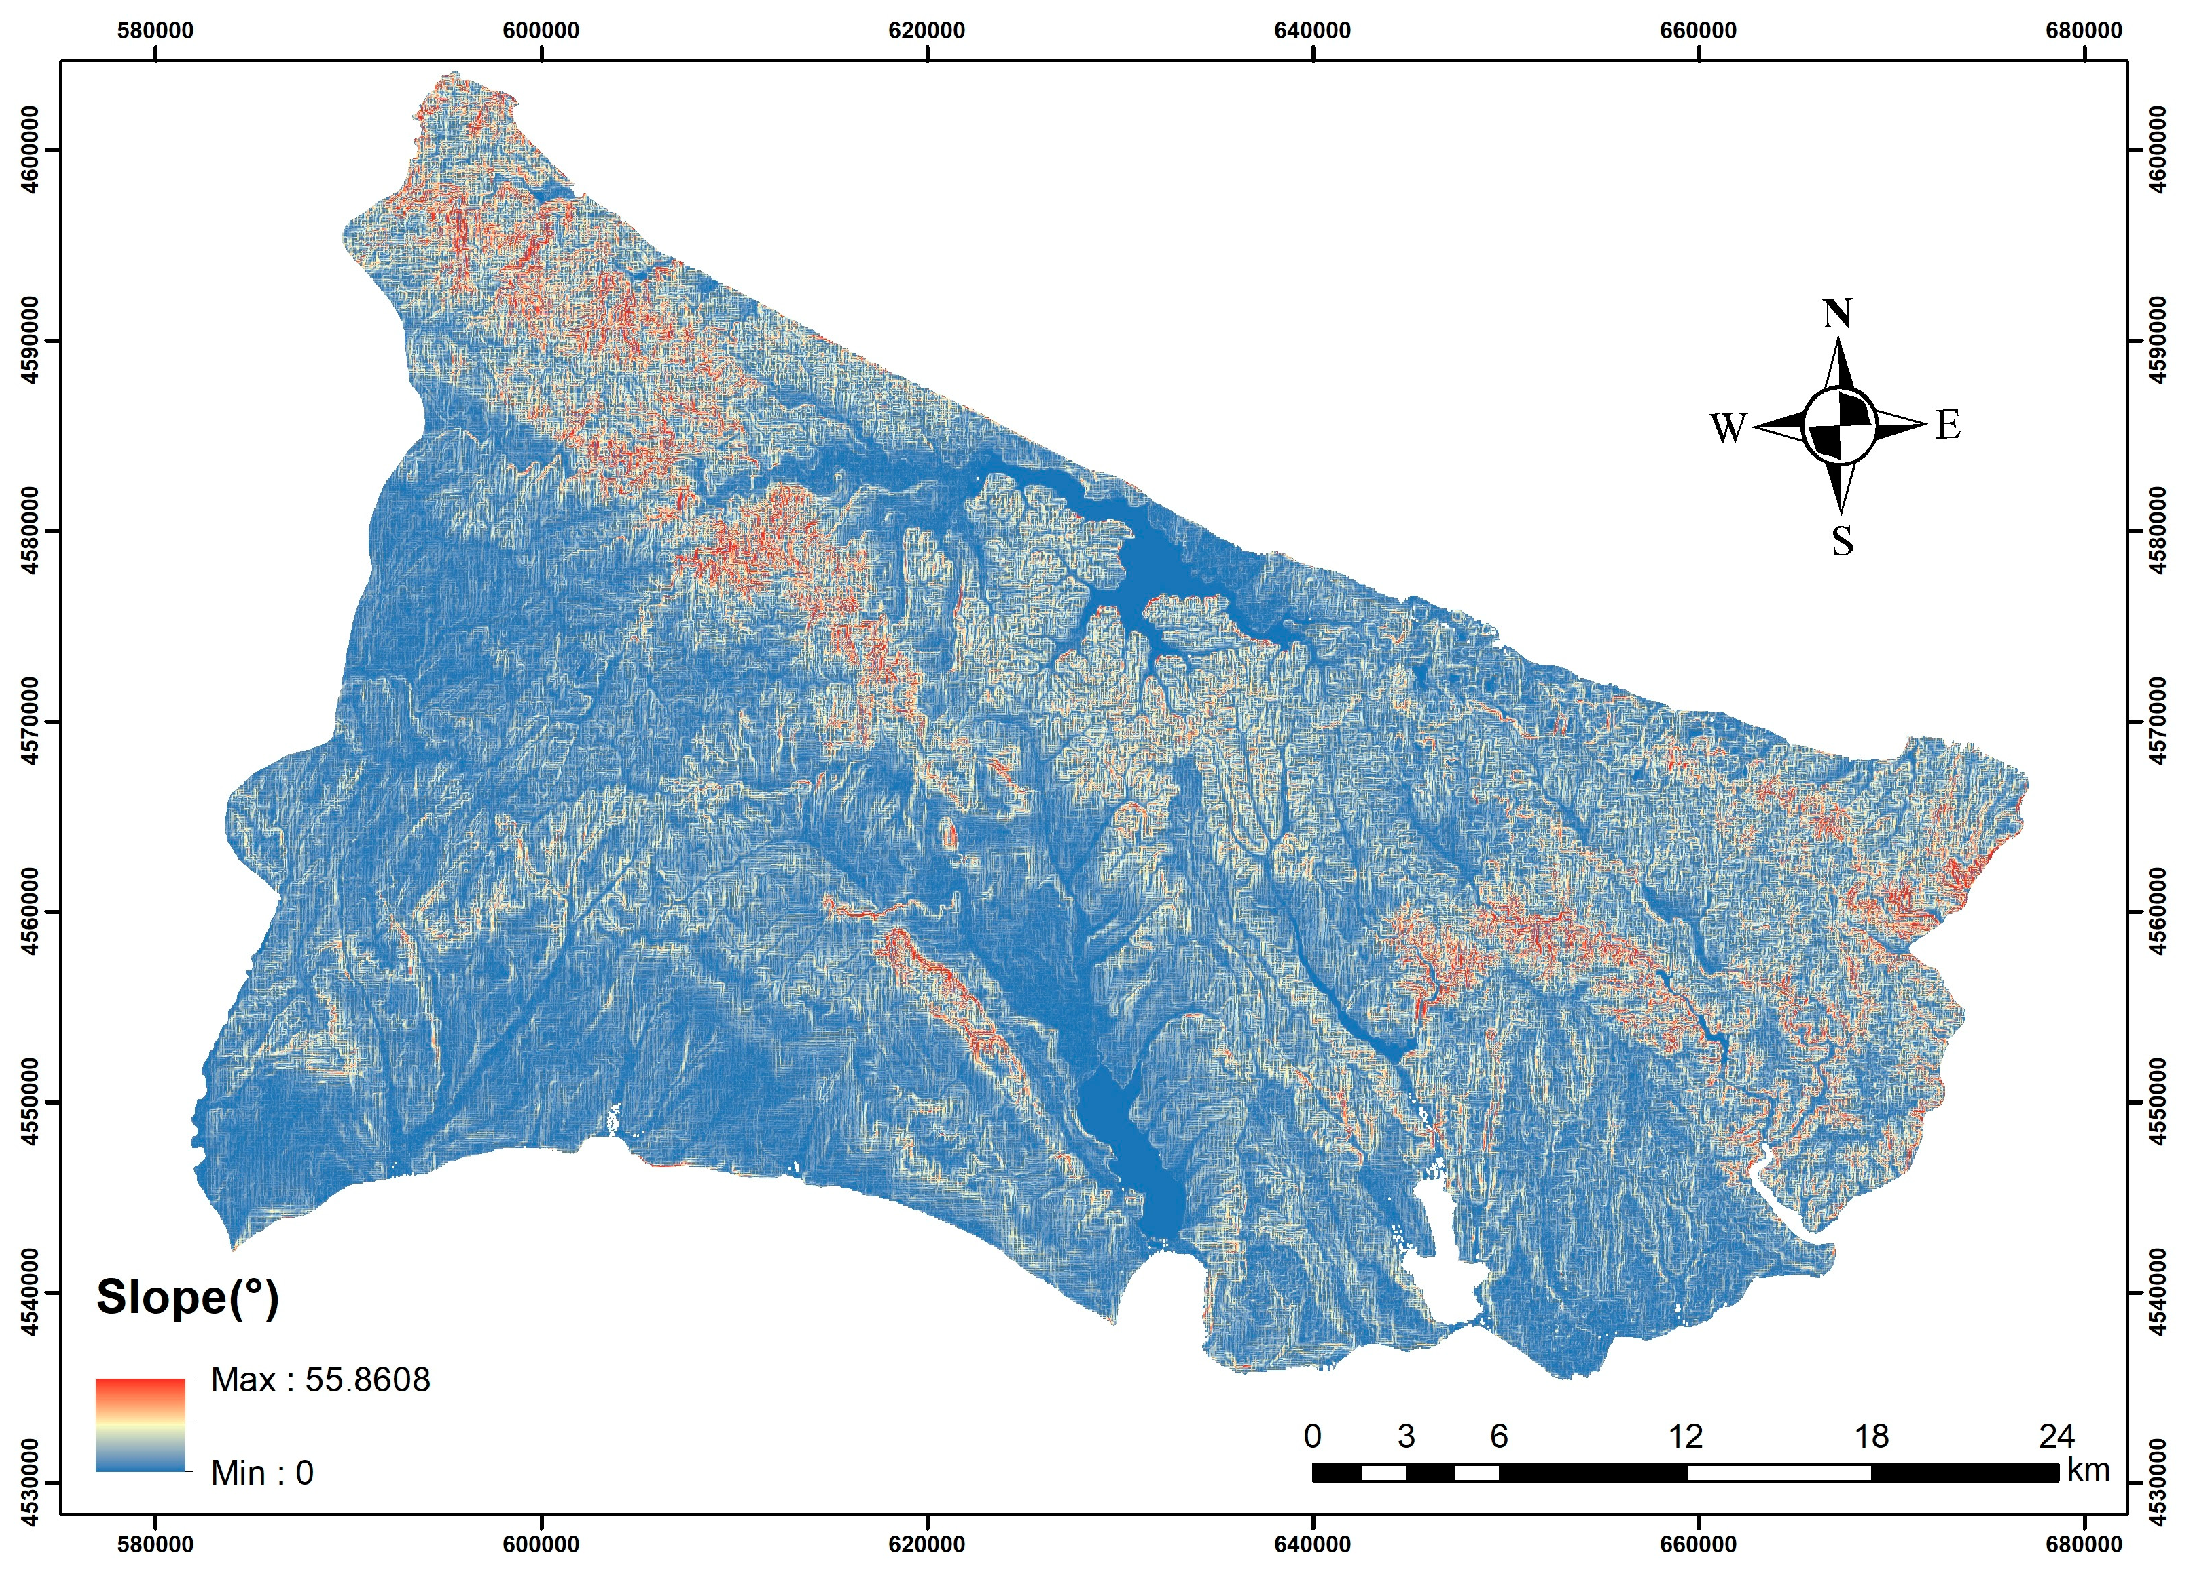
| Slope (SL) (°) | 3455 | 6.34 | 6.54 | 0.00 | 48.60 |
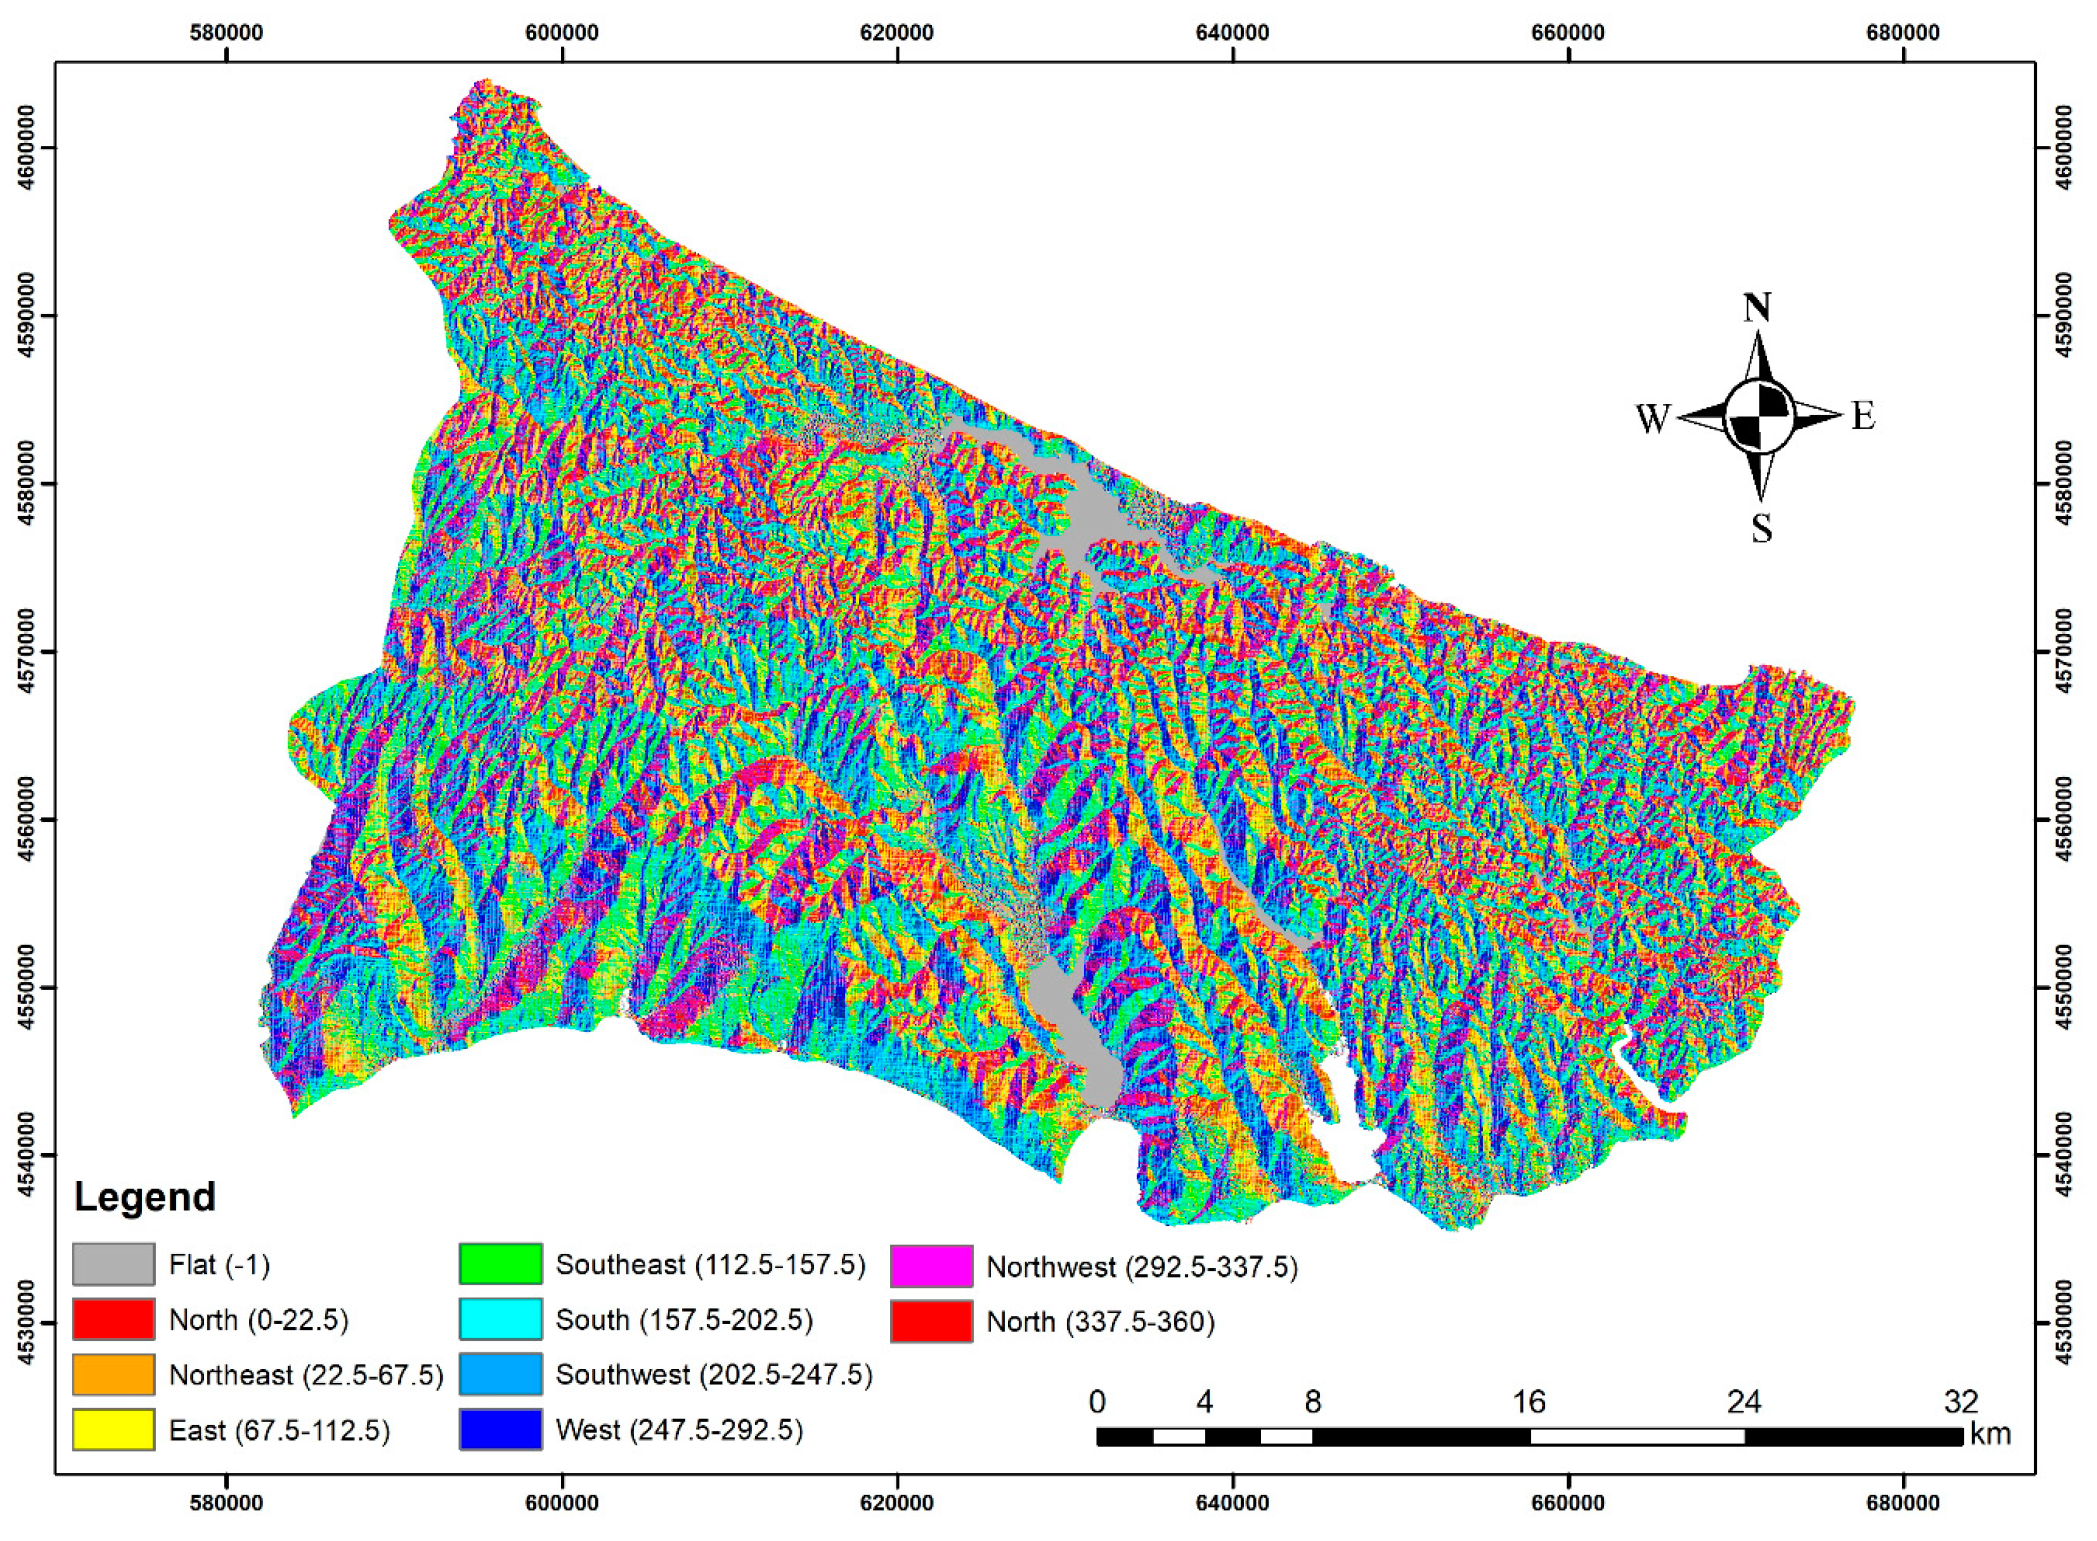
| Aspect (AS) (°) | 3455 | 134.16 | 109.03 | −1.00 | 356.55 |
| Digital elevation model (DEM) (m) | 3455 | 114.56 | 73.68 | 1.00 | 428.00 |
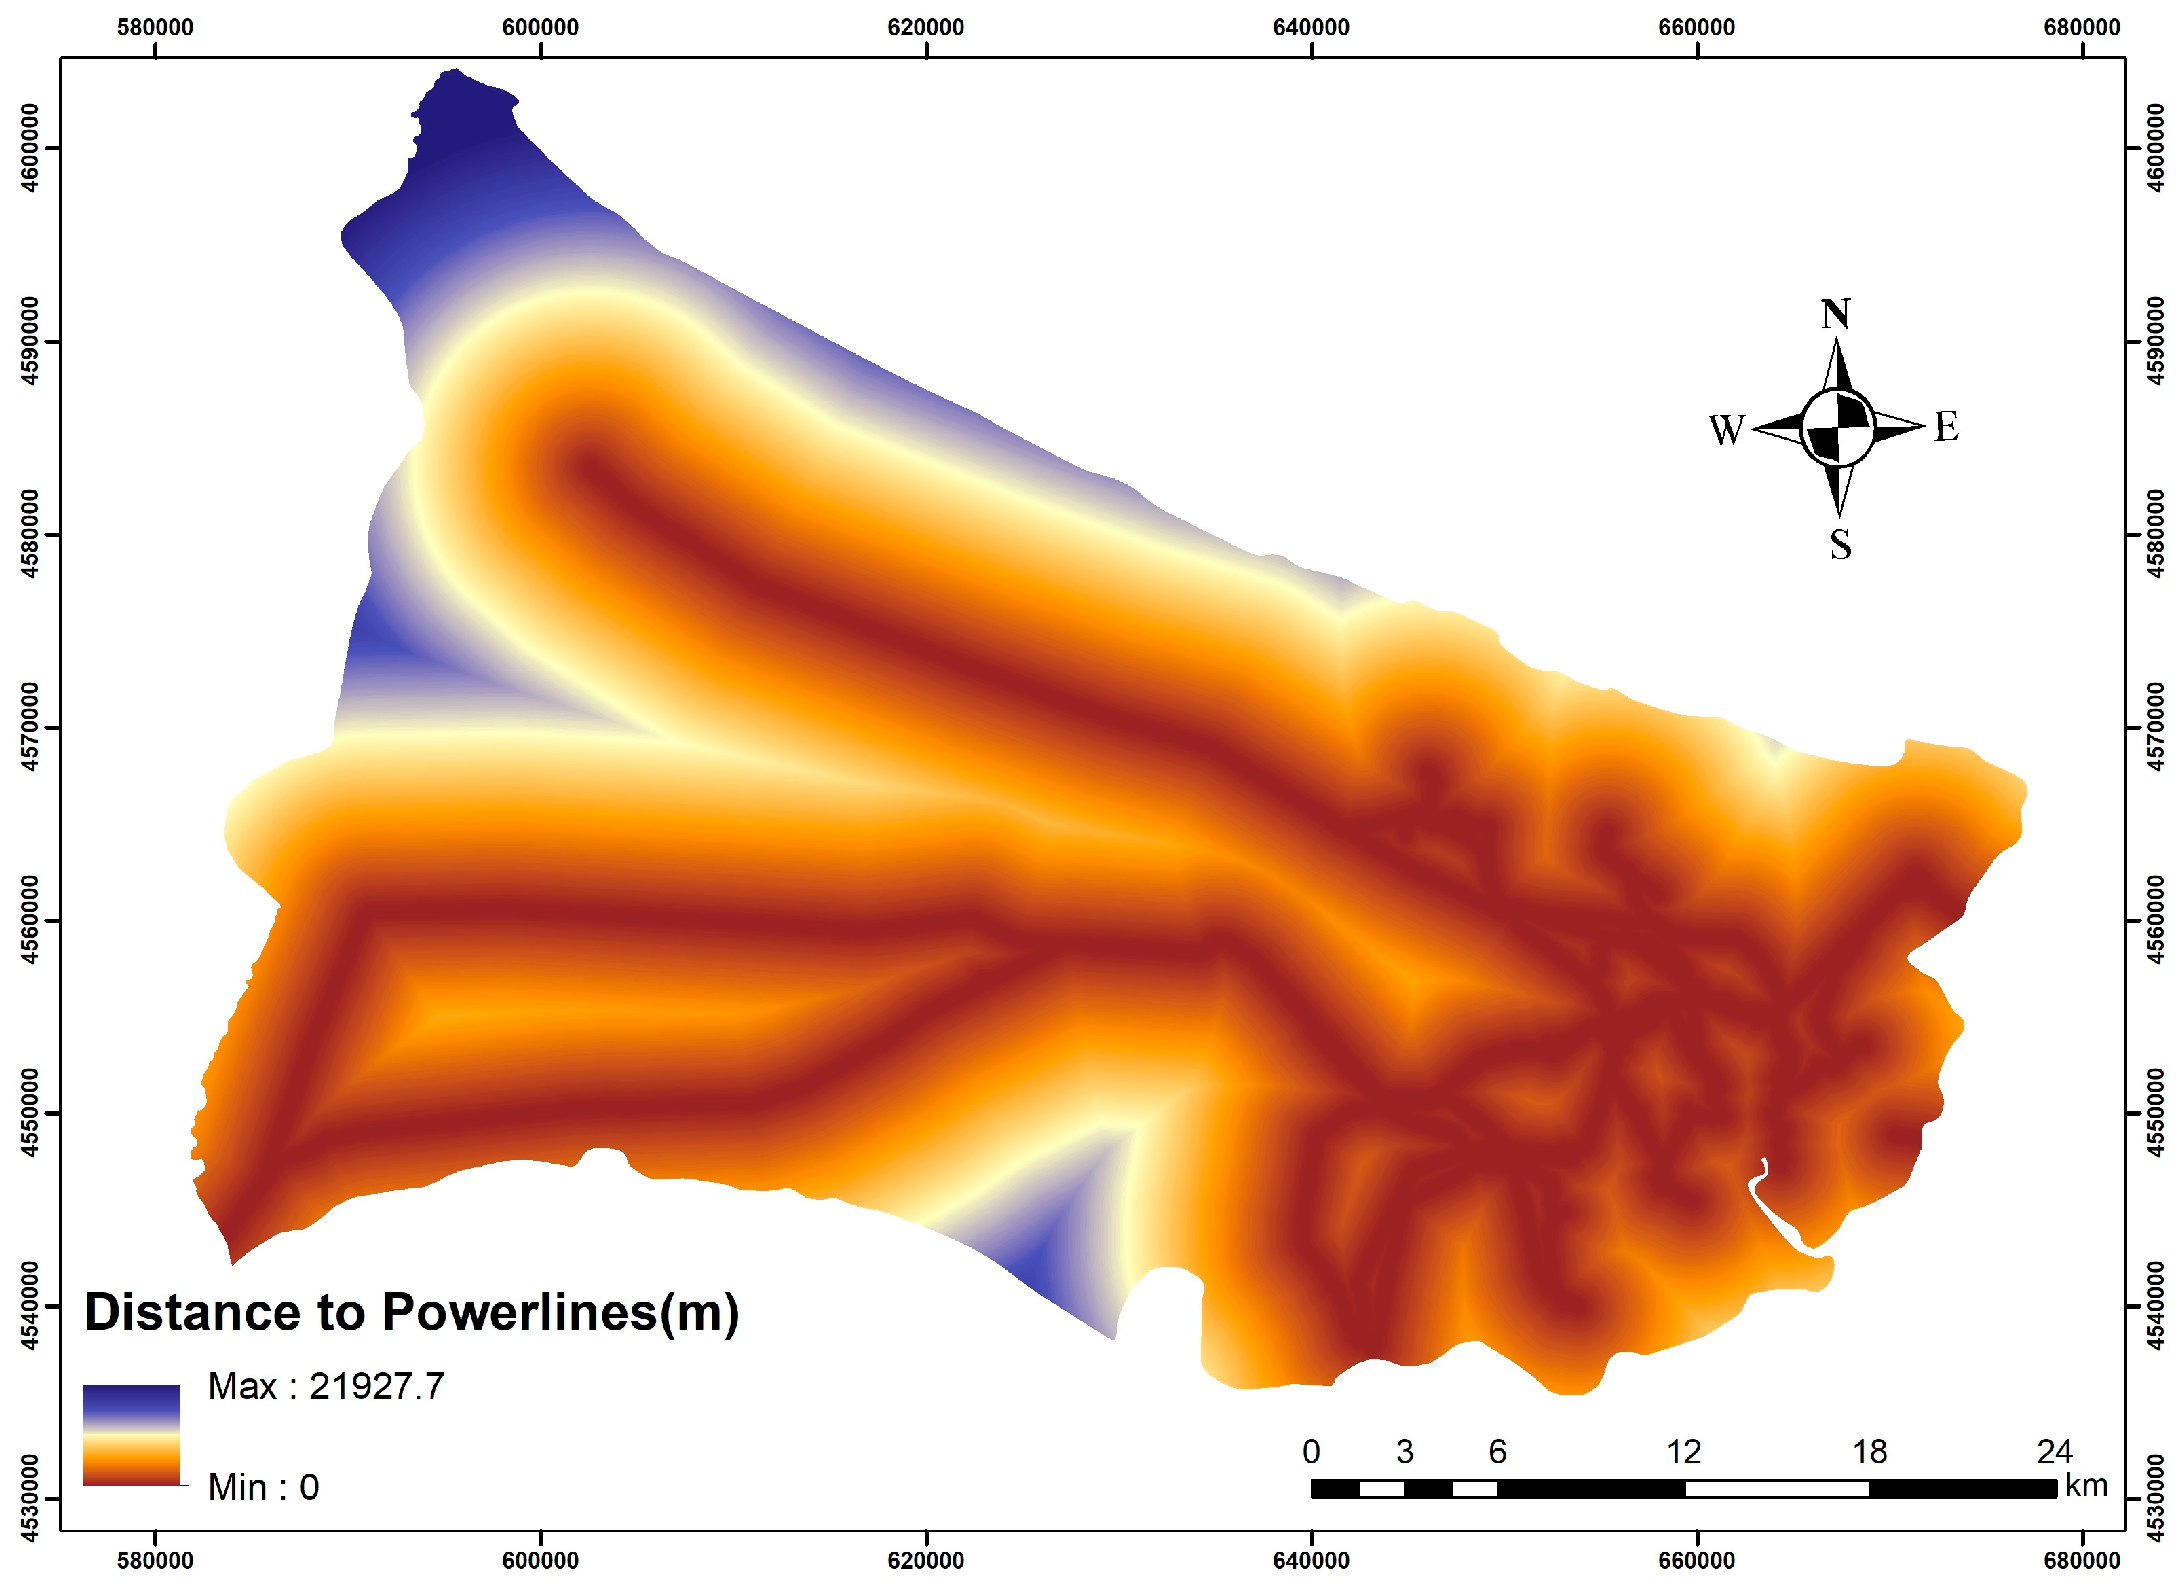
| Distance to power lines (DP) (m) | 3455 | 4175.25 | 3678.12 | 0.00 | 21801.60 |
| Population (PO) (people) | 3455 | 16.13 | 50.24 | 0.03 | 470.96 |
| Distance to roads (DR) (m) | 3455 | 145.61 | 183.30 | 0.00 | 2046.85 |
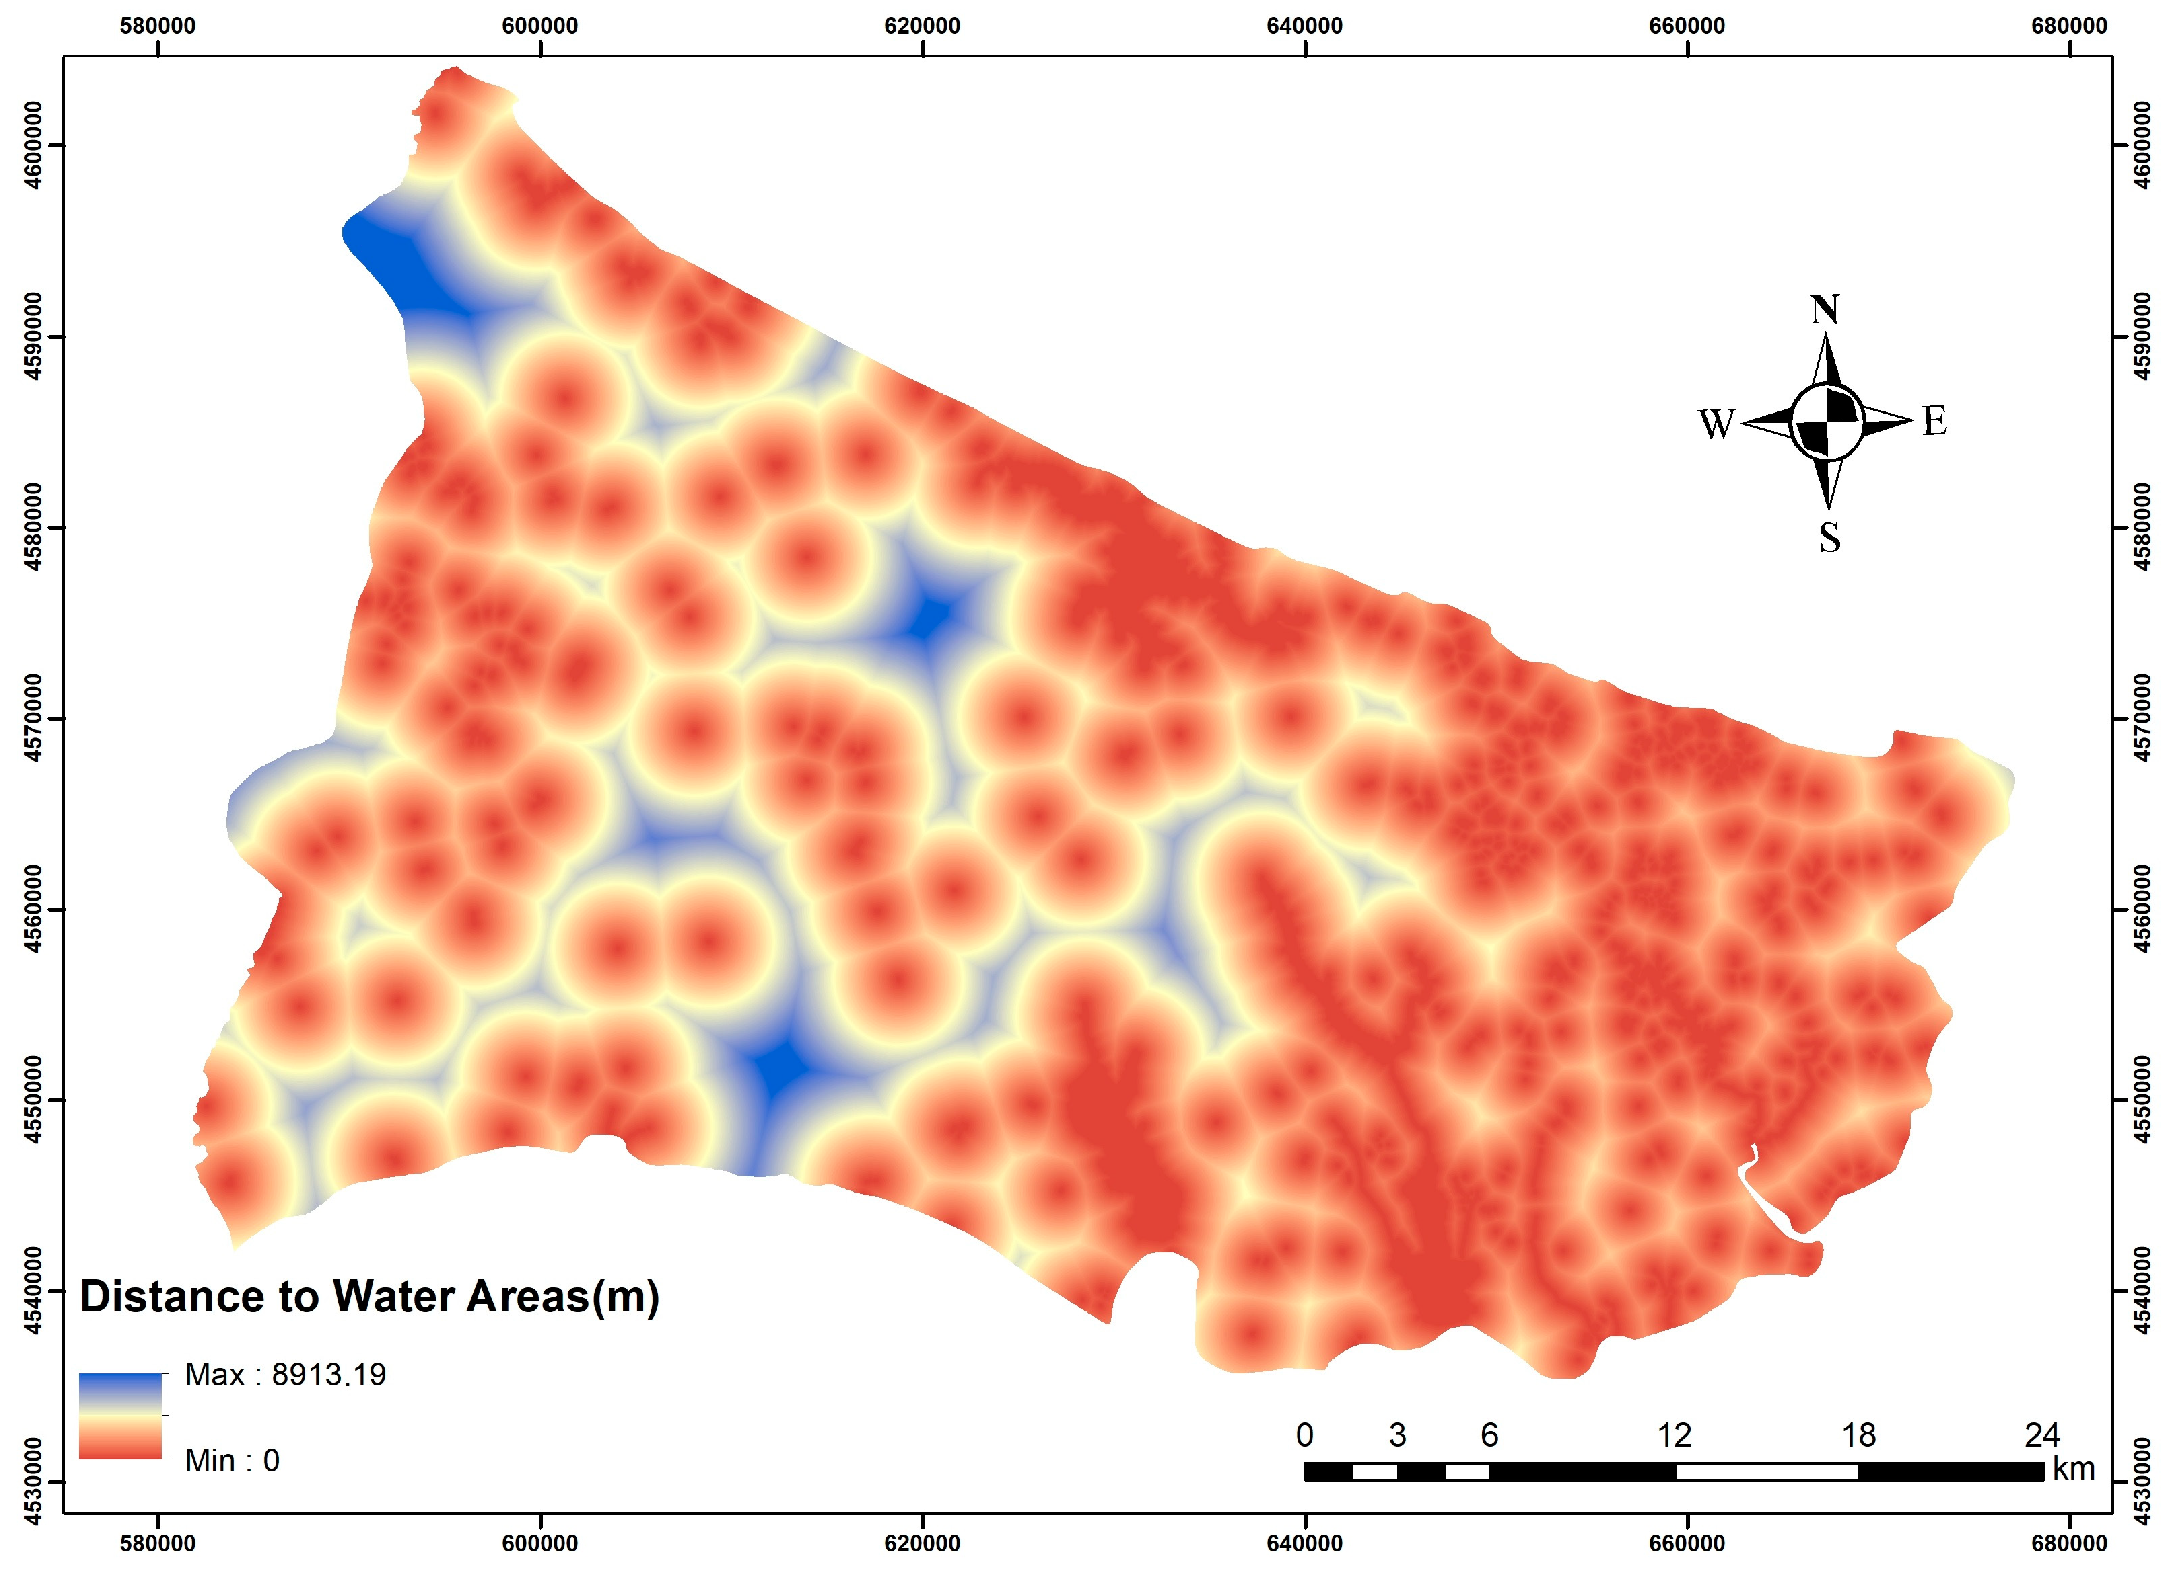
| Distance to water areas (DW) (m) | 3455 | 1939.42 | 1396.11 | 0.00 | 8547.64 |
| Distance to settlements (DS) (m) | 3455 | 543.93 | 799.76 | 0.00 | 5734.47 |
| Fire status (FS) | 3455 | 0.07 | 0.26 | 0.00 | 1.00 |
| Platform | Data | Source | Resolution |
|---|---|---|---|
| OSM | Road | http://overpass-turbo.eu | |
| Water Areas | http://overpass-turbo.eu | ||
| Power Line | http://overpass-turbo.eu | ||
| USGS | SRTM | http://earthexplorer.usgs.gov/ | 90 m |
| ArcGIS | Land Cover | https://livingatlas.arcgis.com/ landcoverexplorer | 10 m—2021 |
| GEE | WorldPop | ee.ImageCollection (“WorldPop/ GP/100m/pop”) | 92.7 m |
| FIRMS | MODIS Aqua+Terra Thermal Anomalies (Fire Locations) | https://firms.modaps.eodis.nasa.gov/ | 1 km |
| Classification | Number of Fires | Area (km²) | Area (%) |
|---|---|---|---|
| Water | 0 | 112,845 | 3.18 |
| Trees | 11 | 1354,764 | 38.19 |
| Flooded Vegetation | 0 | 1782 | 0.05 |
| Crops | 168 | 954,511 | 26.91 |
| Built Area | 302 | 891,761 | 25.14 |
| Bare Ground | 0 | 21,838 | 0.62 |
| Rangeland | 28 | 209,752 | 5.91 |
| Predicted Value | |||
|---|---|---|---|
| Fire (Class 1) | Non-Fire (Class 0) | ||
| Actual value | Fire (class 1) | True Positive (TP) | True Negative (TN) |
| Non-Fire (class 0) | False Positive (FP) | False Negative (FN) | |
| Model | Accuracy | AUC | Recall | Precision | F1 |
|---|---|---|---|---|---|
| Random Forest (RF) | 0.6975 | 0.7606 | 0.7559 | 0.6809 | 0.7127 |
| Extreme Gradient Boosting (XGB) | 0.6972 | 0.7607 | 0.6974 | 0.7006 | 0.6956 |
| Light Gradient Boosting (LGB) | 0.6715 | 0.7429 | 0.6745 | 0.6778 | 0.6725 |
| RF | XGB | LGB | ||||
|---|---|---|---|---|---|---|
| Fold | Accuracy | AUC | Accuracy | AUC | Accuracy | AUC |
| 0 | 0.9298 | 0.6373 | 0.9050 | 0.7278 | 0.9174 | 0.7244 |
| 1 | 0.9339 | 0.7425 | 0.9174 | 0.7746 | 0.9132 | 0.7569 |
| 2 | 0.9298 | 0.7586 | 0.9132 | 0.7762 | 0.8967 | 0.7710 |
| 3 | 0.9421 | 0.8424 | 0.9091 | 0.8434 | 0.9050 | 0.8165 |
| 4 | 0.9256 | 0.8203 | 0.9215 | 0.7619 | 0.9091 | 0.7793 |
| 5 | 0.9215 | 0.7975 | 0.9050 | 0.7371 | 0.9050 | 0.7470 |
| 6 | 0.9256 | 0.8259 | 0.9132 | 0.7956 | 0.9256 | 0.8058 |
| 7 | 0.9256 | 0.7240 | 0.9174 | 0.7612 | 0.9132 | 0.7269 |
| 8 | 0.9253 | 0.6611 | 0.9170 | 0.6799 | 0.9087 | 0.6893 |
| 9 | 0.9253 | 0.7064 | 0.9087 | 0.6197 | 0.9170 | 0.6657 |
| Mean | 0.9285 | 0.7516 | 0.9127 | 0.7478 | 0.9111 | 0.7483 |
| Std | 0.0056 | 0.0669 | 0.0054 | 0.0590 | 0.0077 | 0.0456 |
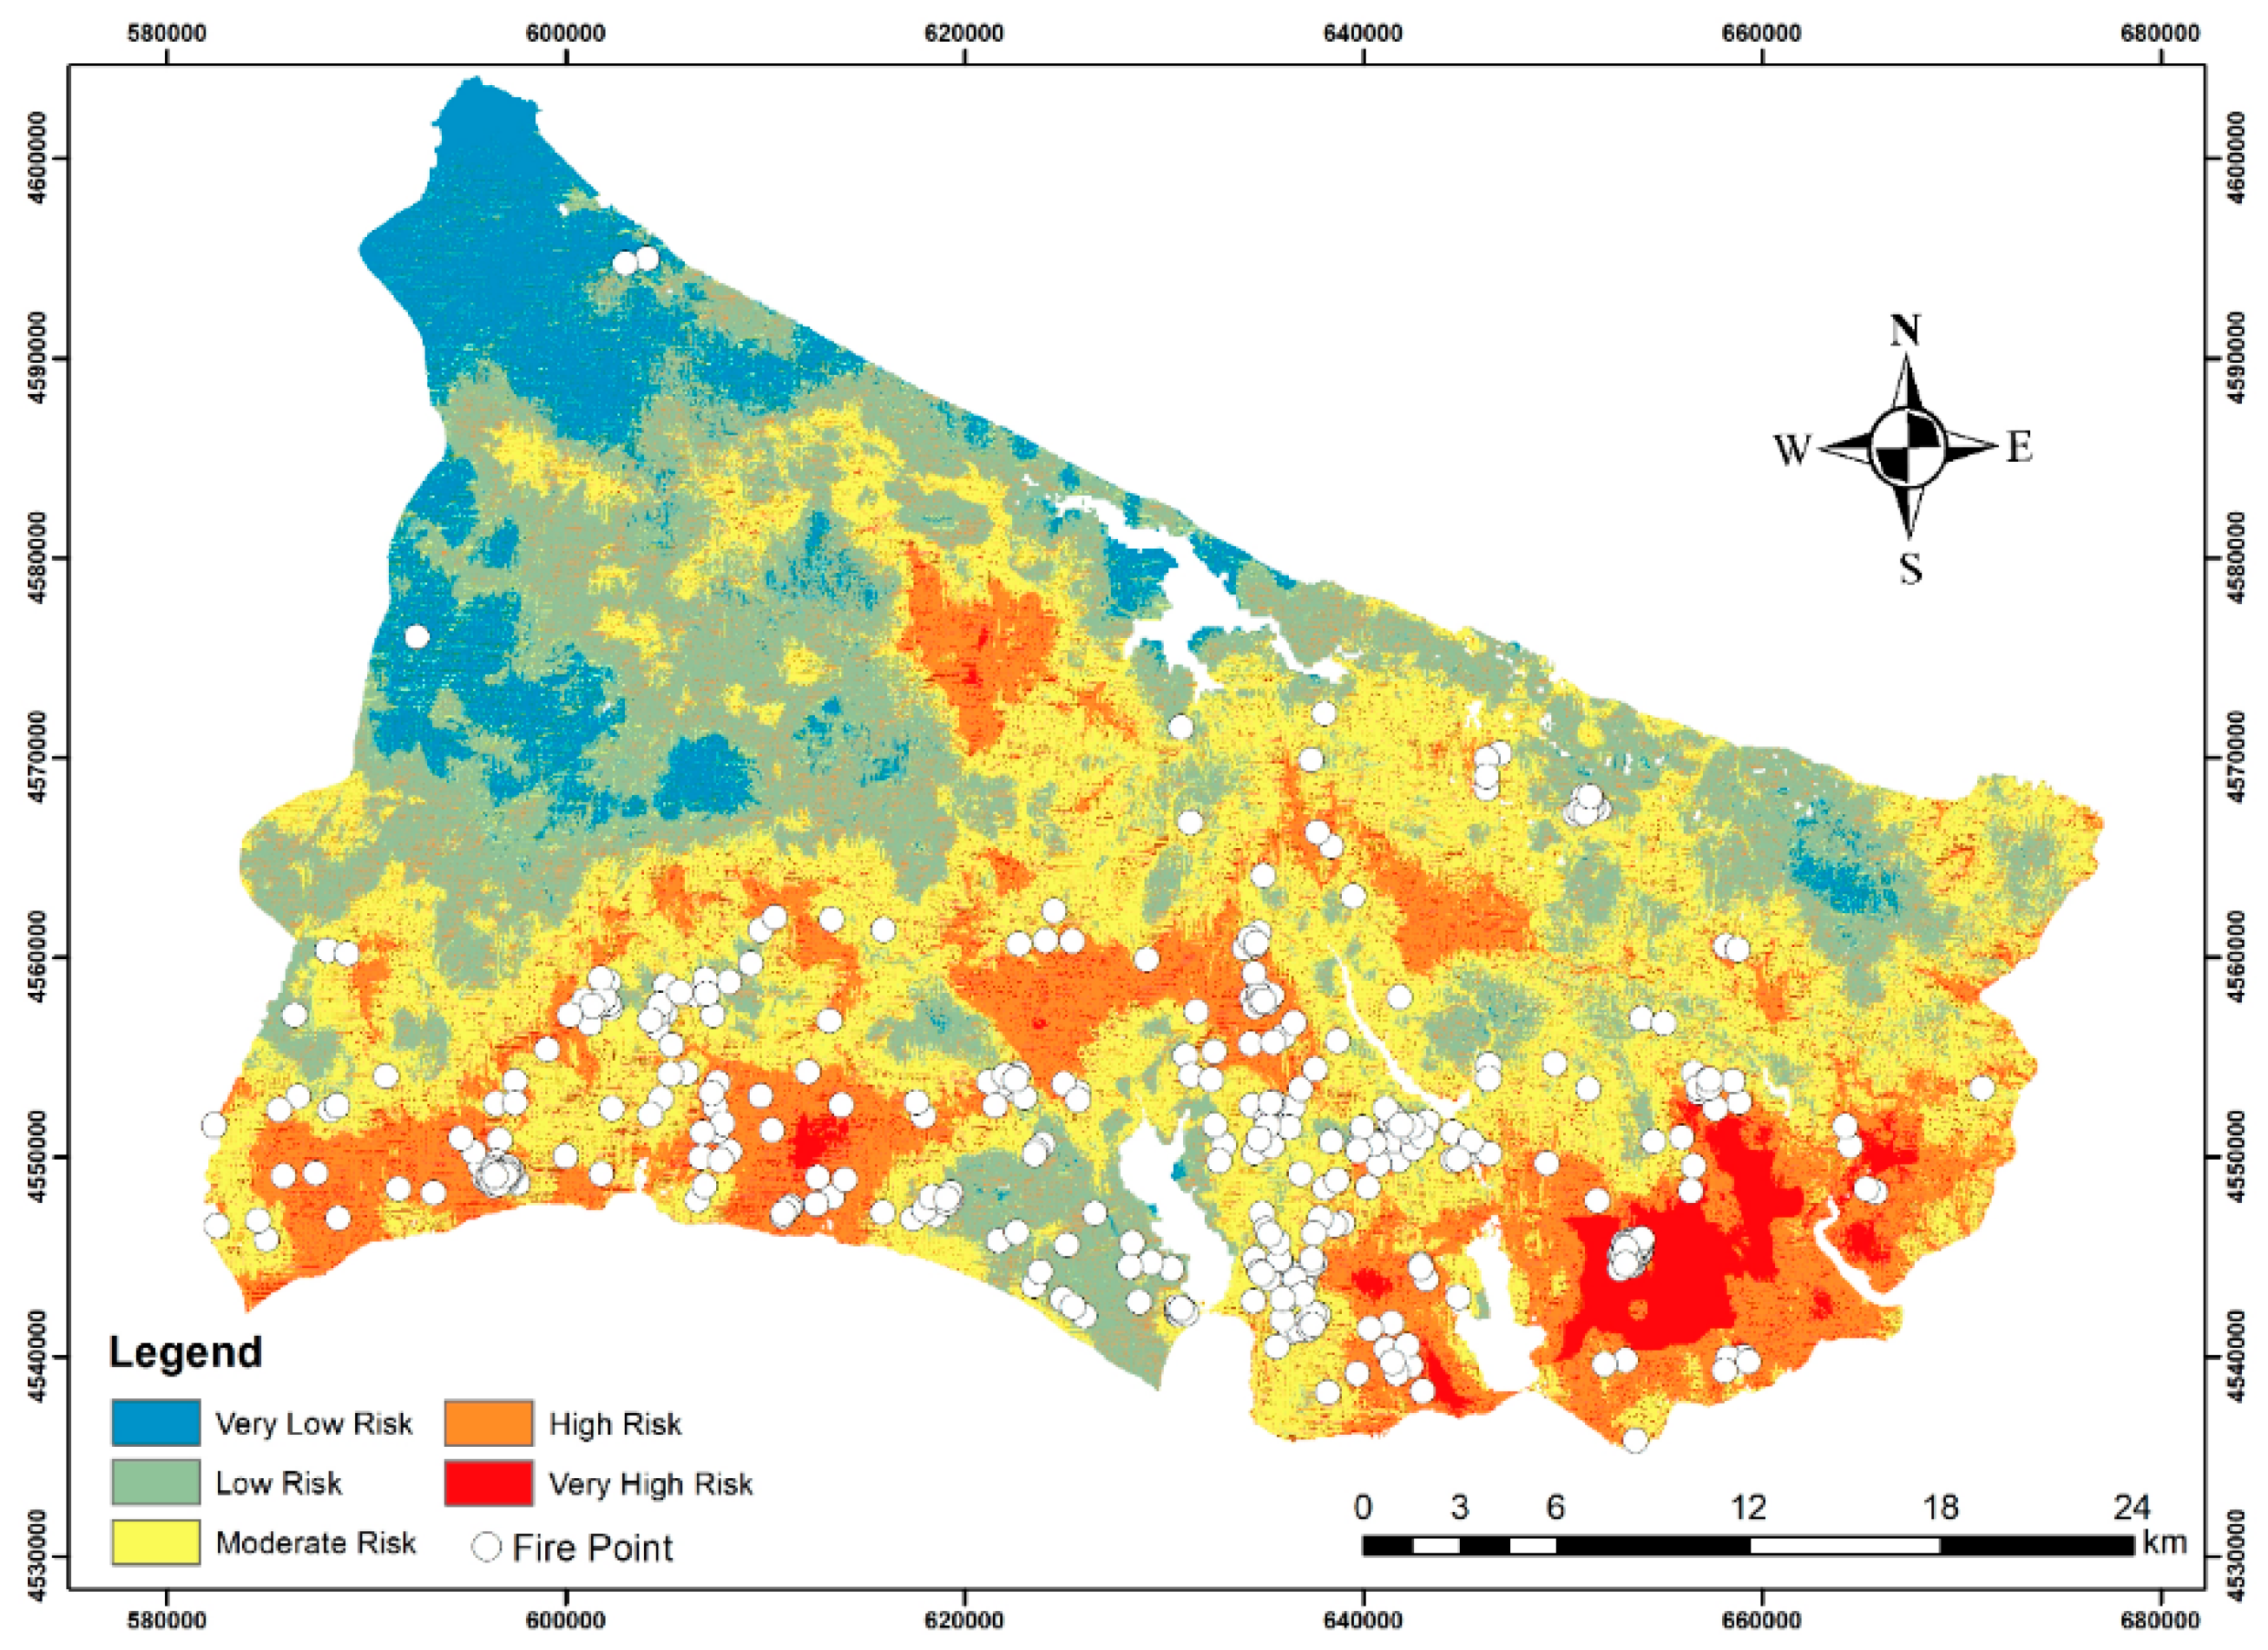
| Risk Level | Total Number of Pixels | Area (km2) | Number of Fires |
|---|---|---|---|
| Very Low Risk | 558,103 | 368,031 | 3 |
| Low Risk | 1,421,297 | 937,248 | 37 |
| Moderate Risk | 1,902,320 | 1254,450 | 184 |
| High Risk | 1,007,792 | 664,570 | 139 |
| Very High Risk | 331,371 | 218,517 | 146 |
Disclaimer/Publisher’s Note: The statements, opinions and data contained in all publications are solely those of the individual author(s) and contributor(s) and not of MDPI and/or the editor(s). MDPI and/or the editor(s) disclaim responsibility for any injury to people or property resulting from any ideas, methods, instructions or products referred to in the content. |
© 2023 by the authors. Licensee MDPI, Basel, Switzerland. This article is an open access article distributed under the terms and conditions of the Creative Commons Attribution (CC BY) license (https://creativecommons.org/licenses/by/4.0/).
Share and Cite
Aksoy, E.; Kocer, A.; Yilmaz, İ.; Akçal, A.N.; Akpinar, K. Assessing Fire Risk in Wildland–Urban Interface Regions Using a Machine Learning Method and GIS data: The Example of Istanbul’s European Side. Fire 2023, 6, 408. https://doi.org/10.3390/fire6100408
Aksoy E, Kocer A, Yilmaz İ, Akçal AN, Akpinar K. Assessing Fire Risk in Wildland–Urban Interface Regions Using a Machine Learning Method and GIS data: The Example of Istanbul’s European Side. Fire. 2023; 6(10):408. https://doi.org/10.3390/fire6100408
Chicago/Turabian StyleAksoy, Ercüment, Abdulkadir Kocer, İsmail Yilmaz, Arif Nihat Akçal, and Kudret Akpinar. 2023. "Assessing Fire Risk in Wildland–Urban Interface Regions Using a Machine Learning Method and GIS data: The Example of Istanbul’s European Side" Fire 6, no. 10: 408. https://doi.org/10.3390/fire6100408
APA StyleAksoy, E., Kocer, A., Yilmaz, İ., Akçal, A. N., & Akpinar, K. (2023). Assessing Fire Risk in Wildland–Urban Interface Regions Using a Machine Learning Method and GIS data: The Example of Istanbul’s European Side. Fire, 6(10), 408. https://doi.org/10.3390/fire6100408