
Effect of Different Smoke Vent Layouts on Smoke and Temperature Distribution in Single-Side Multi-Point Exhaust Tunnel Fires: A Case Study

Abstract
:1. Introduction
2. Numerical Modeling
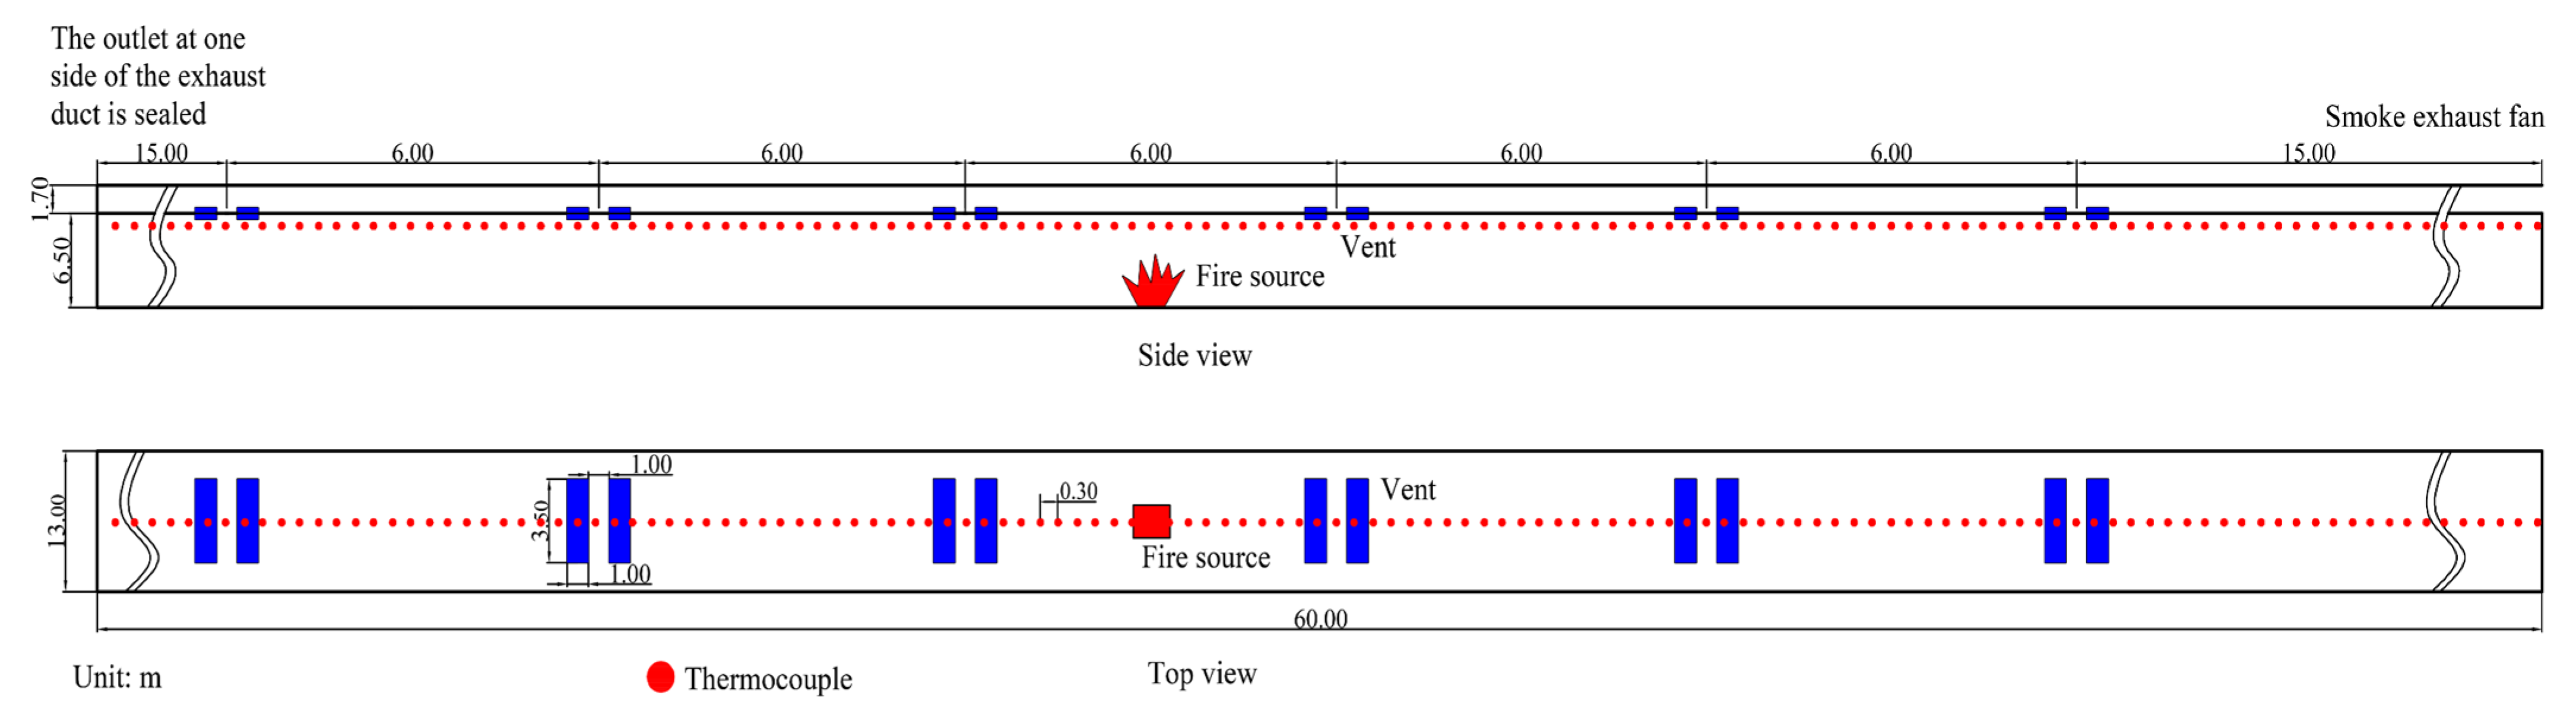
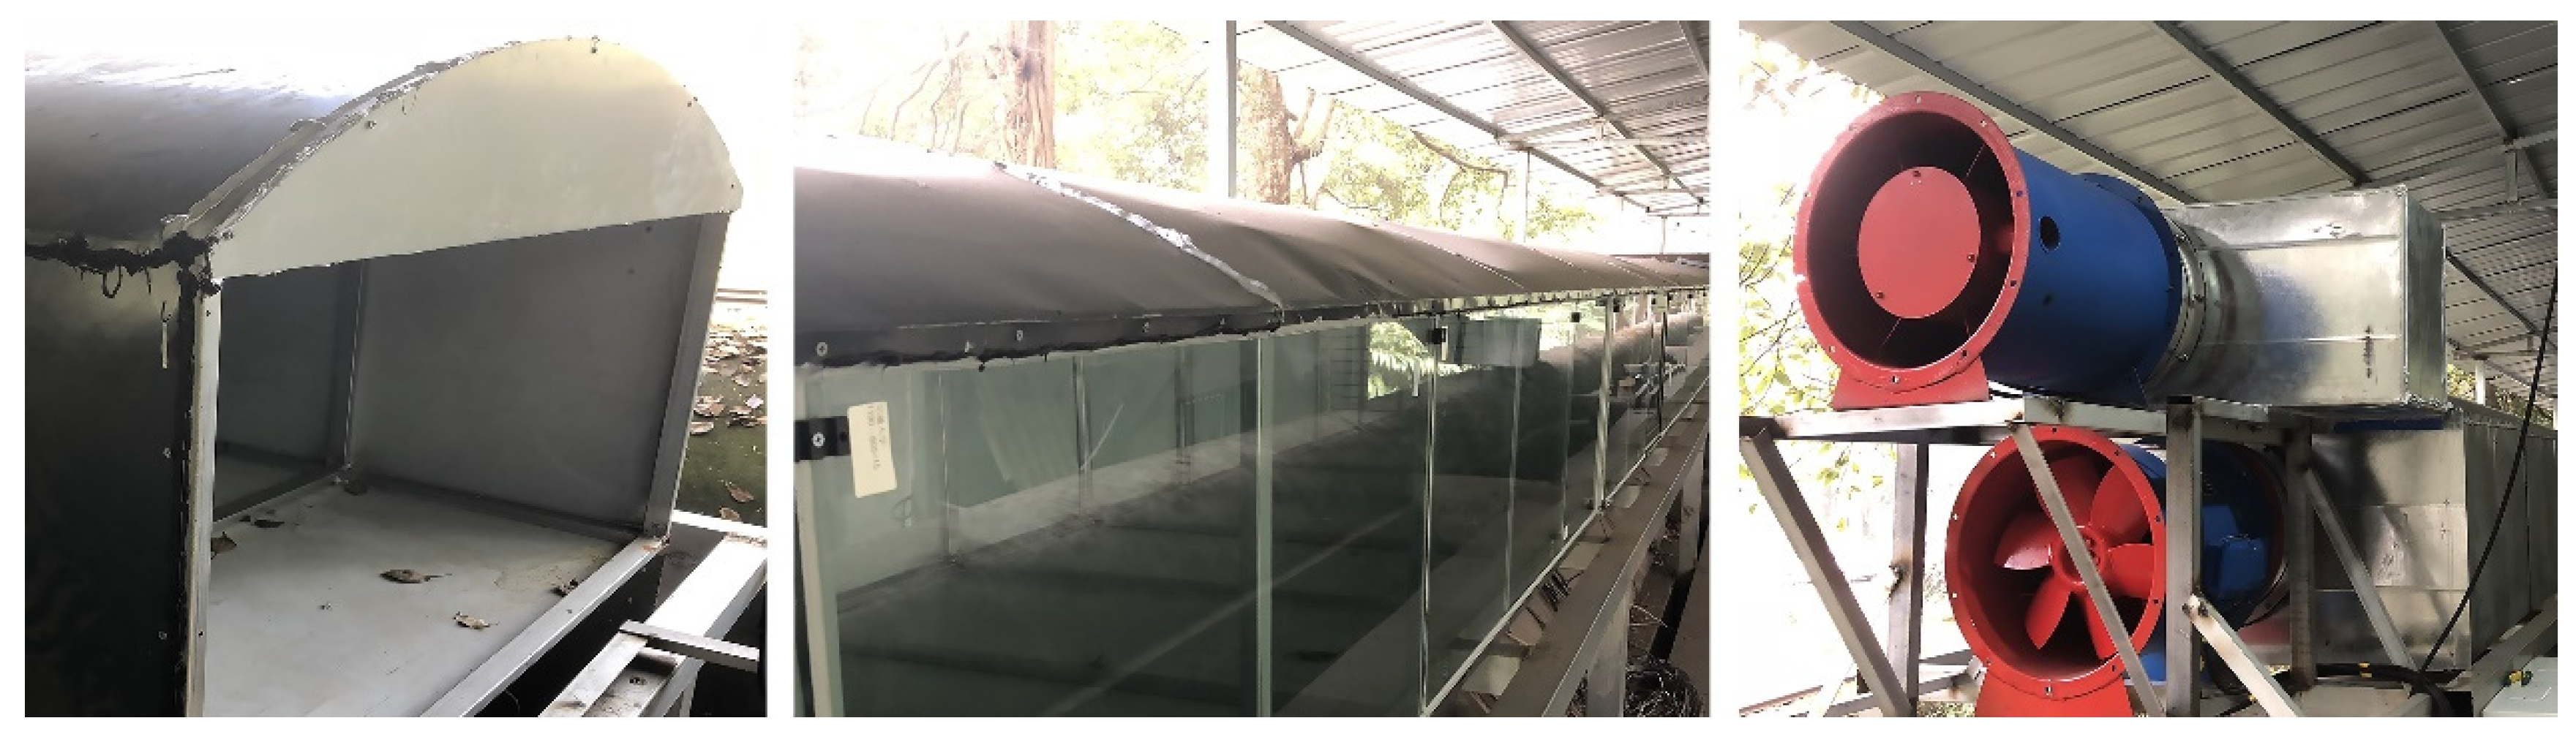
2.1. Model Tunnel
2.2. Mesh Size
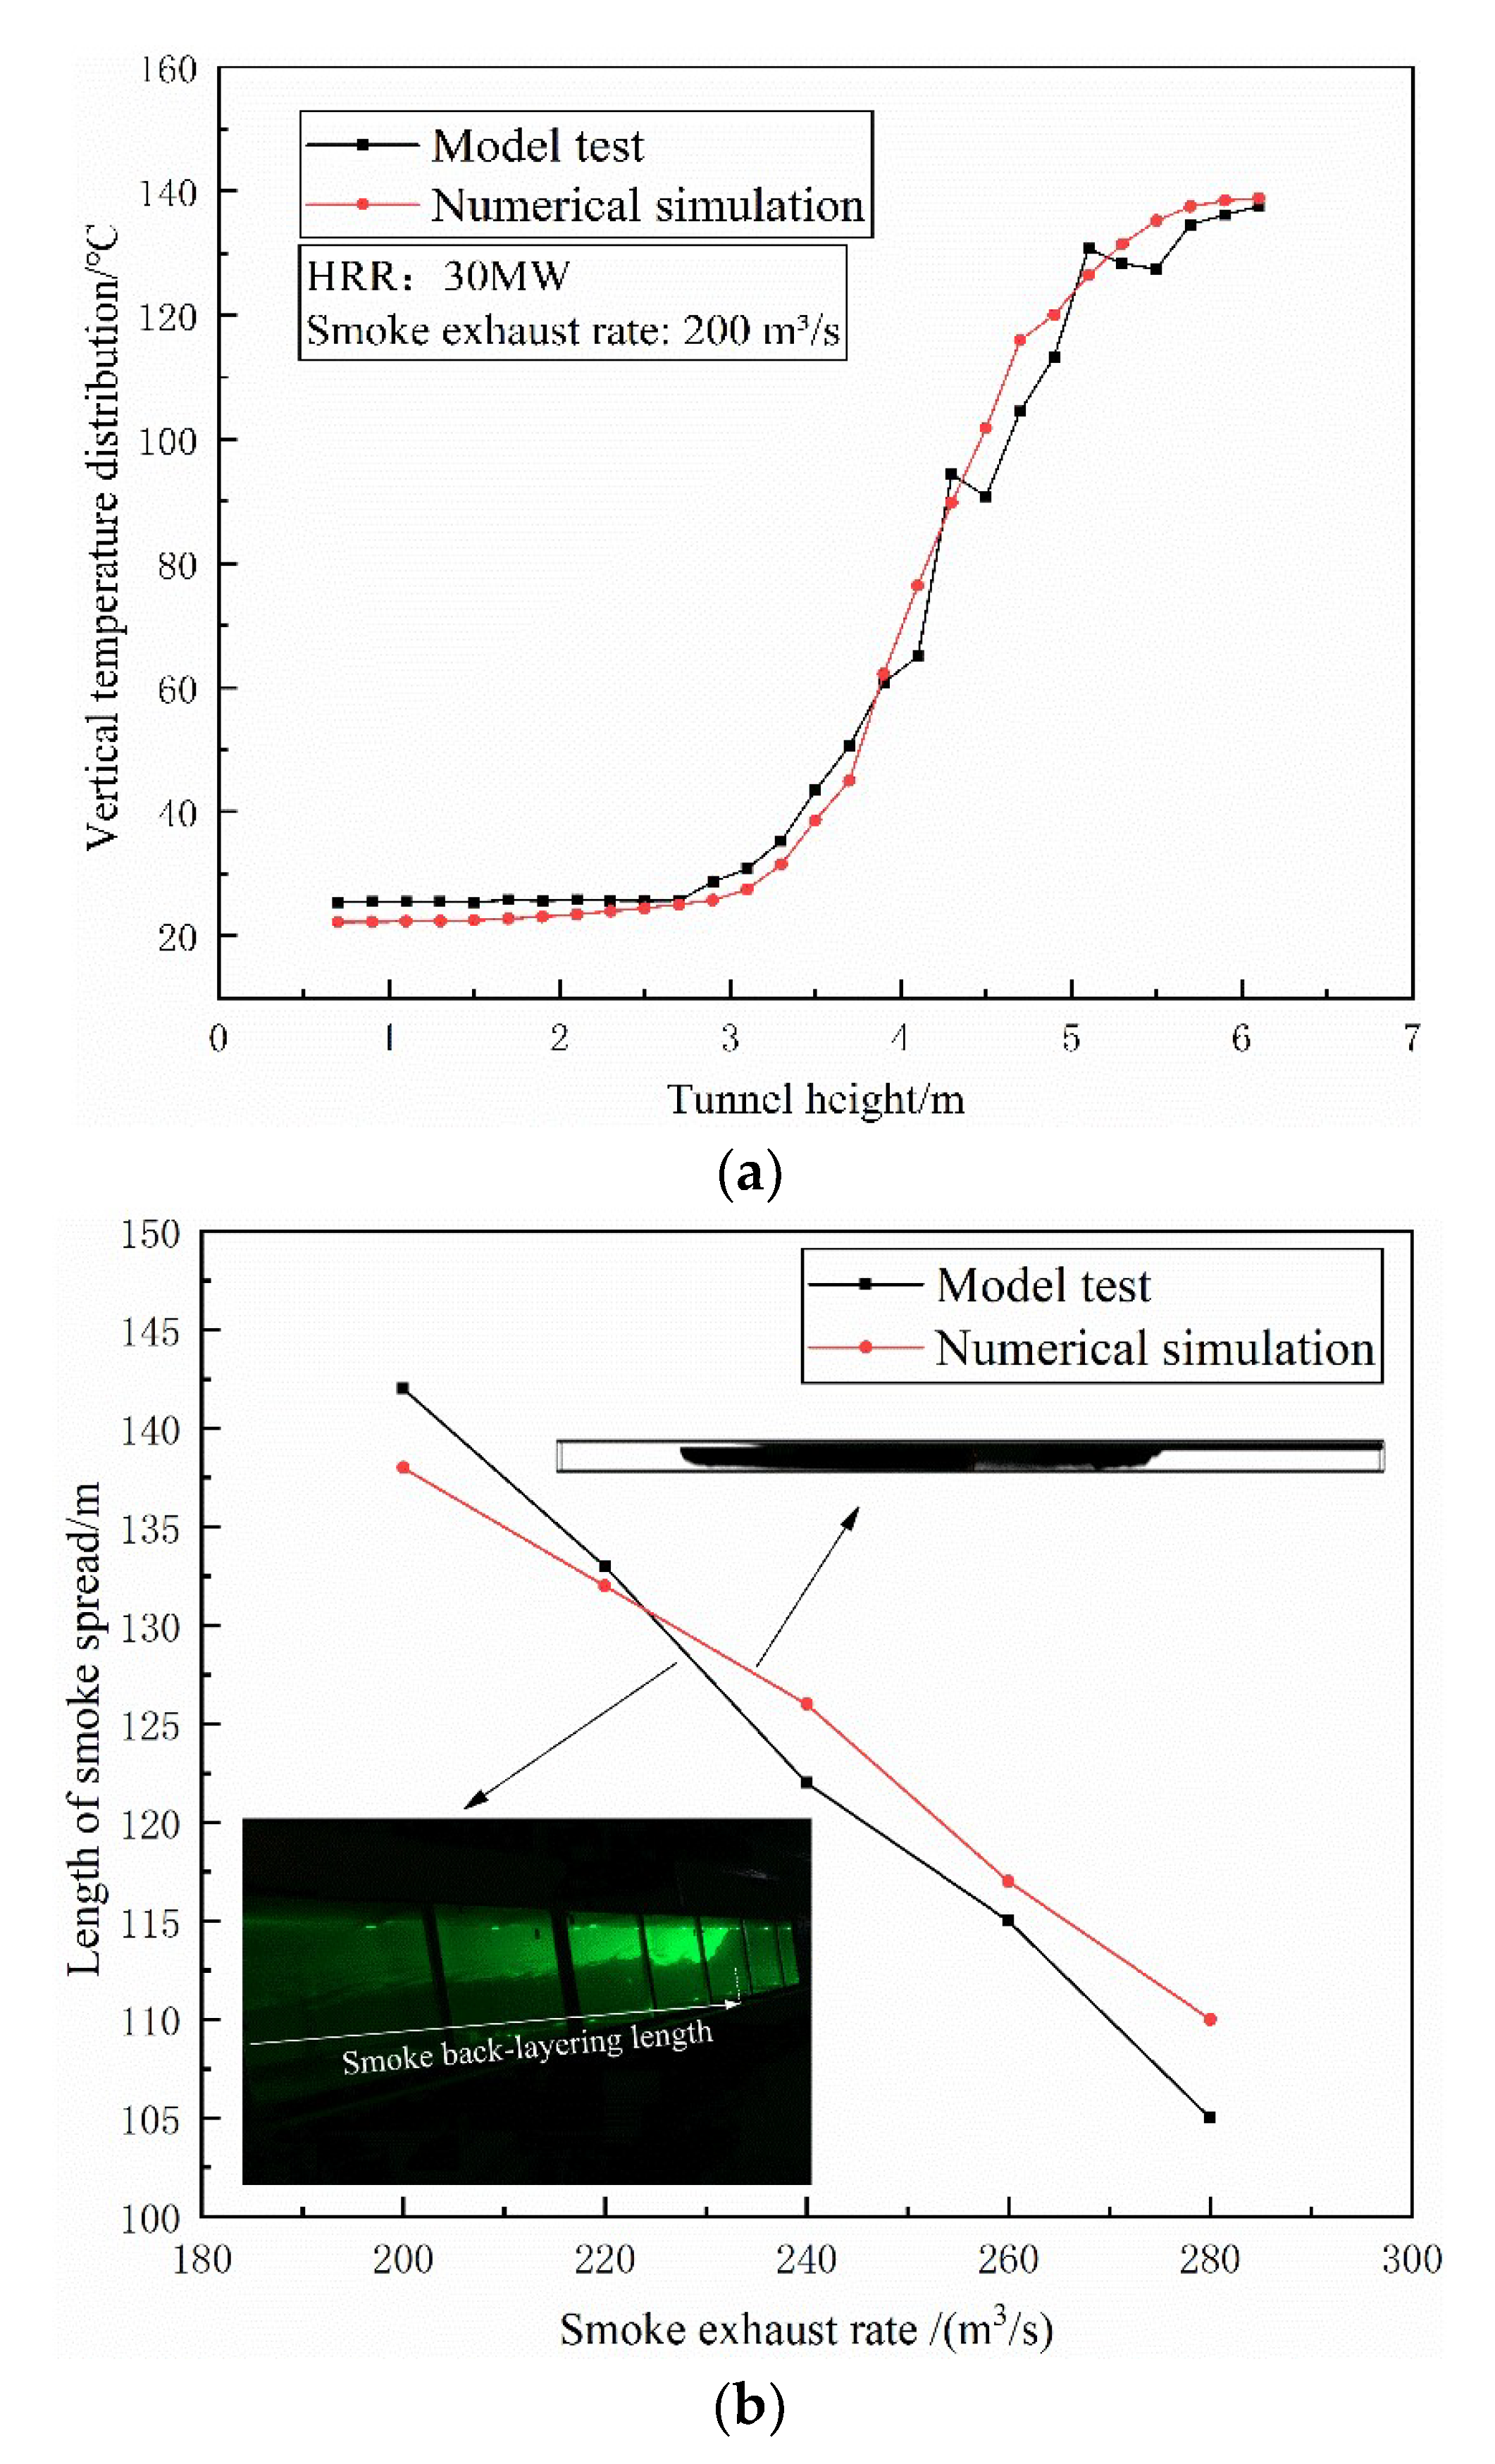
2.3. Experimental Verification
3. Results and Discussion
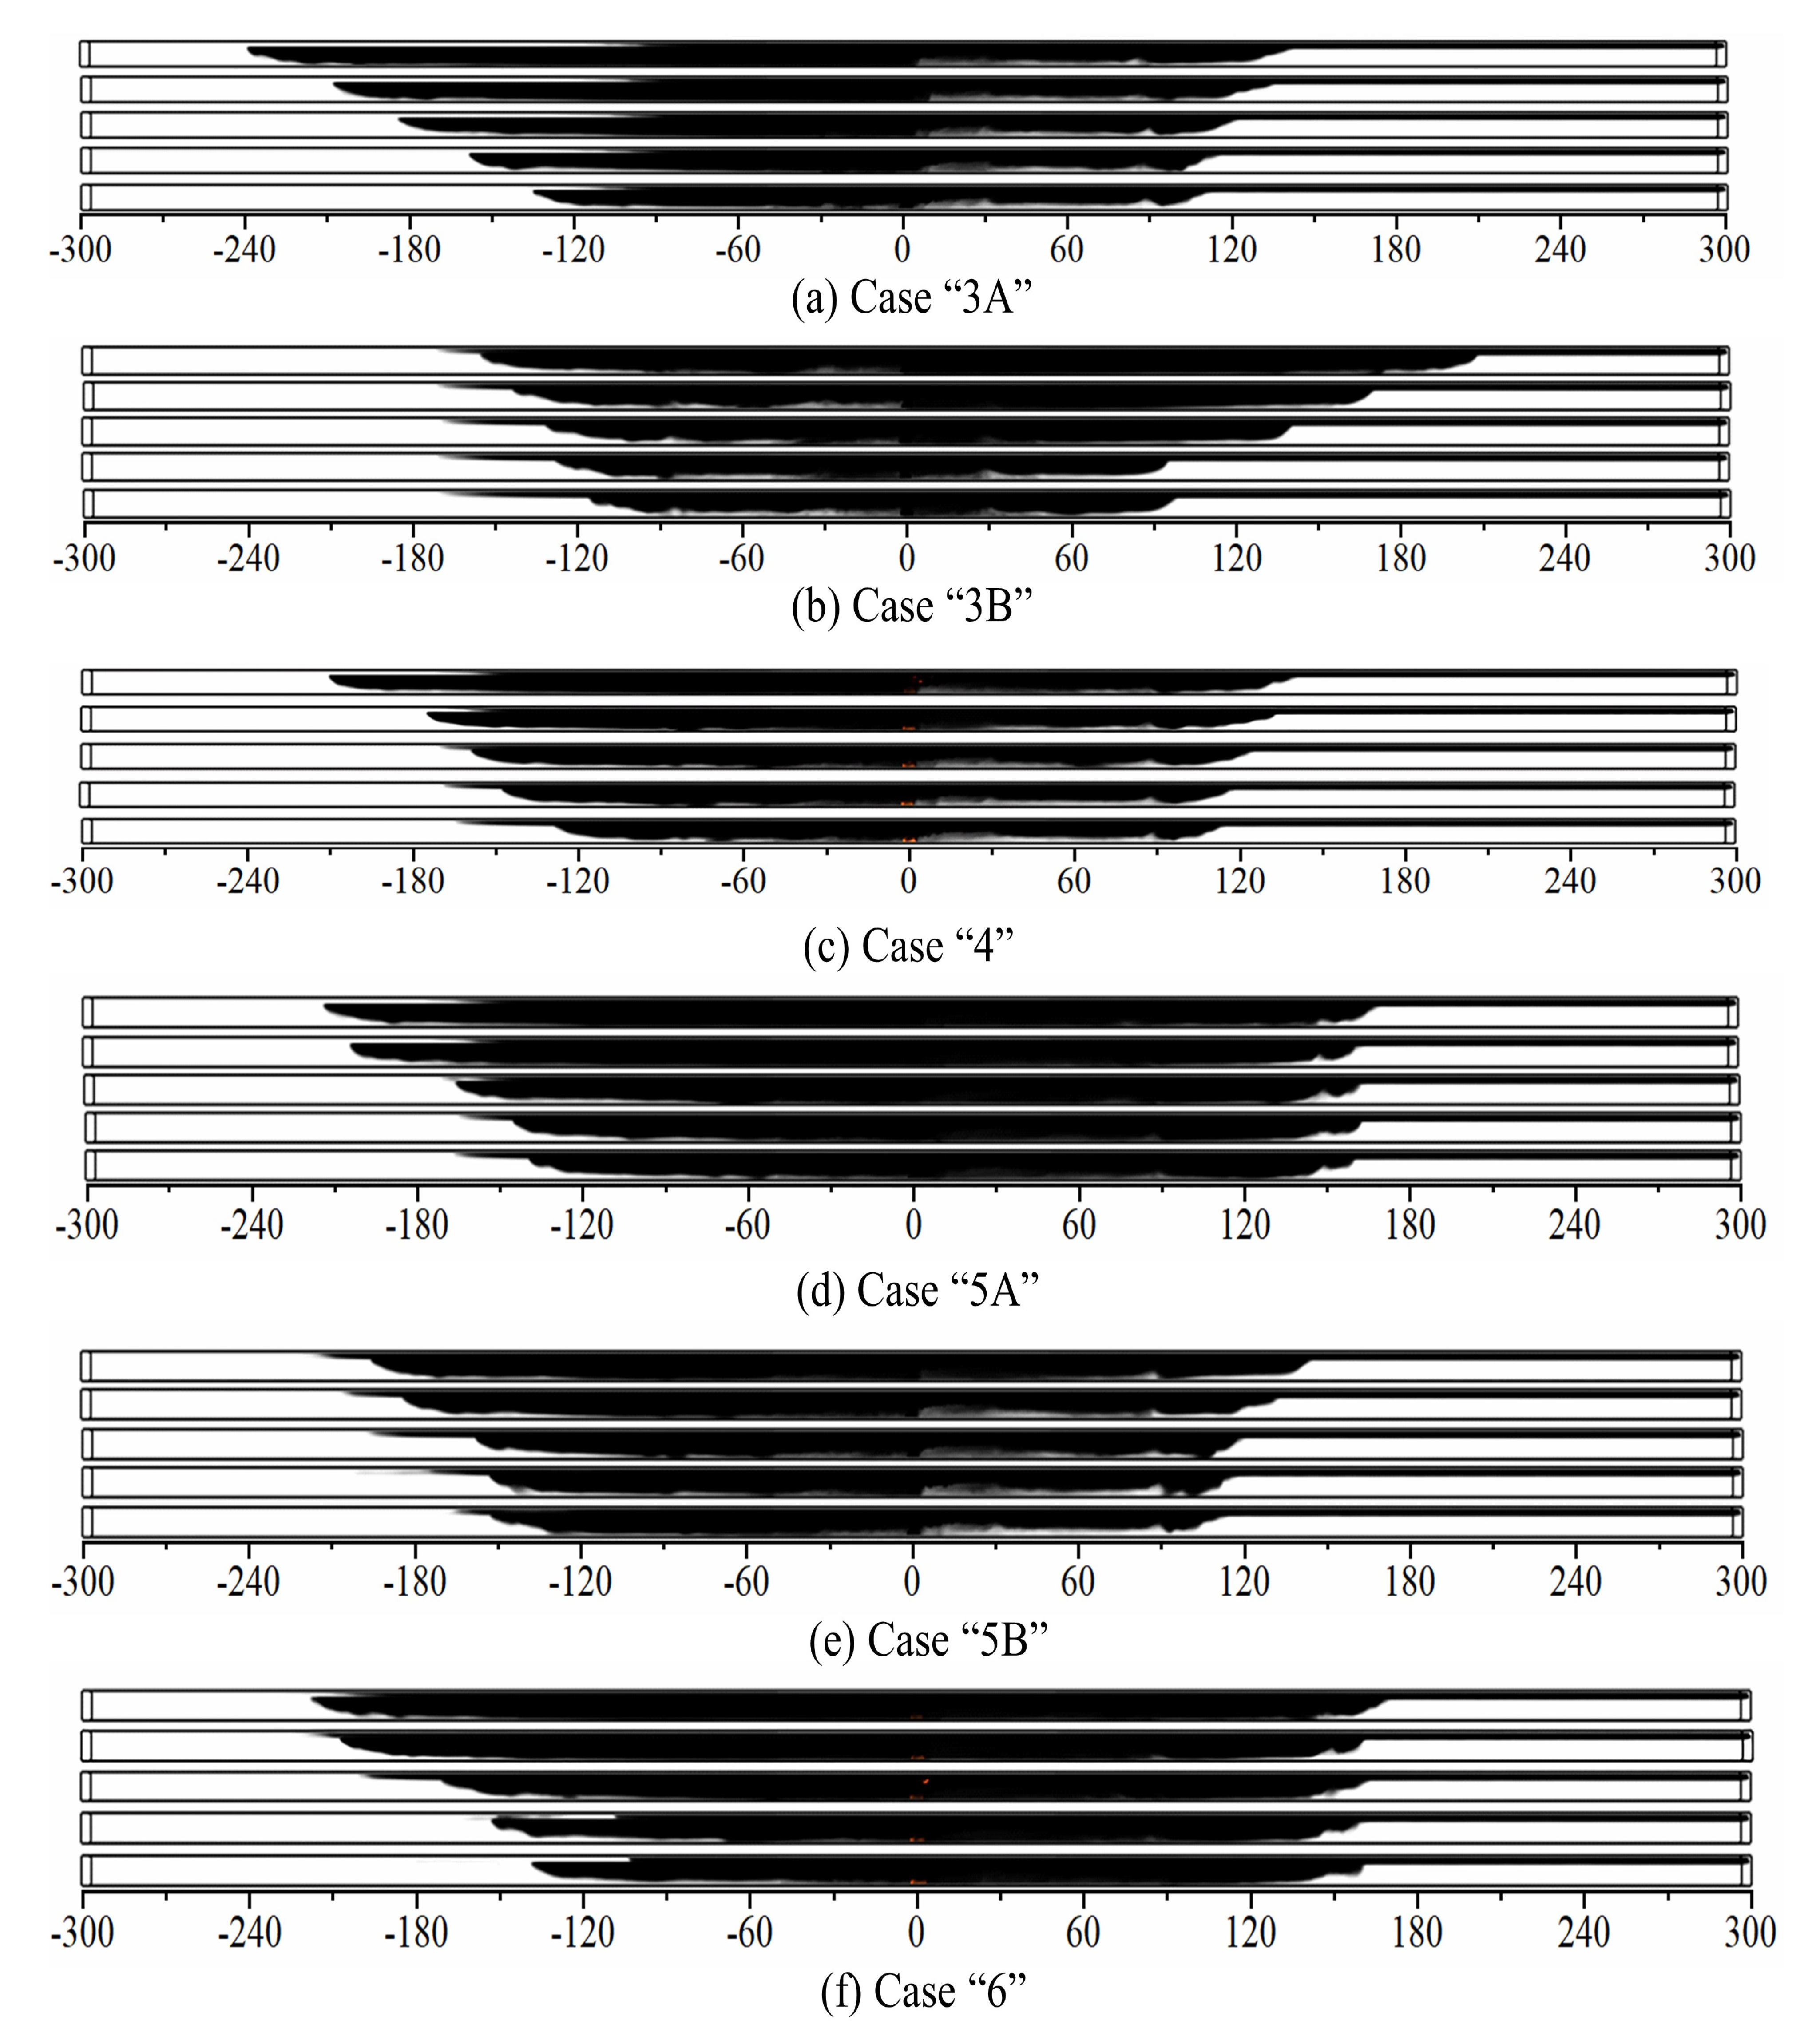
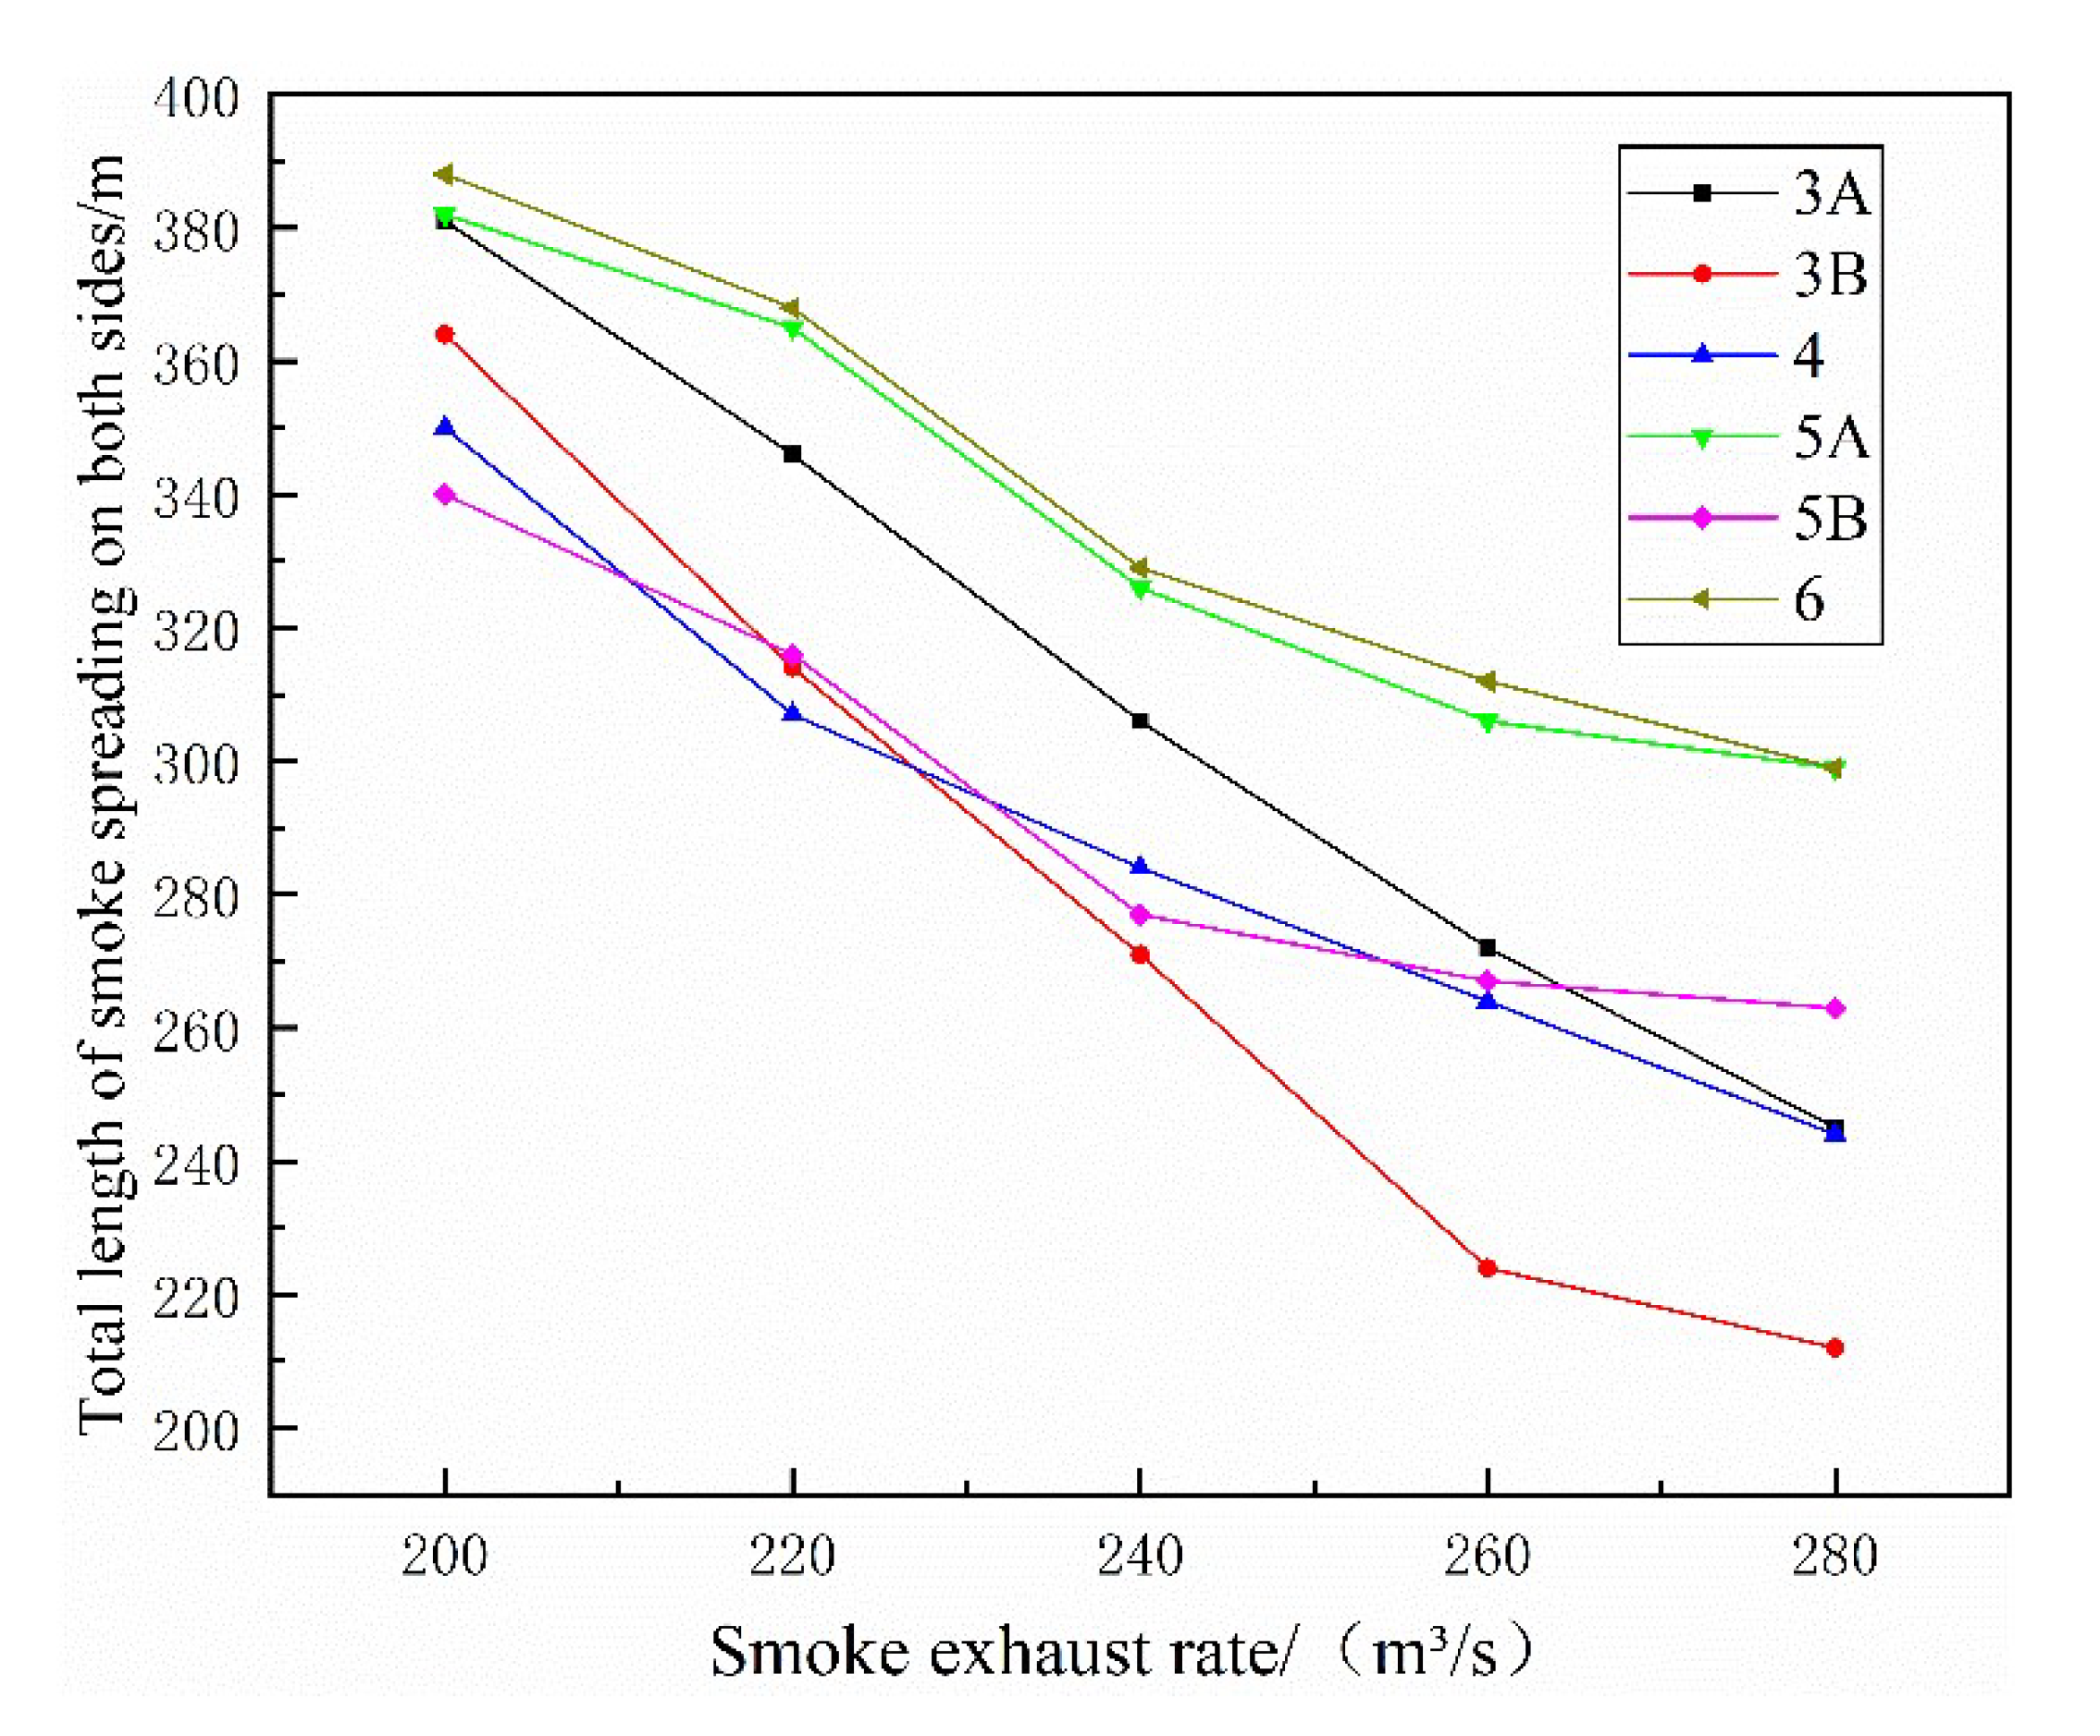
3.1. Smoke Spread
3.2. Temperature Distribution
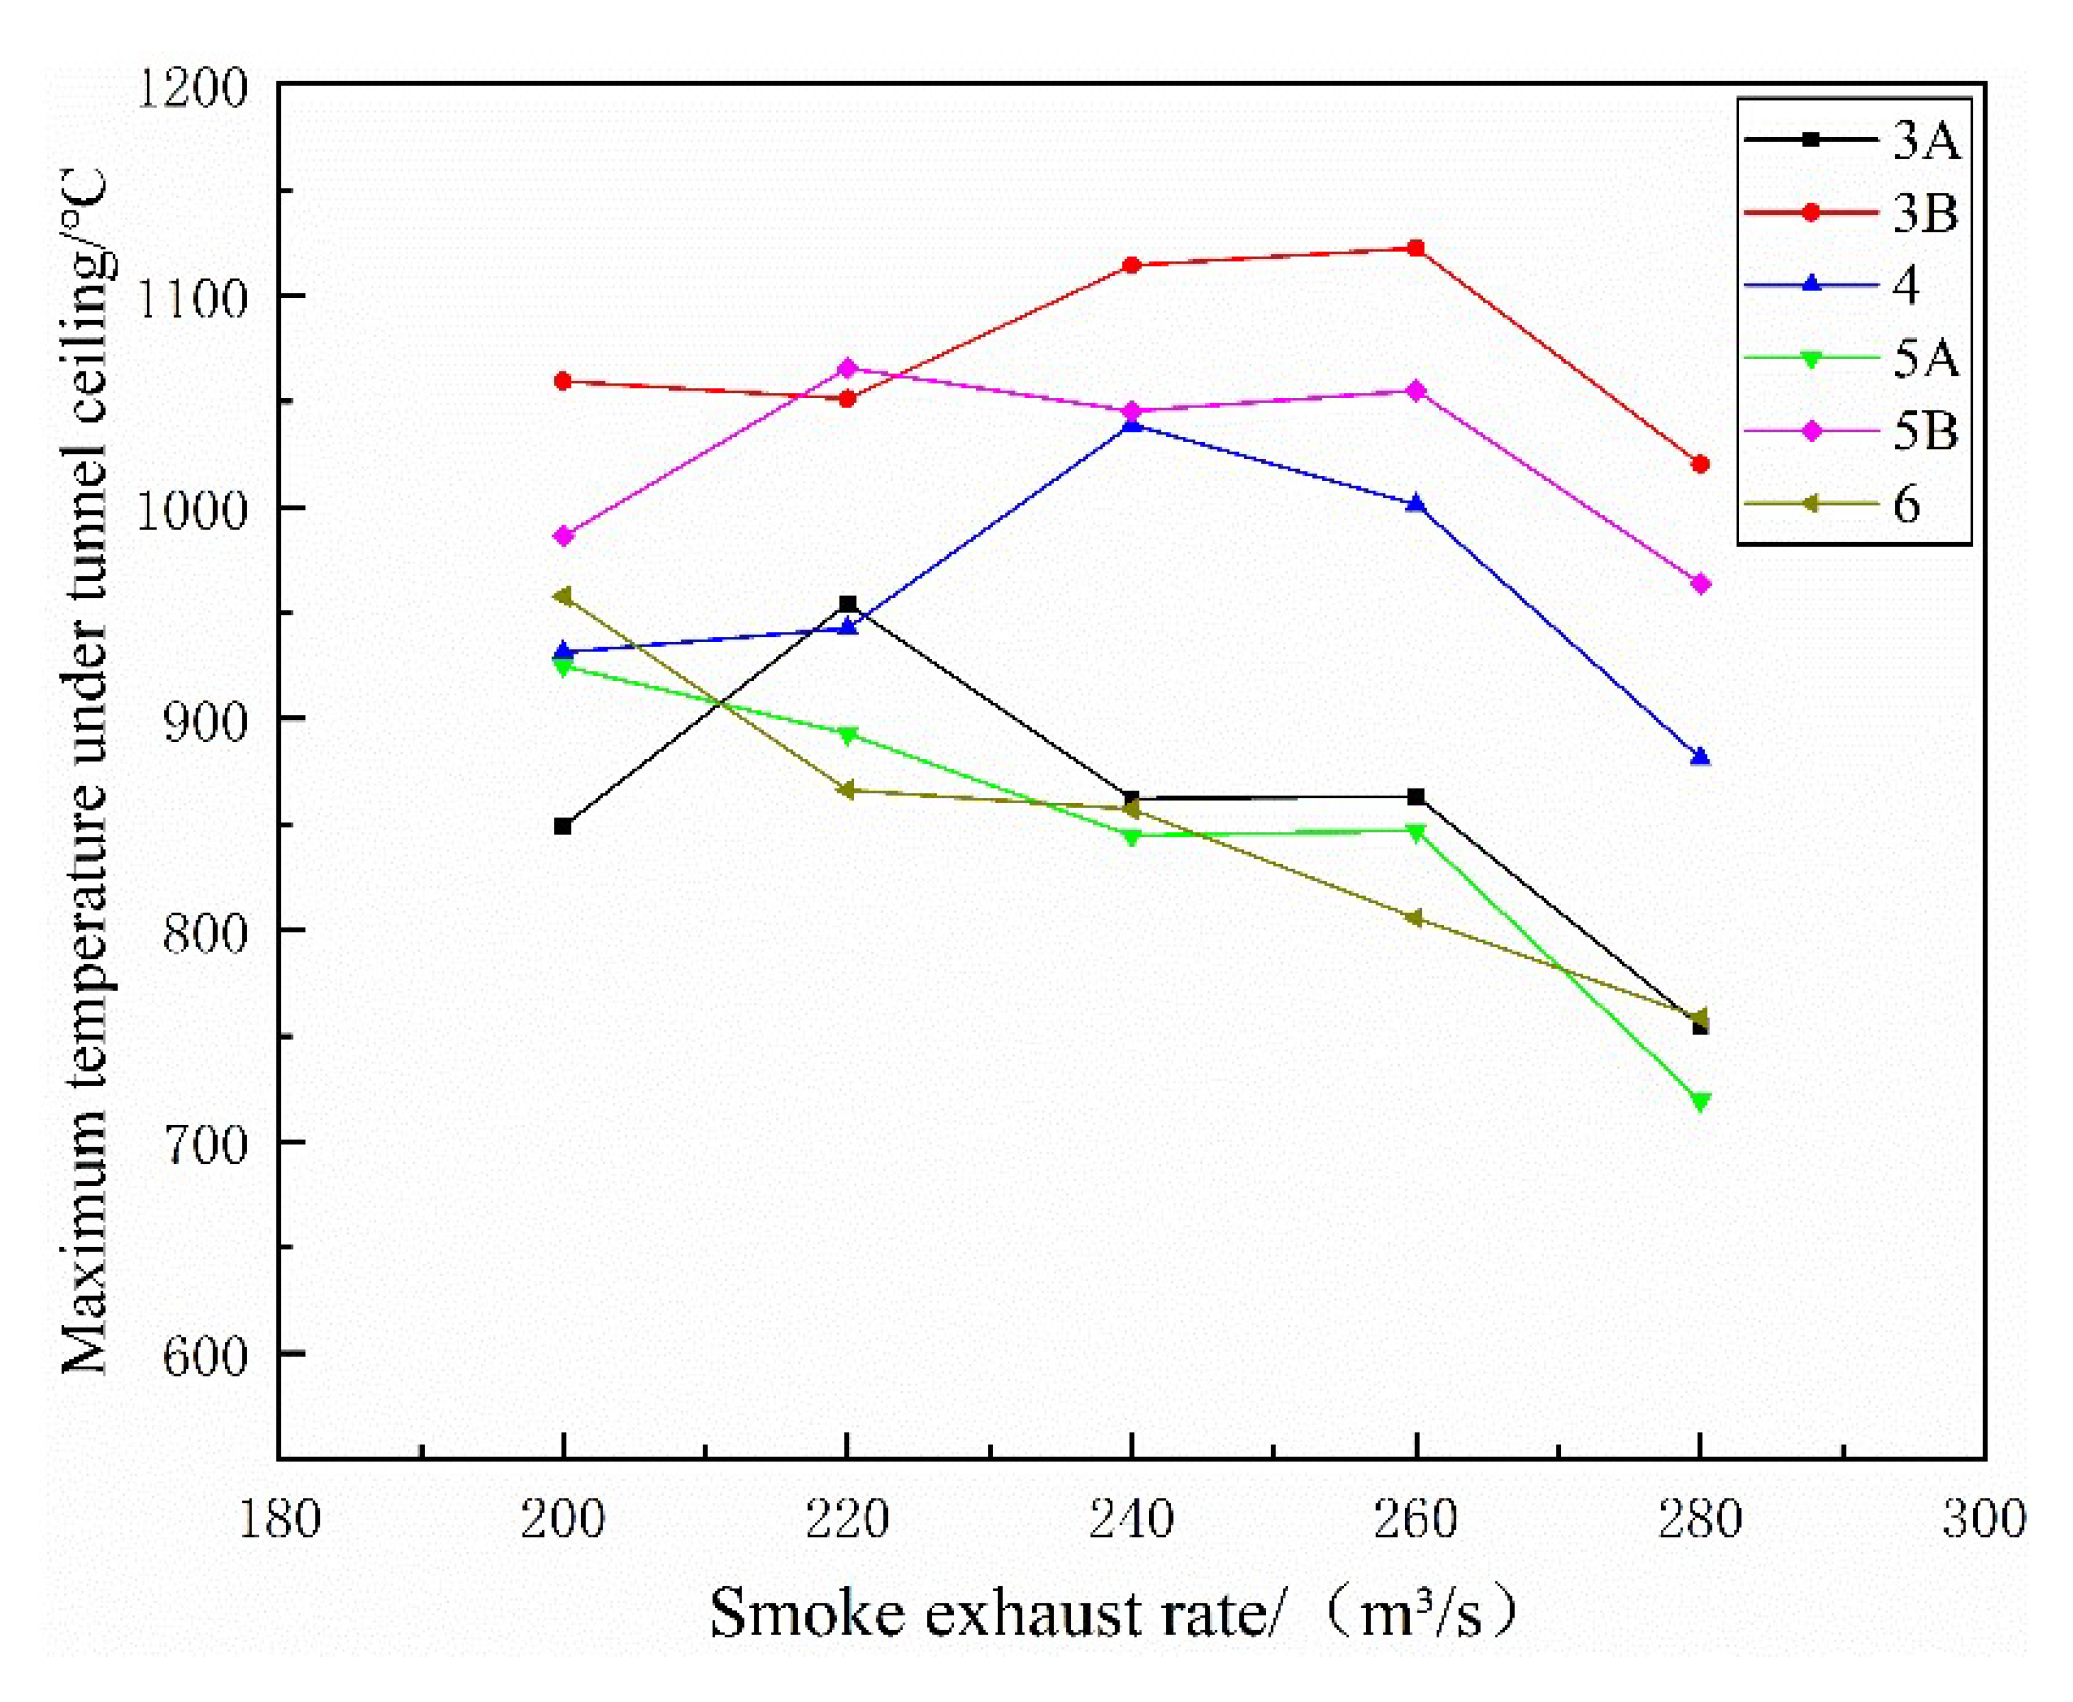
3.2.1. Maximum Temperature
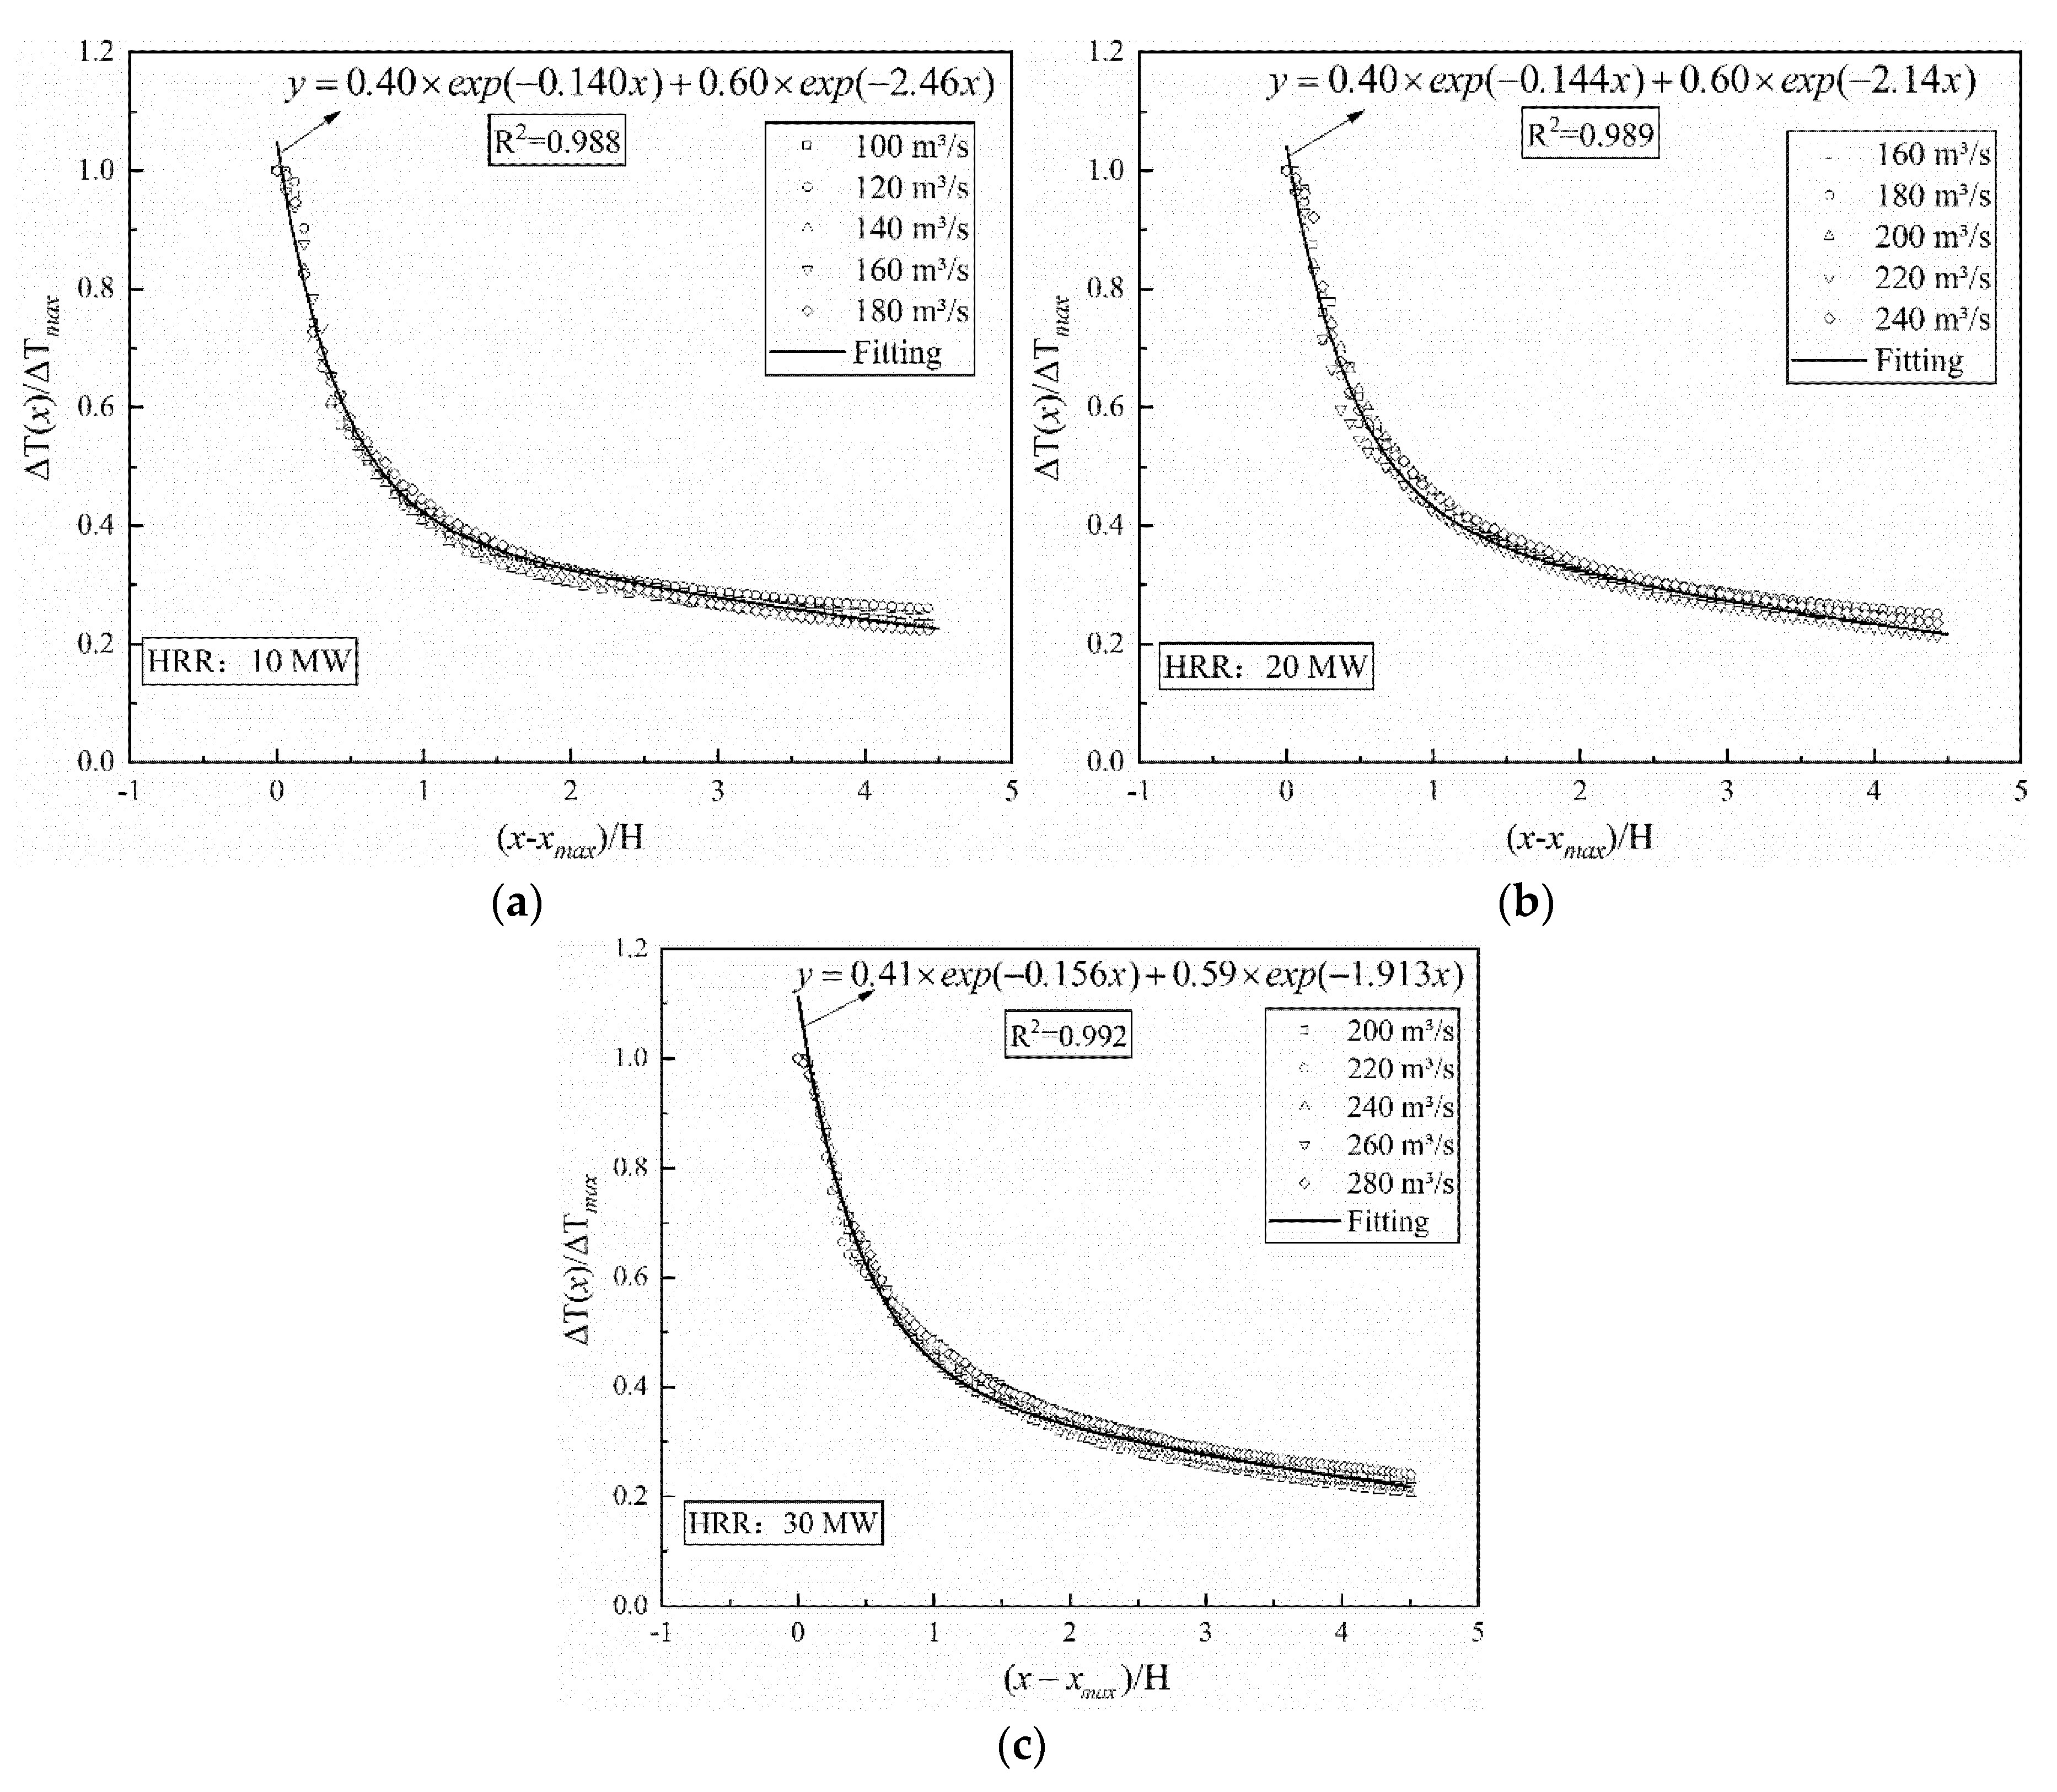
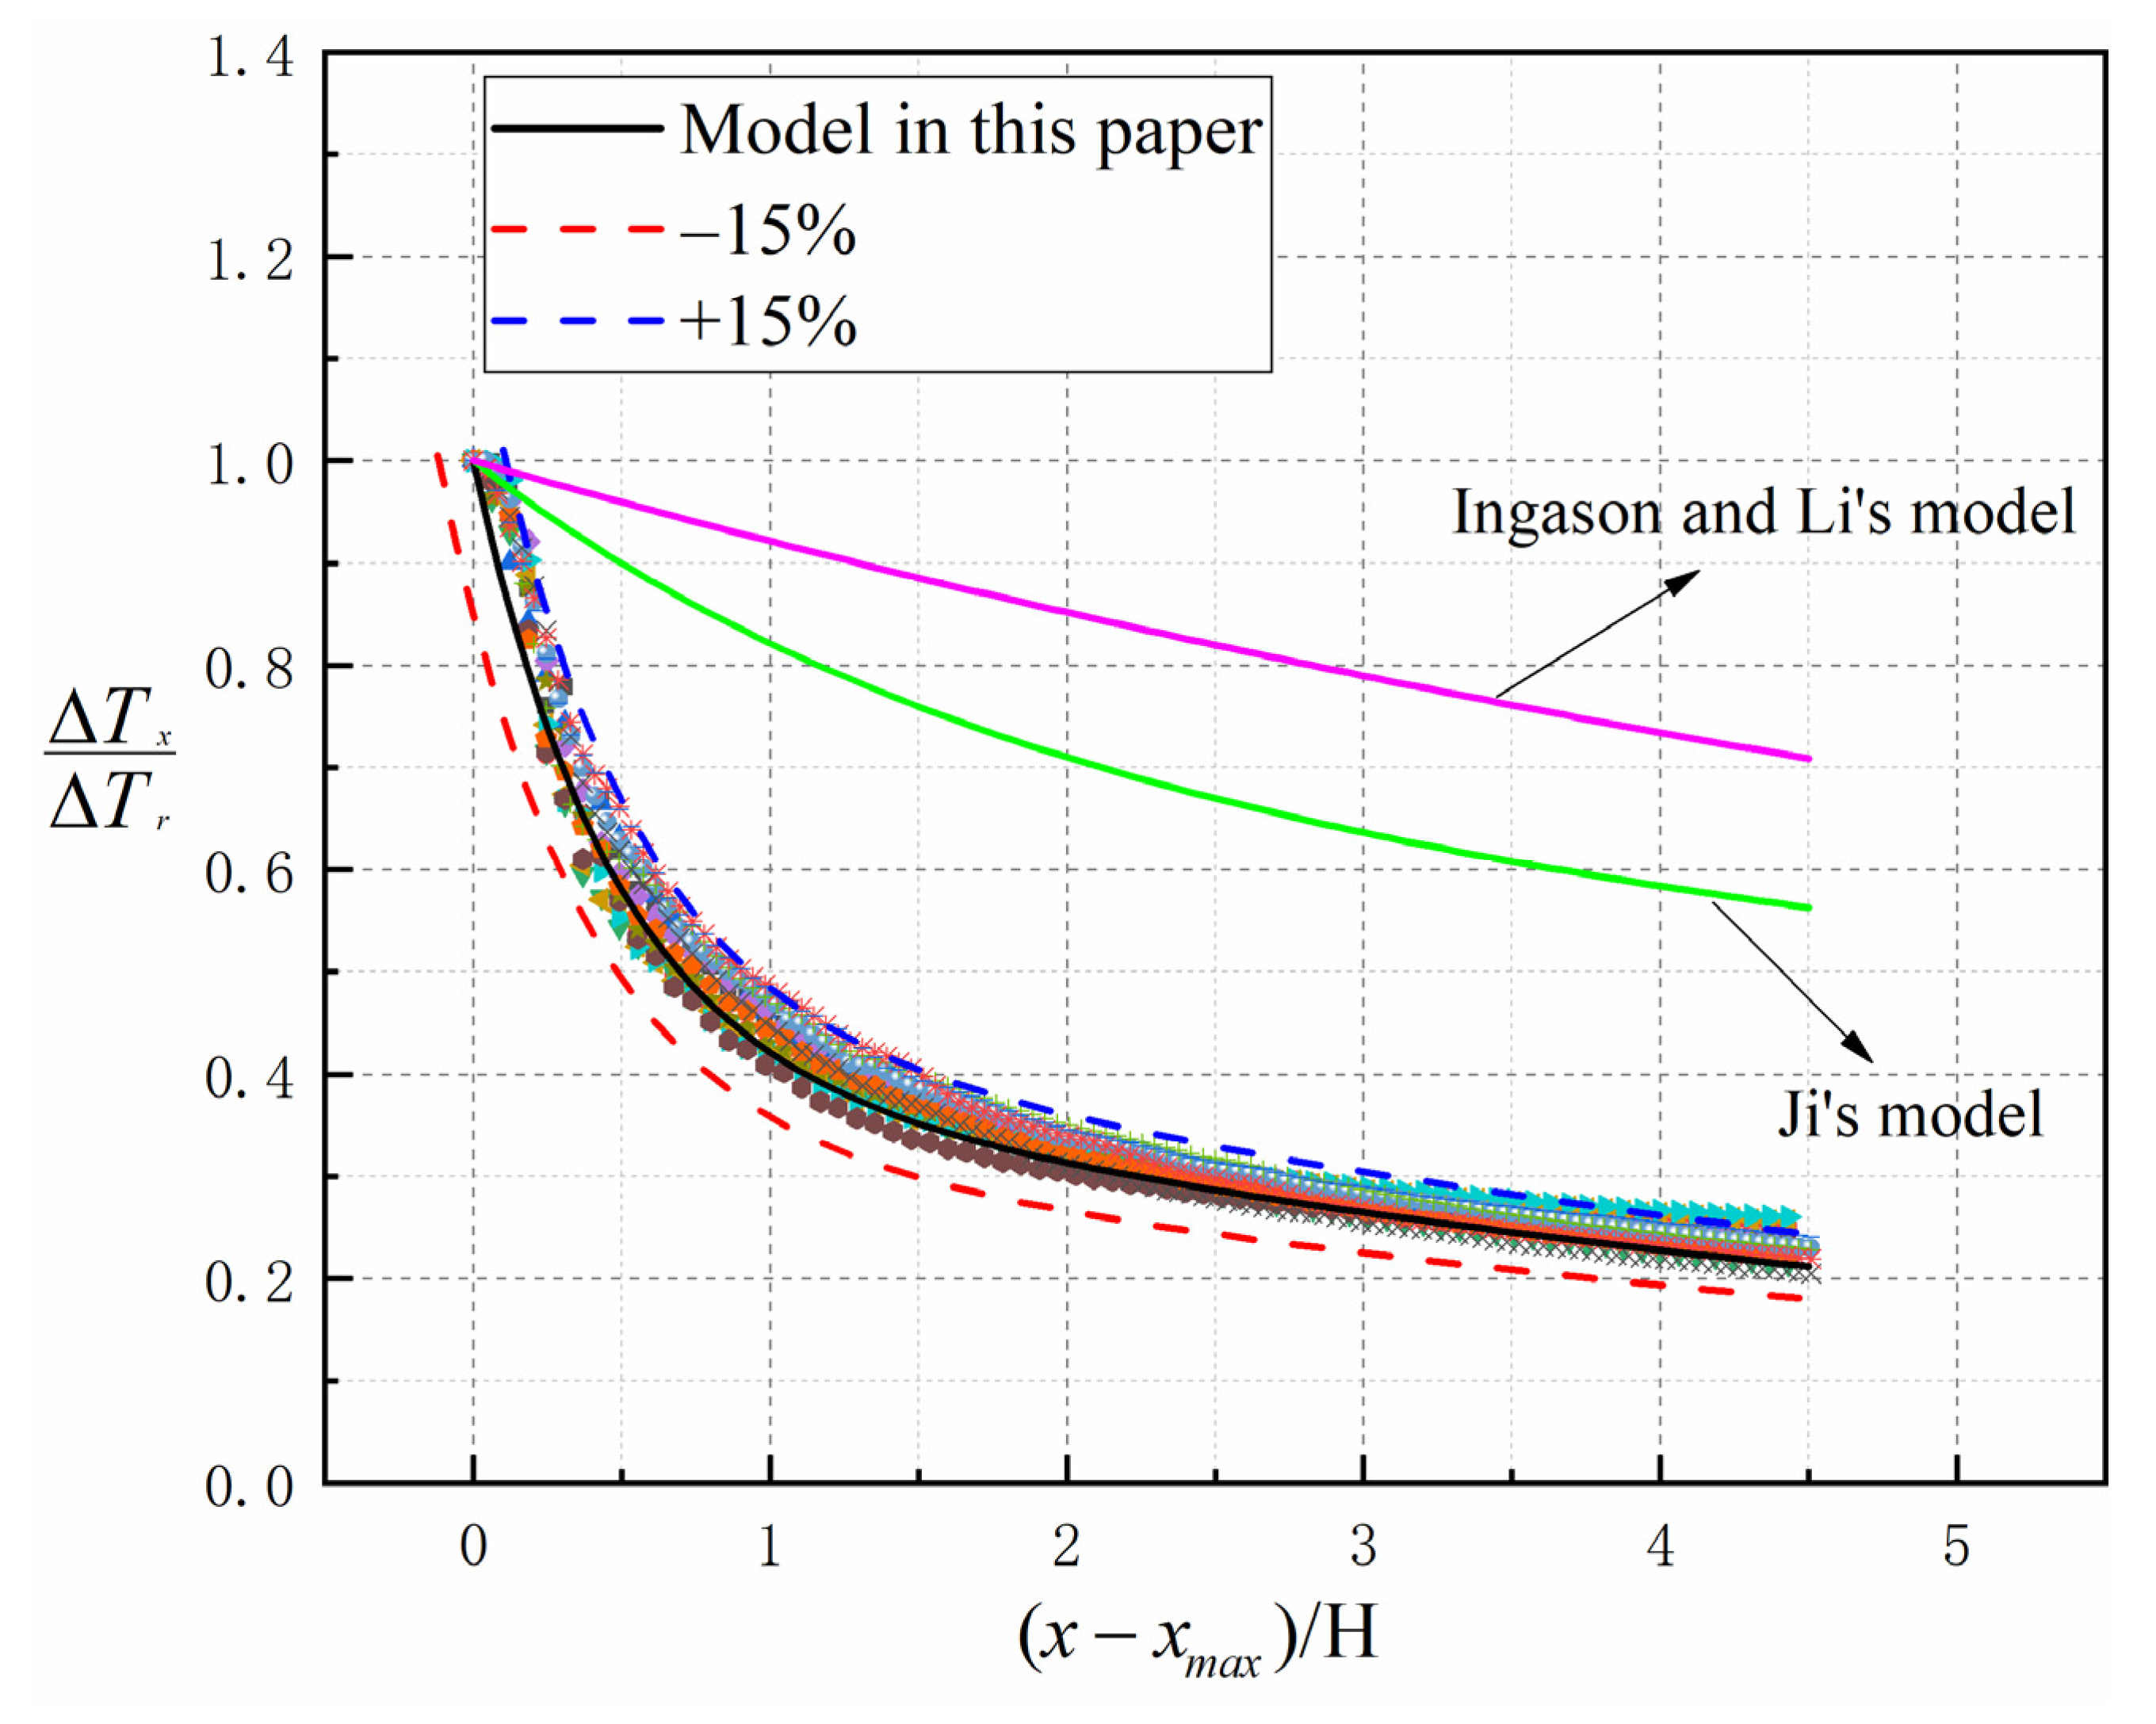
3.2.2. Temperature Decay Model
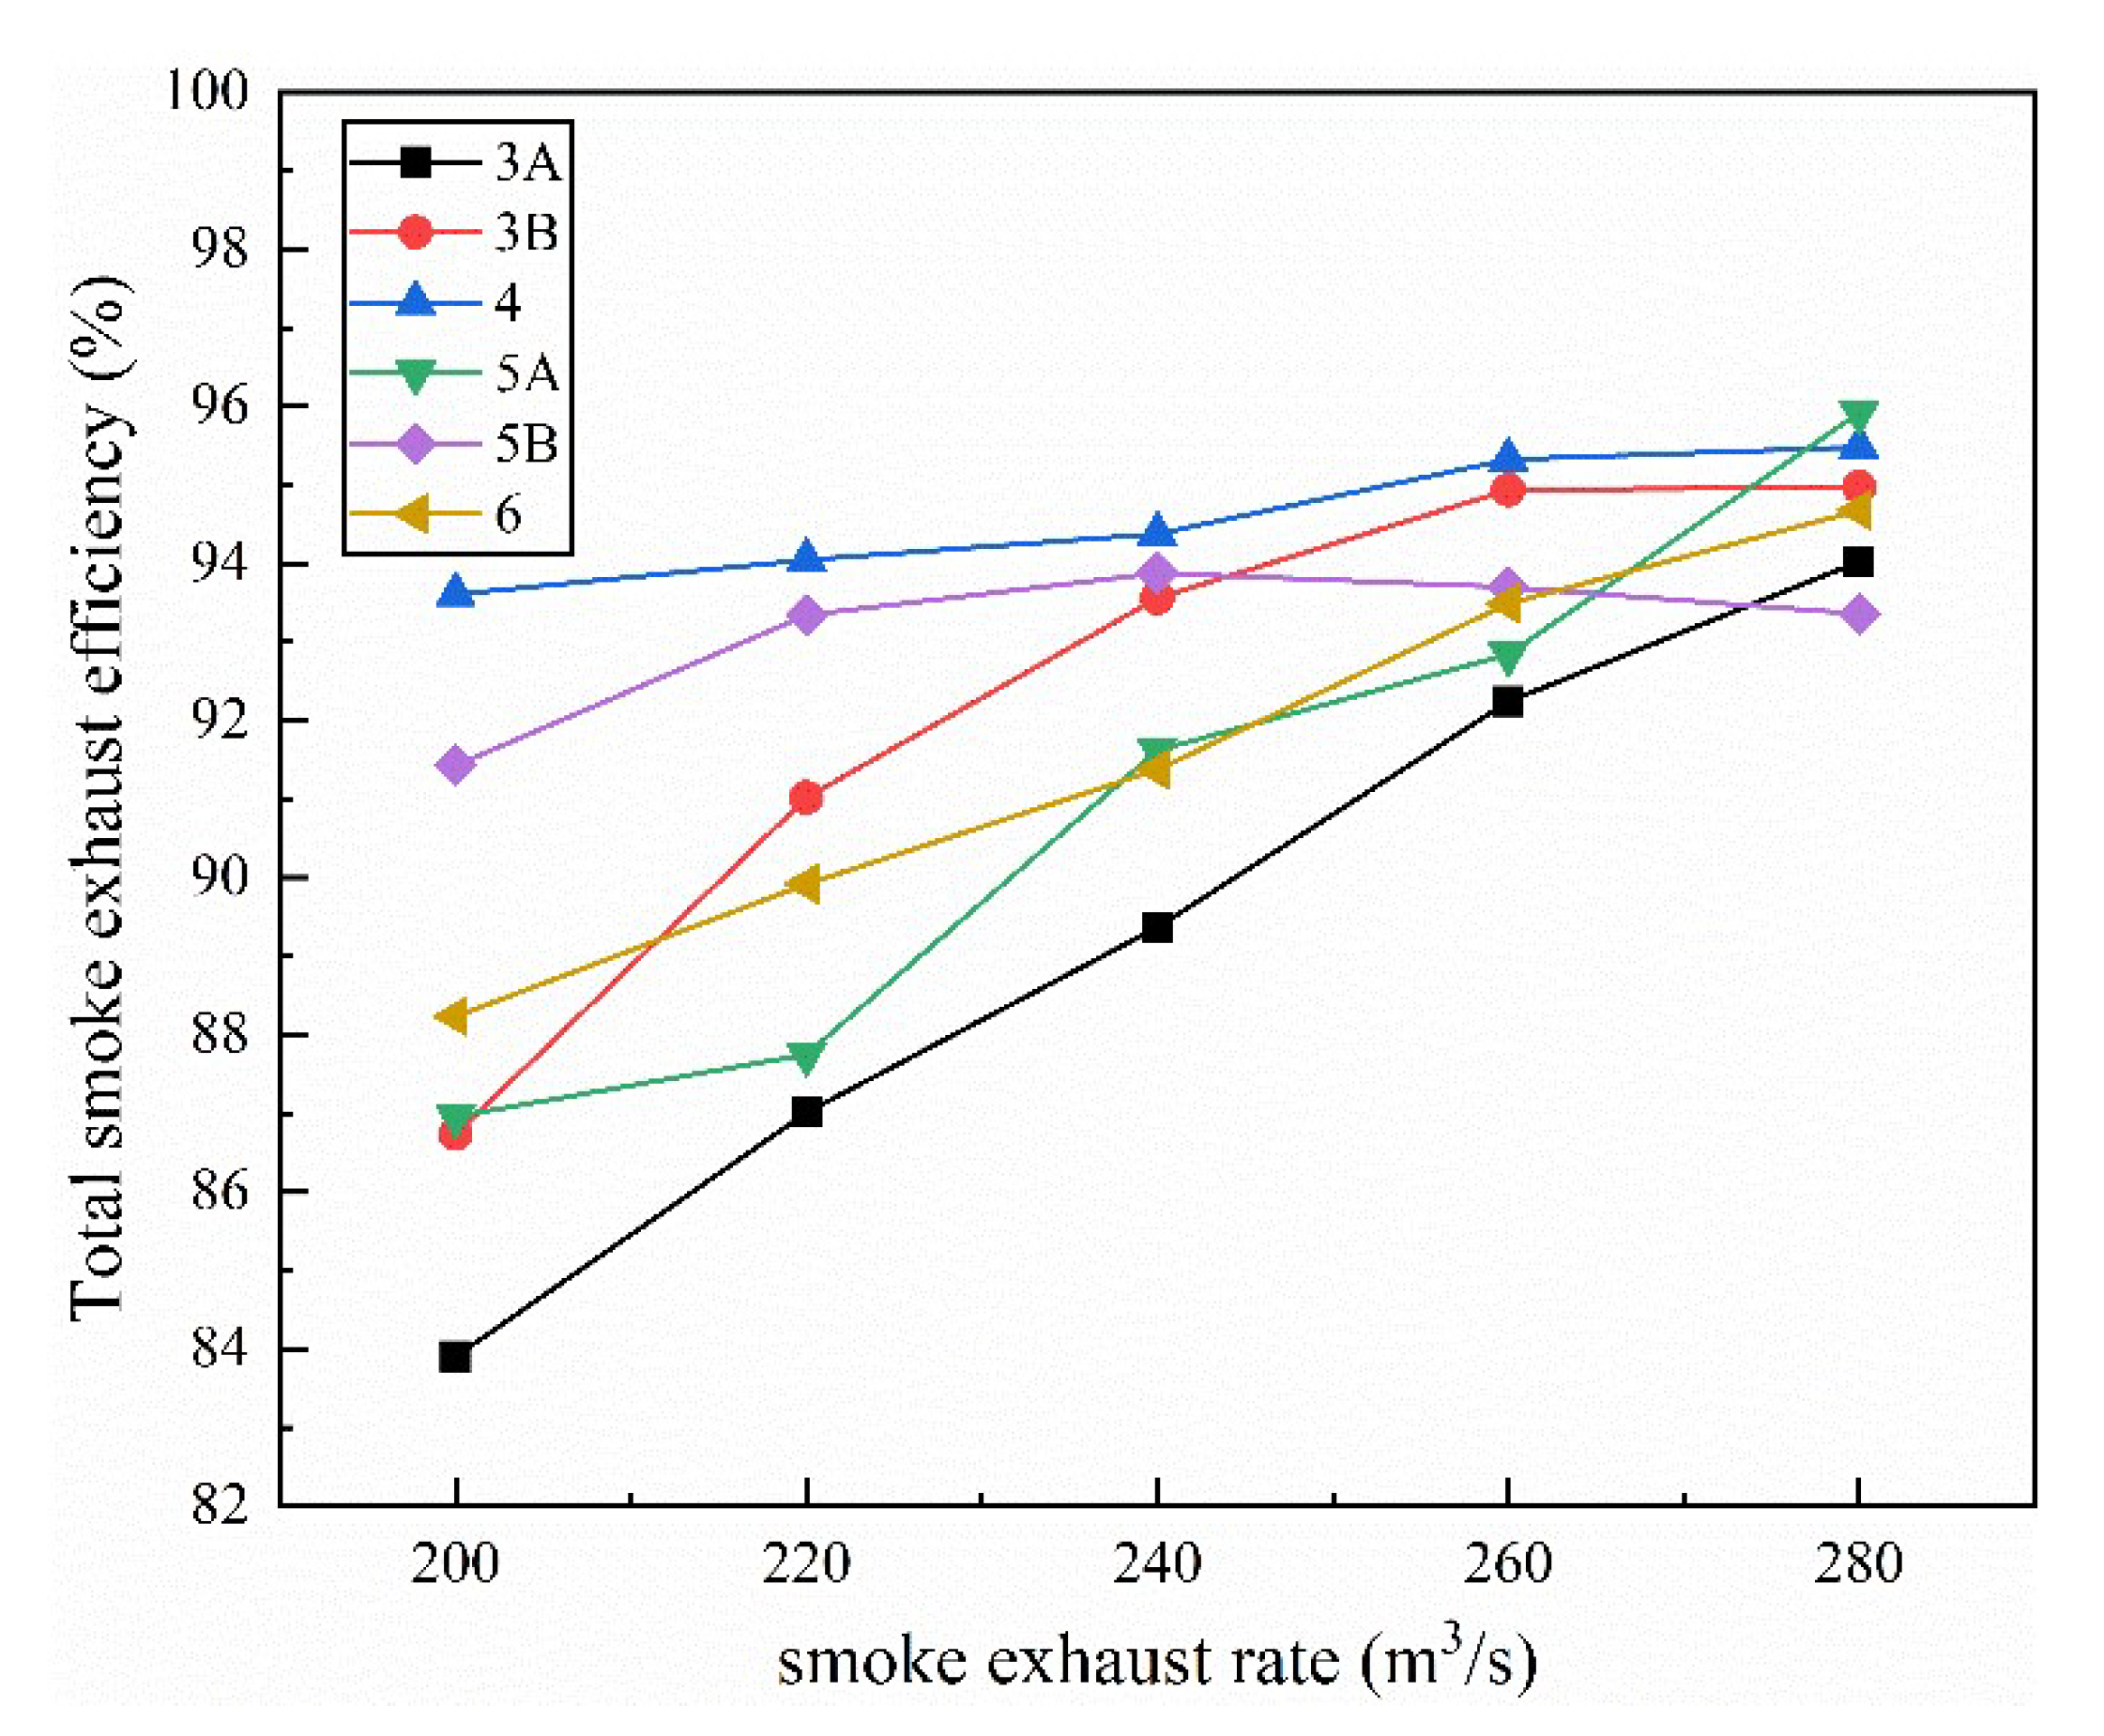
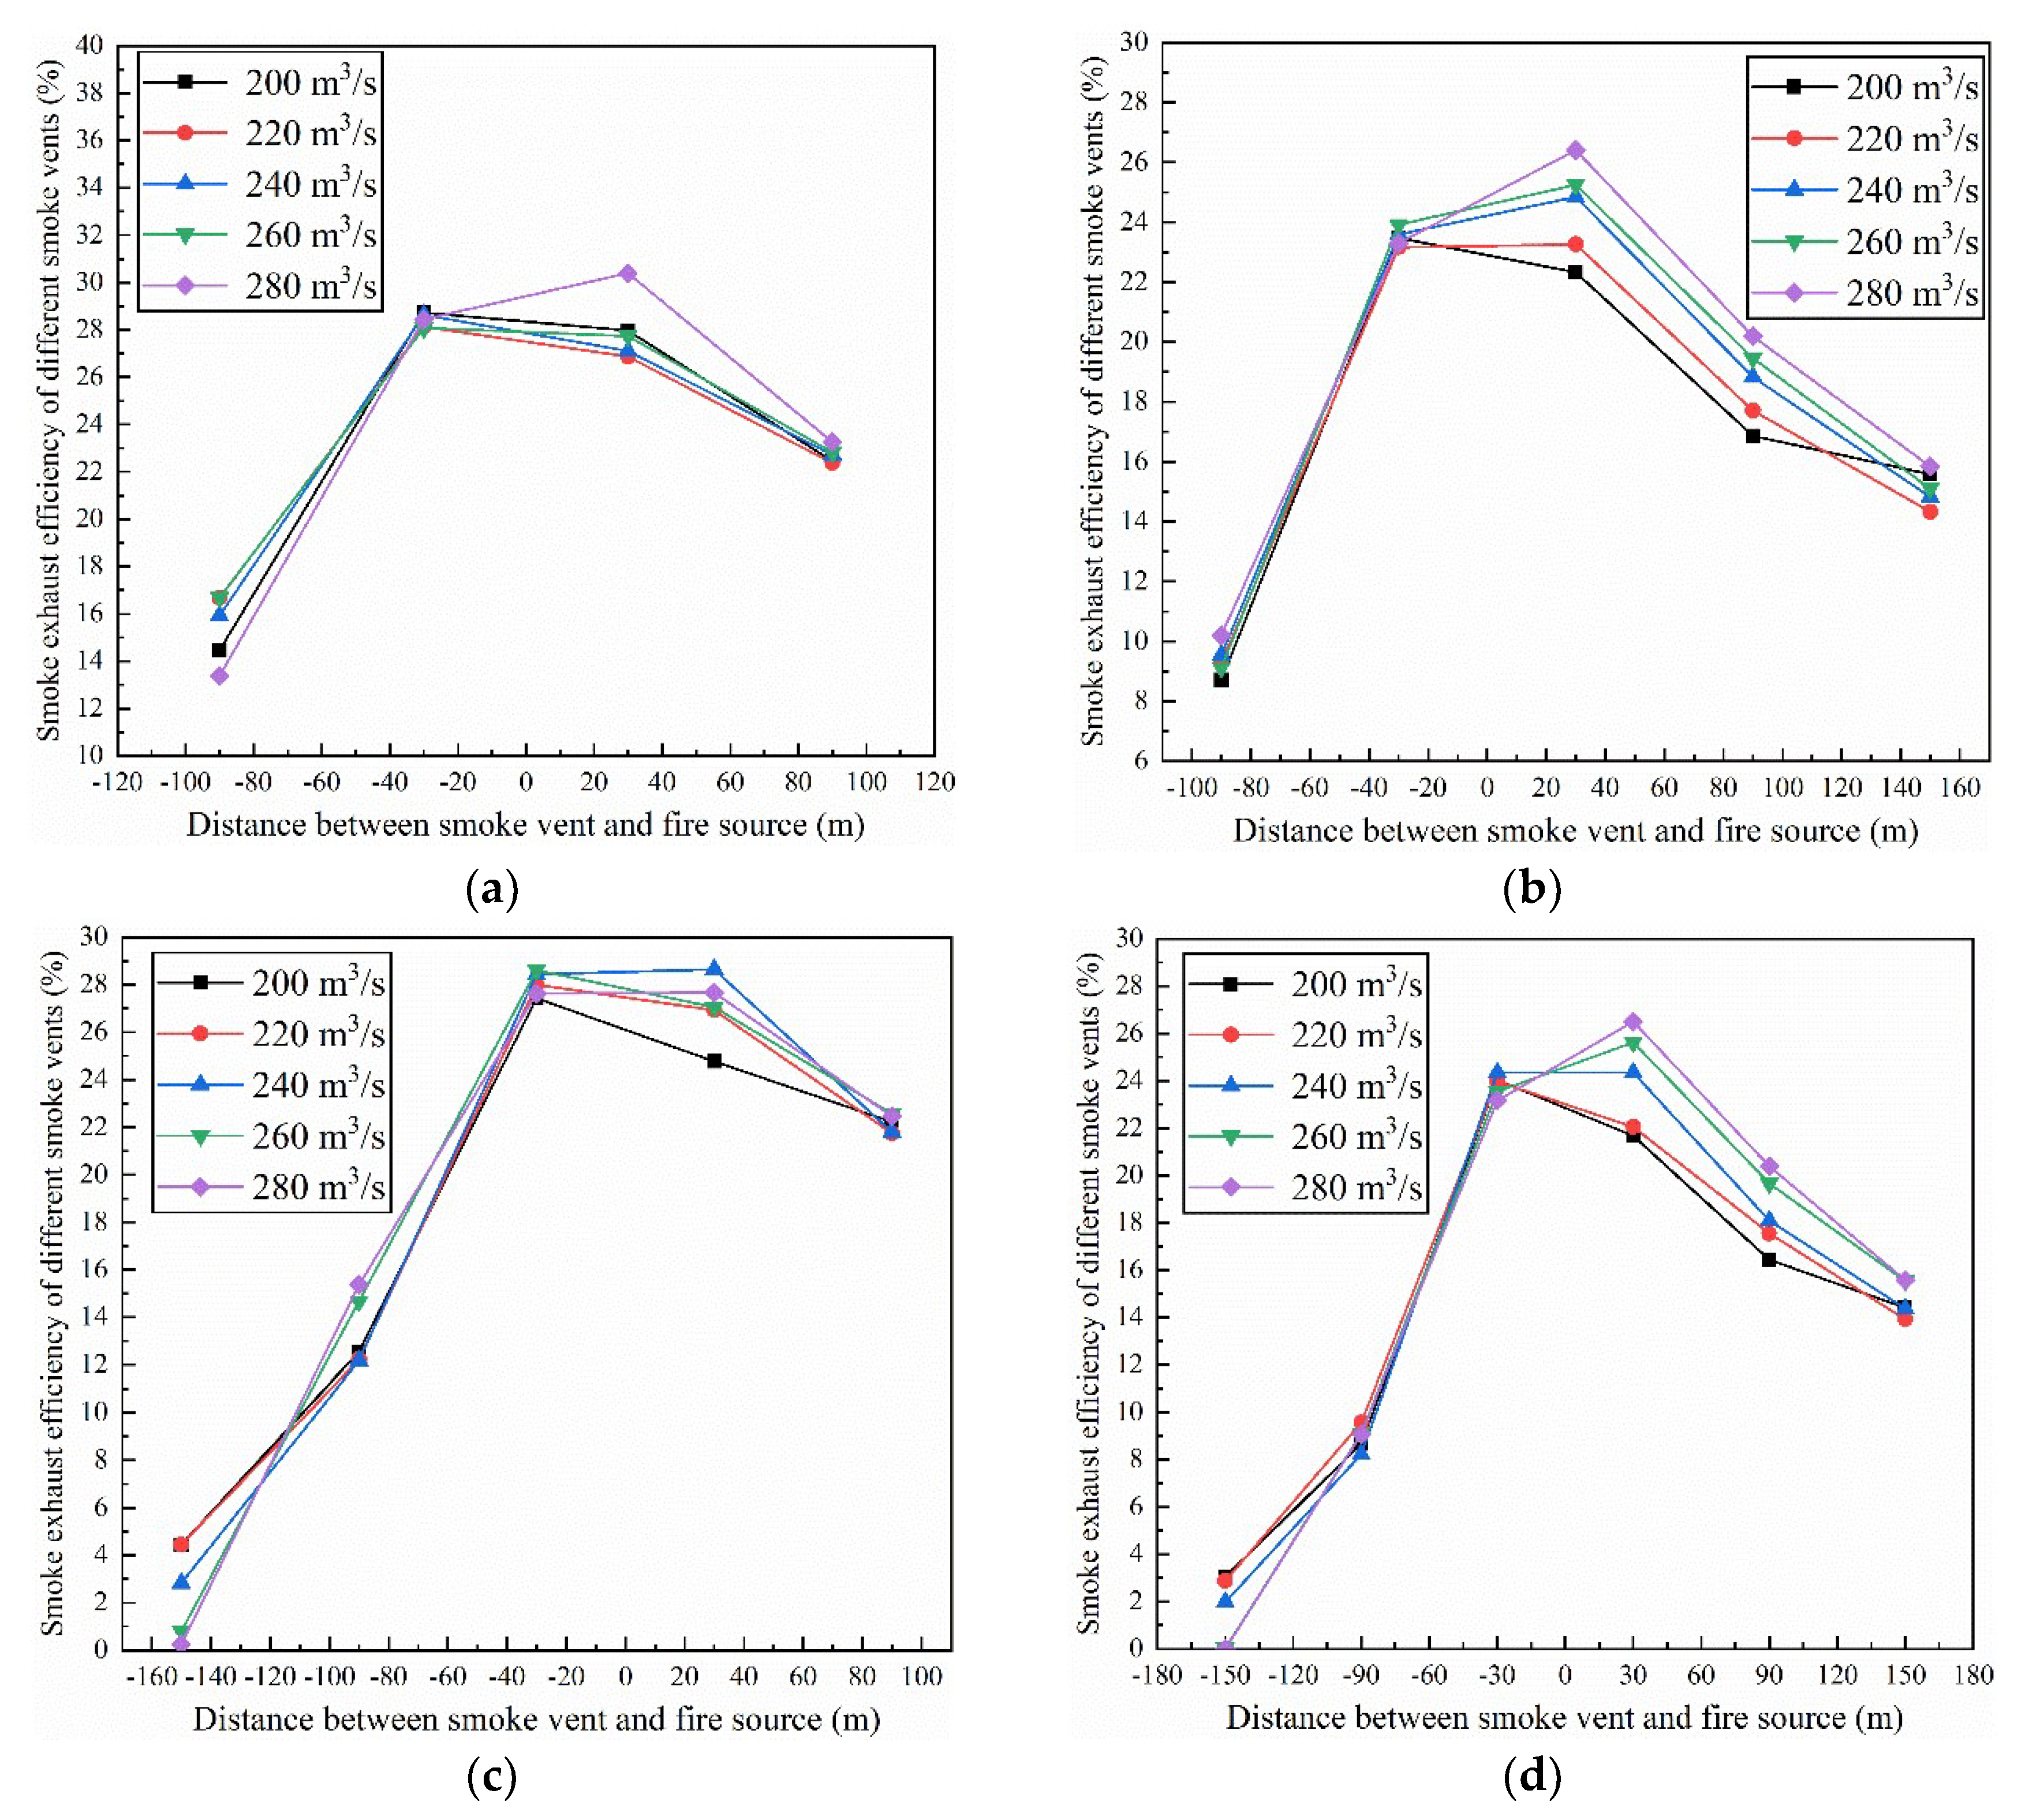
3.3. Exhaust Efficiency
4. Conclusions
- (1)
- When there are more than two smoke vents on one side of the fire source far away from the exhaust fan, some smoke exhaust vents will inhale fresh air rather than toxic smoke. When the layout of the exhaust vent is Case “4”, the total length of the smoke spread in single-side point exhaust tunnels is shortest;
- (2)
- The maximum temperature decreases with the increase in the smoke exhaust rate. The temperature is much higher than in other smoke exhaust vent opening schemes at the same smoke exhaust volume as Case “6”;
- (3)
- By analyzing the simulation results of the vault temperature under different HRRs and exhaust rates, an empirical formula of temperature attenuation for Case “4” was proposed: . The error of the temperature attenuation model is less than 15%;
- (4)
- Under the same exhaust volume, the exhaust efficiency is the highest when the layout of the exhaust vent is Case “4”. The total smoke exhaust efficiency of the tunnel is more than 93.7% and the maximum difference of the total smoke exhaust efficiency is less than 1.5% under different smoke exhaust rates;
- (5)
- For a single-side point exhaust tunnel, the number of smoke vents near the smoke exhaust fan side shall not be more than that on the other side. The proposed smoke control scheme for the Mawan tunnel with a designed HRR of 30 MW is as follows: the layout of the exhaust vent is as shown in Case “4”, and the smoke exhaust rate is 220 m³/s.
Author Contributions
Funding
Institutional Review Board Statement
Informed Consent Statement
Data Availability Statement
Acknowledgments
Conflicts of Interest
References
- Tomar, M.S.; Khurana, S. Impact of passive fire protection on heat release rates in road tunnel fire: A review. Tunn. Undergr. Space Technol. 2019, 85, 149–159. [Google Scholar] [CrossRef]
- Hua, N.; Elhami Khorasani, N.; Tessari, A.; Ranade, R. Experimental study of fire damage to reinforced concrete tunnel slabs. Fire Saf. J. 2022, 127, 103504. [Google Scholar] [CrossRef]
- Felis, F.; Pavageau, M.; Elicer-Cortés, J.C.; Dassonville, T. Simultaneous measurements of temperature and velocity fluctuations in a double stream-twin jet air curtain for heat confinement in case of tunnel fire. Int. Commun. Heat Mass Transf. 2010, 37, 1191–1196. [Google Scholar] [CrossRef]
- Alpert, R.L. Calculation of response time of ceiling-mounted fire detectors. Fire Technol. 1972, 8, 181–195. [Google Scholar] [CrossRef]
- Alarie, Y. Toxicity of fire smoke. Crit. Rev. Toxicol. 2002, 32, 259–289. [Google Scholar] [CrossRef]
- Tao, L.; Zhang, Y.; Hou, K.; Bai, Y.; Zeng, Y.; Fang, Y. Experimental study on temperature distribution and smoke control in emergency rescue stations of a slope railway tunnel with semi-transverse ventilation. Tunn. Undergr. Space Technol. 2020, 106, 103616. [Google Scholar] [CrossRef]
- Vauquelin, O. Experimental simulations of fire-induced smoke control in tunnels using an “air–helium reduced scale model”: Principle, limitations, results and future. Tunn. Undergr. Space Technol. 2008, 23, 171–178. [Google Scholar] [CrossRef]
- Lönnermark, A.; Ingason, H. Gas temperatures in heavy goods vehicle fires in tunnels. Fire Saf. J. 2005, 40, 506–527. [Google Scholar] [CrossRef]
- Lönnermark, A.; Ingason, H. Fire Spread and Flame Length in Large-Scale Tunnel Fires. Fire Technol. 2006, 42, 283–302. [Google Scholar] [CrossRef]
- Li, M.; Qiang, Y.; Wang, X.; Shi, W.; Zhou, Y.; Yi, L. Effect of Wind Speed on the Natural Ventilation and Smoke Exhaust Performance of an Optimized Unpowered Ventilator. Fire 2022, 5, 18. [Google Scholar] [CrossRef]
- Zhao, P.; Yuan, Z.; Yuan, Y.; Yu, N.; Yu, T. A Study on Ceiling Temperature Distribution and Critical Exhaust Volumetric Flow Rate in a Long-Distance Subway Tunnel Fire with a Two-Point Extraction Ventilation System. Energies 2019, 12, 1411. [Google Scholar] [CrossRef] [Green Version]
- Tang, F.; Mei, F.Z.; Wang, Q.; He, Z.; Fan, C.G.; Tao, C.F. Maximum temperature beneath the ceiling in tunnel fires with combination of ceiling mechanical smoke extraction and longitudinal ventilation. Tunn. Undergr. Space Technol. 2017, 68, 231–237. [Google Scholar] [CrossRef]
- Tang, F.; Chen, L.; Chen, Y.; Pang, H. Experimental study on the effect of ceiling mechanical smoke extraction system on transverse temperature decay induced by ceiling jet in the tunnel. Int. J. Therm. Sci. 2020, 152, 106294. [Google Scholar] [CrossRef]
- Tang, F.; Li, L.J.; Mei, F.Z.; Dong, M.S. Thermal smoke back-layering flow length with ceiling extraction at upstream side of fire source in a longitudinal ventilated tunnel. Appl. Therm. Eng. 2016, 106, 125–130. [Google Scholar] [CrossRef]
- Zhu, Y.; Tang, F.; Chen, L.; Wang, Q.; Xu, X. Effect of lateral concentrated smoke extraction on the smoke back-layering length and critical velocity in a longitudinal ventilation tunnel. J. Wind Eng. Ind. Aerodyn. 2020, 207, 104403. [Google Scholar] [CrossRef]
- Wang, J.; Yuan, J.; Fang, Z.; Tang, Z.; Qian, P.; Ye, J. A model for predicting smoke back-layering length in tunnel fires with the combination of longitudinal ventilation and point extraction ventilation in the roof. Tunn. Undergr. Space Technol. 2018, 80, 16–25. [Google Scholar] [CrossRef] [Green Version]
- He, L.; Xu, Z.; Chen, H.; Liu, Q.; Wang, Y.; Zhou, Y. Analysis of entrainment phenomenon near mechanical exhaust vent and a prediction model for smoke temperature in tunnel fire. Tunn. Undergr. Space Technol. 2018, 80, 143–150. [Google Scholar] [CrossRef]
- Jiang, X.; Liu, M.; Wang, J.; Li, K. Study on air entrainment coefficient of one-dimensional horizontal movement stage of tunnel fire smoke in top central exhaust. Tunn. Undergr. Space Technol. 2016, 60, 1–9. [Google Scholar] [CrossRef]
- Tao, L.; Zeng, Y. Effect of single-side centralized exhaust on smoke control and temperature distribution in longitudinal ventilation tunnel fires. Tunn. Undergr. Space Technol. 2022, 119, 104241. [Google Scholar] [CrossRef]
- Tao, L.; Zeng, Y.; Li, J.; Yang, G.; Fang, Y.; Li, B. Study on the maximum temperature and temperature decay in single-side centralized smoke exhaust tunnel fires. Int. J. Therm. Sci. 2022, 172, 107277. [Google Scholar] [CrossRef]
- Yan, Z.; Zhang, Y.; Guo, Q.; Zhu, H.; Shen, Y.; Guo, Q. Numerical study on the smoke control using point extraction strategy in a large cross-section tunnel in fire. Tunn. Undergr. Space Technol. 2018, 82, 455–467. [Google Scholar] [CrossRef]
- Xu, Z.; Yangyang, L.; Rui, K.; Junpeng, G.; Long, Y. Study on the Reasonable Smoke Exhaust Rate of the Crossrange Exhaust Duct in Double-layer Shield Tunnel. Procedia Eng. 2014, 84, 506–513. [Google Scholar] [CrossRef] [Green Version]
- Vauquelin, O.; Mégret, O. Smoke extraction experiments in case of fire in a tunnel. Fire Saf. J. 2002, 37, 525–533. [Google Scholar] [CrossRef]
- Blanchard, E.; Boulet, P.; Desanghere, S.; Cesmat, E.; Meyrand, R.; Garo, J.P.; Vantelon, J.P. Experimental and numerical study of fire in a midscale test tunnel. Fire Saf. J. 2012, 47, 18–31. [Google Scholar] [CrossRef]
- Lin, C.J.; Chuah, Y.K. A study on long tunnel smoke extraction strategies by numerical simulation. Tunn. Undergr. Space Technol. 2008, 23, 522–530. [Google Scholar] [CrossRef]
- Gannouni, S.; Maad, R.B. Numerical study of the effect of blockage on critical velocity and backlayering length in longitudinally ventilated tunnel fires. Tunn. Undergr. Space Technol. 2015, 48, 147–155. [Google Scholar] [CrossRef]
- Tanaka, F.; Kawabata, N.; Ura, F. Smoke spreading characteristics during a fire in a shallow urban road tunnel with roof openings under a longitudinal external wind blowing. Fire Saf. J. 2017, 90, 156–168. [Google Scholar] [CrossRef]
- Halawa, T.; Safwat, H. Fire-smoke control strategies in road tunnels: The effectiveness of solid barriers. Case Stud. Therm. Eng. 2021, 27, 101260. [Google Scholar] [CrossRef]
- Babrauskas, V. Estimating large pool fire burning rates. Fire Technol. 1983, 19, 251–261. [Google Scholar] [CrossRef]
- Yao, Y.; Li, Y.Z.; Ingason, H.; Cheng, X. Numerical study on overall smoke control using naturally ventilated shafts during fires in a road tunnel. Int. J. Therm. Sci. 2019, 140, 491–504. [Google Scholar] [CrossRef]
- Baum, H.R.; Mccaffrey, B.J. Fire Induced Flow Field—Theory and Experiment. Fire Saf. Sci. Proc. Second Int. Symp. 1989, 2, 129–148. [Google Scholar] [CrossRef] [Green Version]
- Ji, J.; Guo, F.; Gao, Z.; Zhu, J. Effects of ambient pressure on transport characteristics of thermal-driven smoke flow in a tunnel. Int. J. Therm. Sci. 2018, 125, 210–217. [Google Scholar] [CrossRef]
- Ji, J.; Tan, T.; Gao, Z.; Wan, H.; Zhu, J.; Ding, L. Numerical Investigation on the Influence of Length–Width Ratio of Fire Source on the Smoke Movement and Temperature Distribution in Tunnel Fires. Fire Technol. 2019, 55, 963–979. [Google Scholar] [CrossRef]
- Ji, J.; Wang, Z.; Ding, L.; Yu, L.; Gao, Z.; Wan, H. Effects of ambient pressure on smoke movement and temperature distribution in inclined tunnel fires. Int. J. Therm. Sci. 2019, 145, 106006. [Google Scholar] [CrossRef]
- Liu, C.; Zhong, M.; Song, S.; Xia, F.; Tian, X.; Yang, Y.; Long, Z. Experimental and numerical study on critical ventilation velocity for confining fire smoke in metro connected tunnel. Tunn. Undergr. Space Technol. 2020, 97, 103296. [Google Scholar] [CrossRef]
- Liang, Q.; Li, Y.; Li, J.; Xu, H.; Li, K. Numerical studies on the smoke control by water mist screens with transverse ventilation in tunnel fires. Tunn. Undergr. Space Technol. 2017, 64, 177–183. [Google Scholar] [CrossRef]
- Chen, L.; Du, S.; Zhang, Y.; Xie, W.; Zhang, K. Experimental study on the maximum temperature and flame extension length driven by strong plume in a longitudinal ventilated tunnel. Exp. Therm. Fluid Sci. 2019, 101, 296–303. [Google Scholar] [CrossRef]
- Tao, L.; Yan, X.; Zhang, Y.; Zeng, Y.; Fang, Y.; Bai, Y. Experimental and numerical study on the smoke and velocity distribution in an extra-long railway tunnel fire. Tunn. Undergr. Space Technol. 2021, 117, 104134. [Google Scholar] [CrossRef]
- Hu, L.H.; Huo, R.; Chow, W.K. Studies on buoyancy-driven back-layering flow in tunnel fires. Exp. Therm. Fluid Sci. 2008, 32, 1468–1483. [Google Scholar] [CrossRef]
- Kunsch, J.P. Critical velocity and range of a fire-gas plume in a ventilated tunnel. Atmos. Environ. 1999, 33, 13–24. [Google Scholar] [CrossRef]
- Ingason, H.; Li, Y.Z. Model scale tunnel fire tests with longitudinal ventilation. Fire Saf. J. 2010, 45, 371–384. [Google Scholar] [CrossRef]
- Ji, J.; Guo, F.Y.; Gao, Z.H.; Zhu, J.P.; Sun, J.H. Numerical investigation on the effect of ambient pressure on smoke movement and temperature distribution in tunnel fires. Appl. Therm. Eng. 2017, 118, 663–669. [Google Scholar] [CrossRef]
- Guo, F.; Gao, Z.; Wan, H.; Ji, J.; Yu, L.; Ding, L. Influence of ambient pressure on critical ventilation velocity and backlayering distance of thermal driven smoke in tunnels with longitudinal ventilation. Int. J. Therm. Sci. 2019, 145, 105989. [Google Scholar] [CrossRef]


| City | Tunnel | Length (km) | Number of Smoke Vents Opened | Distance between Smoke Vent (m) |
|---|---|---|---|---|
| Wuhan | Donghu Tunnel | 7.035 | 4 | 60 |
| Wuhan | Sanyang Road Tunnel | 4.32 | 6 | 60 |
| Wuhan | Qingdao Road Yangtze River Tunnel | 3.44 | 4 | 60 |
| Hangzhou | Qianjiang Tunnel | 4.45 | 6 | 60 |
| Yangzhou | Shouxihu Tunnel | 4.40 | 6 | 60 |
| Shanghai | Shanghai Yangtze River Tunnel | 8.90 | 3 | 60 |
| Test No. | Smoke Vent Number | HRR (MW) | Smoke Exhaust Rate (m3/s) |
|---|---|---|---|
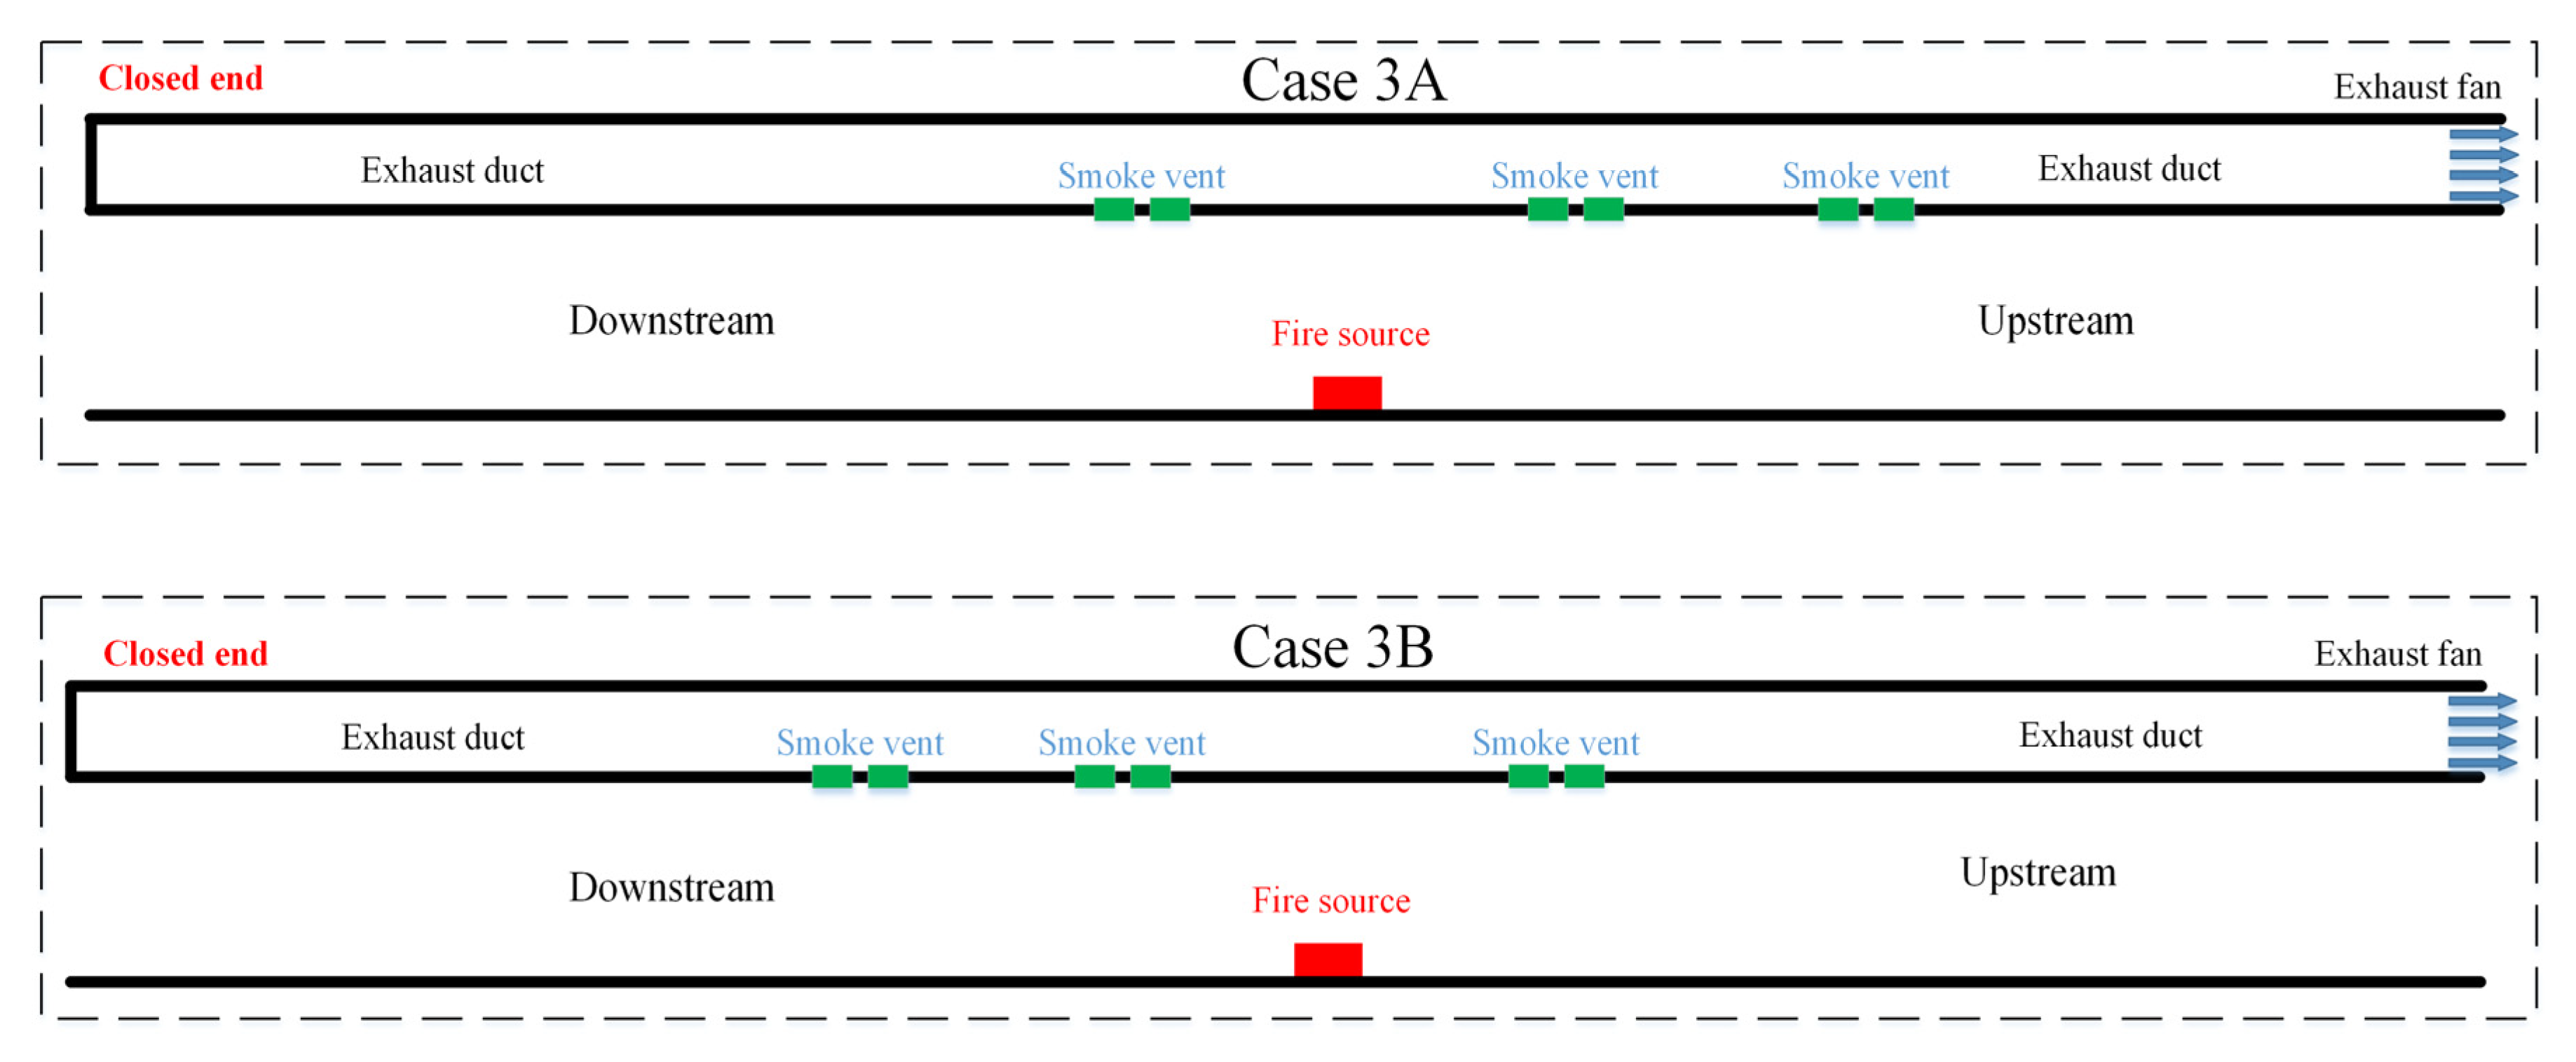
| 1–5 | 3A | 30 | 200, 220, 240, 260, 280 |
| 6–10 | 3B | 30 | 200, 220, 240, 260, 280 |
| 11–15 | 4 | 30 | 200, 220, 240, 260, 280 |
| 16–20 | 5A | 30 | 200, 220, 240, 260, 280 |
| 21–25 | 5B | 30 | 200, 220, 240, 260, 280 |
| 26–30 | 6 | 30 | 200, 220, 240, 260, 280 |
| References | Dimension (m × m) Wide × High | HRR (MW) | Mesh Sizes (m) |
|---|---|---|---|
| Yao [30] | 5 | 5–100 | 0.200 |
| Ji [33] | 5 | 5–15 | 0.200 |
| Liang [36] | 7 | 30 | 0.20 |
| Ji [37] | 5 | 3–15 | 0.167 |
| Guo [38] | 5 | 3–10 | 0.167 |
| Test No. | Smoke Vent Number | HRR (MW) | Smoke Exhaust Rate (m3/s) |
|---|---|---|---|
| 31–35 | 4 | 10 | 100, 120, 140, 160, 180 |
| 36–40 | 20 | 160, 180, 200, 220, 240 |
Publisher’s Note: MDPI stays neutral with regard to jurisdictional claims in published maps and institutional affiliations. |
© 2022 by the authors. Licensee MDPI, Basel, Switzerland. This article is an open access article distributed under the terms and conditions of the Creative Commons Attribution (CC BY) license (https://creativecommons.org/licenses/by/4.0/).
Share and Cite
Tao, L.; Zeng, Y. Effect of Different Smoke Vent Layouts on Smoke and Temperature Distribution in Single-Side Multi-Point Exhaust Tunnel Fires: A Case Study. Fire 2022, 5, 28. https://doi.org/10.3390/fire5010028
Tao L, Zeng Y. Effect of Different Smoke Vent Layouts on Smoke and Temperature Distribution in Single-Side Multi-Point Exhaust Tunnel Fires: A Case Study. Fire. 2022; 5(1):28. https://doi.org/10.3390/fire5010028
Chicago/Turabian StyleTao, Liangliang, and Yanhua Zeng. 2022. "Effect of Different Smoke Vent Layouts on Smoke and Temperature Distribution in Single-Side Multi-Point Exhaust Tunnel Fires: A Case Study" Fire 5, no. 1: 28. https://doi.org/10.3390/fire5010028
APA StyleTao, L., & Zeng, Y. (2022). Effect of Different Smoke Vent Layouts on Smoke and Temperature Distribution in Single-Side Multi-Point Exhaust Tunnel Fires: A Case Study. Fire, 5(1), 28. https://doi.org/10.3390/fire5010028