Abstract
Ventilation velocity conditions may affect the smoke diffusion and evacuation environment in a tunnel fire, which should be fully considered in evacuation spacing designs of undersea tunnels. This study focuses on reasonable evacuation spacing under various possible velocity conditions of an undersea tunnel, providing a design method reference for calculating safe evacuation spacing. Fire Dynamic Simulator and Pathfinder software were used for numerical simulations of a 50 MW fire and evacuation process in a full-scale undersea tunnel with traffic congestion. The simulation cases contained velocity modes from zero to satisfying the critical velocity and evacuation spacings from 30 m to 80 m. The calculated distributions of the available safe escape time indicated that a low ventilation velocity, such as 1.0 m/s, is beneficial to the downstream evacuation, but turning off mechanical ventilation increased risk near the fire source. The required safe escape time is shortened with a reduction in slide spacings, but the shortened rate slowed down after spacing was less than 60 m. In addition, the slow evacuating areas from 100 m to 300 m from the fire source independent of spacing are identified. Ultimately, the reasonable evacuation spacings of 60 m, 50 m, and 30 m, corresponding to three possible ventilation velocity modes of low, medium, and high, are proposed through the comparisons of the distributions of available safe escape time and required safe escape time.
1. Introduction
Underwater tunnels, especially undersea tunnels, are usually considered as essential components in urban traffic engineering due to their heavy traffic volumes, complex vehicle composition, obvious slope, and consequent high fire risk with complicated heat transfer [1] and, hence, mostly have larger scales as well; thus, the shield method is widely used in their construction. Moreover, fewer installations of transverse passages and escape shafts in undersea tunnels [2] are harmful to fire evacuation safety because of the limitations of the structure and internal space. Therefore, reasonable design alternatives for ventilation and evacuation are promising steps to reduce initial and operational costs and to improve the long-term operational performance for undersea tunnels [3].
The high construction cost of evacuation passages and smoke vents for an undersea tunnel is attributed to the complex geological environment; thus, full jet longitudinal ventilation and longitudinal evacuation with bottom passage are adopted in a large proportion of undersea tunnels. Unlike the transverse evacuation method using cross passages or using a parallel escape tunnel between two tunnels, longitudinal evacuation is possible with simple construction and low cost. One only needs to install evacuation slides or stairs at a reasonable spacing inside the tunnel to connect the upper space and the bottom passage, avoiding adding auxiliary facilities outside. Related simulation work [4] found that the evacuation spacing of longitudinal evacuation was 150~200 m shorter than that of transverse evacuation on the conditions of equivalent evacuation capacity and satisfying evacuation safety. The denser evacuation spacing means that more evacuation slides (stairs) need to be built, which requires a balance between engineering economy and evacuation safety. A basic principle for ensuring life safety in tunnel fires is that the available safe escape time (ASET) is greater than the required safe escape time (RSET) by an adequate safety margin [5]. Too large a spacing may mean that the RSET does not satisfy evacuation safety, while too small a spacing leads to an excessive safety margin and a high engineering cost. Thus, reasonable evacuation spacing designs are crucial to balance economy and safety.
A lack of consistent standards is a threat to reasonable fire evacuation design for undersea tunnels. Fire smoke is the biggest threat to the people trapped [6], and longitudinal ventilation velocity can significantly affect the hazard level of the smoke environment and then affect the ASET. The high-velocity mode is recommended by the Chinese design standard for ventilation of highway tunnels [7] for the operation of fire ventilation in tunnels with one-way traffic; i.e., the longitudinal ventilation velocity is equal to or greater than the critical velocity (vc) to eliminate the smoke back-layering occurring in the tunnel. The related design standards of Germany, France, Switzerland, Austria [8,9] and the Permanent International Association of Road Congress (PIARC) [10] proposed that the low-velocity mode could be adopted in the self-evacuation phase after fire, which requires the longitudinal velocity to be far lower than vc in order to maintain the stability of smoke stratification downstream of the fire source. In the meanwhile, various perspectives have been presented by other authors, including Xue et al. [11], who recommended that the ventilation velocity should be lower than or close to vc. Hu [12] and Guo et al. [13] suggested using stratified velocity and constrained velocity, respectively. Liu [14] suggested that the velocity should be regulated below 1.0 m/s. Chen et al. [2] posited that mechanical ventilation should be turned off during evacuation. Jan et al. [15] and Espinosa et al. [16] believed that using two-stage ventilation (low velocity to high velocity) is more conducive to smoke control and evacuation in undersea tunnel fires. In other words, during the ventilation control stage of a tunnel fire, the decision makers or control system may use any velocity modes based on the judgment of fire scenes to achieve different requirements, such as ensuring no smoke in upstream rescue routes, or maintaining the downstream smoke stratification as much as possible, or using a combination of these methods. Fully considering the possible ventilation conditions is very meaningful for evacuation spacing design. Yin et al. [17] considered the ineffective and effective situations of exhaust, then proposed a safety spacing of 50 m and 75 m accordingly, by calculating the ASET distributions of two conditions. In most previous studies of evacuation spacing design, however, empirical fixed values of ASET were usually used to simplify the calculation, ignoring the influence of the possible conditions of ventilation velocity on the distribution of ASET. Yuan et al. [18] experimented and calculated the evacuation process of an undersea tunnel with longitudinal bottom evacuation, referring to the empirical value 360 s of ASET, and proposed that the reasonable value of evacuation interval was 64.3 m. Zhang et al. [19] and Shen et al. [20] put forward a reasonable slide spacing of 80 m for different undersea tunnels in Chittagong and Hangzhou by using ASET values of 900 s and 600 s, respectively, according to engineering experiences. Hui et al. [21] used an ASET value of 480 s and recommended a slide spacing of 45 m. The conclusions of the above studies were not comprehensive, which indicates the limitations of using empirical fixed values. Reasonable evacuation spacing designs need to rely more on accurate analyses of ASET distributions. Thus, it is necessary to take into account the dynamic distribution of ASET in different ventilation velocity conditions of tunnel fire and make corresponding design suggestions.
The present study concentrated on the reasonable evacuation spacings of undersea tunnels in possible longitudinal ventilation conditions. The ventilation and smoke diffusion of tunnel fire were dynamically simulated by FDS(V6). The effects of five typical ventilation velocities of four velocity modes ranging from 0 m/s to satisfying vc on ASET distributions were investigated, and the RSET distributions were calculated through the simulations of evacuation processes in six spacings by Pathfinder software. Ultimately, design suggestions of reasonable spacings in different ventilation velocities that satisfy evacuation safety requirements were put forward through the comparative analysis of ASET with RSET, thereby providing a design method reference for calculations of evacuation spacing in undersea tunnels.
2. Numerical Modeling
2.1. Tunnel Descriptions
2.1.1. Tunnel Configuration
A medium-length, double-hole undersea tunnel, built using tunneling shields in the city of Macao, was selected in this study. The tunnel is a one-way, two-lane tunnel with a shield part 1000 m long, 12 m wide, and 8 m high, in the shape of a horseshoe for the space above the road with a sectional area of 71.7 m2, without cross passages between the two tunnel holes. The road near the inlet and the outlet is sloped. The schematic diagram of the shield part of the tunnel is shown in Figure 1, where Y = 0 m denotes the entrance of the shield part, while Y = 1000 m denotes the exit of the same.
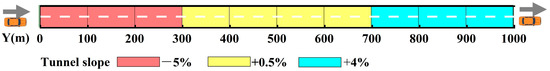
Figure 1.
Schematic diagram of the shield part of the tunnel.
2.1.2. Ventilation Conditions
The tunnel adopts a full-jet longitudinal ventilation system. To focus on the influence of ventilation velocity conditions on ASET, only the velocity value was considered, and other factors affecting smoke diffusion were ignored. Due to the large range of possible ventilation velocities in actual situations of tunnel fire, extensive selections of velocity conditions would make the total workload too large. Therefore, the ventilation velocity was simply divided into several modes, and the typical velocity values of each mode were set according to the ventilation velocity studies mentioned above. The velocity modes include “turn off mechanical ventilation,” “low-velocity,” “medium-velocity,” “high-velocity (close to the critical velocity vc),” and “high-velocity (satisfying the critical velocity vc)”. Typical velocity values are shown in Table 1, which are the average air velocities in the tunnel after the stable operations of jet fans.

Table 1.
Different velocity modes and values in tunnel fire.
2.1.3. Evacuation Conditions
The tunnel adopts a longitudinal evacuation method with a bottom passage linked by evacuation slides. Evacuation slides are installed from the middle position (Y = 500 m) to both sides of the tunnel equidistantly. According to the engineering experience range of slide spacing in tunnels, six schemes of different slide spacings from 30 m to 80 m were proposed, as shown in Table 2. The priority was to satisfy the evacuation spacings in the middle of the tunnel. Due to the high evacuation capability at the entrance and exit of the tunnel, the spacing between the slides on the edge and the entrance (exit) is slightly larger.
Table 2.
Schemes of tunnel slide spacing.
2.2. Modeling and Validation
2.2.1. Physical and Mathematical Model
A full-scale 3D model of the tunnel was constructed by PyroSim software and simplified vehicle entities in the whole tunnel were built to correspond to reality situations, as shown in Figure 2. The calculation kernel of PyroSim is based on FDS (version 6.7.5), developed by the National Institute of Standards and Technology (NIST). FDS numerically solves a form of the Navier–Stokes equations appropriate for low speeds (Ma < 0.3), thermally driven flow with an emphasis on smoke and heat transport from fires [22].
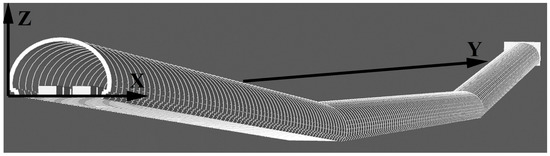
Figure 2.
Schematic diagram of the full-scale 3D physical model of tunnel.
In order to highlight the influences of ventilation velocity on smoke diffusion and ASET distributions, parameters such as installation position and the start sequence of the fans are ignored. The airflow of each ventilation condition was provided by the air-supply surface of constant flow outside the tunnel entrance, and the feasibility refers to the experimental studies of Tang et al. [23] and Chow et al. [24]. ASET is defined as the time interval between the time of ignition and the time passengers are estimated to be incapacitated [25], and it is also the tenability limit calculated depending on the hazard evaluation of the smoke environment. Carbon monoxide (FEDCO), cumulative heat (FEDheat), the temperature of convective heat (Temp), and evacuation visibility (Vis) were used as indexes to calculate ASET in this study, as shown in Table 3.
Table 3.
Calculation index of available safe escape time (ASET).
We used a visibility threshold of 3 m because of the dense slides in the bottom evacuation mode. Most of the passengers could quickly reach the vicinity of the evacuation slide before the visibility drops significantly, and then they can keep evacuating until they would turn back than rather enter the smoke.
The sensors and slices were set up to obtain the CO concentration, temperature, air velocity, and visibility data of the evacuation space for monitoring ambient air velocity and recording data for the above indexes. The 2 m height of installed sensors was based on the range of evacuating activity, considering taller individuals, and leaving a safety margin to ensure that smoke hazards would not be underestimated. The sensors and slices for simulation are shown in Table 4.
Table 4.
Sensors and slice settings.
The initial parameters of model boundary conditions were set as follows:
- (1)
- In the initial stage, the pressure inside the tunnel was P = 101 kPa, each velocity component was zero, and the air temperature was T = 20 °C;
- (2)
- Walls and pavements were concrete adiabatic surfaces without internal heat sources and a friction coefficient λ = 0.02;
- (3)
- The surface of the retained vehicle in the tunnel was adiabatic;
- (4)
- Tunnel exits and entrances were open surfaces, with pressure exits connected to the atmosphere.
The computational domain of the model was made up of 15 adjacent linked meshes and covers the entire tunnel. To shorten the simulation time, multi-core parallel computing of a single CPU was carried out. The grid and simulation settings are shown in Table 5.
Table 5.
Grid and simulation settings.
Pathfinder software, which has been commonly used in the field of fire evacuation [29,30], was used to construct the evacuation model in this study and was used in steering mode to consider the passenger collisions [31]. According to the traffic flow data that will be mentioned in Section 2.2.2, assuming that all blocked vehicles are randomly distributed and the distance between vehicles is 1 m, a total of 310 vehicles and 1870 passengers could possibly be trapped in the tunnel. The average shoulder width of passengers was set to 0.5 m, in line with the relevant fire safety standard. Evacuation slides on the side walls of the tunnel were simplified as doors to the outside. In addition, passengers could flexibly choose to evacuate from the evacuation slide or tunnel entrance according to the distance or flow without crossing the fire source. The partial evacuation model is shown in Figure 3. The white closed lines denote vehicle outlines, the green points denote passengers, and the short green line below denotes an evacuation slide.

Figure 3.
Partial view of evacuation model.
2.2.2. Operation Modes and Fire Scenarios
Traffic Modes
As an extremely unfavorable situation that may occur, the condition of traffic congestion in the entire tunnel was assumed in this study. In this case, the number of vehicles and the number of people to be evacuated are the largest. The traffic composition of the tunnel, as shown in Table 6, was based on the vehicle-type distribution data of the roads near the tunnel, which were obtained on the Macau DSAT traffic video monitoring platform (http://www.dsat.gov.mo, accessed on 15 August 2021), and the average passenger number of each vehicle was assumed from experience data.
Table 6.
Traffic composition of tunnel.
Evacuation Modes
The evacuation process can be divided into two parts, the ready process and the travel process, which could be reflected in the composition of RSET. RSET is defined as the calculated time period required for an individual passenger to travel from their location at the time of ignition to a safe refuge or place of safety [25], which consists of the detect time, alarm time, pre-travel activity time, and travel time, as shown in Figure 4. For simplicity, the ready time (RT) is considered to be the time period required for the ready process.
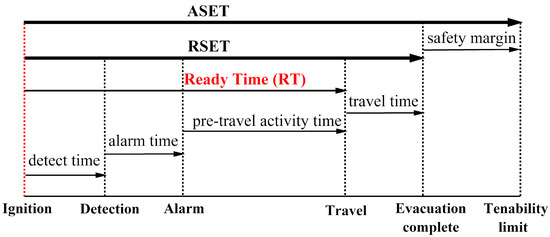
Figure 4.
The relationship between the available safe escape time (ASET) and the required safe escape time (RSET) in evacuation process.
In the design stage, it is difficult to determine a clear safety margin, so the basic requirement ASET ≥ RSET was used as the safe evacuation condition, which was also adopted in the research of Song et al. [32], and Zhang et al. [33]. During the ready process, passengers close to the fire will start traveling immediately after the ignition, and RT is zero. However, passengers far from the fire need to wait for the arriving crowd or the ringing alarm to begin to move; similar to a domino effect, their RT goes up because the moving crowd or diffusing smoke will prompt others to realize the risk. Considering the prompt effect of smoke diffusion and crowd movement on evacuation, the RT was set according to the distance from the fire source, as shown in Table 7.
Table 7.
RT of evacuation in different distance from the fire source.
The maximum walking speed of passengers may undergo complex changes influenced by the smoke environment and psychological fluctuation during the travel process, which is not the focus of this article. To simplify this, referring to the study of Shen et al. [20], Seike et al. [34], and the average walk speed given by PIARC [35], the maximum values of walking speed were set as 1.0 m/s in the horizontal part and 0.8 m/s in the slope part, which represent a low level in adverse situations and make sure that the RSET calculations would not be underestimated. The evacuation capacity of each slide was set as 24 person/min, referencing the experimental and simulation research data from Xie et al. [36], Zhang et al. [37], and Cao [38]. There is no upper limit for the evacuation capacity of the tunnel’s entrance and exit.
Fire Scenarios
It is reasonable to assume that the cause of the tunnel fire is a heavy goods vehicle (HGV) accident, considering that this type of accident is responsible for the highest proportion of vehicle fire accidents in China [39]. Additionally, the accident in the Mont Blanc tunnel can also prove the serious consequences of HGV fires [40]. The peak heat release rate (HRR) of the fire was set as 50 MW in accordance with [41]. The fire growth category was defined as ultra-fast (coefficient α = 0.18), increasing by the function t2; HRR peaks at 530 s after the fire. The accident HGV was located in the center of the tunnel at X = 6 m, Y = 500 m. To lower the impact of fire scale changes on ASET, fire spread between vehicles was not considered. The model of the fire source used a burner surface with a size of 1 m × 2 m (X × Y) and 1 m above the road, which was consistent with the HGV carriage location. The combustion of the fire was specified as polystyrene (PS), which is a widely used insulation material. The byproduct parameters including the soot yield and the CO yield were specified as 0.16 and 0.06, respectively, drawing on the empirical data [42].
2.2.3. Grid Independence Verification and Model Validation
Grid Independence Verification
Grid independence verification was performed to evaluate the dependency of fire simulation results pertaining to the size and number of grids. Appropriate grid size can be accessed by the dimensionless expression / [22], where is the grid size (m), and is the characteristic diameter of the fire source (m), as shown in Equation (1). For accurate simulation results to be obtained, it is recommended that be between 4 and 16.
Here, is the peak heat release rate of fire (kW); is the ambient air density (kg/m3); is the ambient air specific heat (kJ/(kg·K)); is the ambient air temperature (K); and is the gravity acceleration (m/s2).
of the 50 MW fire was calculated to be 4.6 m, so the grid size should be between 0.3 m and 1.1 m. The results of independent verification for different grid sizes are compared in Table 8. The absolute percentage errors (APE) of temperature values on both sides of the fire source were calculated, with the temperature detection points set at positions of 7.5 m height from the road and along the central axis in the Y direction. The APE was less than 1.8% between the 0.4 m grid and the 0.3 m grid. There was no significant difference in temperature distributions if the grid size was less than 0.4 m, so it was acceptable to use a 0.4 m grid size for the model of the tunnel fire in Section 3.1. In addition, it could be found that a more accurate description of the fire plume can be obtained by using a smaller grid size near the fire source, such as 0.2 m, and a significantly increased computation time. Considering that its effect on the smoke parameters in the entire tunnel is very small, for the purpose of this work, did not use dense grids near the fire source.
Table 8.
Independent verification of grid size.
Model Validation
Since it is difficult to find experimental works with a similar fire scale and similar tunnel structure to this work, to verify the reliabilities of the simulation software and the grid calculation method in this study, using the same method of modeling, boundary condition setting, and grid calculating, to simulate a 0.75 MW combustion experiment in an 88 m-long channel carried out by Hu et al. [43]. The full-scale FDS model included the same tunnel structure, fire location, HRR, and the same sensor placements. The purpose of this section is to prove the feasibility of the software and modeling methods used, rather than to completely replicate the experiment, so the byproduct parameters related to the fuel type are ignored, and only the ceiling temperature data from the simulation and the experiment were compared. The ceiling temperature can comprehensively reflect the smoke diffusion and heat transfer process, and it can be regarded as a characteristic parameter for evaluating similar combustions. The ceiling temperature distributions within 80 m of the fire source were compared, as shown in Figure 5. The simulated data by FDS are represented by the red line, and the experimental data from Hu et al. are shown as black cubes.
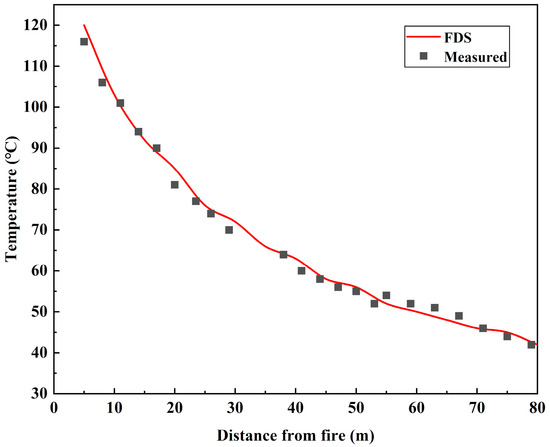
Figure 5.
Comparison of temperature distributions between simulation and experiment.
It could be found that the distribution data simulated by FDS were highly coincident with the experimental measurement data, with the 2.5% mean absolute percentage error (MAPE), proving that the grid calculation methods and the FDS simulation used above are reliable. The reliability of the model mentioned in Section 3.1 was demonstrated.
3. Result and Discussion
3.1. Longitudinal Ventilation Velocity vs. Available Safe Escape Time
The influence of longitudinal ventilation velocity on ASET was discussed in this section. Distributions of ASET and back-layering length (BLL) at different longitudinal ventilation velocities of 0 m/s, 1.0 m/s, 2.0 m/s, 4.5 m/s, and 6.0 m/s are shown in Figure 6. The following results were obtained:
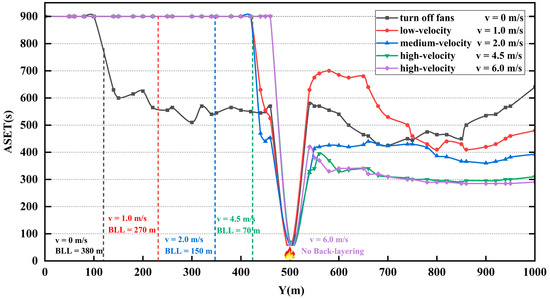
Figure 6.
Distribution of ASET and back-layering length (BLL) at different longitudinal ventilation velocity (v).
- (1)
- The risk of the smoke environment in the downstream tunnel is higher than that in the upstream tunnel. In the case of turning on mechanical ventilation, the average ASET values downstream (Y > 500 m) of the fire source were significantly lower than those upstream (Y < 500 m), with a reduction of 21% to 65% at the identical ventilation velocity. In the case of turning off the mechanical ventilation, it could be seen that the distribution of upstream and downstream ASET was not symmetrical. The reason for this is that the slopes of this tunnel are different on both sides of the tunnel, and the hot pressure releases preferentially by the exit of the downstream tunnel due to different chimney effects. Thus, the diffusion range of upstream smoke was small and the upstream ASET distribution was higher.
- (2)
- Turning off the mechanical ventilation increases the environmental risk on both sides of the fire source compared with the low-velocity mode of 1.0 m/s. If the ventilation velocity is 0 m/s, the ASET values in the area of 250 m upstream and downstream of the fire source will be substantially lower than that at the velocity of 1.0 m/s. This might be because the high concentration of smoke accumulated near the fire source, resulting in a rapid decline of visibility, due to the lack of airflow control, which hampers the upstream rescue, so it is not recommended. In addition, without the cooling effect of ventilation, airflow may also cause the excessive temperature at the ceiling, which may damage the tunnel structure.
- (3)
- Higher ventilation velocities increased the evacuation risk compared with the low-velocity mode of 1.0 m/s. Although the BBL of 1.0 m/s velocity was the longest, it has almost no threat to upstream passengers, which is reflected in the ASET, because the back-layering with low concentrations did not sink into the evacuation space. The higher the ventilation velocity, the lower the distributions of ASET. For the low-, medium-, and high-velocity modes, the average ASET value decreased by 8% to 25% for each 1 m/s increase in ventilation velocity. The ASET value decreased slightly and tended to be constant in the process of velocity increases from 4.5 m/s to 6.0 m/s, which was almost the lowest distribution of ASET. It can be inferred from the above that the lower ASET value at a higher ventilation velocity might be related to the destruction of smoke stratification. To prove this hypothesis, the time of smoke sinking into the evacuation space of 2 m height from the road within 150 m downstream of the fire source at longitudinal ventilation velocities of 0 m/s, 1.0 m/s, and 2.0 m/s is illustrated in Figure 7. The stratification was not affected by ventilation airflow at a velocity of 0 m/s. Although accurately figuring out the duration of stable smoke stratification was difficult, it was straightforward to see the relationship between stratification and velocity. The average times for smoke flow sinking into the evacuation space of 1.0 m/s and 2.0 m/s velocities were 67% and 41% of the average time at the velocity of 0 m/s. With the increase in velocity, the smoke stratification downstream was more unstable due to more airflow disturbances and would sink into the evacuation space earlier. The sinking smoke would bring heat, CO, and low visibility to passengers, and result in low ASET values.
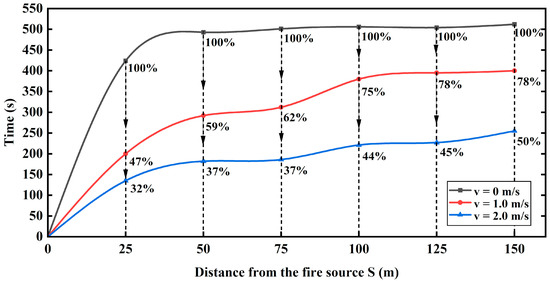 Figure 7. Time of downstream smoke sinking into evacuation space (within 2 m height from the road) after ignition.
 - (4)
- The computation of ASET mainly depends on high convective heat and low visibility. In the process of selecting the index that first reached the threshold value to compute the ASET, it was found that the temperature index close to the fire source first reaches its threshold value, and the rapid reduction in visibility is the primary threat faced by passengers in other places, which is also consistent with the conclusion of Gehandler et al. [44]. Take a ventilation velocity of 2 m/s as an example, as shown in Figure 8. In addition, the heat and CO from hot toxic smoke are not the key factors for determining ASET, because they reach the threshold very slowly due to the action of buoyancy and ventilation airflow.
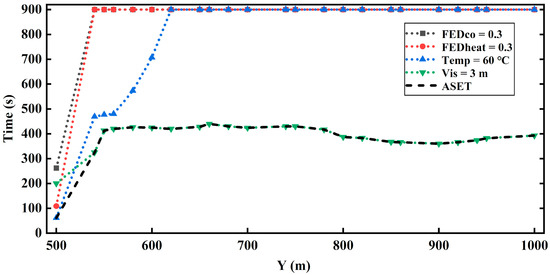 Figure 8. The downstream ASET distribution and the time when FEDCO, FEDheat, temperature, and visibility indexes reach the threshold at the velocity of 2.0 m/s.
3.2. Evacuation Slides Spacing vs. Required Safe Escape Time
The influence of spacing and number of evacuation slides on RSET in different longitudinal ventilation velocities are discussed in this section. The RSET distributions on both sides of the fire source were similar because slides were symmetrically installed. The RSET distributions under conditions of different slide spacings (D) are shown in Figure 9. The RSET distributions of the downstream tunnel (Y > 500 m) when using different D values from 30 m to 80 m are shown as Curve 1, and the red dots denote the RSET values near the evacuation slides. The variation in the longest evacuation times for the entire tunnel (the max RSET values in Curve 1 for increasing D) are recorded as Curve 2.
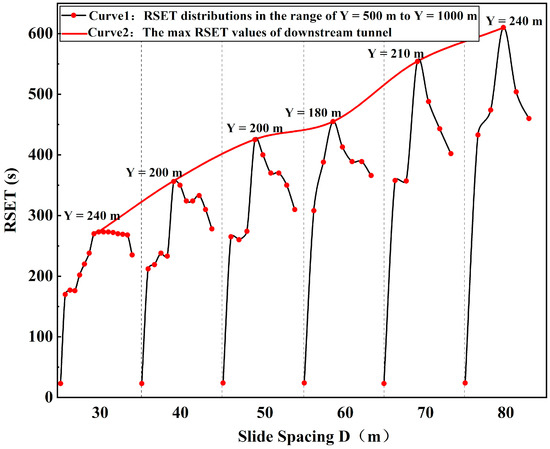
Figure 9.
RSET distributions in conditions of different slide spacing (D).
It could be found that with the decrease in slide spacing D, the downstream RSET showed a nonlinear downward trend, and the inflection point might be at D = 60 m. To be specific, as D reduced from 80 m (total 11 slides) to 60 m (total 15 slides), the max RSET value shortened by 39 s for each additional slide. As D continued reducing from 60 m to 30 m (total 31 slides), the max RSET value shortened 11 s for each additional slide, and the shortened time was only 28% of the former. This indicated that the effect of decreasing RSET by further reducing the evacuation slide spacing (increasing the number of slides) is weakened after D is less than 60 m. It could also reflect the fact that the cost-effectiveness of installing slides declines after the slide spacing is less than 60 m.
Further, to identify the slow evacuating area and the high-risk area of the tunnel, the tunnel was longitudinally divided into five areas, I, II, III, IV, and V, by the distance from the fire source. Each area had two parts, including a 100 m upstream part and a 100 m downstream part, as shown in Table 9. Taking the low-velocity ventilation mode as an example, the comparison of RSET distributions with the ASET distribution at the velocity of 1.0 m/s is shown in Figure 10. The ASET curve is the actual ASET distribution of the tunnel; the average ASET curve is the average ASET value in each part, which roughly reflects the overall situation in the part. The RSET curve represented the variation of the maximum RSET values when D increased from 30 m to 80 m in each part, the leftmost point represented the condition of D = 30 m, and each RSET value belonged to the passenger with the longest evacuation time in each part.
Table 9.
Area-dividing method.
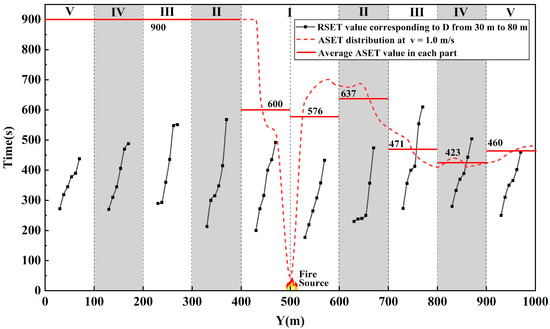
Figure 10.
ASET compared with RSET corresponding to different D under the condition of v = 1.0 m/s.
As can be seen in Figure 10, the slow evacuating areas were II and III, independent of the value of D. The slow evacuating areas had a larger overall RSET value than other areas, which was always from 100 m to 300 m from the fire source. It could also be proved by Figure 9 that with the increasing distance from the fire source, the RSET value firstly increased and then decreased, and the extreme point was always in these areas. The main reason for this was that passengers in area I had a shorter RT and the crowd moved earlier to both sides of the tunnel after ignition. This increased the evacuation pressure on areas II and III, but this effect gradually reduced in areas IV and V far from the fire source.
The high-risk evacuating areas were the downstream parts of III and IV when D ≥ 70 m. Figure 10 shows that in the downstream parts of 200 m to 400 m from the fire source, the average ASET values were lower than the RSET values under conditions of D = 70 m and D = 80 m. However, with the change in ventilation velocity and ASET distributions, the high-risk areas expand. It could be stated at least that areas III and IV were always in danger when D ≥ 70 m, regardless of the ventilation velocity because the ASET distributions of other velocities were all lower than that of 1 m/s, as shown in Figure 6.
To explore the reasonable D in conditions of different ventilation velocities that could possibly occur, the downstream ASET distributions of the low-velocity mode, medium-velocity mode, and high-velocity mode were compared with the downstream RSET distributions of different evacuation spacing Ds from 30 m to 70 m, as shown in Figure 11. The RSET columns recorded the longest evacuation time of each slide, and the evacuation assessments near the evacuation slides represented the worst situation of the entire tunnel. If the ASET distribution of one velocity mode was always higher than the RSET value of one spacing D at any position, it could be considered that the evacuation process was secure, and the maximum D value satisfying the above requirement was the reasonable evacuation spacing of that velocity mode.
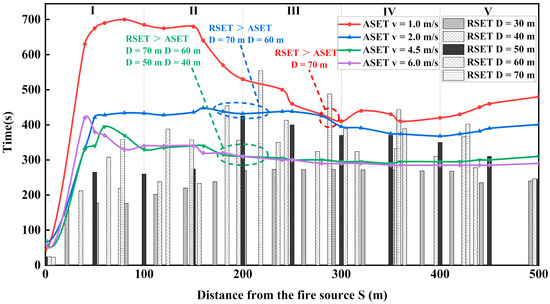
Figure 11.
Comparison of RSET of different D with ASET of different velocities in the downstream area of fire source within 500 m.
Further, to quantify the safety of each evacuation schemes, Table 10 counts the number of trapped people (among the total of 1870 passengers involved) corresponding to different evacuation spacings under possible ventilation modes. The trapped passengers are located in the position where ASET is less than RSET, as shown in Figure 11. The relative value of the number of trapped passengers can also be reflected by the difference value of time. In each velocity mode, as the evacuation spacing shortens, the number of trapped passengers gradually decreases. Under the same evacuation spacing scheme, the number of trapped passengers is ranked as: low-velocity mode < medium-velocity mode < high-velocity mode, which can indicate that using the low-velocity mode is beneficial to safe evacuation. Specifically, the reasonable slide spacing should not be larger than 60 m if using the low-velocity ventilation mode of 1.0 m/s, it should not be larger than 50 m if using the medium-velocity mode of 2.0 m/s, and should not be larger than 30 m if using the high-velocity mode above 4.5 m/s. The reasonable spacings recommended above do not represent the accurate value but only acceptable ranges. This is because the difference between the evacuation spacing schemes selected in this study is 10 m, which conforms to the general engineering design accuracy.
Table 10.
Number and location of trapped passengers under different evacuation spacings.
4. Conclusions
The reasonable evacuation spacings of undersea tunnels in possible longitudinal ventilation conditions were researched in this work. FDS and Pathfinder were used for fire and evacuation simulations of a 50 MW fire in a full-scaled tunnel with traffic congestion. The effects of five typical ventilation velocities on ASET distributions and the effects of six evacuation spacings on RSET distributions were analyzed. From comparisons of the ASET with RSET, design suggestions were provided for evacuation slide spacing in undersea tunnels. In addition, the safe velocity modes of tunnel fire were proposed and the slow and high-risk areas for evacuation were identified. The conclusions are as follows:
- (1)
- The low-velocity mode is a safer ventilation mode for downstream evacuations, such as 1.0 m/s used in this work. Turning off mechanical ventilation increases the environmental risk on both sides of the fire source and hampers the upstream rescue, so it is not recommended. Using a higher velocity increases the environmental risk downstream of the tunnel due to the destruction of smoke stratification.
- (2)
- RSET decreases as the slide spacing D shortens; after D < 60 m, the decreasing rate is reduced from 39 s per additional slide to 11 s per additional slide. This leads to a decline in the cost-effectiveness of shortening evacuation time by adding slides.
- (3)
- When using the low-velocity mode of 1.0 m/s, medium-velocity mode of 2.0 m/s, or high-velocity mode above 4.5 m/s in a tunnel fire, the respective reasonable evacuation spacings D should not be larger than 60 m, 50 m, and 30 m.
- (4)
- The slow evacuating areas were always from 100 m to 300 m from the fire source and were independent of the slide spacing D. If D ≥ 70 m, the downstream parts 200 m to 400 m from the fire source are always high-risk areas, independent of the ventilation velocity modes.
The ventilation velocity mode recommendation and the suggestions of reasonable evacuation spacings are based on the tunnel fire scenario assumed in this article. The conclusion provides design ideas for related projects, and it could be suitable for the evacuation designs of other tunnel projects by changing the parameters of tunnel model structure, traffic conditions, or fire scale. The limitations of the above work are that only a 50 MW fire of one typical undersea tunnel was simulated by a numerical method, for other scale fires such as a larger HRR, the corresponding ventilation velocity ranges, smoke hazards, and evacuation spacings may be different; these need to be reasonably calculated and extended to general cases, and the ventilation velocity was assumed to be the only factor affecting ASET. In addition, the coupled calculation method of fire and evacuation was not used; only the minimum margin of the safety evacuation methodologies was, which is ASET ≥ RSET. Different tunnel scenarios and fire scales with the influence of installation locations and the fan active time on ASET will be considered in future work. Experimental verification will be added as possible.
Author Contributions
Conceptualization, W.N. and C.C.; methodology, W.N. and C.C.; software, C.C.; validation, W.N. and C.C.; formal analysis, W.N. and C.C.; resources, W.N.; data curation, C.C.; writing—original draft preparation, C.C.; writing—review and editing, W.N.; visualization, W.N. and C.C.; supervision, W.N.; project administration, W.N.; funding acquisition, W.N. All authors have read and agreed to the published version of the manuscript.
Funding
This research was supported by the Beijing Natural Science Foundation (No. 9222009) and the Beijing Social Science Foundation (No. 20GLB025).
Institutional Review Board Statement
Not applicable.
Informed Consent Statement
Not applicable.
Data Availability Statement
Not applicable.
Conflicts of Interest
The authors declare no conflict of interest.
References
- Huo, Y.; Gao, Y.; Chow, W.K. A study on ceiling jet characteristics in an inclined tunnel. Tunn. Undergr. Space Technol. 2015, 50, 32–46. [Google Scholar] [CrossRef]
- Chen, H.; Chen, J.Z.; Tan, J.Q.; Zhang, J.Q. Intelligent Ventilation and Emergency Evacuation of Underwater Tunnel under fire Conditions. Procedia Eng. 2016, 166, 379–388. [Google Scholar] [CrossRef]
- Chow, W.K.; Li, J.S. Case study: Vehicle fire in a cross-harbour tunnel in Hong Kong. Tunn. Undergr. Space Technol. 2001, 16, 23–30. [Google Scholar] [CrossRef]
- Xu, Y.; Liao, S.M.; Liu, M.B. Simulation and Assessment of Fire Evacuation Modes for Long Underwater Vehicle Tunnels. Fire Technol. 2018, 55, 729–754. [Google Scholar] [CrossRef]
- ISO/TR 16738:2009(E); Fire-Safety Engineering—Technical Information on Methods for Evaluating Behavior and Movement of People. Technical Report for International Organization for Standardization; ISO: Geneva, Switzerland, 2009. Available online: https://www.iso.org/standard/42887.html (accessed on 10 March 2022).
- Ji, J.; Guo, F.Y.; Gao, Z.H.; Zhu, J.P. Effects of ambient pressure on transport characteristics of thermal-driven smoke flow in a tunnel. Int. J. Therm. Sci. 2018, 125, 210–217. [Google Scholar] [CrossRef]
- JTG/T D70/2-20-2014; Guidelines for Design of Ventilation of road Tunnel. Ministry of Communications of the People’s Republic of China: Beijing, China, 2014.
- Sturm, P.; Beyer, M.; Rafiei, M. On the Problem of Ventilation Control in Case of a Tunnel Fire Event. Case Stud. Fire Saf. 2017, 7, 36–43. [Google Scholar] [CrossRef] [Green Version]
- Frey, S.; Lempp, M.; Zimmermann, C. Aspects of longitudinal airflow control in road tunnels. In Proceedings of the Virtual Conference Tunnel Safety and Ventilation 2020, Graz, Austria, 1–3 December 2020. [Google Scholar]
- Technical Committee 3.3 Road Tunnel Operation. Report 2011R02 Road tunnels: Operational Strategies for Emergency Ventilation; PIARC: Paris, France, 2011; pp. 41–47. ISBN 2-84060-234-2. [Google Scholar]
- Xue, H.; Chew, T.C.; Tay, K.L.; Cheng, Y.M. Control of Ventilation Airflow for Tunnel Fire Safety. Combust. Sci. Technol. 2000, 152, 179–196. [Google Scholar] [CrossRef]
- Hu, X.Q. Numerical study of the effects of ventilation velocity on peak heat release rate and the confinement velocity in large tunnel fires. Saf. Sci. 2021, 142, 105359. [Google Scholar] [CrossRef]
- Guo, Y.H.; Yuan, Z.Y.; Yuan, Y.P.; Cao, X.L.; Zhao, P. Numerical simulation of smoke stratification in tunnel fires under longitudinal velocities. Undergr. Space 2021, 6, 163–172. [Google Scholar] [CrossRef]
- Liu, S. Study on Tunnel Fire Smoke Control and Transverse Passageway Interval under Traffic Congestion. In Proceedings of the IOP Conference Series: Earth and Environmental Science, Qingdao, China, 28–30 May 2021. [Google Scholar]
- Jan, Š.; Lukáš, F.; Jiří, C.; Jiří, Z. Model-based airflow controller design for fire ventilation in road tunnels. Tunn. Undergr. Space Technol. 2016, 60, 121–134. [Google Scholar] [CrossRef]
- Espinosa Antelo, I.; Fernández Martín, S.; Rey Llorente, I.d.; Alarcón Álvarez, E. Experiences on the specification of algorithms for fire and smoke control in road tunnels. In Proceedings of the 5th International Conference Tunnel Safety and Ventilation, Graz, Austria, 3–4 May 2010. [Google Scholar]
- Yin, H.; Fang, Z. Evacuation Simulation of the Yangtze River-crossing Highway-metro Integrated Tunnel on Sanyang Road in Wuhan. In Proceedings of the 2019 9th International Conference on Fire Science and Fire Protection Engineering (ICFSFPE), Chengdu, China, 18–20 October 2019; pp. 1–6. [Google Scholar] [CrossRef]
- Yuan, D.J.; Jin, H.; Chen, Z.C.; Liu, S.-N. Evacuation Experiment Study in Up and Down Escape Staircase of Underground Road. Adv. Civ. Eng. 2021, 2021, 10. [Google Scholar] [CrossRef]
- Zhang, A.Y.; Deng, M.; Hu, Y.J. Reasonable Space Combination Evacuation of Contact Channel and Evacuation Slide for Two-Hole Shield Tunnel. J. China Foreign Highw. 2020, 40, 209–213. (In Chinese) [Google Scholar] [CrossRef]
- Shen, Z.H.; Ma, J.; Qian, F.; Huang, Y.D. Simulation on Longitudinal Evacuation in Shield Tunnel under Fire. Fire Sci. Technol. 2019, 38, 92–94. (In Chinese) [Google Scholar]
- Hui, Y.C.; Xiao, Y.M.; Huang, H.T. Study on the Design Parameters of Vertical Evacuation Channels for Highway Tunnel. Refrig. Air Cond. 2020, 34, 157–163. (In Chinese) [Google Scholar]
- McGrattan, K.; Hostikka, S.; Floyd, J.; McDermott, R.; Vanella, M. Chapter 1Introduction. In Fire Dynamics Simulator User’s Guide, 6th ed.; National Institute of Standards and Technology (NIST): Gaithersburg, MD, USA, 2020; pp. 3–9. [Google Scholar] [CrossRef]
- Tang, F.; Deng, L.; Meng, N.; Mcnamee, M.; Van Hees, P.; Hu, L.H. Critical longitudinal ventilation velocity for smoke control in a tunnel induced by two nearby fires of various distances: Experiments and a revisited model. Tunn. Undergr. Space Technol. 2020, 105, 103559. [Google Scholar] [CrossRef]
- Chow, W.K.; Wong, K.; Chung, W. Longitudinal ventilation for smoke control in a tilted tunnel by scale modeling. Tunn. Undergr. Space Technol. 2010, 25, 122–128. [Google Scholar] [CrossRef] [Green Version]
- ISO 13943:2017(E); Fire Safety—Vocabulary. Technical report for International Organization for Standardization; ISO: Geneva, Switzerland, 2017. Available online: https://www.iso.org/standard/63321.html (accessed on 10 March 2022).
- ISO 13571:2012(E); Life-Threatening Components of Fire—Guidelines for the Estimation of Time to Compromised Tenability in Fires. Technical report for International Organization for Standardization; ISO: Geneva, Switzerland, 2012. Available online: https://www.iso.org/standard/56172.html (accessed on 10 March 2022).
- Wei, W. Study on the Numerical Simulation and Safety Evacuation in Long Highway Tunnel Fire. Master’s Thesis, Chang’an University, Xi’an, China, 2008. (In Chinese). [Google Scholar]
- Purser, D.A.; McAllister, J.L. Assessment of Hazards to Occupants from Smoke, Toxic Gases, and Heat. In SFPE Handbook of Fire Protection Engineering; Hurley, M.J., Gottuk, D., Hall, J.R., Harada, K., Kuligowski, E., Puchovsky, M., Torero, J., Watts, J.M., Wieczorek, C., Eds.; Springer: New York, NY, USA, 2016; pp. 2308–2428. [Google Scholar]
- Guo, X.X.; Pan, X.X.; Zhang, L.J.; Wang, Z.L.; Hua, M.; Jiang, J.C. Comparative study on ventilation and smoke extraction systems of different super-long river-crossing subway tunnels under fire scenarios. Tunn. Undergr. Space Technol. 2021, 113, 103849. [Google Scholar] [CrossRef]
- Król, A.; Król, M. Numerical investigation on fire accident and evacuation in a urban tunnel for different traffic conditions. Tunn. Undergr. Space Technol. 2021, 109, 103751. [Google Scholar] [CrossRef]
- Thunderhead Engineering. Chapter 6. Steering Mode. In Pathfinder Technical Reference Manual; Thunderhead Engineering Consultants, Inc: Manhattan, NY, USA, 2021; pp. 29–43. Available online: https://www.thunderheadeng.com (accessed on 10 March 2022).
- Song, X.Y.; Pan, Y.; Jiang, J.C.; Wu, F.; Ding, Y.J. Numerical investigation on the evacuation of passengers in metro train fire. Procedia Eng. 2018, 211, 644–650. [Google Scholar] [CrossRef]
- Zhang, G.W.; Huang, D.; Zhu, G.Q.; Yuan, G.L. Probabilistic model for safe evacuation under the effect of uncertain factors in fire. Saf. Sci. 2017, 93, 222–229. [Google Scholar] [CrossRef]
- Seike, M.; Kawabata, N.; Hasegawa, M. Evacuation speed in full-scale darkened tunnel filled with smoke. Fire Saf. J. 2017, 91, 901–907. [Google Scholar] [CrossRef]
- Technical Committee 5 Road Tunnels. Report 05.05.B Fire and Smoke Control in Road Tunnels; PIARC: Paris, France, 1999; pp. 31–33. ISBN 2-84060-064-1. [Google Scholar]
- Xie, B.C.; Zhang, S.Q.; Xu, Z.S.; He, L.; Xi, B.H.; Wang, M.Q. Experimental study on vertical evacuation capacity of evacuation slide in road shield tunnel. Tunn. Undergr. Space Technol. 2020, 97, 103250. [Google Scholar] [CrossRef]
- Zhang, Y.C.; Zhou, A.X.; Xiang, Y.; He, C.; Jiao, Q.Z.; Wan, B.; Xie, W. Evacuation experiments in vertical exit passages in an underwater road shield tunnel. Phys. A: Stat. Mech. Its Appl. 2018, 512, 1140–1151. [Google Scholar] [CrossRef]
- Cao, Y. Research on Experiment for Vertical Evacuation of Underwater Highway Tunnel with Large Cross-Section. Master’s Thesis, Southwest Jiaotong University, Chengdu, China, 2016. (In Chinese). [Google Scholar]
- Ren, R.; Zhou, H.; Hu, Z.; He, S.Y.; Wang, X.L. Statistical analysis of fire accidents in Chinese highway tunnels 2000–2016. Tunn. Undergr. Space Technol. 2019, 83, 452–460. [Google Scholar] [CrossRef]
- Haack, A. Current safety issues in traffic tunnels. Tunn. Undergr. Space Technol. 2002, 17, 117–127. [Google Scholar] [CrossRef]
- Technical Committee 3.3 Road Tunnel Operation. Report 2017R01 Design Fire Characteristics for Road Tunnels; PIARC: Paris, France, 2017; pp. 5–7. ISBN 978-2-84060-471-6. [Google Scholar]
- Tewarson, A. Section 3, Chapter 4, Generation of Heat and Chemical Compounds in Fires. In The SFPE Handbook of Fire Protection Engineering, 2nd ed.; DiNenno, P.J., Ed.; National Fire Protection Association: Quincy, MA, USA, 1995; pp. 3-53–3-124. [Google Scholar]
- Hu, L.H.; Fong, N.K.; Yang, L.Z.; Chow, W.K.; Li, Y.Z.; Huo, R. Modeling fire-induced smoke spread and carbon monoxide transportation in a long channel: Fire dynamics simulator comparisons with measured data. J. Hazard. Mater. 2007, 140, 293–298. [Google Scholar] [CrossRef]
- Gehandler, J.; Eymann, L.; Regeffe, M. Limit-based fire hazard model for evaluating tunnel life safety. Fire Technol. 2015, 51, 585–614. [Google Scholar] [CrossRef]
Publisher’s Note: MDPI stays neutral with regard to jurisdictional claims in published maps and institutional affiliations. |
© 2022 by the authors. Licensee MDPI, Basel, Switzerland. This article is an open access article distributed under the terms and conditions of the Creative Commons Attribution (CC BY) license (https://creativecommons.org/licenses/by/4.0/).