1. Introduction
Rehabilitation of open-cut coal mines in Queensland, Australia, is an obligation under state legislation. Prior to lease relinquishment, mining companies are required to demonstrate that rehabilitation is safe, stable, self-sustainable and non-polluting [
1]. Considering that fire is a common, natural and important occurrence in the Australian landscape [
2], it is inevitable that at some future point, mine site rehabilitation will be subject to wildfire disturbance.
In Central Queensland, mine managers in areas such as the Bowen Basin require methods to manage fire risk, and demonstrate to regulators and future land-holders that rehabilitated ecosystems have the capacity to withstand fire impacts. This is vital given that the risk of fire on rehabilitated areas may be increased due to: (i) the widespread planting of high biomass pasture grasses such as buffel grass (
Cenchrus ciliaris L.) [
3,
4]; (ii) relatively steep sloping landforms (compared to pre-mining) to minimize mine footprints [
5]; and (iii) the general policy of fire exclusion leading to the accumulation of unmanaged high fuel loads over more than 20 years [
3,
4,
6]. As mines move towards closure and lease relinquishment, it is therefore reasonable that mines demonstrate the resilience and ecological recovery of rehabilitated areas to disturbances using monitoring methods that are accepted as scientifically robust, repeatable and valid.
Typically, ecological assessments of mine site rehabilitation have involved ground surveys of multiple small plots (e.g., 400 m
2) that are assumed to be representative of larger areas [
7] but can be costly and time-consuming to complete. While the application of remote sensing techniques to mine site rehabilitation has been recognized [
8,
9], the number of peer reviewed studies is limited to a few that demonstrate vegetation cover development [
7,
10,
11,
12] and fire severity using Unmanned Aerial Vehicles (UAVs) [
13]. To date, no studies have used high spatial, spectral and temporal resolution satellite imagery to assess fire impacts and vegetation recovery on mine site rehabilitation at the local or regional scale. As a consequence, rehabilitation managers have limited understanding of the potential remote sensing techniques that may be applicable to demonstrate the stability and resilience of rehabilitation to fire. By demonstrating this resilience, managers have the opportunity to reduce reputational and financial risk and in some cases fast-track lease relinquishment at mine closure.
1.1. Remote Sensing Approaches to Fire Severity Mapping and Fire Recovery
Mapping the fire perimeter location and classifying fire severity using remote sensing was first demonstrated using sensors on the early Landsat series satellites (Multispectral Scanner (MSS)/Thematic Mapper (TM)/Enhanced Thematic Mapper Plus (ETM+)) [
14,
15,
16] and sensors such as the Advanced Very High Resolution Radiometer (AVHRR) carried out by the National Oceanic and Atmospheric Administration (NOAA) satellites [
17]. Since then, published literature is dominated with case studies using spectral indices such as the Normalized Burn Ratio (NBR) and Normalized Differenced Vegetation Index (NDVI) from a variety of sensors to infer fire impacts and vegetative recovery [
18]. Importantly, definitions of fire terminology amongst remote sensing scientists and fire ecologists have been a matter of ongoing discussion and debate [
15,
19,
20]. While short- and long-term fire effects on an ecosystem can be viewed as a severity and recovery continuum [
20,
21], it is generally accepted that fire severity can be defined as the degree of environmental change caused by direct fire impacts, and is a measurement of the immediate effects on an ecosystem. Additionally, burn severity refers to the short- and long-term environmental change caused by the fire [
15,
22] and requires extended assessments to quantify and characterize.
NBR is the normalized difference between the reflectance values of the near infra-red (NIR) and the short wave infra-red (SWIR) bands [
14,
15], while NDVI is the normalized difference between the reflectance values of the NIR and the red bands [
23,
24]. Although reflectance in the Red, NIR and SWIR regions of the electromagnetic spectrum (EMS) is driven by different biophysical factors [
25], the NBR and NDVI can behave in a broadly similar way. For example, both indices show strongly positive values when ground features are dominated by high biomass and green vegetation, while values close to zero indicate that vegetation is sparse, dead, or highly cured. Conversely, negative values indicate exposed soil and very low vegetation cover [
15,
26,
27].
By extending the NBR and NDVI, bi-temporal indices such as the differenced Normalized Burn Ratio (
dNBR) and the differenced Normalized Differenced Vegetation Index (
dNDVI) increase the power to measure absolute changes by using imagery captured in pre-fire and post-fire dates [
15]. Compared with the NBR and NDVI, the reflectance scale for the differenced rasters (
dNBR and
dNDVI) is inverted. High raster values indicate a relatively greater change from pre-fire values (reduced vegetation cover and drying of surface), while raster values around zero represent negligible fire impacts. With extended temporal assessments, strongly negative raster values for
dNBR and
dNDVI represent increasing vegetation regrowth [
15,
18].
The vast majority of remote sensing studies applying the fire indices
dNBR and
dNDVI have been conducted in heavily forested environments in the northern hemisphere [
18,
28,
29,
30]. In the southern hemisphere, Australian studies have demonstrated fire severity and recovery in a range of environments: in tropical savannas [
31,
32], and in dry sclerophyll eucalypt forests in eastern [
33,
34,
35,
36] and Western Australia [
37,
38].
1.2. Spectral Responses to Fire
An understanding of the changes in magnitude of spectral reflectance within the EMS following fire is fundamental to fire severity mapping using remote sensing [
15,
27]. While visible wavelengths (Red, Green, Blue) demonstrate measurable changes [
39], the largest post-fire changes occur in the NIR and SWIR regions of the EMS due to the loss of vegetative cover and the exposure and drying of underlying soil [
14,
15,
31,
32,
40]. NIR shifts to a notably lower reflectance with a loss of vegetation while SWIR reflectance values have been shown to increase with increasing fire severity [
15,
41]. However, responses to fire across the EMS are highly variable depending on biogeographical region, vegetation type and pre-fire vegetation condition [
18,
32]. The success of indices such as
dNDVI and
dNBR is related to vegetation type [
18], with forested environments generally producing greater map accuracies and regression relationships when compared with results for studies conducted in grasslands [
42,
43], swamps [
34] and heathlands [
36].
The SWIR bands most widely used for the NBR index are centered around 2100 nm (Band 7 on Landsat TM/ETM+/Operational Land Imager (OLI) as this region shows the greatest variance within burns [
15]. The longer wavelengths sampled in the SWIR can be used to measure spectral responses relating to soil exposure and changes in soil moisture [
15,
25] as well as a loss of vegetation moisture through leaf water content loss [
25,
41,
44]. While water content in vegetation is the primary driver of spectral reflectance in SWIR [
44], the loss of water results in the dominance of lignin and cellulose (present in plant cell walls) as a key feature determining spectral reflectance (particularly in region of 2100–2300 nm) [
45,
46]. The loss of vegetation water content and the drying, curing and senescence of grasslands results in higher reflectance in the SWIR region compared with green grass and green canopies [
26,
31,
32,
42].
The spectral reflectance of post-fire ash has been directly related to fire intensity and combustion of available fuels [
43]. White ash indicates a high rate of combustion and is characterized by a high reflective signature across the EMS. Black ash is generally depicted by a flat and featureless spectral reflectance signature and represents a lower burn intensity and lower fuel combustion [
43,
47,
48]. Other studies have shown spectral variability of post-fire ash qualities depending on vegetation type, degree of combustion and wildfire location [
49].
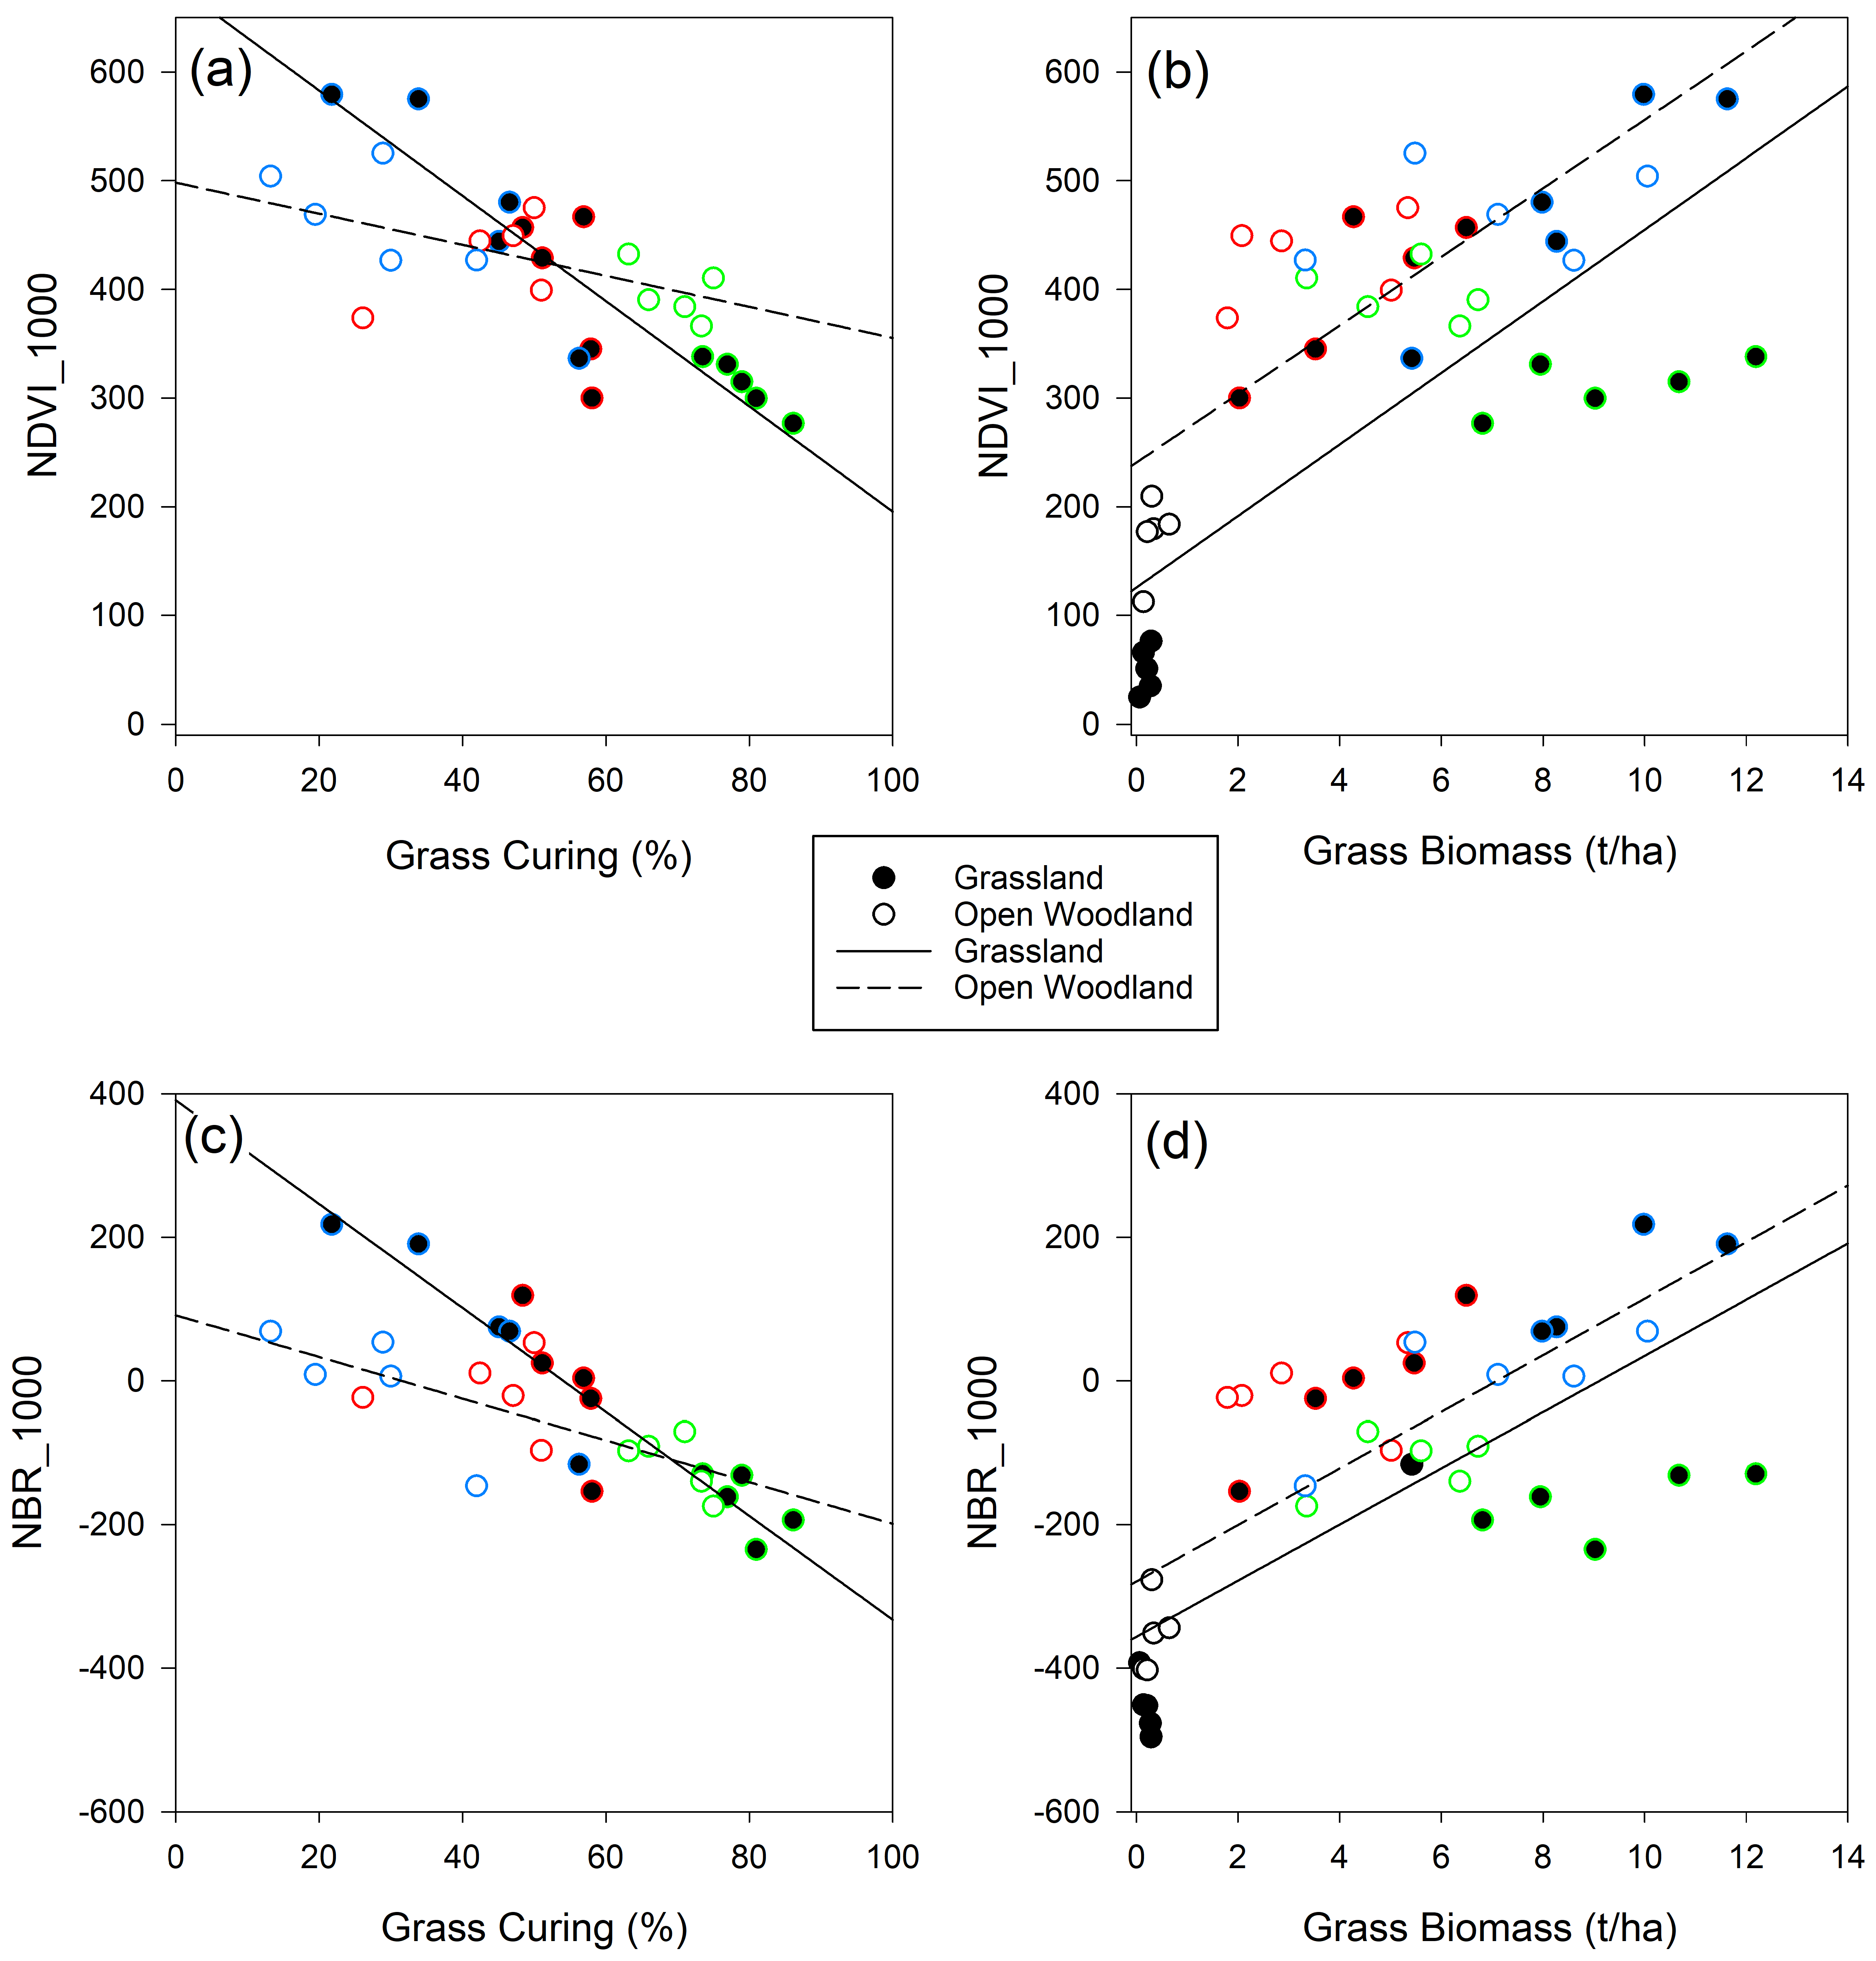
In this study, we applied fire to a 19- to 21-year old rehabilitated mine site and measured the vegetation response using spectral indices, along with ground assessments to validate imagery and support remote sensing findings. Since remote sensing is currently underutilized by rehabilitation practitioners, we aimed to demonstrate the most effective spectral indices to quantify disturbance and vegetation recovery in the study region, and thereby encourage rehabilitation managers to further employ remote sensing techniques in the pursuit of site relinquishment. The first objective of this study was to assess the viability of using WorldView-3 spectral indices dNDVI and dNBR to characterize fire severity and regeneration of post-mined landscapes at local scales (~1 m and ~7 m pixels over <10 km2). The second objective was to investigate the resilience of mine site rehabilitation to fire impacts, by demonstrating the site recovery trends using spectral indices NDVI and NBR supported by vegetation recovery measured in field sampling. The third objective was to discuss the effectiveness of NDVI and NBR within the study region by generating WorldView-3, 16-band spectral signatures of selected ground features in the burn and control areas.
4. Discussion
This paper demonstrates the post-fire dynamics and vegetation recovery on mine site rehabilitation using a combination of remote sensing and ground metrics. Image analysis provided insights into the fire severity and subsequent recovery through the use of NDVI, dNDVI, NBR and dNBR indices over a two-year period. The remote sensing recovery trends, spectral signatures of ground features and in situ grass biomass data suggest that grassland and open woodland areas are on a trajectory towards recovery and are approaching pre-fire levels.
The fire severity maps produced using
dNDVI resulted in a higher classification accuracy, and a moderate agreement between the field validation points and the model, as compared to the
dNBR classification. A users’ accuracy for the high severity class of 80% for the
dNDVI classification indicates that this map can be useful for rehabilitation managers to assess and monitor the areas of high impact. In general, land managers are most interested in the accurate fire mapping of high severity classes in order to target and monitor any future remediation [
18]. Other class accuracies were generally poor for both
dNDVI and
dNBR, with high commission and omission errors indicating a significant amount of confusion between the classes. A number of studies have also shown reduced classification accuracies due to overlapping severity classes [
15,
18,
21,
43]. Common issues involve confusion around low severity impacts due to low vegetation cover, background soil impacts, or drier post-fire imagery providing false positives [
15,
21,
41,
61,
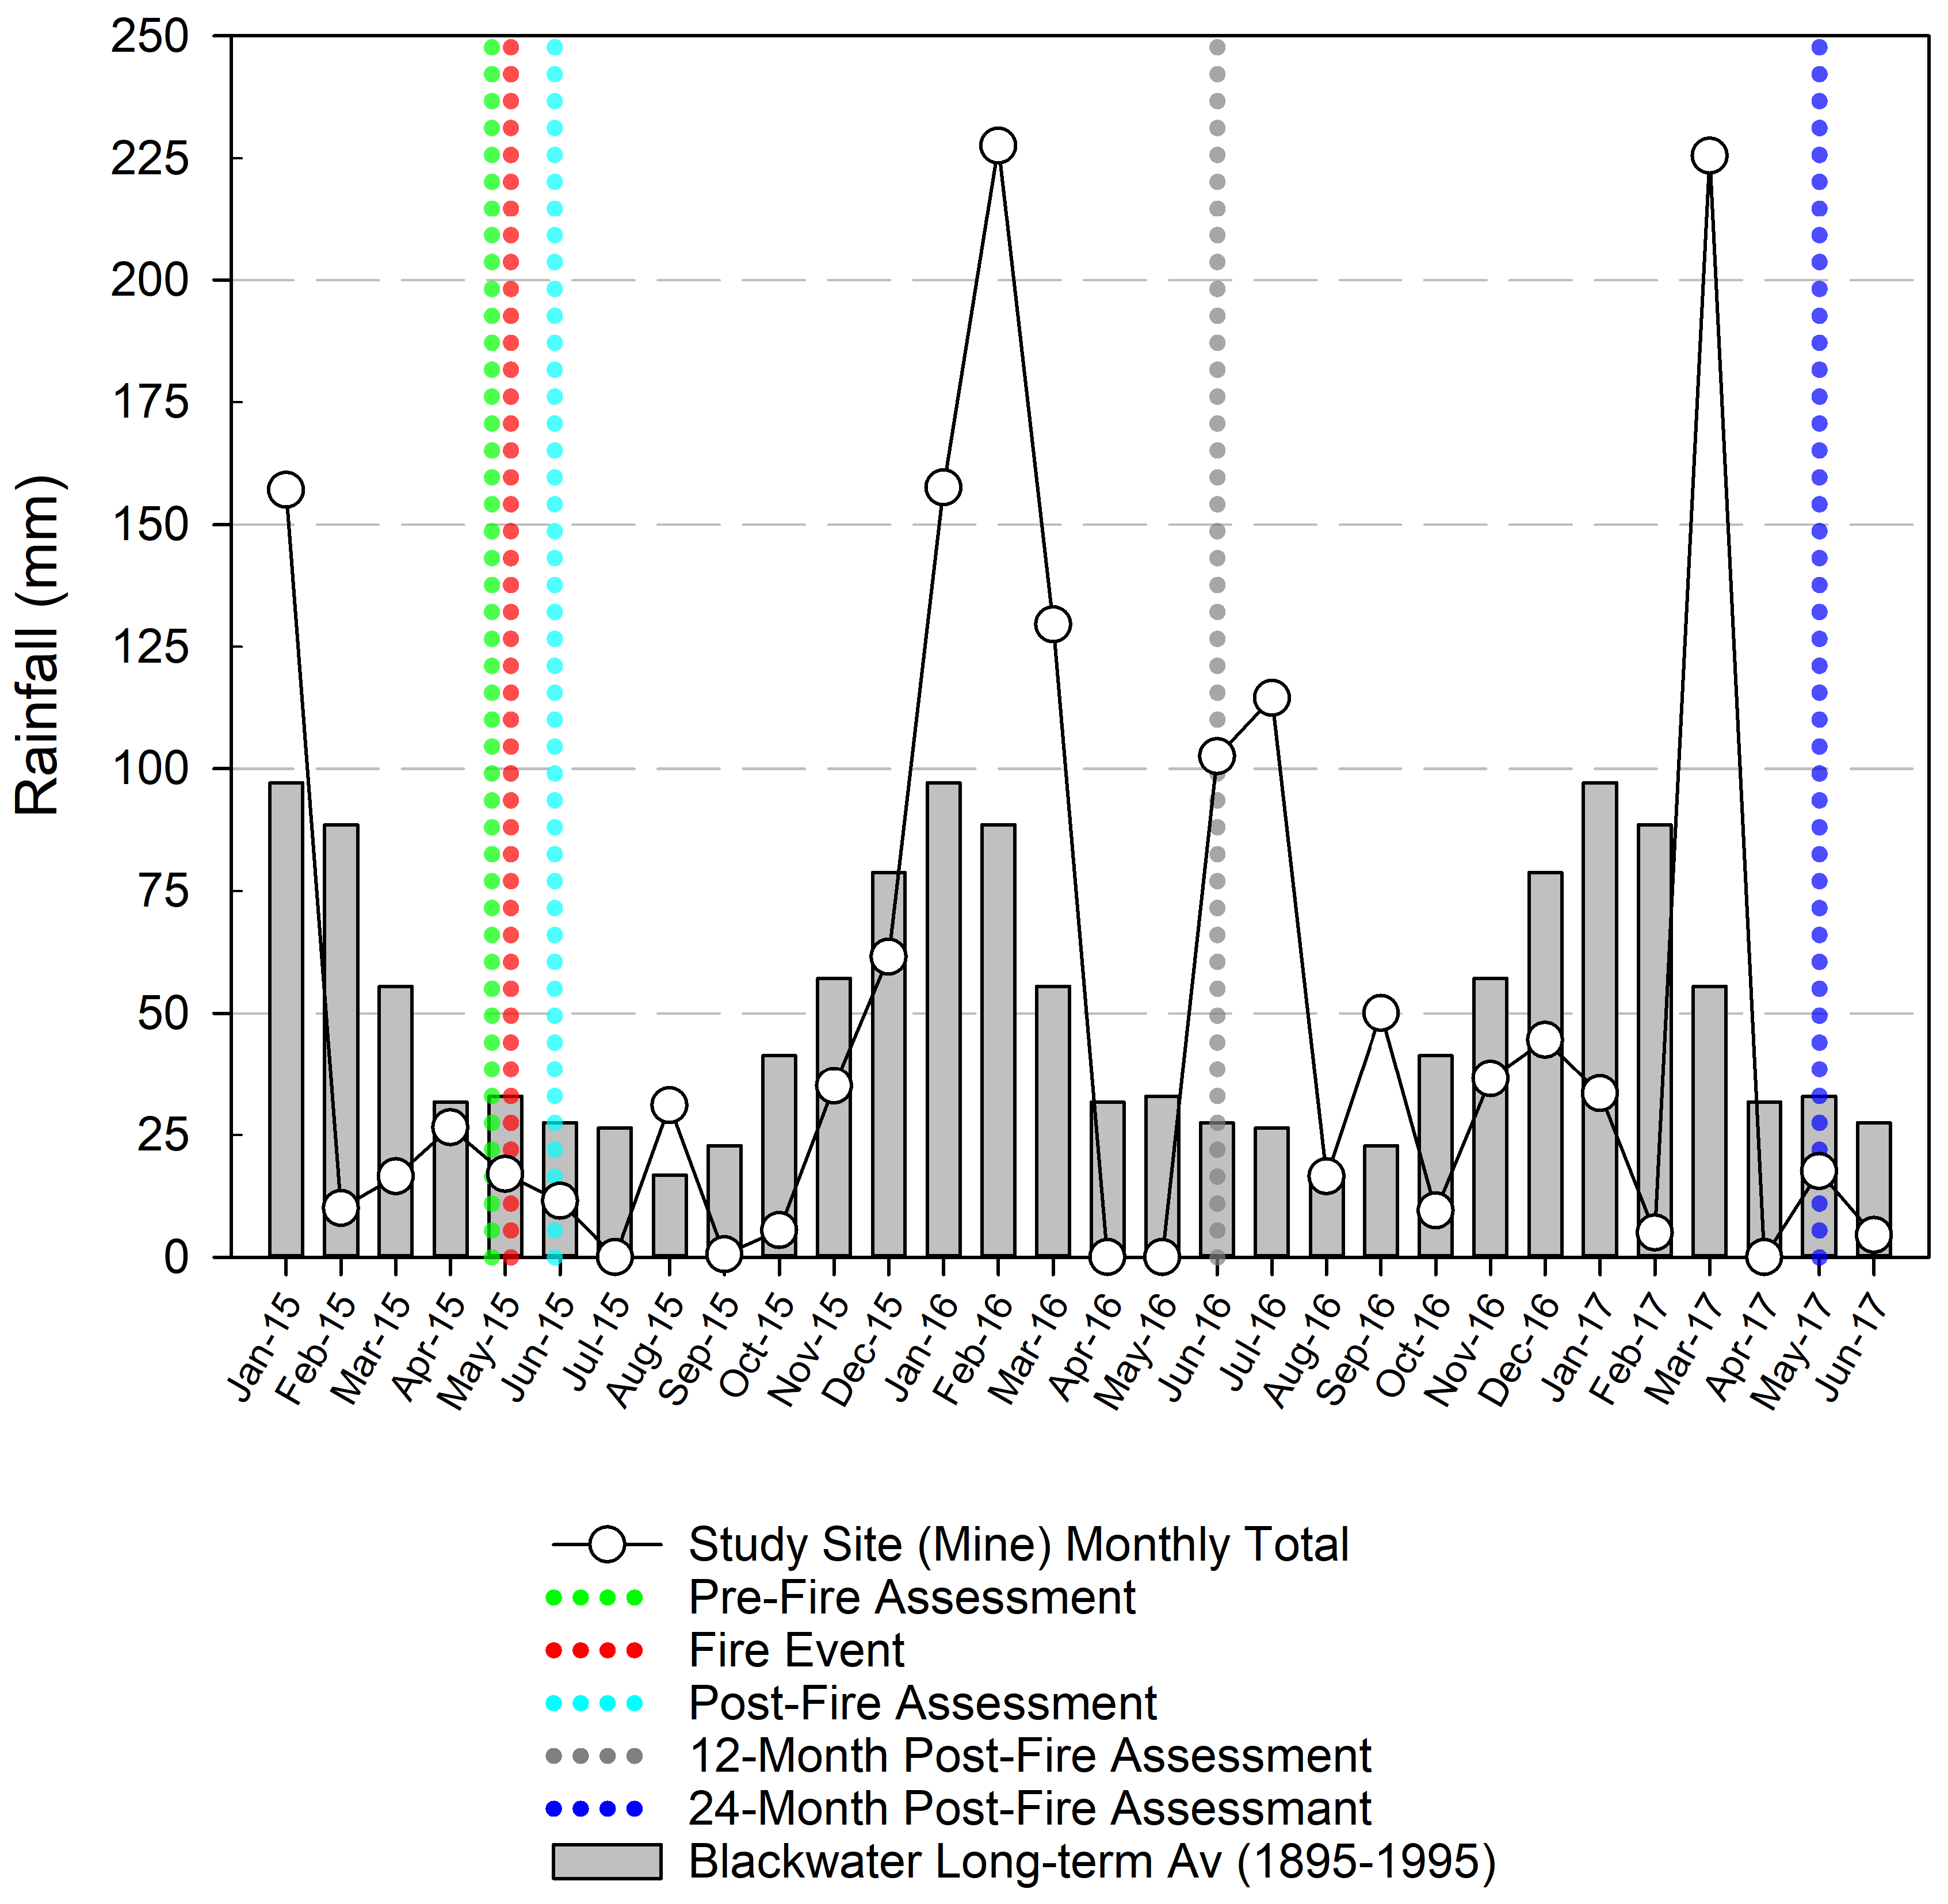
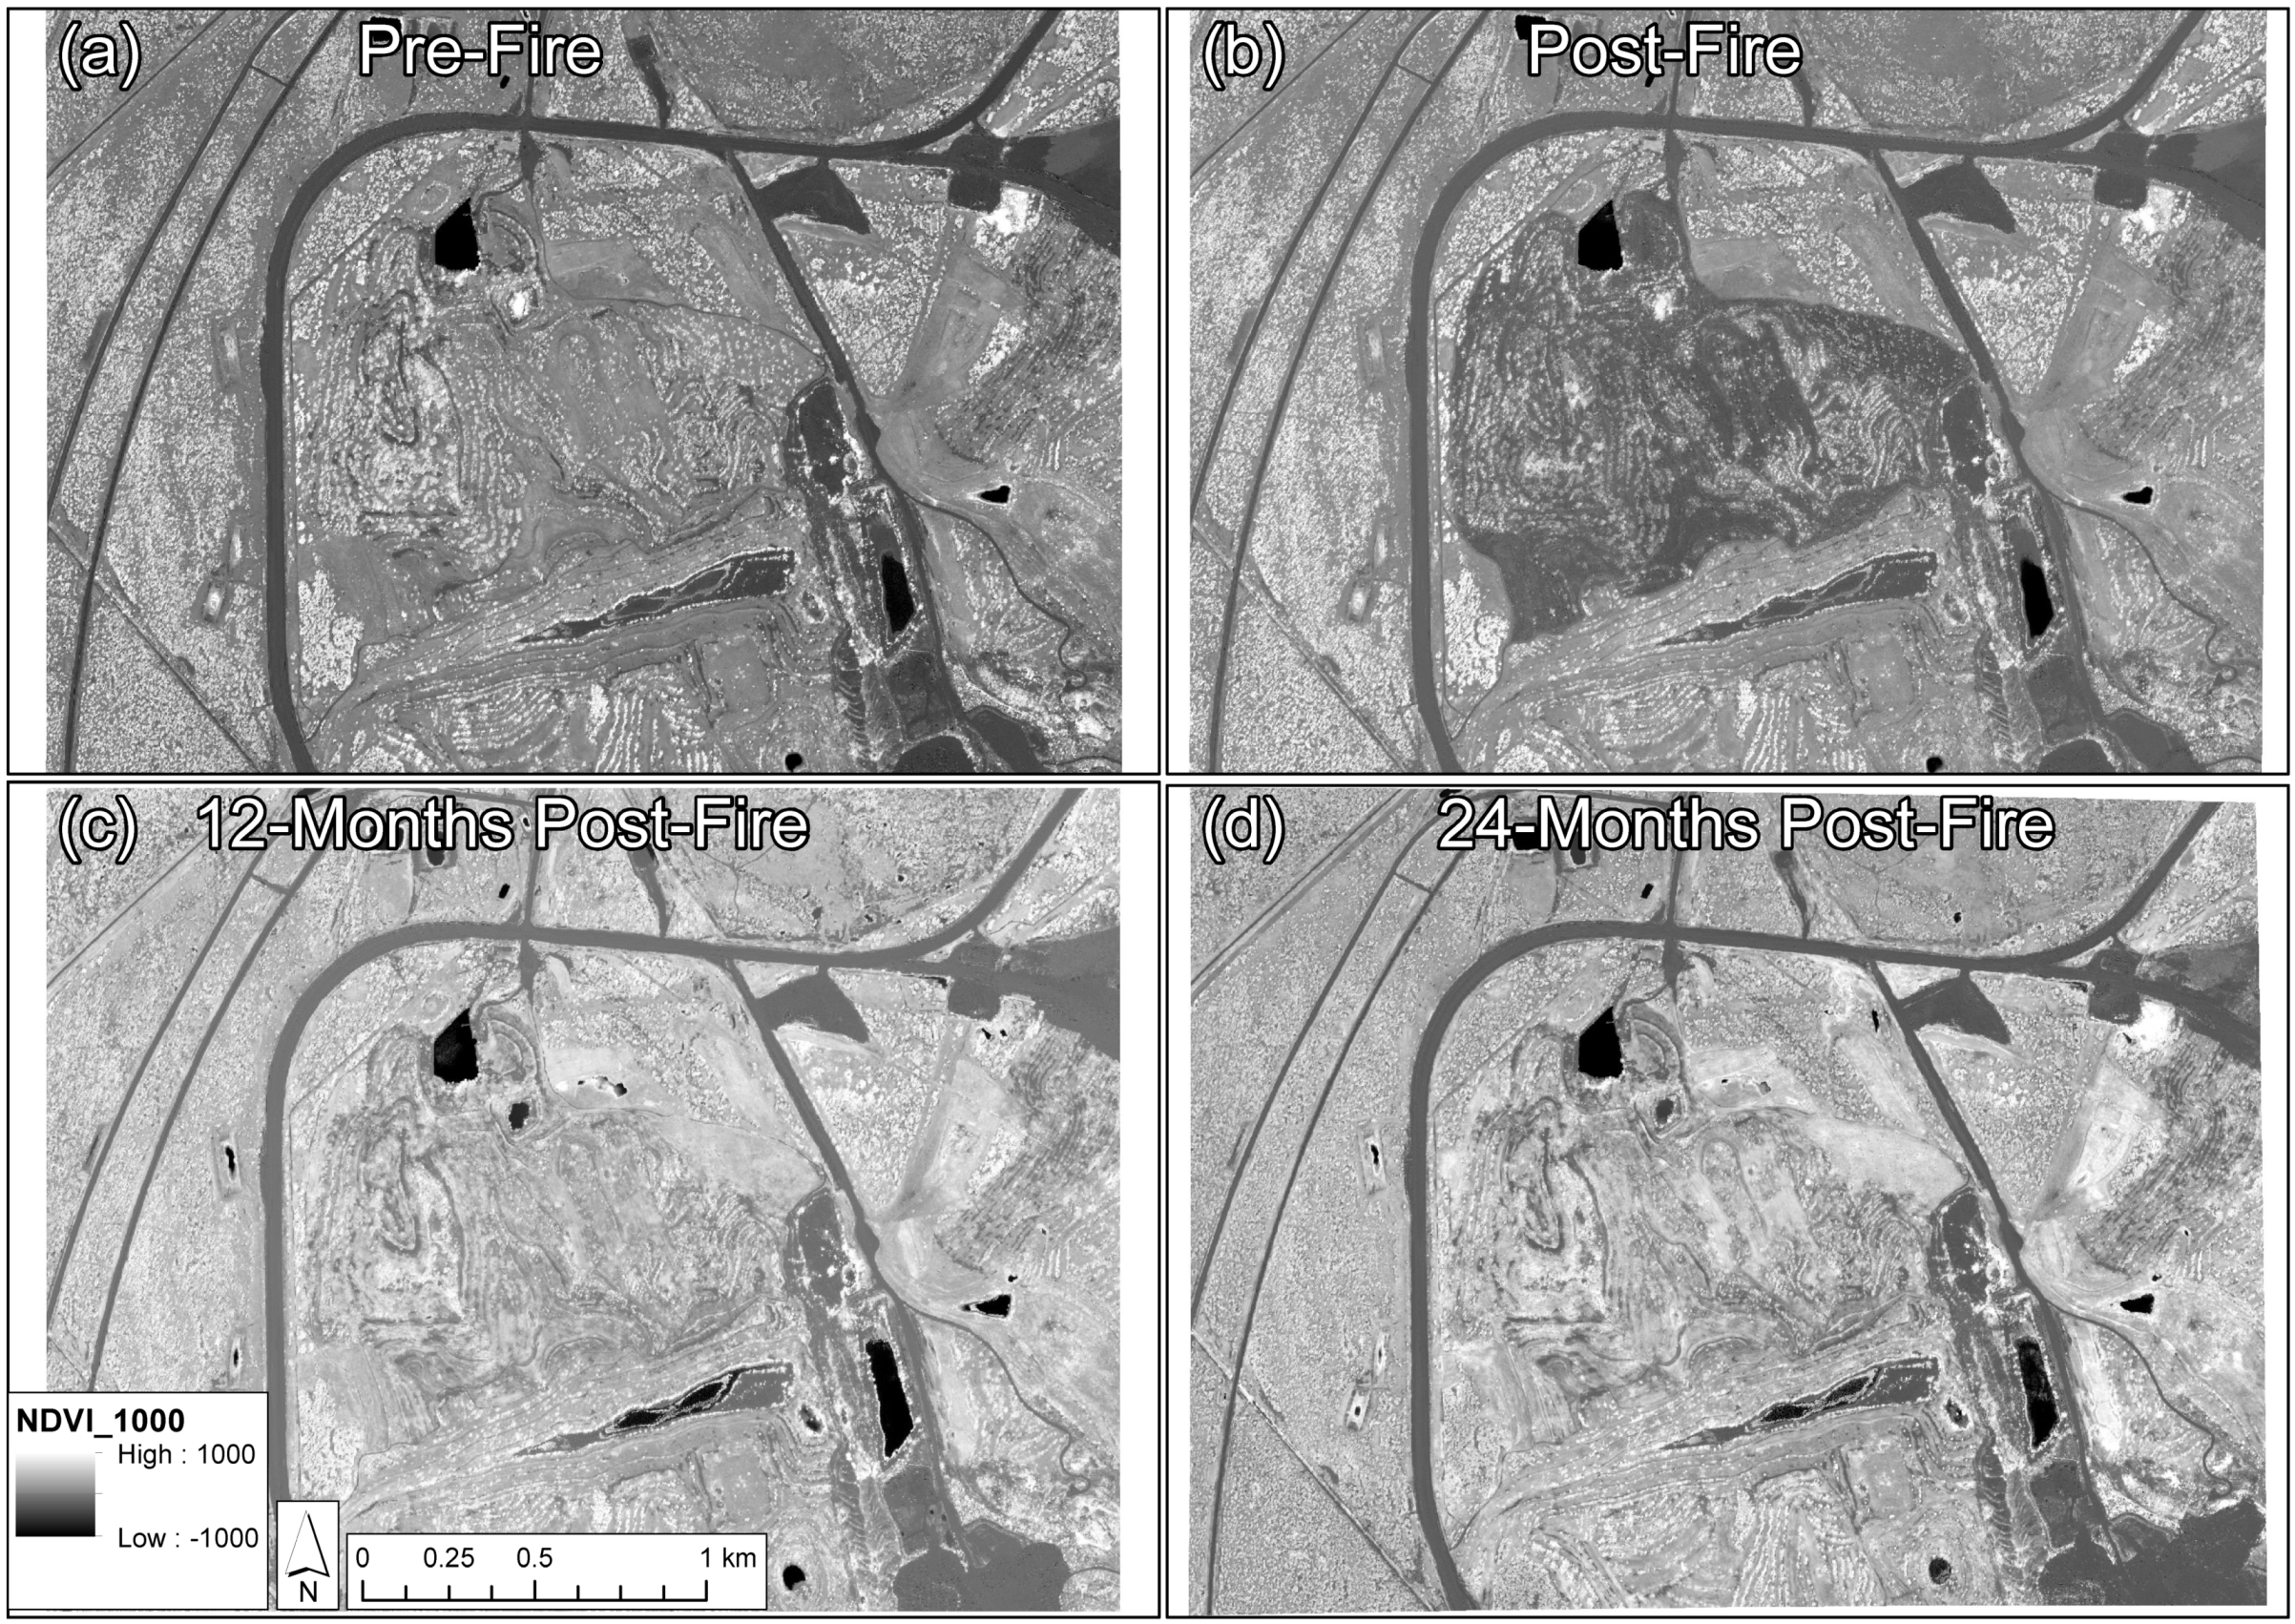
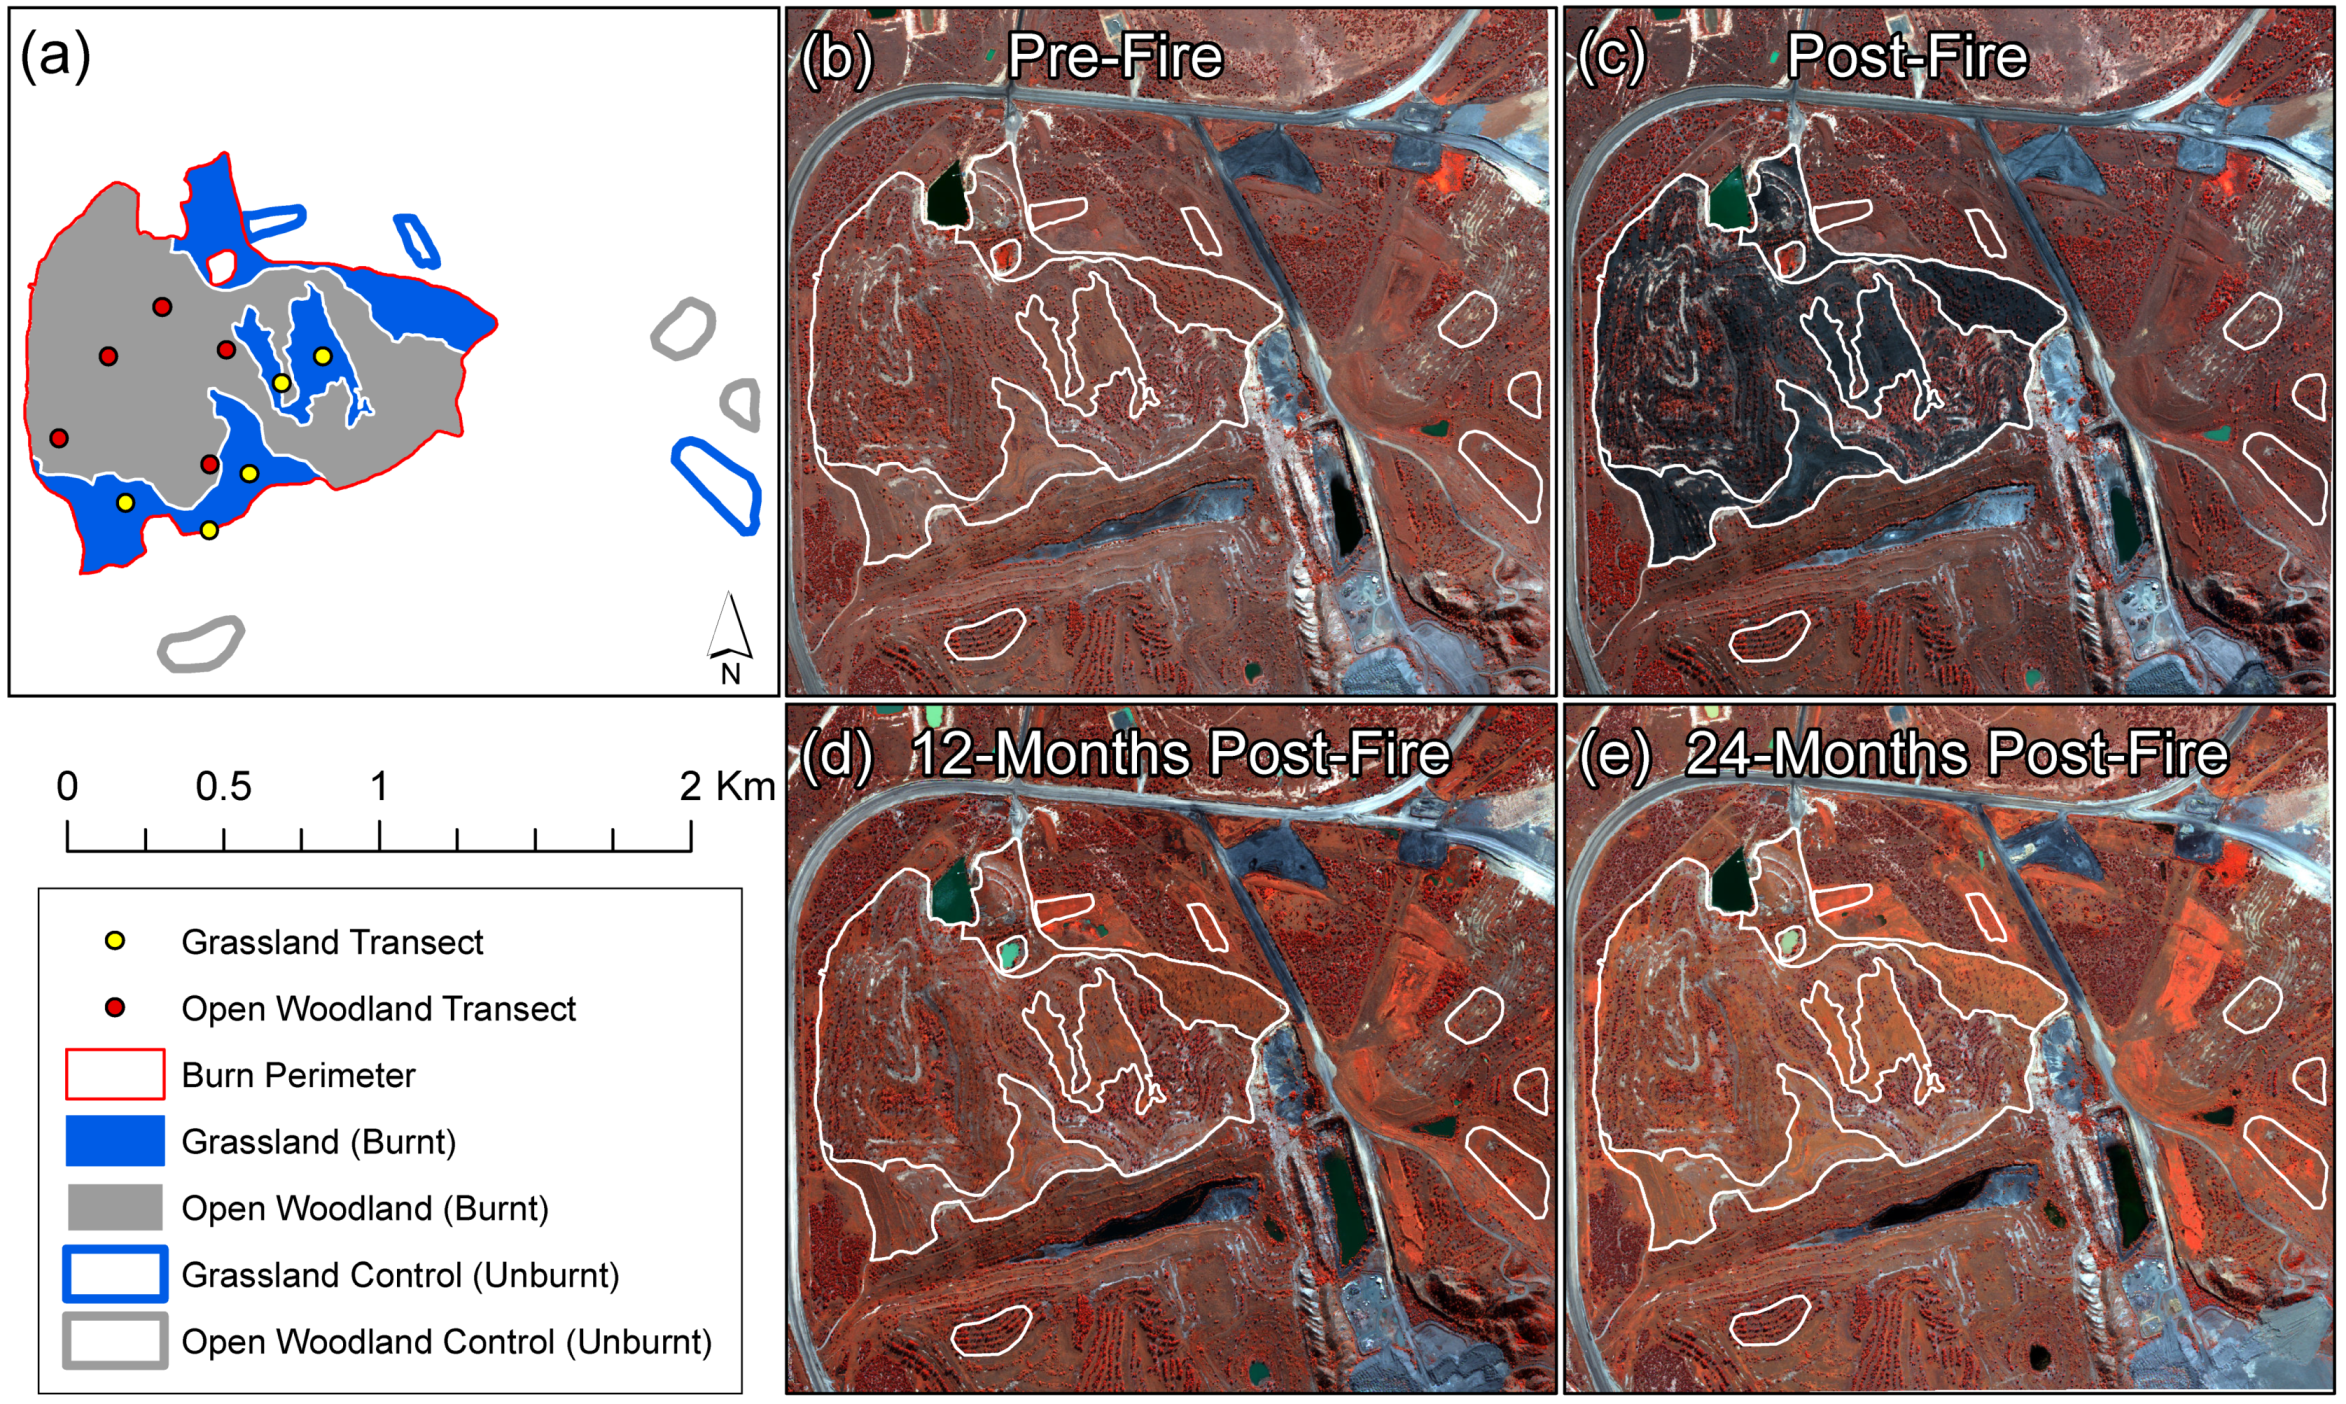
62]. These issues all have the potential to impact on the classification at this site, which contained a heterogeneous vegetation cover on natural black and brown cracking clays and a range of spoil types. Additionally, low rainfall totals leading up to and after the fire are reflected in a noticeably drier post-fire image (
Figure 3c, and
Figure A3).
Area calculations of the
dNDVI severity map demonstrates that the grassland areas received the majority of the high severity impacts, with the open woodland areas showing a mosaic of unburnt, low and high severity (
Table 7). This is supported by ground assessments, which showed that the fire consumed a comparatively larger proportion of the understory biomass in the grassland areas. Where the fire was able to move through areas of open woodland, it removed much of the ground layer associated with the topsoil strips along the contour that contained buffel grass at fuel loads equivalent to the more homogenous areas of the grassland type [
4].
One of the key outcomes of the study was the improved overall accuracy of the
dNDVI classification compared with the
dNBR assessment. This is likely due to a number of factors. Firstly, the pre-fire vegetation on the study site was dominated by highly cured grasses and a sparse cover of acacia trees; which proved more suited to indices using the shorter multispectral wavelengths (
dNDVI) as compared with indices utilizing the longer wavelengths of the SWIR region (
dNBR). The
dNBR has been most effective when reflectance values of NIR and SWIR are inverted following fire, whereby NIR exhibits a reduction in reflectance and the SWIR is increased [
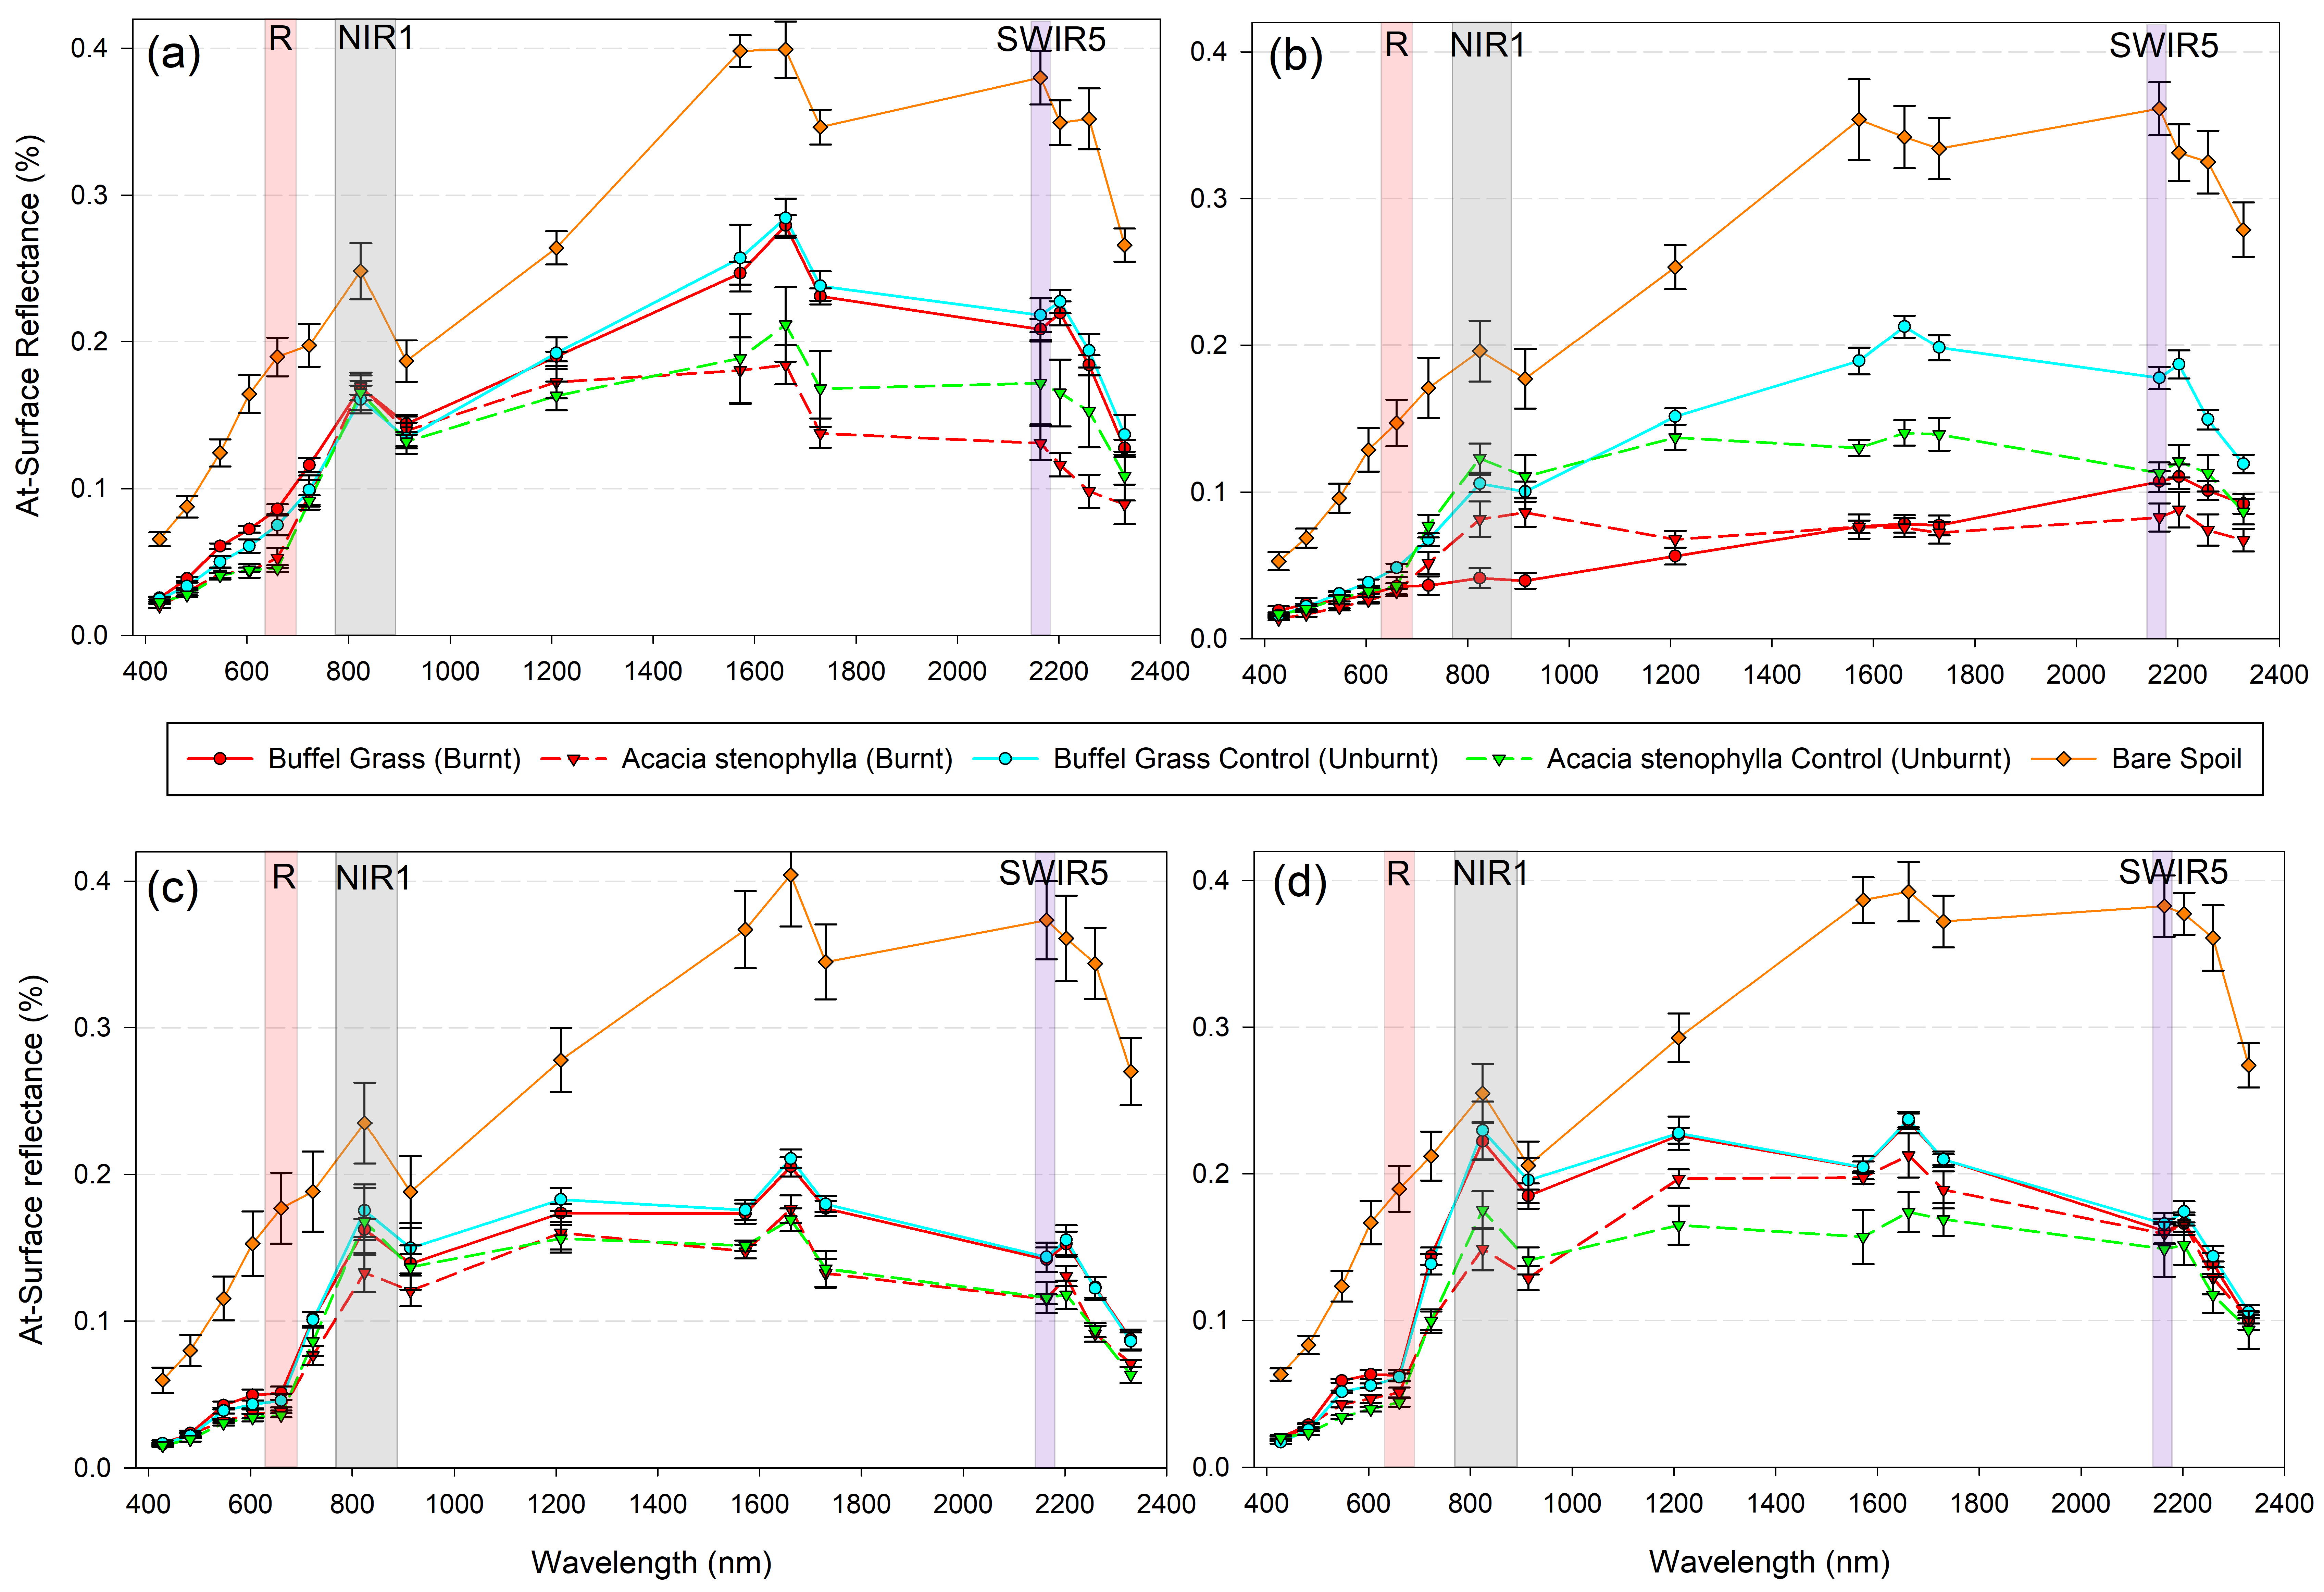
15]. However, the spectral signatures of ground features measured in this study demonstrated a reduction in both the NIR and SWIR reflectance values in post-fire images, due to the removal of vegetation and presence of black ash, resulting in a poor classification result for
dNBR (
Figure 8). Changes in the SWIR region of the EMS after burning have been shown to be highly variable across northern Australia [
63]; while the
dNBR has been demonstrated to work effectively in forested environments [
15], it is less effective in savanna with low tree cover and a highly cured understory [
32,
64]. Reflectance for vegetation in the longer wavelengths of the SWIR region (1300–2500 nm) is primarily driven by leaf water content—the higher the leaf water content, the lower the reflectance [
25,
44]—this results in a low spectral response for dense tree canopies, while highly cured grasslands typically show a high reflectance in this region [
31,
32,
42], as demonstrated in the pre-fire spectral signature for buffel grass in
Figure 8a. Secondly, the presence of a substantial amount of residual ash in post-fire imagery favors multispectral indices such a
dNDVI. Previous studies have modelled fire severity variations with spectral response and found that the NIR and red bands were the most effective at classifying severity for the charcoal signal, rather than when bare soil reflectance dominates the post-fire image [
41]. Finally, highly heterogeneous sites may be more strongly suited to small spatial scale imagery as compared to the relatively coarse spatial resolution of the SWIR imagery. Spectral mixing in moderate spatial resolution sensors has resulted in spectral confusion and misclassification [
36] and other studies have shown higher overall accuracies due to higher spatial resolution imagery [
18]. This was tested by resampling the 1.2 m NDVI rasters to 7 m and re-running the severity classification. However, the result was a marginal increase in overall map accuracy (data not shown) suggesting that in this study, the improved accuracy of the
dNDVI classification is more closely aligned to the suitability of multispectral wavelengths over the SWIR wavelengths in the semi-arid environment.
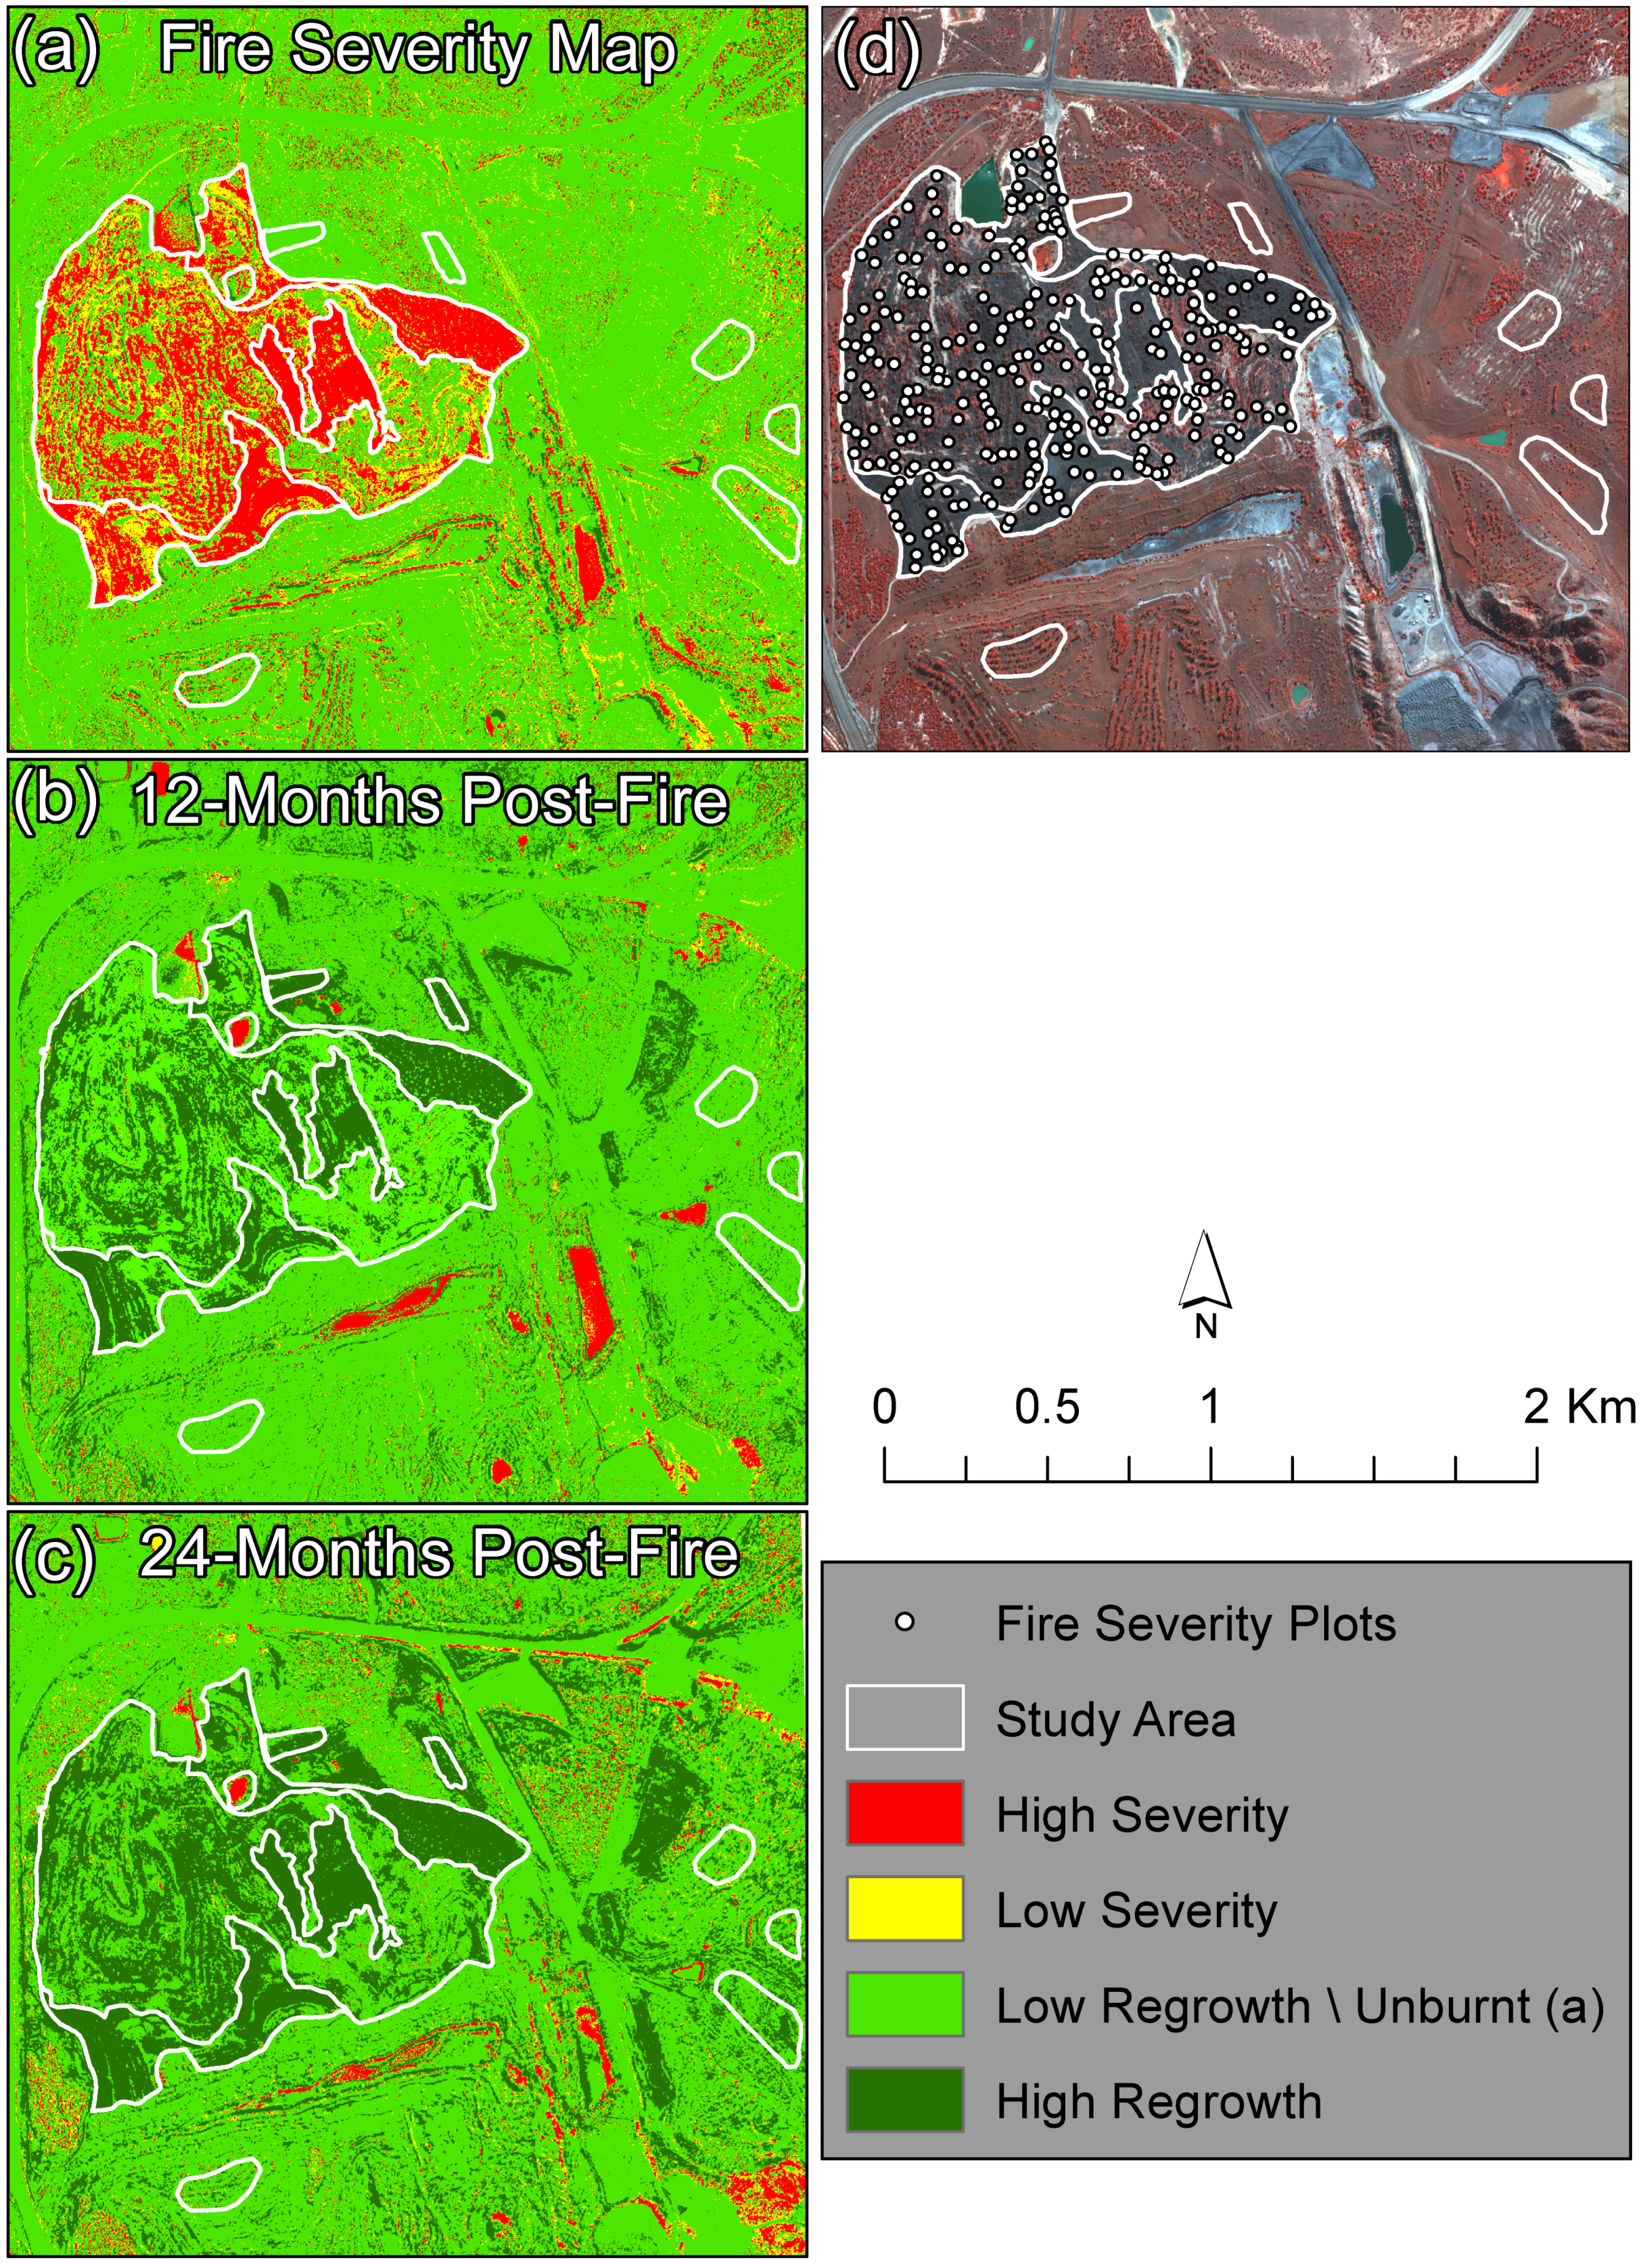
The
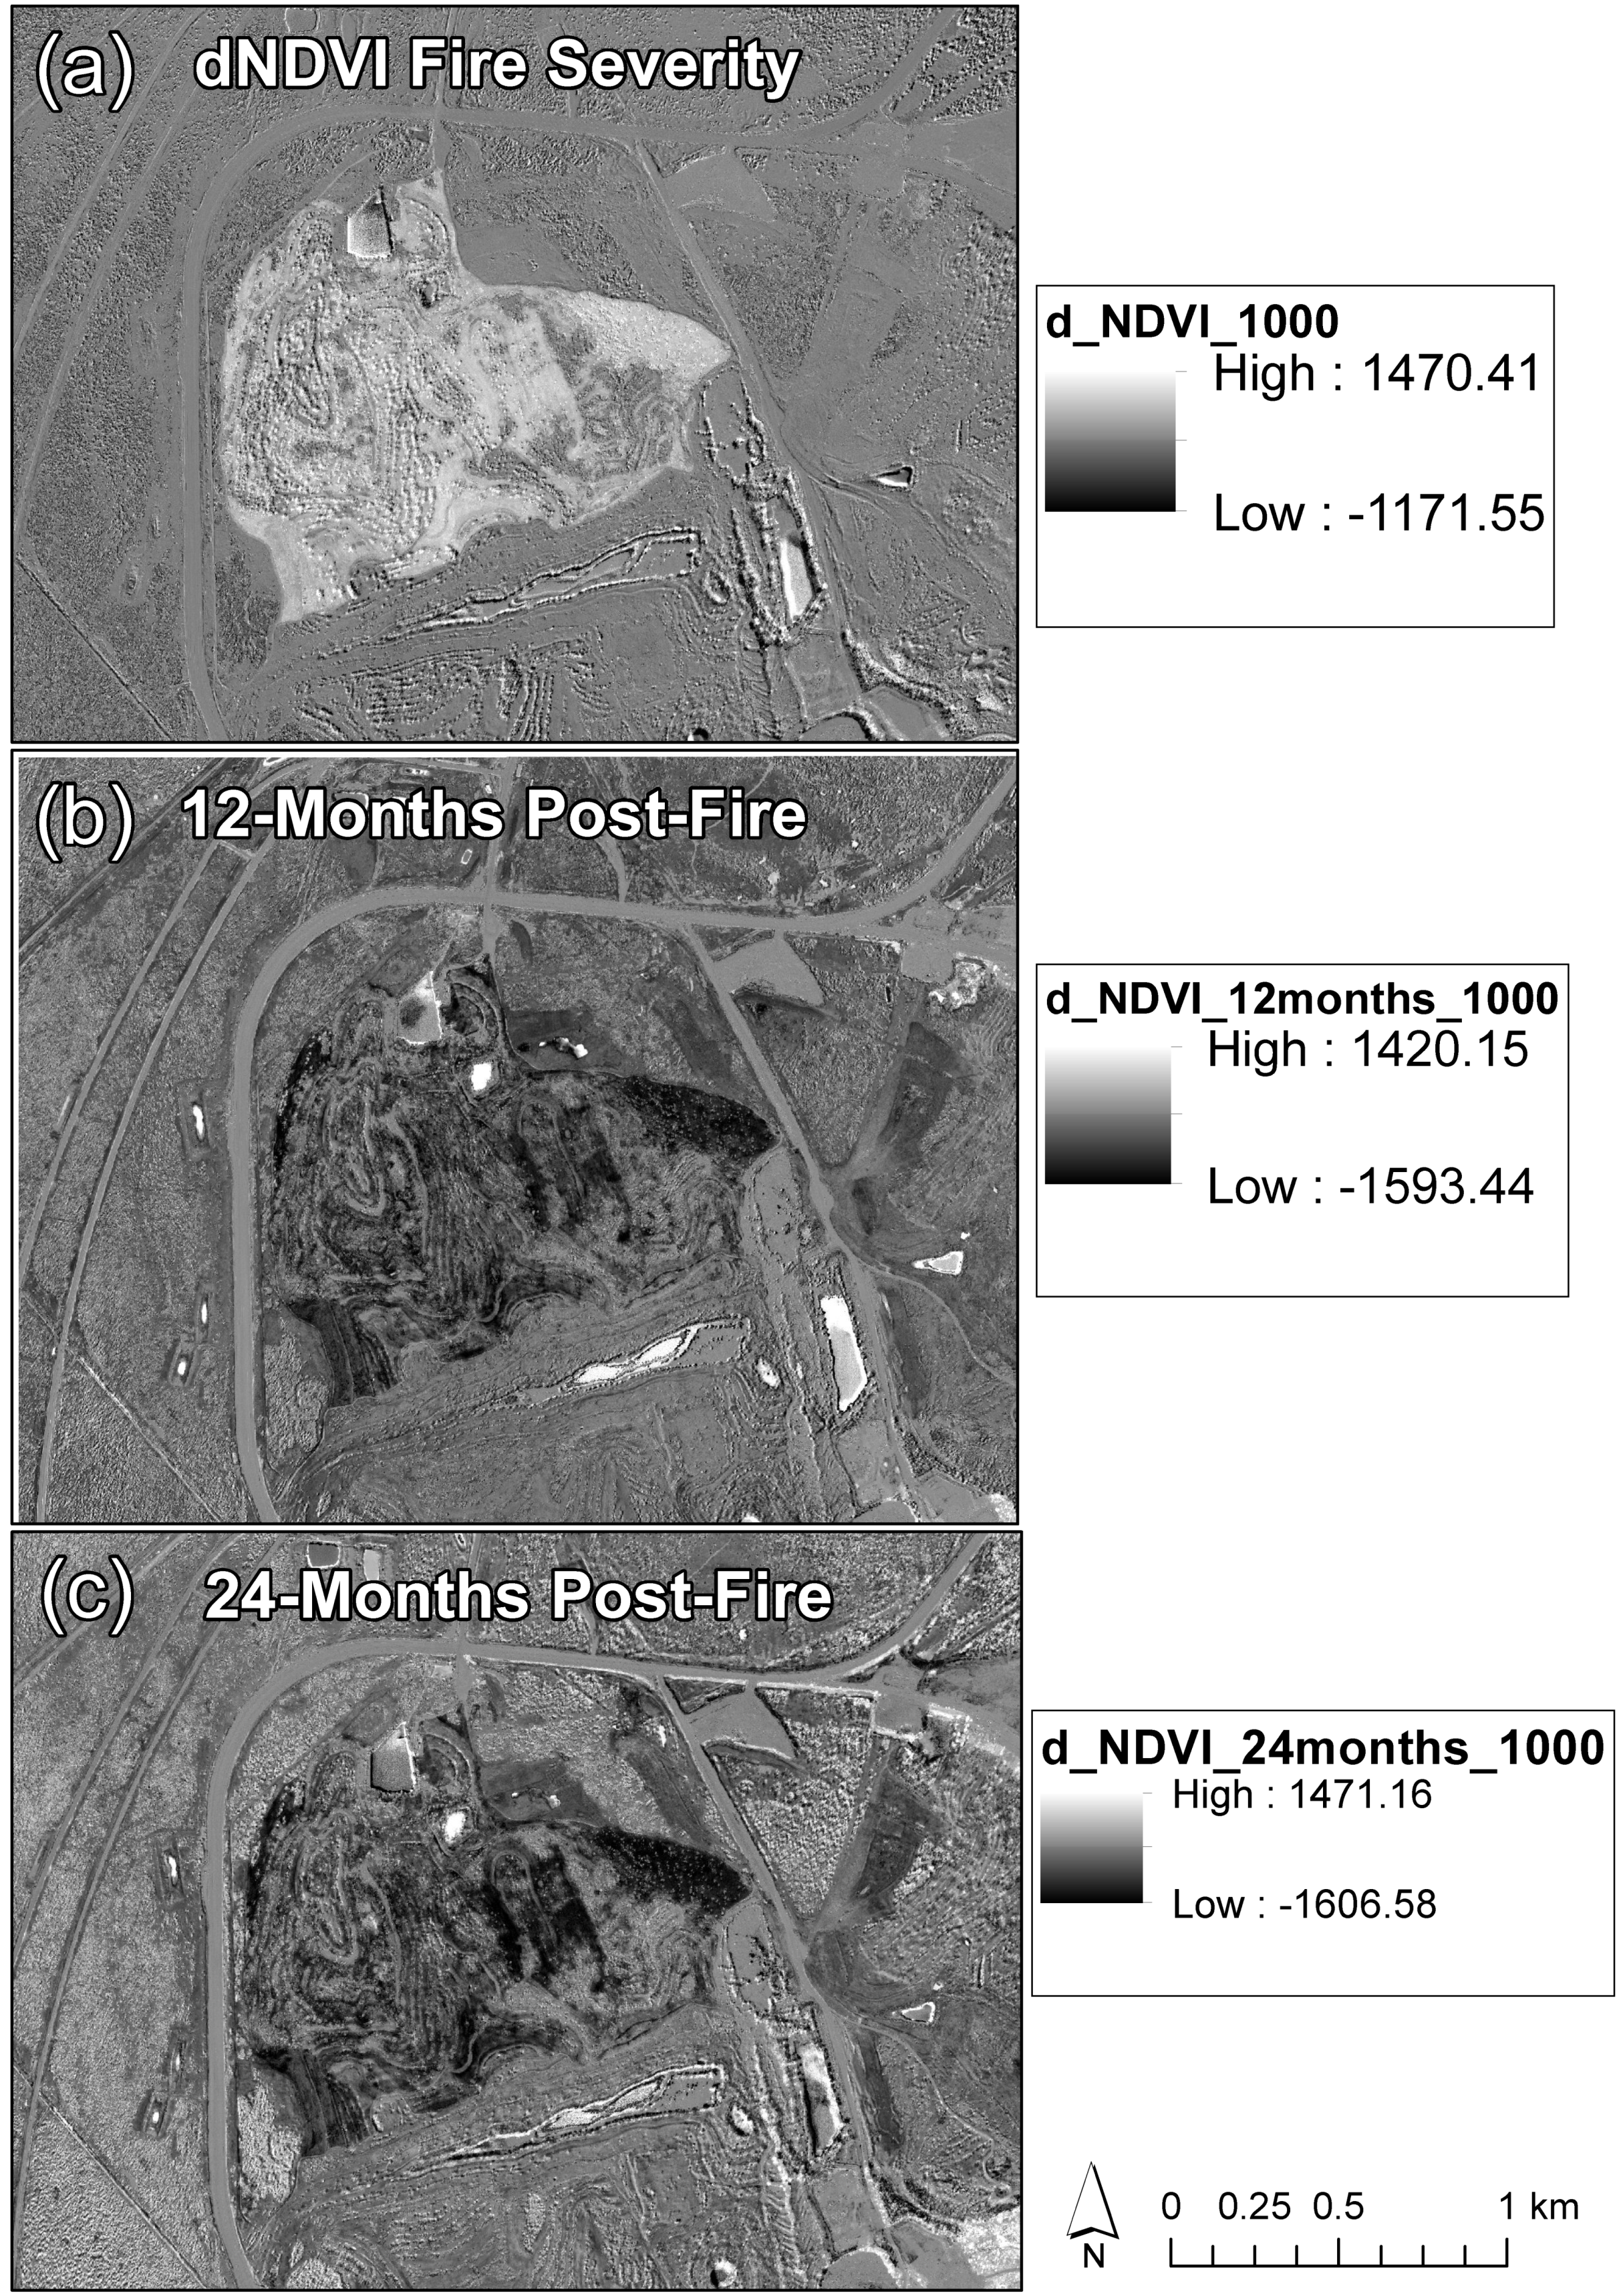
dNDVI recovery maps show that areas impacted by high severity fire were also more likely to display high regrowth in the 12- and 24-month post-fire images (
Figure 4). This result supports previous findings where areas of grassland impacted by high severity fire were also the areas with a high rate of recovery [
42]. Following fire, an increase in available nutrients and light will support regrowth from grasses that are able to respond to changing edaphic conditions, provided the grass root crowns are undamaged [
65,
66]. This is particularly relevant for species such as buffel grass with a demonstrated capacity for fire resilience [
65], and with root systems that can reach greater than 2 m in depth [
67]. Additionally, the rehabilitation technique that the mine employed resulted in 100% topsoil coverage of grassland areas [
4]. As a result, these areas are likely to have higher soil-water holding capacity and higher nutrient availability facilitating the rapid regrowth of grasses compared with open woodland areas that contain large areas of bare spoil.
This study demonstrates the importance of unburnt control plots for investigating the resilience of ecosystem dynamics, particularly for extended burn severity assessments. Although the use of control plots and paired unburnt plots have been used successfully in remote sensing studies [
35,
68], there are no standard approaches to fire severity mapping [
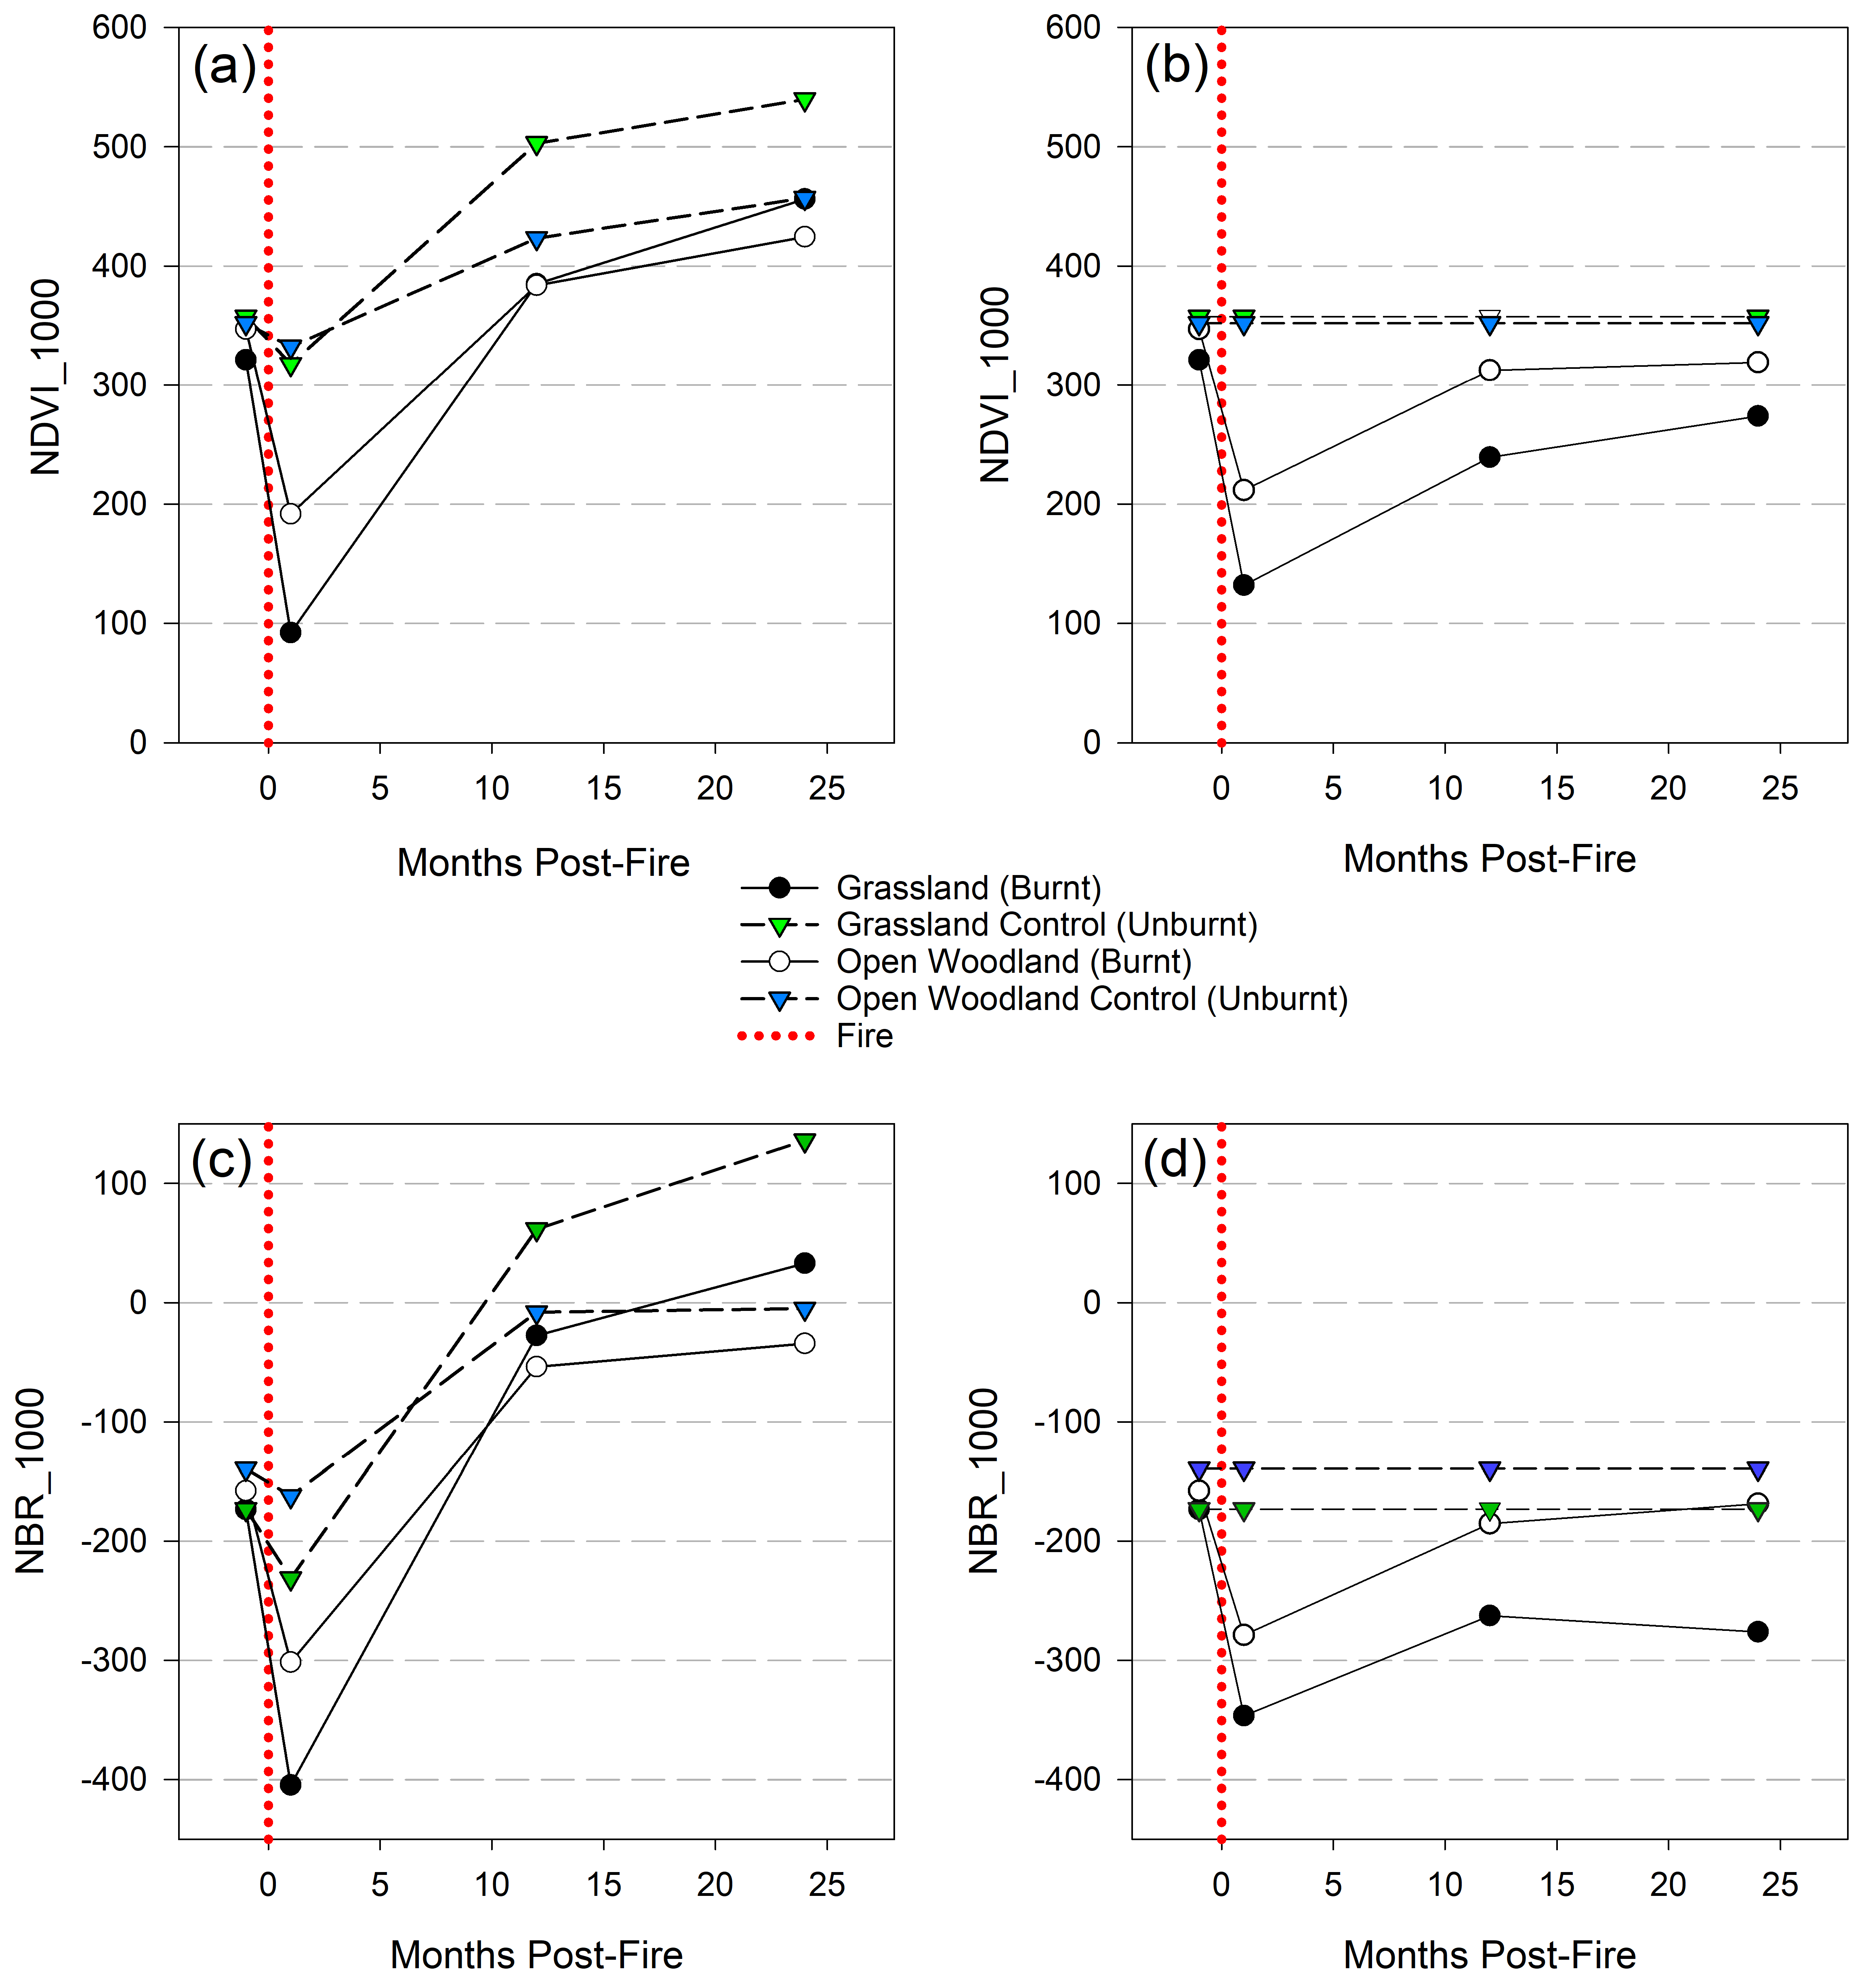
18]; despite the potential for controls to reduce the phenological and rainfall effects in the analysis and interpretation of a time-series. For example, prior to standardizing, the NDVI and NBR trends suggest that the burnt sites have recovered beyond pre-fire levels for both grassland and open woodland areas, as early as 12 months post-fire (
Figure 7a,c). However, it is clear that the control sites also show an improvement in condition as demonstrated in
Figure 3,
Figure 4 and
Figure 7, thus demonstrating the need to determine the recovery trend relative to surrounding unburnt areas. Following standardization, a more realistic insight into the post-fire recovery status shows that recovery trends for burnt grassland and open woodland remain on a trajectory towards pre-fire levels, but are yet to reach full recovery for both NDVI and NBR indices. In fact, by removing the estimated rainfall effects that are responsible for the rapid re-greening of grassland areas, open woodland areas appear to demonstrate a faster overall recovery towards pre-fire levels (
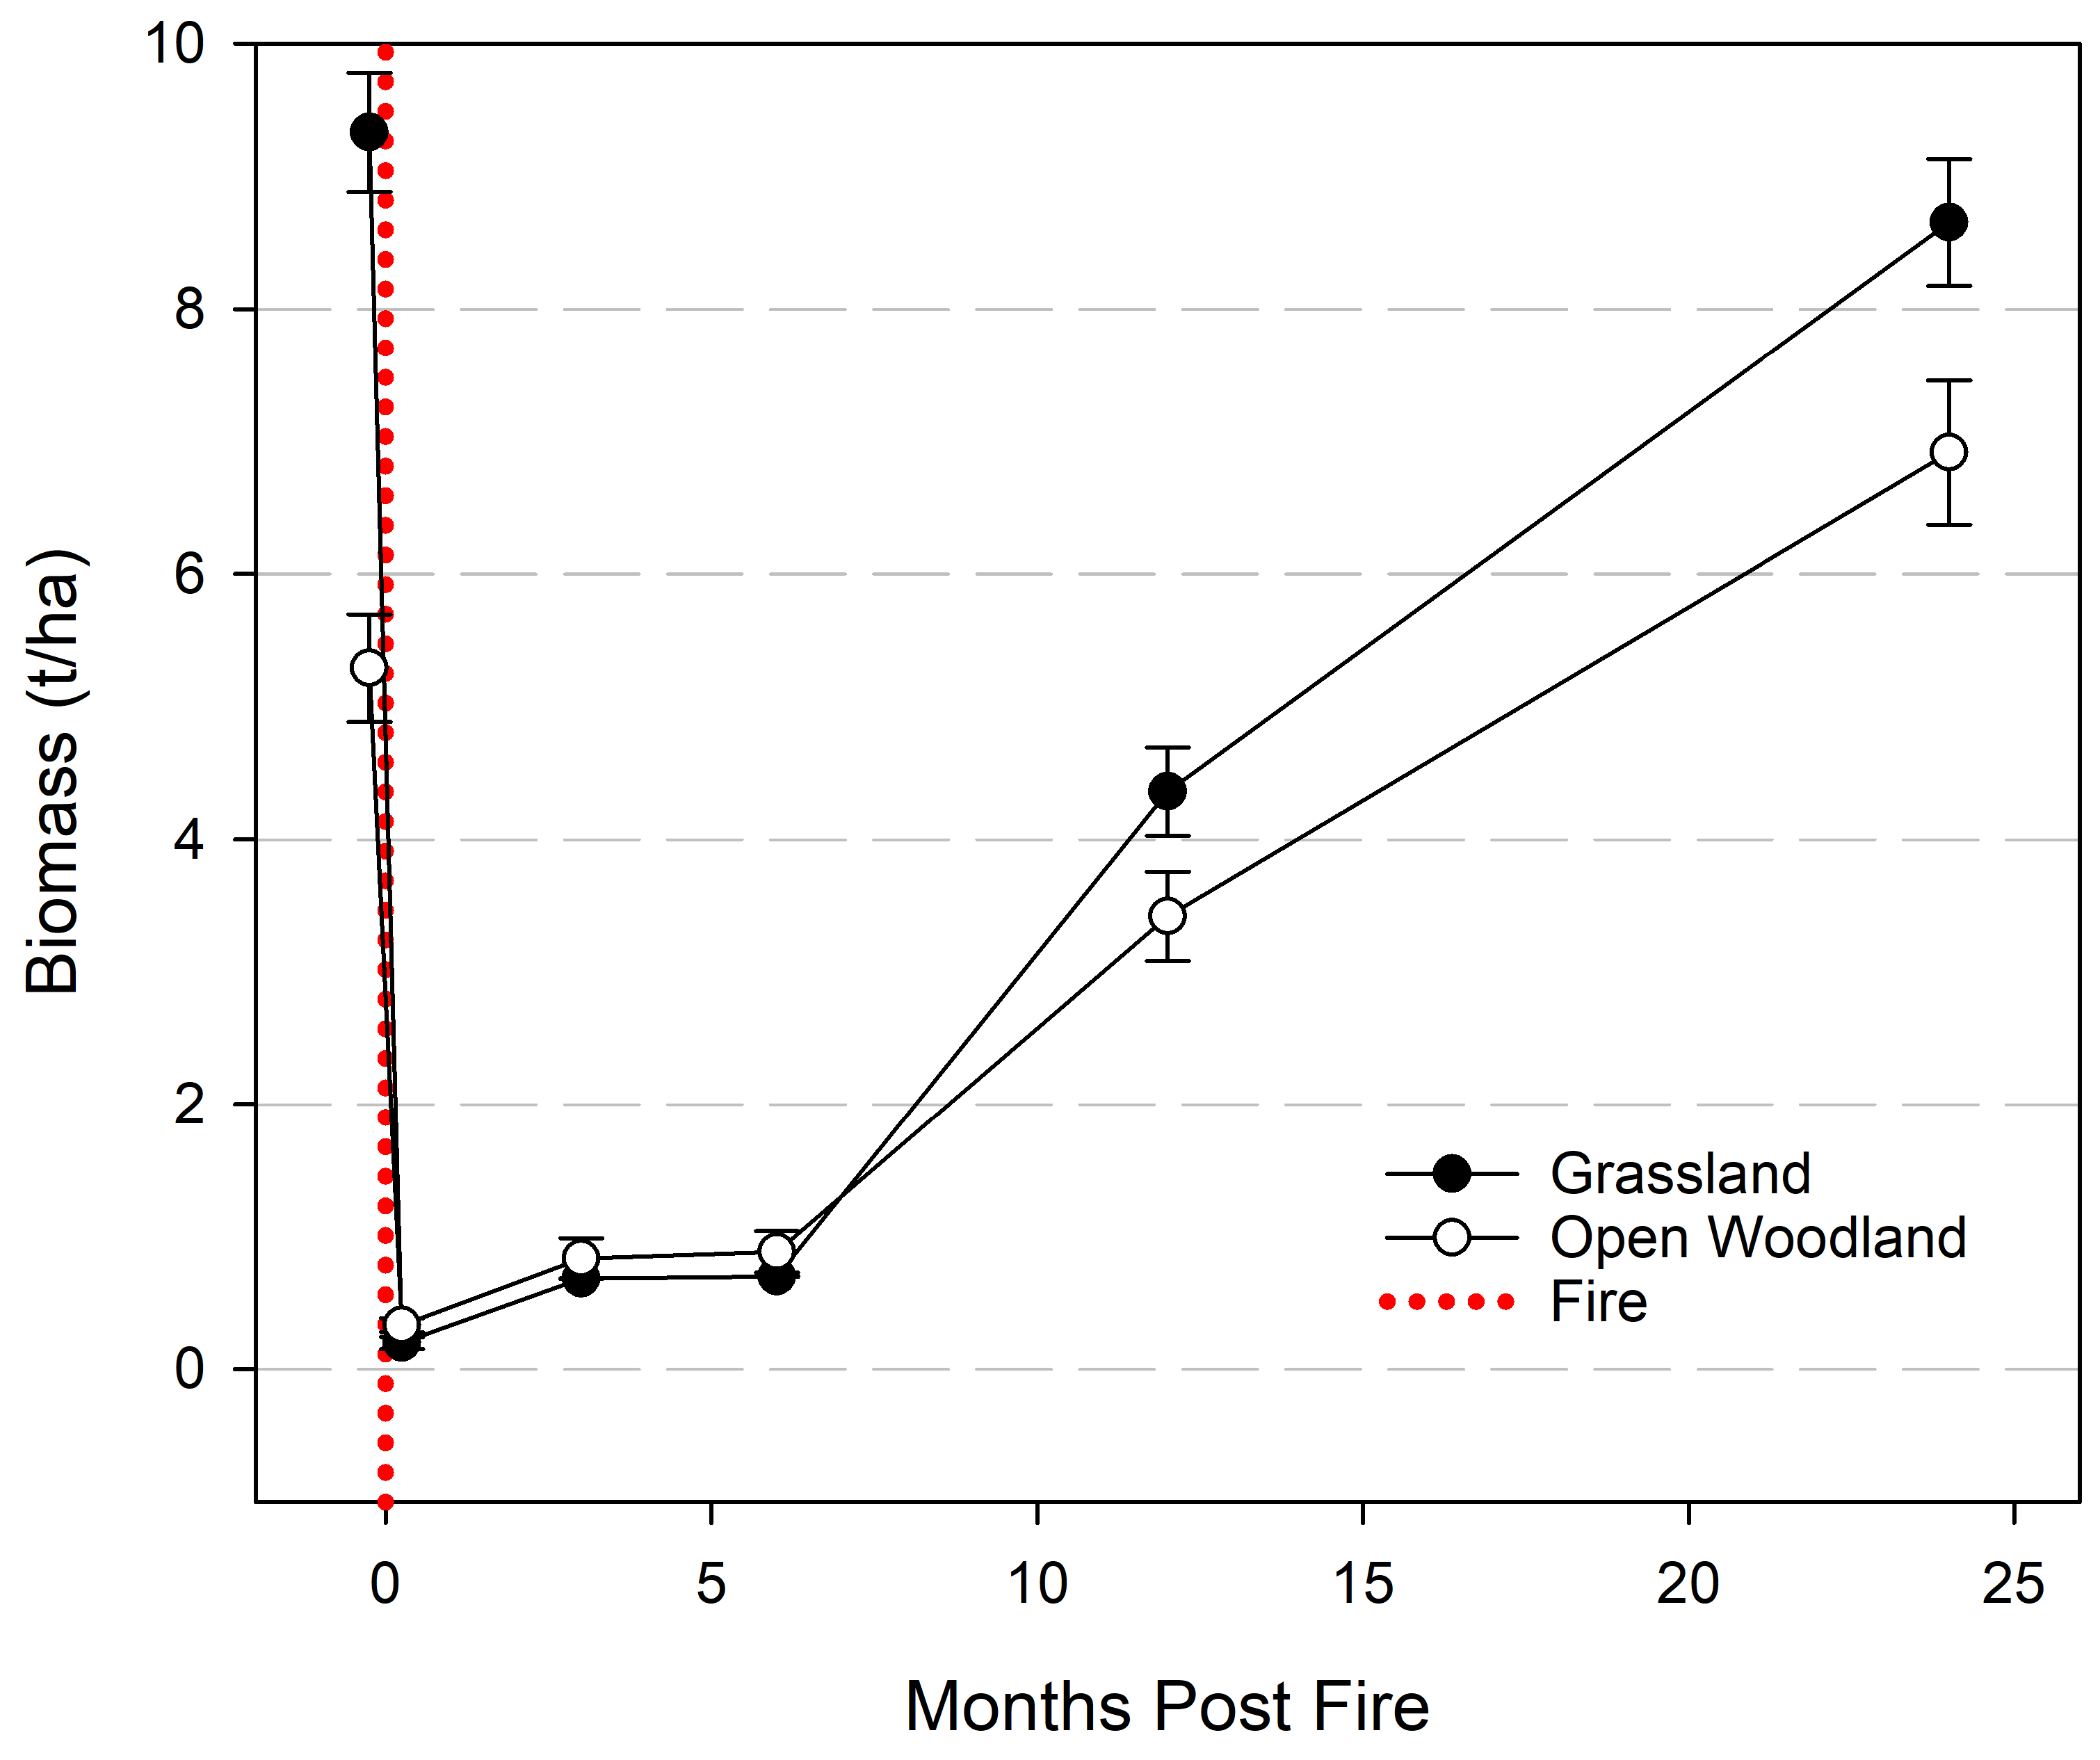
Figure 7b,d). The in situ field biomass observations support this result, showing biomass loads on open woodland transects above pre-fire levels and recovering faster than on grassland transects (
Figure 6). This finding suggests that although grassland areas are recovering rapidly (as demonstrated in
dNDVI recovery maps), they have still not returned to pre-fire levels. To support this finding, it can be seen that grassland areas were more heavily impacted in the fire as shown by a greater reduction in NDVI and NBR after the burn (
Figure 7a,c) and as a result, these areas may take longer to return to pre-fire levels. Additionally, field surveys recorded a high tree mortality in open woodland areas, followed by significant acacia root suckering and buffel grass growth beneath dead canopies (data not shown) and this is likely to contribute to a greater increase in NDVI and NBR values compared to grassland areas.
It is clear that a high proportion of the site recovery occurred within the first 12-month window following the experimental fire. Other grassland fire studies have analyzed time-series recovery within the first six months post-fire with multiple images to show the first recovery steps [
42]. Field observations indicate that the biomass recovery occurred in the 6- and 12-month post-fire window (
Figure 6 and
Figure 9), which for this study site corresponds to the period between the late dry season and the end of the first wet season. Attempts were made to capture imagery during the 6- to 9-month post-fire window, but these were unsuccessful due to cloud cover in the imagery.
Commission errors were evident in the fire severity and recovery maps, with a number of large areas recording high severity that are present outside the burn perimeter. These commission errors were attributable to a number of factors including: (i) water bodies in the imagery that became increasingly wet through the time-series (water bodies have been shown to be confused with burnt areas in previous studies) [
69]; (ii) land-cover changes between image captures where earthworks have created bare areas (this is particularly notable in the south east corner of
Figure 4c (when compared with the same locations in
Figure 3c,e)); (iii) increased shadow as a result of topographic variations and sensor viewing angle; and iv) georeferencing errors in areas of extreme topographic variation to the south of the fire site (for example steep road ramp areas associated with mine infrastructure).
Another limitation to this study includes the timing of the post-fire field severity survey, which was conducted three months after the immediate post-fire image capture. Although this time delay may theoretically be problematic, the dry season conditions resulted in negligible rainfall (
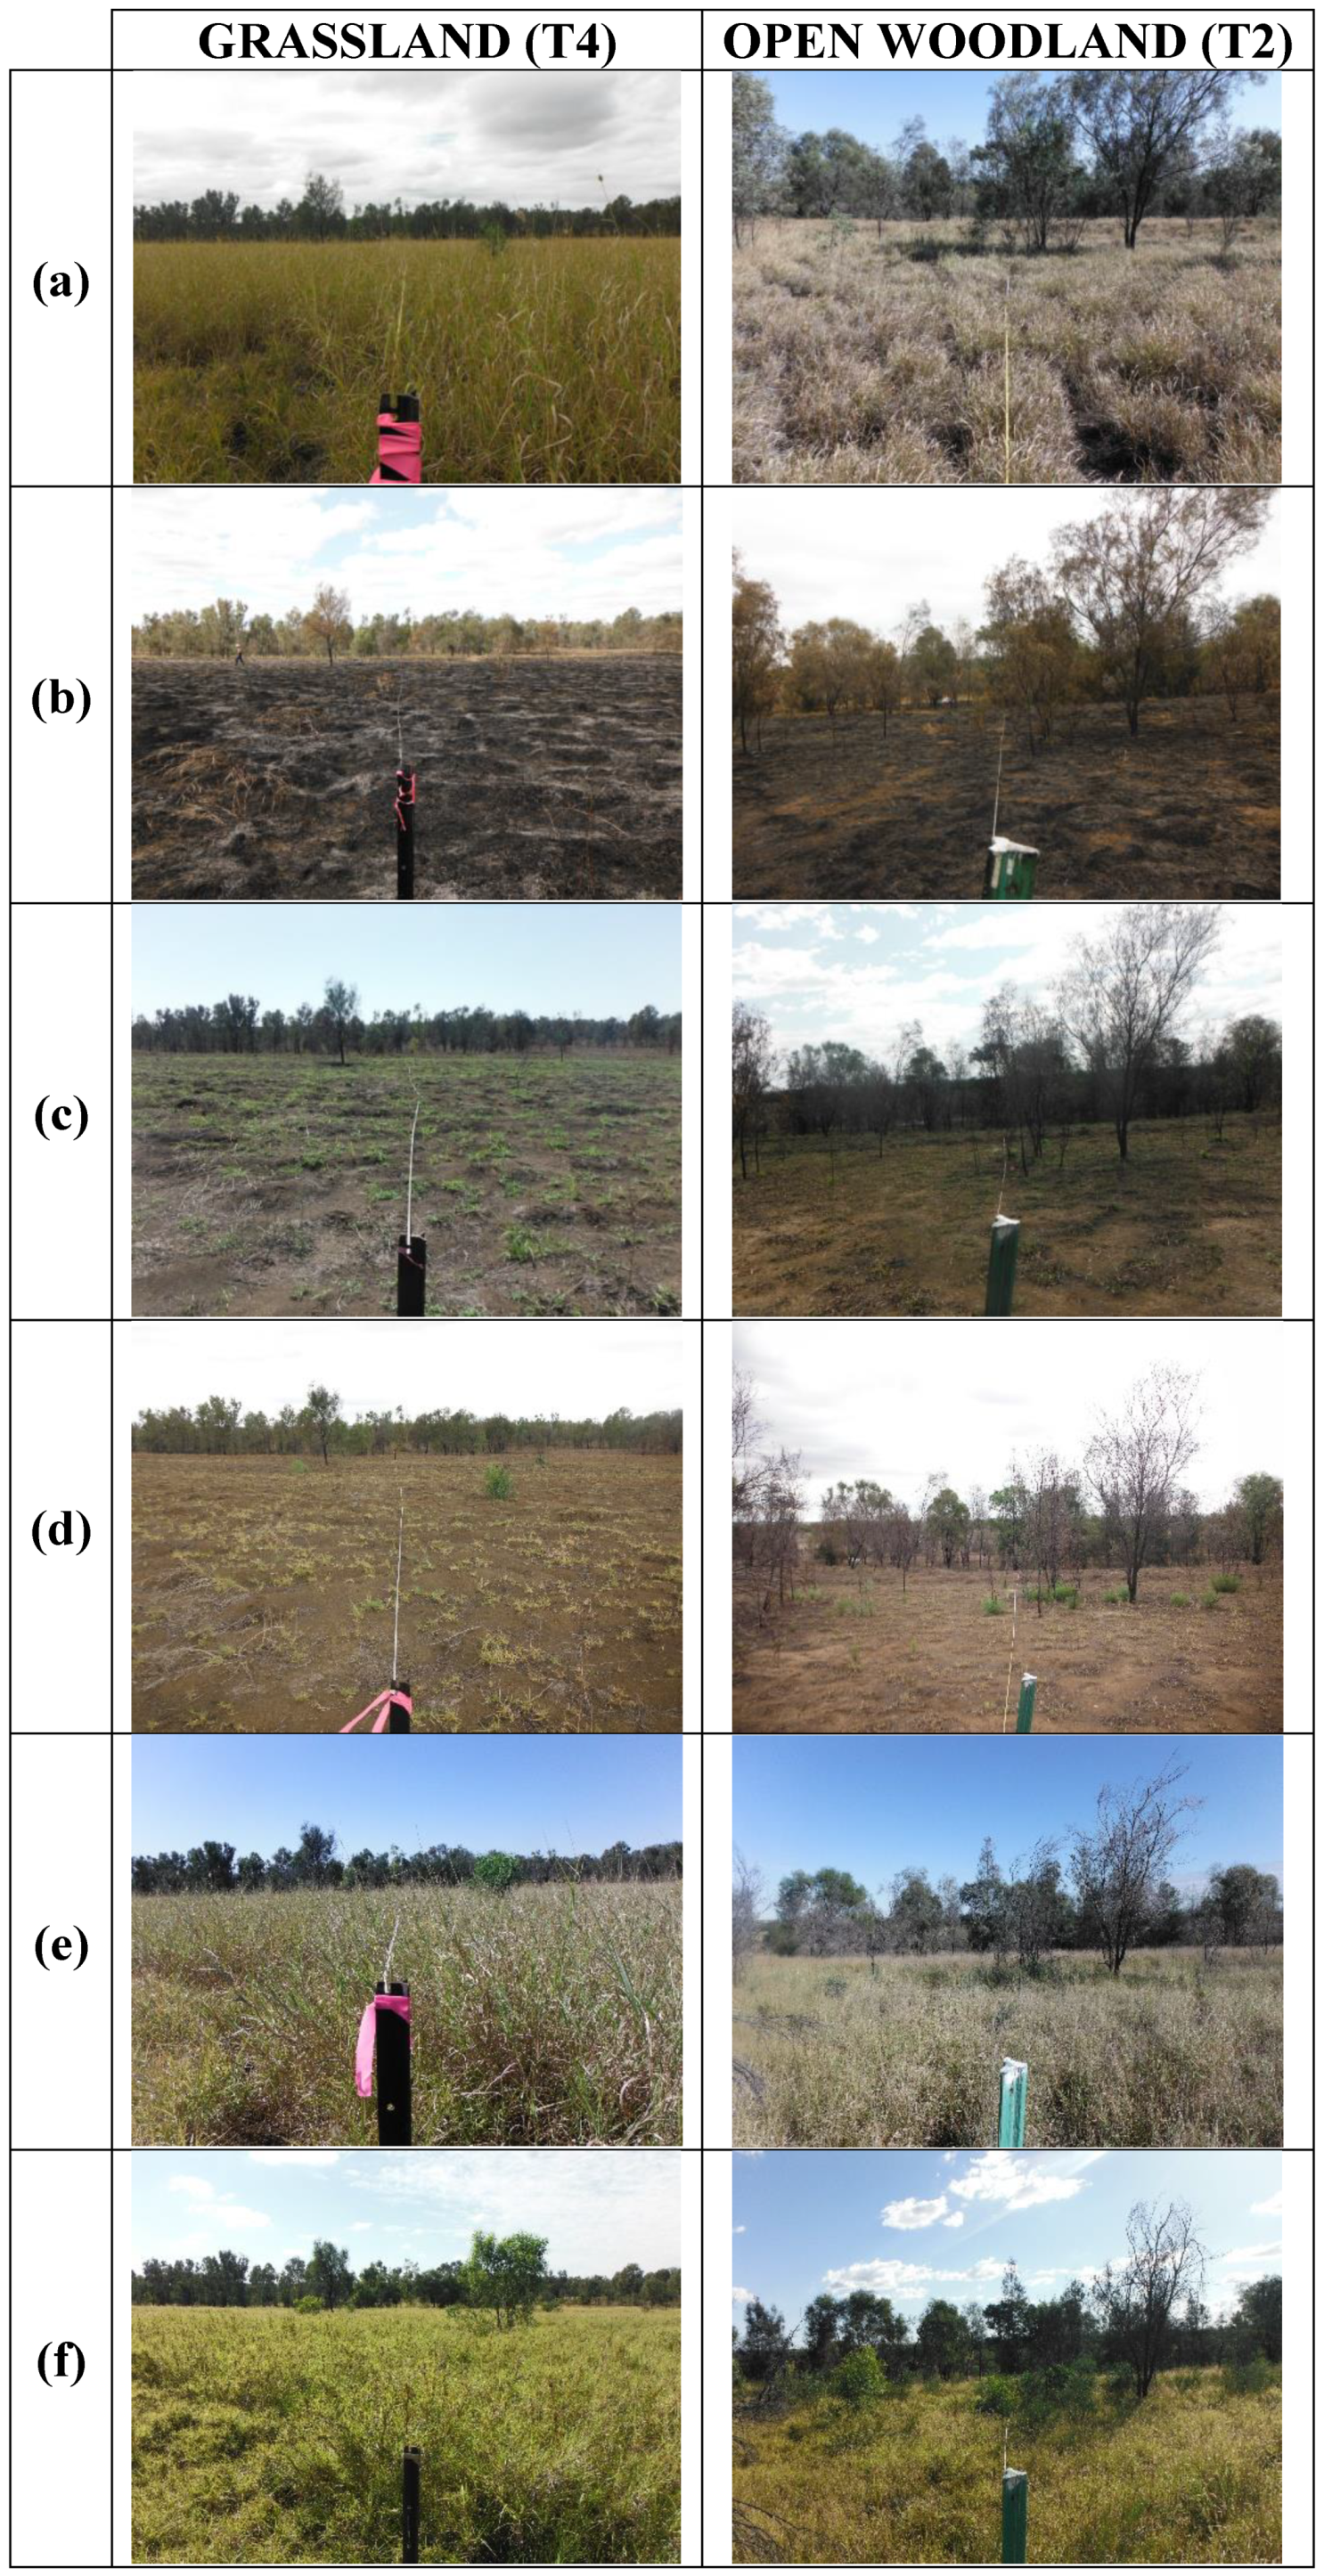
Figure A3), and only minor vegetative changes had occurred, such as the initial re-sprouting of buffel grass and first litter fall from some of the impacted trees. Residual ash was still clearly visible across the site, as was charred vegetation and scorched leaves on trees. This is also notable in the relative slow recovery of biomass in the 3- and 6-month post-fire biomass assessments (
Figure 6) and field transect photos (
Figure 9). However, it is possible that this temporal discrepancy may have contributed to the reduced class accuracy recorded in the low severity and unburnt classes for both indices, due to potential underestimation of fire severity by field workers.
While studies have highlighted heterogeneity of surface features as being problematic for fire mapping in comparable environments such as savanna grasslands and woodland [
31,
70], this study demonstrates that remote sensing spectral indices can be used to quantify disturbance impacts, vegetation recovery and resilience on highly heterogeneous landscapes. Indeed, the site preparation methods employed during the rehabilitation of coal mine sites within the study region have resulted in fine scale heterogeneity that is unique to rehabilitated landforms, often with no natural analogue. Despite this, the use of high spatial and temporal remote sensing technology to the application of restoration science is highly suited and can be applied at local scales ranging from 1 to 100+ km
2. Further, rehabilitation managers have the opportunity to utilize remote sensing and target approaches to monitoring and remediation for areas that have been impacted by fire, drought, insect attack, flood or cyclone damage and demonstrate to stakeholders the recovery success of rehabilitated areas.
