Abstract
Reconstructing historical fire regimes is difficult at the landscape scale, but essential to determine whether modern fires are unnaturally severe. I synthesized evidence across 725,000 ha of montane forests in the San Juan Mountains, Colorado, from forest atlases, forest-reserve reports, fire-scar studies, early reports, and newspaper accounts. Atlases mapped moderate- to high-severity fires during 1850–1909 (~60 years), and 86% of atlas area was attributable to 24 fire years. Historical fire rotations from atlases were mostly 225–360 years for high-severity fires and 133–185 years for moderate- to high-severity fires. Historical low-severity fire from tree-ring data at 33 sites revealed a median fire rotation of 31 years in ponderosa pine, 78 years in dry mixed-conifer, and 113 years in moist mixed-conifer forests. Only 15% of montane sites had “frequent-fire” forests with fire rotations <25 years that kept understory fuels at low levels. Moderate- to high-severity fire rotations were long enough to enable old-growth forests, but short enough to foster heterogeneous landscapes with expanses of recovering forests and openings. About 38–39% is still recovering from the 1850–1909 fires. Large, infrequent severe fires historically enhanced resilience to subsequent beetle outbreaks, droughts, and fires, but have burned at lower rates in the last few decades.
1. Introduction
Evidence about historical fire across large landscapes is needed even though climatic change is shifting fire regimes. It is essential to accurately characterize and model historical variability to be able to correctly parse the climatic-change component of recent fire rates and patterns [1]. Historical fire also remains relevant as a guide for restoration. Research on historical ponderosa pine and mixed-conifer landscapes of the montane zone in the San Juan Mountains, Colorado, USA, was based on limited landscape-scale evidence, as this evidence was simply unavailable.
Limited landscape-scale evidence is not unusual for montane forests, but this leaves an incomplete and possibly biased perspective on historical fire regimes. The problem is that tree-ring reconstructions, the main source of evidence about historical fire regimes, are difficult to execute at scales exceeding ~10,000 ha. In the San Juan Mountains, only two fire-history studies have been able to reach scales of 7000–8000 ha [2,3] in a mountain range with >750,000 ha of montane forests. Tree-ring studies in smaller areas can provide invaluable, but potentially biased samples of large landscapes, particularly if focused in old forests to obtain long records of fire [4]. Old forests typically have persisted because they did not have intense wildfires that killed many trees, thus may inherently underestimate fire intensity in larger landscapes [4]. Probabilistic studies that used early aerial photographs, land-survey records, or systematic early records across large landscapes are relatively few. These have shown that, where studied, historical montane landscapes in the western USA were much more diverse in forest structure, than shown by tree-ring studies, because of variable fire regimes that included some severe fires that killed many trees [5,6,7]. Thus, the key question addressed here, where spatially comprehensive, probabilistic evidence was until now not available, is whether historical fire regimes in the montane zone of the San Juan Mountains were also diverse and included large, severe fires? Evidence presented here shows that large, severe fires did also occur historically in ponderosa pine and mixed-conifer landscapes of this large mountain range.
I used a new source, historical forest atlases, with tree-ring reconstructions and corroboration by early documents, to reconstruct historical fire regimes across a large part of the montane landscapes of the San Juan Mountains, Colorado to add to a previous synthesis [8].
Background on Sources for Reconstructing Montane Historical Fire Regimes in the San Juan Mountains
How can multiple sources be used to reconstruct historical fires and fire severity across large landscapes? First, fires left surviving trees with fire scars that provide potential fire dates and estimates of rates of fire, particularly low-severity fires [4]. Studies typically reported mean/median intervals between fires in a composite list of fire dates found on any tree in a set of trees in a study site. These mean or median “composite fire intervals (CFIs)” [9] are based on counts of fires, a rough measure since fires vary substantially in area. Land managers need estimated area burned, not just counts. The key spatial estimator is the fire rotation, the expected time (in years) for fire to burn across a particular land area once, estimated by adding up areas burned by fires over some period of observation in a study area, then dividing the period by the fraction of the area burned [4,9]. Thus, if 20 fires together burned area equal to half a study area in 10 years, then the fire rotation was an estimated 20 years. From analysis of CFI studies spanning dry forests in the western United States, I found it possible to estimate low-severity fire rotations from CFIs using regression [4].
Second, some fire-scar studies also collected age-structure data, from trees, that allow reconstruction of fire severity, by showing, for example, whether fires had few survivors and were followed by pulses of tree regeneration [10]. Fire severity, effects on tree populations, is often characterized as low severity if ≤20% of the basal area of trees was killed, moderate severity if 20–70% was killed, and high severity if ≥70% was killed [11]. Stand-origin data, usually obtained by dating the largest trees, can be used to estimate when stands originated after high-severity fires [2].
Third, maps are available showing areas burned by fires in the late-1800s and early 1900s on some National Forests. Soon after creation of National Forests, in and after 1905, staff were tasked with completing maps [12], using surveyed plats, showing topographic contours, natural features (e.g., lakes, streams), and human uses (e.g., towns, railroads, timber claims). These were typically done in black and white at 1″ to 1 mile (1:63,360) scale or better on 45.7 × 53.3 cm (18″ × 21″) sheets assembled in a “folio” for each forest [12]. Graves [13] reported that 190 folios and nearly all National Forests had been mapped. Some forests added color maps showing grasslands and shrublands, timber volume, fires, blowdowns, insect mortality, logging, and cultivation, a choice left to each forest [12]; most chose not to add this information. Maps were made in the field by plane table and compass surveys, using chaining to measure distances, often supplemented by prior topographic mapping. Mapping followed standards, including consistent coloring [12,13]. I used color 1908–1909 forest atlases for three forests (Montezuma, San Juan, and Rio Grande) in the southern 2/3 of the San Juan Mountains. The rest of the San Juan Mountains was not apparently mapped in color.
Fourth, prior to the establishment of most National Forests, a “forest-reserve” report was completed by government scientists that described the condition of the forests, including some assessment of fires, as well as human activities (e.g., logging, roads) in the forests. We used forest-reserve reports to assess historical fire and forest conditions in other parts of the Rocky Mountains [14]. I used the Dubois [15] forest-reserve report on the eastern part of the current San Juan National Forest and the southern Rio Grande National Forest and the Dubois [16] forest-reserve report on the Montezuma National Forest, now the western part of the current San Juan National Forest. Fifth, an early report by Michelsen [17] provided maps of large fires in 1900 in Colorado, along with estimates of area burned by county and descriptions of some of the fires. Finally, miscellaneous early newspaper reports, forest histories, and other early documents corroborate some fires and describe some of their details.
2. Materials and Methods
2.1. Study Area
The study area in the southern San Juan Mountains, Colorado contains six large watersheds over ∼1.7 million ha, about 2/3 of the mountain range (Figure 1a). The study area is limited to this area, because forest atlases with fire information cover only these watersheds. In addition, fire-history data from tree rings are available only for five of these watersheds and only four have >1 site. The San Juan and Montezuma forest atlases are on the moister west side of the continental divide, and the Rio Grande forest atlas is on the drier east side.
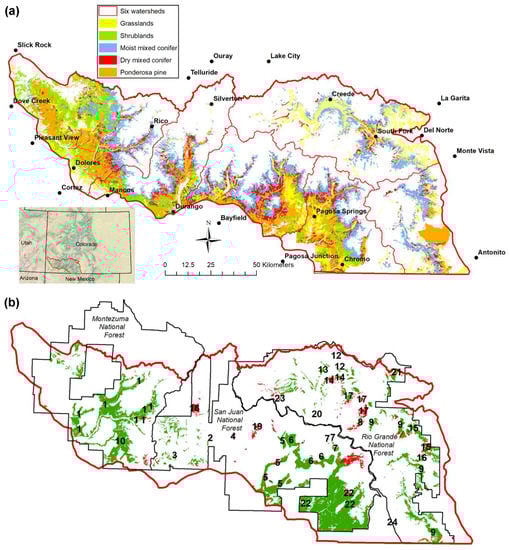
Figure 1.
(a) The full study area on the current San Juan and Rio Grande National Forests, Colorado, including their ponderosa pine, dry mixed-conifer, and moist mixed-conifer forest zones. The continental divide is between these forests. Watersheds are from left to right the Dolores, Animas and Mancos, Piedra and Florida, San Juan and Navajo, and Alamosa-La Jara-Conejos Rivers. The Rio Grande watershed is at the right and above these others. (b) The three atlas boundaries (black lines) and the fires (red) and woodlands (green) shown on the atlases within the area of ponderosa pine and mixed-conifer forests. Fires were likely mostly stand-replacing, and woodlands likely moderate- and high-severity fires, 1850–1909. Fire and woodland numbers are used in tables and text.
Montane forests in the San Juan Mountains have often been classified into: (1) ponderosa pine forests primarily with Pinus ponderosa and few other tree species; (2) dry mixed-conifer forests that have abundant ponderosa pine, but also common other trees, including possibly white fir (Abies concolor), blue spruce (Picea pungens), Douglas-fir (Pseudotsuga menziesii), southwestern white pine (Pinus strobiformis), or quaking aspen (Populus tremuloides); and (3) moist mixed-conifer forests that have some or all the above trees, except ponderosa pine is rare to absent and some subalpine trees (e.g., Picea engelmannii) may also occur [8].
To limit the study approximately to historical ponderosa pine and mixed-conifer zones, I made digital maps of the three forest zones (Figure 1a) from current forests and then added some aspen forests, grasslands, and shrublands. I first obtained maps, in the form of ArcGIS geodatabases (ESRI, Inc., Redlands, California), of current vegetation from the San Juan (n = 24,576 polygons) and Rio Grande (n = 54,536 polygons) National Forests. I began by extracting records from the “LOCAL_TYPE” field in each map that provided classifications of polygons, from remote sensing and field surveys, as ponderosa pine forests (TPP-PP), dry mixed-conifer forests (TMC-WD), and moist mixed-conifer forests (TMC-CM), the focus of this study. Current quaking aspen forests were not assigned in LOCAL_TYPE to the three forest zones. To assign aspen forests to the three forest zones, I extracted records for aspen forests without conifers (TAA), aspen forests with conifers (TAA-SW), and spruce-fir forests (TSF). For the TAA-SW category, I reclassified records as: (a) TMC-WD if the next most abundant tree, given in other fields in the attribute table, was Pinus ponderosa, Juniperus osteosperma, or Pinus edulis; or (b) TMC-CM if the next most abundant tree was Abies concolor, Picea pungens, or Pseudotsuga menziesii and there was little or no P. ponderosa. I deleted other records in TAA-SW, which generally represented subalpine spruce-fir forests.
Since associated conifers were not available for the TAA records, but some of these aspen stands likely also occurred in dry mixed-conifer (TMC-WD), moist mixed-conifer (TMC-CM), or spruce-fir (TSF) forest zones, I roughly estimated which zone to assign to each TAA record. To do so, I first exported the attribute data and completed a simple linear discriminant analysis (LDA, [18]) of these three types in Minitab 18 (Minitab, Inc., State College, Pennsylvania), based on their elevation, aspect, and slope, which were in the attribute table. I did not separate the data into model-building and validation subsets, or test predictive accuracy, because this is only a rough approximation from environmental setting. This LDA for the San Juan National Forest, correctly classified 77.9% of 15,516 records in these three categories. I then applied this LDA to all the TAA records (n = 2473), then kept records predicted as TMC-WD and TMC-CM and deleted all TSF. This procedure places records that represent seral, semi-persistent, or stable aspen [19], which cannot be discriminated with available compositional data, into its approximate mixed-conifer zone. I followed the same procedure for the Rio Grande National Forest map, where the LDA correctly classified 79.4% of the 16,308 records in these three categories. I again applied the LDA to all the TAA records (n = 1970), then kept records predicted as TMC-WD and TMC-CM and deleted all TSF. Both mountain grasslands, with Festuca arizonica, F. thurberi and other bunchgrasses, and mountain shrublands, with Quercus gambelii, Amelanchier utahensis, and other shrubs, could also in part have been forests in these zones in the historical period. There is substantial evidence that grasslands and shrublands can be created or renewed by severe forest fires in the Rocky Mountains [9]. I included those <2950 m elevation, in the ponderosa pine and mixed-conifer zones of the San Juan and <3140 m elevation on the Rio Grande. The resulting map is Figure 1a. These zones only delimit the extent of the area within which fires may have occurred that are likely within one of the current and historical montane forest zones.
The two current national forests in the study area contain ponderosa pine and mixed-conifer zones covering about 725,000 ha, about 3/4 on the current San Juan National Forest (Table 1, Columns 1–3). Moist mixed conifer totaled most area, ponderosa pine intermediate, and dry mixed conifer the least. The San Juan part of the study area had almost all the shrublands and the Rio Grande had disproportionate grassland area. Shrublands and grasslands covered substantial area.

Table 1.
Area of forests, shrublands and grasslands in the full study area and the atlas area (Columns 1–4), and the area of fires, woodlands, and total burned area, as well as rates of fire (Columns 5–11). Fire atlases show fire and woodland area from fires in forests over about the preceding 60 years, from 1850 to 1910.
2.2. Moderate- to High-Severity Fires from Forest Atlases and Early Reports
Forest atlases in the National Archives have been scanned and are available from several sources. I downloaded from the Biodiversity Heritage Library [20], the full folio of 17 maps published in 1908 for the Montezuma National Forest. I downloaded 15 available maps of 16 published in 1909 in the folio for the original San Juan National Forest. Map sheet #2 is missing from all archives; it may be missing in originals at the National Archives. I downloaded all 15 maps in the folio published in 1909 for the Rio Grande National Forest, only a part of the current forest; the northern part, the original Cochetopa National Forest, was done only in black and white without fire information. Similarly, atlases are available only in black and white for the Gunnison and Uncompahgre National Forests in the northern San Juans.
I georectified the scanned maps in ArcGIS 10.5 (ESRI, Redlands, California) using online U.S. Geological Survey (1:24,000 scale) topographic maps as the spatial reference, generally placing about 10–20 control points on each map sheet at section or township corners or distinct topographic features (e.g., mountain peaks and stream junctions). After rectification and mosaicking the maps in each forest, I used the ArcGIS measuring tool to measure the distance between the same feature at 30 points on the atlases and the topographic maps, then calculated the root mean square error (RMSE), a common measure of mapping error. RMSE was 572 m for the Montezuma, 630 m for the San Juan, and 555 m for the Rio Grande. In contrast, Kulakowski et al. [21] obtained a 173 m RMSE after georectifying an 1898 smaller-scale map. Thus, the forest atlases used here are not very spatially accurate. I could see that peaks, for example, were at times within 100–200 m, but other times were >1000 m off, suggesting variable accuracy, likely a consequence of variable visibility for plane-table mapping in complex mountain terrain.
Fires and woodlands are the atlas features of interest (Figure 2a). Atlas fires lacked many unburned areas, and mapping categories indicated stages of recovery (Figure 2b), which imply high-severity fire removed most trees. These were likely primarily fires in forests, because fires in grasslands and shrublands recover within a few years [9], so that fires are no longer visible and mappable, whereas forest fires are visible and mappable for several decades after the fire because of standing dead and down wood. As shown later, mapped fires were from more than a few years prior to the 1908–1909 atlases. Atlas fires are also corroborated as stand-replacing fires in forests (very high-severity fires) in two cases. The Rio Grande atlas (Figure 3b) records a stand-replacing fire reconstructed and dated to 1876 by Margolis et al. [22] at Squaw Creek (Figure 3a). An 1898 photograph (Figure 3d) shows the southern part of an atlas fire (Figure 3c), the 1879 Lime Creek burn (Table S1), which appears to have burned as stand-replacing fire over ~1000 ha of ponderosa pine and mixed conifer. Atlas fires were likely mostly stand-replacing fires in forests (sensu [2,22]).
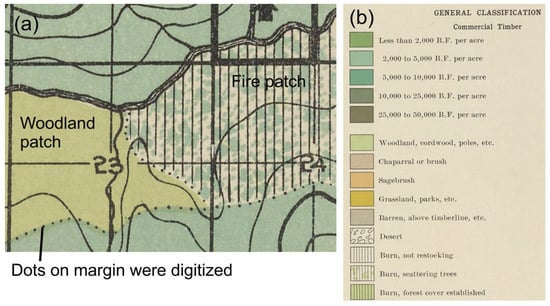
Figure 2.
Digitizing the atlas evidence: (a) zoomed view of a woodland patch and a fire patch, showing the dots that demarcate the margin of the patches; and (b) part of a legend, showing timber volumes and post-fire recovery classes.
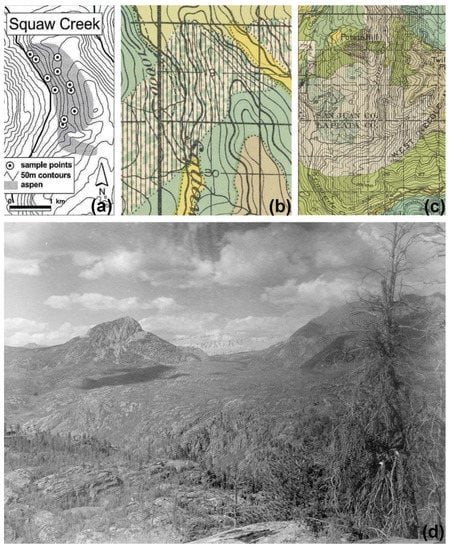
Figure 3.
Examples of two mapped atlas fires, showing they were stand-replacing fires (very high severity): (a) an 1876 fire dated by Margolis et al. [22] at Squaw Creek on the Rio Grande National Forest, © Canadian Science Publishing or its licensors; (b) the Rio Grande Forest Atlas representation of this fire, which appears to have extended over a larger area than the stand-replacing aspen focal area of the Margolis et al. study; (c) the 1909 San Juan Forest Atlas representation of the southern part of the 1879 Lime Creek Burn, which burned >1814 ha of ponderosa pine and mixed-conifer forests; and (d) about 1000 ha of this area in the southern part of the 1879 Lime Creek Burn, 19 years after the fire, photographed by Charles Whitman Cross, No. 370, original caption: “Potato Hill and slopes of West Needle Mountains from hill west of the mouth of Cascade Creek. Engineer Mountain quadrangle, San Juan County, Colorado. 1898” from the U.S. Geological Survey Denver Library Photographic Collection.
Woodlands are explained by Dubois in the Montezuma Forest-Reserve Report: “Woodland signifies all bodies of immature or worthless forest too large to be classed as brush or seedlings growth” [16] (p. 9). These are not woodlands in the modern sense, but instead mostly are burned areas with little timber. Dubois indicated that half of woodland area had very little timber volume: “Allowing an average stand of 3000 feet to the acre on the unburned commercial forest and 500 feet per acre on one-half of the woodland, which is conservative …” [16] (p. 11). Dubois attributed this half of woodland area with almost no timber volume (only 500 feet/acre) to past severe fires:
“It is safe to say that 50 per cent of the area classified as woodland has been run over and seriously damaged by fire …. These burns are in all stages, from areas covered with dead standing trees and down timber with no re-growth what so ever on the ground, such as the area at the head of Burnt Timber Creek in the La Plata, to large areas covered by stands of aspen of varying ages with a few scattering groups of conifers in mixture, such as are found on the hills on each side of the main Dolores along which runs the railroad”.([16]; p. 21).
Similarly, in the Cochetopa Forest-Reserve Report on the northern part of the current Rio Grande National Forest, just north of my study area, Hatton ([23]; p. 19) further explained: “Woodlands. Under this head are included lands which for the most part have been burned over and have since come up to lodgepole pine [Pinus contorta] or aspen” and “Burned-over forest lands [equivalent to atlas fires in the San Juan and Rio Grande forest-reserve reports] comprise the more recent burns, and differ from woodlands in that there is little or no reproduction to date. In time these areas will probably come under the head of woodlands”.
Half of woodlands thus represent high-severity fires that had a few more survivors than in the more stand-replacing atlas fires, or were older stand-replacing high-severity fires that had more post-fire regeneration by the time of mapping. The second half of woodlands more likely burned at moderate severity, given this half also was “immature or worthless forest too large to be classed as brush or seedlings growth” ([16]; p. 9). This second half had >500 feet to the acre of timber volume, but not much more, as the next category was “Less than 2000 B.F. per acre” (Figure 2b). Early reports, reviewed in Section 3.1, corroborate this half was also burned. Hatton’s quote above also indicates woodlands, including this second half, were mostly burned. Moderate- rather than low-severity fires are indicated by low timber volume in this second half, as low-severity fires do not keep timber volume so low. Low-severity fires likely spread between some mapped patches.
Some small parts of this second half of woodlands could also represent forests on naturally unproductive sites or from logging. At high elevations, some patchy treeline forests in mapped woodlands may not indicate preceding moderate-severity fires, nor may some very dry low-density woodlands, possible anywhere, but especially on the Rio Grande side. Woodlands were not described as from logging [15,16]. Moreover, “cuttings” are a separate category in atlas legends and are mapped elsewhere, but not adjacent to, or within woodland areas. Some woodlands could possibly have resulted from railroad logging in the Pagosa Springs area (Figure 4a), the main area on the San Juan side described in 1903 as having logging [15]. Some railroad logging had also begun east of Dolores (Figure 4b) in 1907–1914 [24]. Tracks were laid during 1899–1900 from Pagosa Junction to Pagosa Springs and from Edith to southeast of Pagosa Springs (Figure 4a) during 1902–1904 [18]. Logging began quickly, with sawmills at Edith, Chromo, Pagosa Junction, and Dyke, and was done or well underway by the time of the atlases. It is unclear how far from the tracks logging occurred. The government restricted cutting to the immediate vicinity of the right-of-way, but timber companies assumed they could cut any timber reachable by spurs or by horse or oxen [25]. Routes avoided woodlands in several areas (Figure 4a), clearly targeting larger timber, and later railroad logging north of Dolores (1924 to 1948) avoided most woodlands (Figure 4b), corroborating they had little timber to log. In the area north and east of Dolores, timber claims were mapped only among larger timber later railroad logged, not within woodlands. Claims scattered within woodland areas near Pagosa Springs were mostly homestead claims, with few timber claims. Logging on the Rio Grande side primarily selected Douglas-fir for ties on the South Fork of the Rio Grande [15], likely not reducing timber volume to low levels. Thus, this second half of woodlands was likely mostly from moderate-severity fires, occasionally from environmental limitations, but seldom from logging.
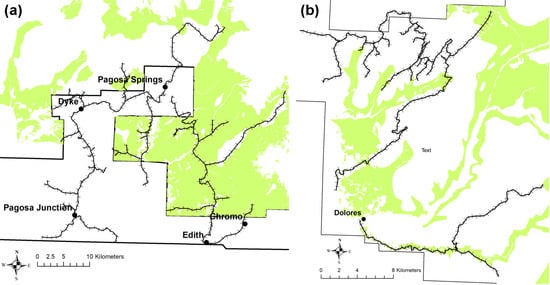
Figure 4.
Logging railroads through ponderosa pine and mixed-conifer landscapes in: (a) the area near and south of Pagosa Springs; and (b) the area north and east of Dolores. Woodlands are shown in green. Railroad locations were digitized from maps in Ormes [24] and Chappell [25], and from online U.S. Geological Survey topographic maps that may show old railroad grades.
Using the georectified forest-atlas mosaics as the backdrop, I zoomed in on screen and hand digitized the boundaries of each atlas fire or woodland polygon, following dots used to demarcate feature boundaries (Figure 2a). Fires are identified in map legends by vertical cross-hatched lines (Figure 2b) and woodlands by light green shading (Figure 2a). The resulting digitized fires and woodlands are available (Data S1). The georectified forest-atlas mosaics are also available (Data S2).
In analyzing the forest-atlas data, I restricted analysis of fires and woodlands to the area of ponderosa and mixed-conifer forests, inside the six watersheds in the San Juan Mountains, that was also within area covered by the atlases (Figure 1b). On the San Juan side, the full area of ponderosa pine and mixed-conifer forests was 539,247 ha, but the atlases covered 421,898 ha (78%). On the Rio Grande side, the full area of ponderosa pine and mixed-conifer forests was 185,429 ha, but the atlas covered 140,695 ha (76%). Total atlas area in the ponderosa and mixed-conifer zones was 562,593 ha (78%) of the 724,593 ha in the full area of ponderosa and mixed conifer (Table 1, Columns 1–4). I used ArcGIS to analyze atlas areas and atlas fires and woodlands (Figure 1b) within the ponderosa pine, dry mixed-conifer, and moist mixed-conifer zones (Figure 1a) of the study area.
I used tree-ring studies and early records to corroborate atlas fires and the extent to which woodlands represented fires and particular fire years. The 1700–1909 period, most likely the later part of it, likely includes the historical period in which I hypothesized that atlas fires and woodlands were most likely to successfully detect fires, since evidence of fire disappears over time. A key question is: to what extent and how far back were dated or recorded moderate- to high-severity fires in this period actually recorded as fires or woodlands in the atlases? I analyzed this by counting fires, known from tree-ring studies and early records (Table S1), that were correctly or incorrectly detected by atlas fires or woodlands. Since atlases are at 1:63,360 scale, and have substantial locational error, larger fires were likely mapped best, locations may have been displaced, and there were likely some omissions. To address fire size, I categorized each fire at tree-ring sites by its size. It is also likely the most recent (first) moderate- to high-severity fires would be mapped best, because evidence would be most visible and freshest, and little of it had been burned over by subsequent fires. To address this, I numbered fires at each site in inverse order by year, and calculated the percentage of fires, by severity if available, correctly identified. Seven tree-ring studies analyzed age structure [10,26,27,28,29,30,31], which can be used to reconstruct fire severity [10], and three others dated stand-origins to identify high-severity fires [2,3,22]. I used these ten studies to identify years and locations of historical moderate- to high-severity fires. I mapped study sites to enable overlays.
Since atlas fires and woodlands were generally corroborated (see results), I analyzed attributes of the resulting sets of atlas fires and woodlands, in the area of ponderosa pine and mixed-conifer zones, inside atlas areas. I first calculated total area of fire burned at high severity, based on the report of Dubois [16], that about half the area of woodlands represented severe, high-severity fires and evidence that atlas fires represented mostly stand-replacing fires, also high-severity fires. I then assumed that all atlas woodland area plus all fire area equals area burned at moderate- to high-severity combined. I calculated fire rotations as 60 years/fraction of the total area burned within the ponderosa pine and mixed-conifer area and by forest zone. Use of 60 years is explained in Section 3.1. I graphed a size distribution for severe parts of better-dated fires. The evidence and these methods allow only an approximation. Dubois’ estimate is based on detailed field examinations, but is only a rough summary. Results may overestimate by including some areas that were woodlands because of environmental limitations, not fires. However, results may underestimate by omitting smaller fires (see results), and some area mapped as fires and woodlands may have burned more than once.
To provide some independent corroboration for the approximations, I separately estimated fire rotations for both high- and moderate- to high-severity fires at 19 smaller tree-ring sampling sites where moderate- to high-severity fires were reconstructed as present or absent from 1700–1909. I used only smaller sites, excluding Tepley and Veblen’s sites [10] where fires were mapped, and the Romme et al. [2] and Aoki [3] sites, because the purpose was to use presence/absence at points, not areas, and only from scar-based tree-ring reconstructions, not stand-origin dating, to independently estimate fire rotations. Since a landscape sample of points estimates the population mean fire interval (PMFI), and PMFI is equivalent to the fire rotation [9], this provides an independent, potentially corroborating estimate, although these point estimates are not a probabilistic sample.
2.3. Low-Severity Fire Rotations and Fire Years from Tree-Ring Studies
Nine fire-scar studies provided data about fire frequency, particularly for low-severity fires, in these forests [10,26,27,28,29,30,31,32,33]. Data are only available for the southern and western part of the San Juan Mountains, except one site at Hot Creek on the eastern slope of the San Juan Mountains (Figure 5a). I used regression equations in Baker [4] to estimate fire rotation from reported mean/median CFI estimates in the nine studies (Table 2). These are simple linear regression equations without an intercept, that can be applied to reported CFI estimates by multiplying the CFI estimate by the regression coefficient, given in [4] (Table 2). Equations are preliminary for nine moist mixed-conifer sites, which were not in the calibration, but these likely are still reasonable estimates. I extracted data on mean or median CFI for all fires, for ≥10% scarred, and for ≥25% scarred, which represent increasing fire sizes, from all the sites used in each fire-history study, placed these in a spreadsheet and did the multiplication in Minitab. Reported CFIs are for all fire severities combined, not just for low-severity fires, which would have longer rotations if moderate- to high-severity fires were excluded [4]. I converted fire rotations to annual probabilities, then subtracted moderate- to high-severity fire rotations from all-severity fire rotations to derive low-severity fire rotations [4]. Input data are in Table 2. I placed study sites in the three forest zones using author determinations. I mapped approximate locations of each study site in ArcGIS, using author descriptions and maps. These data are available in a digital shapefile (Data S3).
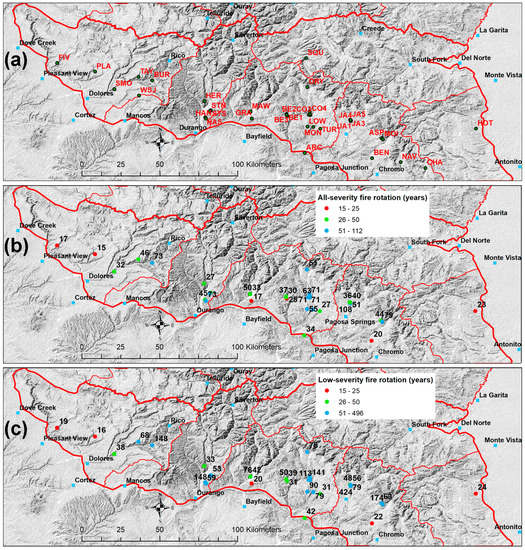
Figure 5.
The 33 study sites listed in Table 2 and the three stand-origin sites (WSJ = western San Juans [2]; SQU = Squaw Creek [22]; CHA = Chama [22]): (a) site names are generally abbreviated by their first two or three letters; (b) the estimated historical all-severity fire rotation (years) at each site; and (c) the estimated historical low-severity fire rotation (years) at each site. The red lines are boundaries for the six watersheds, which are from left to right the Dolores, Animas and Mancos, Piedra and Florida, San Juan and Navajo, and Alamosa-La Jara-Conejos Rivers. The Rio Grande watershed is at the right and above these others.
Table 2.
Fire-history data for composite fire intervals (CFIs) and their corresponding estimated fire rotation (FR) in ponderosa pine (Ponderosa), dry mixed-conifer (Dry MC), and moist mixed-conifer (Moist MC) zones.
Fire rotation data were not normally distributed. I completed a Kruskal–Wallis nonparametric test of the null hypothesis that median low-severity fire rotations differed among the three forest zones, at α = 0.05. In Minitab, I produced summary statistics (e.g., median) across all 33 study sites and separately within each of the three forest types, then a scatterplot to help understand potential influences of elevation, aspect, and forest zone on fire rotations. This led to regression analysis to determine whether elevation, aspect, or forest zone could predict rotations.
2.4. Fire Information from Forest-Reserve Reports, the Michelsen Report and Other Early Sources
The Forest-Reserve reports [15,16] provided descriptions of the forests, including their understories, and descriptions of fires and woodlands. I used these to cross-check and corroborate other sources. Henry Michelsen of the Colorado Forestry Association published an account of fires in 1900, which he reported burned >200,000 ha in Colorado, including estimates of area burned by county and a map showing general areas burned [17]. I specifically sought early newspaper accounts of the 1900 fires by searching the Colorado Historic Newspapers Collection [34], which allows multiple papers to be searched, using publication-date ranges and other constraints. I searched other early historical records, including forest histories, for any information about historical fires.
3. Results
3.1. Moderate- to High-Severity Fires from Tree-Rings, Early Records, and Forest Atlases
Nine tree-ring studies found 28 years with moderate- to high-severity fires during 1700–1909 (Table 3). Reconstructing fire size was not a goal and most sites were small: nine <500 ha, four 1100–1600 ha, and two 7000–8000 ha [2,3]. Maps of fire years were reconstructed at two 1330–1340 ha sites [10]. These studies show that severe fires occurred, but not their spatial extent.
Table 3.
Moderate- to high-severity fires during 1700–1909 identified by tree-ring studies that reconstructed historical fire severity. There were fires before 1700, but this period is most relevant to whether atlas fires and woodlands detect these fires in historical forests.
Atlas fires and woodlands detected fires found at these tree-ring sites (Table 3), but only back to about 1850. I found that, among first fires, some were correctly detected by fires or woodlands back to 1851, but none was correctly detected prior to 1851. Of first fires during 1851–1909, four of four large fires (100%) were correctly detected, but only four of eight medium fires (50%) were correctly detected, and none of four small fires (0%) was correctly detected. Among first and second fires, the trends were similar: none was correctly detected prior to 1851, and only the largest fires were all correctly detected after 1851. Sites that had only low-severity fires in the 1800s were all correctly detected (Table 3). Atlas fires and woodlands may thus generally detect large fires over the period since about 1850 or over about 60 years prior to the atlases, but about half the medium and most small fires were likely not mapped, thus total burned area would be underestimated somewhat and fire-size distributions would underestimate smaller fires. Atlas fires and woodlands can be seen in shapefiles (Data S1).
It was possible to identify 24 moderate- to high-severity fires in atlas fires and woodlands, and the years they burned, between about 1850 and 1909, or at least narrow the range of possible years (Table S1, Figure 1b, and Table 4). Larger fires often had parts that burned in separate fire years or dating could only be narrowed to a set of possible years. The 24 fires covered 86% of total area of atlas woodlands and fires within the ponderosa and mixed-conifer zones. The remaining 14% was undocumented in early reports, tree-ring dates or other sources I found. Entries for reported fires (Table S1) corresponded with atlas woodlands and fires in 41 of 57 cases (72%); the other 28% were either small or medium-sized fires the atlases do not detect well (Table 3) or were vague or likely incorrect. Most reported moderate- to high-severity fires during 1850–1909 were recorded in atlas fires and woodlands (Table S1). More recent fires were better corroborated. The 1900 fires had newspaper accounts and a report [17]. Two large fires, fire 1 on the Dolores River, and fire 22 south of Pagosa Springs (Table 4), need more dating or records. Two atlas fires, in 1876 and 1879, are shown to be reasonably mapped relative to independent sources (Figure 3). Fire locations were usually reported relative to drainages or other physiographic features and mapped locations were quite similar in most cases (details in Table S1). Fire sizes were seldom reported or estimated, but one atlas fire (Fire 4) and two large fires from both atlas fires and woodlands (Fires 6 and 9) had mapped sizes and locations that were quite similar to reported fire sizes and locations. Another from both atlas fires and woodlands (Fire 19) appeared quite similar but a map is missing that completes the fire area. Together, these corroborations support the interpretation that atlas fires were very high severity (stand-replacing) and atlas woodlands were mostly also burned severely.
Table 4.
The 24 moderate- to high-severity historical fires identified between about 1850 and 1909 on the San Juan (SJ) and Rio Grande (RG) National Forests using atlas woodlands (Wood.) and fires, early historical reports, and tree-ring studies (details in Table S1). Fires are ordered by years, and possible years include all the years that may have affected parts of the woodland or fire polygons. MC = mixed conifer. Total area is for ponderosa pine and mixed-conifer forests and associated grasslands and shrublands.
Accounts of fires in Michelsen [17] and newspapers offered vivid early evidence of severe fires in 1900, as compiled in Table S1. For example, Michelsen reported large 1900 fires on the Rio Grande side, particularly Fire 9: “The length of the path burned over was about forty-five miles” and one (Fire 6) north of Pagosa Springs on the San Juan side in which “some forty square miles (10,364 ha) of Yellow Pine forest were burnt over” [17] (p. 59).
High-severity fire rotations from atlas fires and woodlands overall were 289 years on both sides of the study area, and were mostly in the range of about 225–360 years in all three forest zones on both sides of the study area, except 1145 years in ponderosa pine on the Rio Grande side (Table 1). High-severity fire rotations were generally shortest in moist mixed-conifer forests and longest in ponderosa pine forests. Combined moderate- to high-severity fire rotations were 154 and 158 years overall on the two sides of the study area, mostly 133–185 years in forest zones, except 688 years in ponderosa pine on the Rio Grande (Table 1, Columns 5–11). Note that these are approximations in part because only 60 years of data, a fraction of a full rotation, are available from the atlases.
Fire rotations from tree-ring reconstructions (Table 3) were 235 years for high-severity fire and 166 years for moderate- and high-severity fire from 1700–1909, in the same ballpark as the atlas’ 289 year high-severity and 154–158 year moderate- and high-severity fire rotations. Point estimates for 1850–1909 were 114 years for high-severity and 95 years for moderate- to high-severity fire. These unexpectedly short rotations may be because the sample size is small (n = 12 fires) in this period relative to the 1700–1909 period (n = 24 fires). In addition, tree-ring sites are not a probabilistic sample. Corroboration with the longer tree-ring period but not 1850–1909 leaves this comparison uncertain.
Size distributions were limited by the 7 of 24 fires that could not be assigned to a single year (Table 4) and by woodland patches that could be from more than one fire. The moderate- to high-severity parts of the 17 fires appeared to have an inverse-J shaped size distribution, with more small than large areas; two severe fire areas exceeded 13,000 ha (Figure 6). Fire and woodland Patches were larger and had more consistent patterns of orientation on the San Juan than the Rio Grande side (Figure 1b). Most striking were very large woodland patches, along the Dolores River from Dolores to Rico and south and west of Pagosa Springs (Figure 1b). Fires often (Fires 1, 5, and 22), but not always (Fires 6 and 10), had a southwest to northeast orientation on the San Juan side, but fires on the Rio Grande side appeared less consistently oriented.
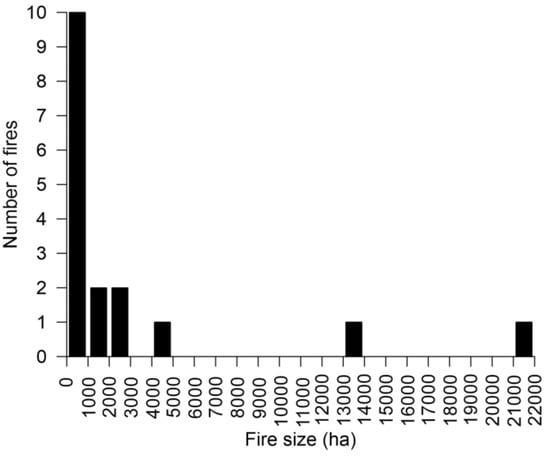
Figure 6.
Size distributions for moderate- to high-severity parts of 17 fires dated mostly to a single year.
3.2. Low-Severity Fire Rotations from Tree-Ring Studies
The 33 scar-based low-severity study sites were well distributed spatially, although unevenly, across the five large watersheds that cover the southern San Juan Mountains (Figure 5) and the three forest zones. There were 9 sites in ponderosa, 15 in dry mixed-conifer, and 9 in moist mixed-conifer forests (Table 2 and Table 5), also a little uneven. Overall, across the 33 sites, the mean historical all-severity fire rotation in ponderosa pine and mixed-conifer forests was about 48 years, with a median of 44 years (Table 5). The distribution of fire rotations was skewed toward values less than the mean, so the median of 44 years is a better measure of central tendency. The mean historical low-severity fire rotation overall was almost twice as long, at 93.3 years, likely because of two exceptionally long estimates of 424.1 and 496.0 years. The median historical low-severity fire rotation of 58.8 years is again a better measure of central tendency. I focus here on low-severity fire rotations, rather than reviewing the all-severity data.
Table 5.
Statistics of the distributions of historical all-severity and low-severity fire rotations overall and for the three forest zones. Table entries are all in years, except n, which is a count.
The southern San Juan Mountains had a surprisingly large overall range of historical low-severity fire rotations, from 16 to 174 years, except two longer rotations (Table 5). Four watersheds each had close to this full range (Figure 5c), suggesting a tendency toward similar variability across the mountain range. Based on quartiles, 1/4 of sites had low-severity fire rotations shorter than about 36 years and 1/4 longer than about 126 years (Table 5). Median low-severity fire rotations also differed significantly among forest zones (Kruskal–Wallis H = 11.13, p = 0.004). Among the nine ponderosa-pine sites, the historical median low-severity fire rotation was 31 years (Table 5). Variability was lower than in the other two forest zones, ranging only from about 16–59 years for low-severity fire rotations (Table 5). Based on quartiles, 1/4 of rotations were shorter than about 20 years and 1/4 were longer than about 48 years. Among the 15 dry mixed-conifer sites, the historical median low-severity fire rotation was 78 years (Table 5). Variability was highest among the three forest zones, ranging from about 20–496 for low-severity fire rotations (Table 5). Based on quartiles, 1/4 of rotations were shorter than 42 years and 1/4 longer than 140 years. Among the nine moist mixed-conifer sites, the historical median low-severity fire rotation was 113 years (Table 5). Variability was intermediate, with low-severity fire rotations ranging from about 39–424 years (Table 5). Based on quartiles, 1/4 of rotations were shorter than about 49 years and 1/4 longer than about 157 years (Table 5).
There were modest, significant trends for fire rotations to increase exponentially from lowest to highest elevations (Figure 7). Two sites ([26] (Jackson Mt. 1, 2); [31] (Steven’s Creek N)), outliers with exceptionally long rotations, were omitted from regressions. Data on aspect were available for only 30 of 33 sites and were reported at times in general terms (e.g., southerly-facing), so analysis is rough. Aspect improved regressions very little. Zone improved low-severity equations (R2adj = 0.438) over equations in Figure 7b (R2adj = 0.350) for all three forest zones: historical ponderosa pine rotations = e−2.040+0.002192*elevation, dry mixed-conifer rotations = e−1.47+0.002192*elevation and moist mixed-conifer rotations = e−1.46+0.002192*elevation.
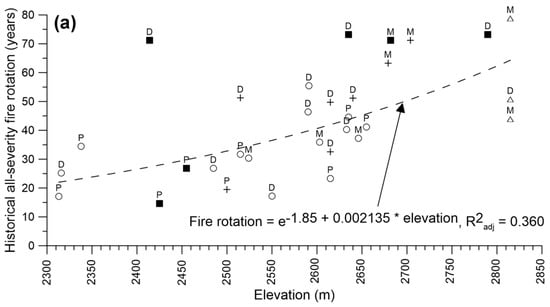
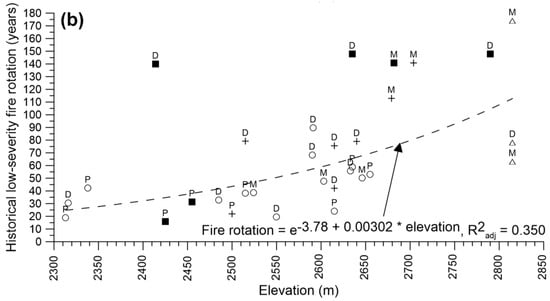
Figure 7.
Historical fire rotations versus elevation, aspect, and forest zone, and the equation for estimating fire rotations from elevation: (a) historical all-severity fire rotations; and (b) historical low-severity fire rotations. For aspect, open circles = southerly-facing sites; dark squares = northerly-facing sites; pluses = easterly- and westerly-facing sites; and triangles = unknown aspects. For forest zones, P = ponderosa pine; D = dry mixed conifer; and M = moist mixed conifer. Moist mixed-conifer forest estimates are preliminary.
4. Discussion
4.1. Low-Severity Fire Rotations and Population Mean Fire Intervals from Tree-Ring Data
Ponderosa pine and mixed-conifer forests in the southern San Juan Mountains historically were not generally frequent-fire forests with historical fire rotations <25 years [4]. Only 5 of 33 sites (about 15%), four in ponderosa pine and one in dry mixed-conifer forests, had historical low-severity fire rotations <25 years (Table 2). This is similar to the overall pattern in the western USA, where only about 14% of 342 sites, mostly in the southwest, had frequent fire with historical fire rotations <25 years [4]. Frequent-fire forests were concentrated in Arizona and New Mexico, which had 96% and 56% frequent-fire forests, respectively [4]. Understory fuels typically recover after low-severity fires to pre-fire levels within about 7–25 years, thus would have been kept generally at or below fully recovered levels in frequent-fire forests [4]. In contrast, 28 of 33 or about 85% of historical low-severity fire rotations in montane forests in the southern San Juan Mountains were multi-decadal. In ponderosa pine forests with 31-year median historical low-severity fire rotations, understory shrubby fuels would often have been fully recovered historically between fires. In mixed-conifer forests with 78–113 year median historical low-severity fire rotations (Table 5), understory fuels would have nearly always been fully recovered for almost a century before the next fire. Trees would have been able to regenerate and reach sufficient size to resist mortality in the next fire, enabling the diverse tree composition found historically in mature mixed-conifer forests [10]. The predominant understory shrub, Gambel oak (Quercus gambelii), would have commonly been able to resprout after fire [9], and remain at maturity for many decades before the next fire. Most other common shrubs in these forests also resprout [9], so that dense shrubby understories were historically probable. However, Gambel oak is also vulnerable to frost [35].
Early scientific observations corroborate that historical fire rotations, and perhaps long periods without heavy frost, allowed dense shrubby understories to predominate in these forests, but with variable tree regeneration. Dubois [15], in the San Juan Forest-Reserve Report, described regeneration in ponderosa pine and dry mixed conifer: “Reproduction of bull pine is poor. In many places groups of seedlings are coming in, but in the large blanks made by cutting, restocking is slow” (p. 7). Bull pine is younger ponderosa pine. Dubois also said: “The underbrush is very heavy, chiefly oak brush, choke-cherry, scarlet thorn, and wild rose” [15] (p. 7). The Montezuma Forest-Reserve Report [16] also described tree regeneration: “In the virgin forest and in the poor open stand on thin soil there is practically no reproduction” [16] (p. 9), and a dense shrubby understory: “The underbrush of oak, service berry, wild rose, thornbush, and buffalo berry is very heavy”.
The southern San Juan Mountains had a high diversity of historical low-severity fire rotations in montane forests over short distances (Figure 5c) and, partly related to forest zone and topography. Shorter fire rotations predominated in ponderosa pine forests at lower elevations and on southerly-facing aspects, while longer rotations predominated in mixed-conifer forests at higher elevations and on northerly-facing aspects ( Figure 5c and Figure 7b). Other unstudied factors, including topographic position (e.g., canyon vs. ridge) could also help explain variability.
These low-severity fire-rotation estimates have some limitations. First, they are from CFIs, which have error from using small plots, and error is associated with equations used to estimate fire rotations [4]. Second, CFI studies were not probabilistic samples of landscapes; old forests were typically targeted, since the goal was to obtain long fire records [4]. Younger forests predominant today likely burned at longer fire rotations than the estimates reported here [4]. Of course, tree-ring records cannot distinguish ignition sources, but ignitions by Indians were likely relative low [36].
4.2. Moderate to High-Severity Fires from Forest Atlases and Other Sources
Mapped atlas fires and woodlands were shown to be generally reliable in reconstructing larger severe fires across this study area. Here, 24 moderate- to high-severity fires, which covered 86% of total atlas fire and woodland area, were corroborated by multiple sources (Table 4, Table S1, and Figure 3). Corroboration for landscape-scale fire history will always be incomplete, as corroborating sources are imprecise and typically cover only parts of large fires. Tree-ring dating could be used to fill in some missing information and resolve some ambiguity in fire dates, but the land area is too large to cover very fully. Atlases provide an imperfect, but unique and important source of information, particularly when corroborated as well as possible with multiple other sources.
Estimated historical high-severity fire rotations were mostly 225–250 years in moist mixed-conifer, 265 years in dry mixed-conifer, and >350 years in ponderosa pine forests (Table 1). Ponderosa pine and dry mixed-conifer estimates, if pooled, would be roughly congruent with pooled estimates of 271 years in the Colorado Front Range [37] and 281–354 years in the western Sierra [38], but longer than the 217-year rotation on Black Mesa, northern Arizona [37], and the 175-year rotation on the Uncompahgre Plateau, which is just north of the San Juan Mountains [39].
The atlases document that about 19,000 ha of ponderosa pine forest burned at high severity in the 1850–1909 period in the San Juan National Forest, which led to the high-severity fire rotation estimate of 358 years (Table 1). About 1/3 of ponderosa-pine forest area in the San Juan National Forest had evidence of either moderate- or high-severity fire in the 1850–1909 period, a rotation of about 185 years. High-severity fires also burned historically in dry mixed-conifer forests, where ponderosa pine was dominant; about 18,000 ha of high-severity fire was documented by the atlases during 1850–1909 (Table 1). Evidence of high-severity fire has been found in nearly all other ponderosa pine and dry mixed-conifer landscapes where probabilistic landscape-level historical evidence has been studied [6,40,41]. Large high-severity fires in ponderosa pine and dry mixed-conifer forests had not been documented by tree-ring studies in the San Juan Mountains, likely because tree-ring fire studies often cannot reach sufficiently large landscape scales. Tree-ring studies were valuable, but often not probabilistic samples of landscapes, focusing in older forests with long records of fire. Tree-ring studies found some of the large, severe fires, but could not determine they were very large.
Fires appeared to have reached much larger sizes and appeared more uniformly oriented on the San Juan than Rio Grande side (Figure 1b). Larger fires on the San Juan side may have occurred in part because it has much more abundant, dense understory shrubs that promote higher-severity fires. However, much of the area of large patches (Fires 1, 5, and 22 in Figure 1b) also had a southwest-to-northeast orientation typical of fires that expanded under the influence of strong winds, possibly associated with passing cold fronts or other windstorms [3]. This effect, if it partly explains the pattern, also likely was enhanced by the common southerly- or southwesterly-facing river valleys on the San Juan side, which are lacking on the Rio Grande side (Figure 1b). However, other large fires on the San Juan side (Fires 6 and 10) have different orientation or expanded more broadly (Fire 22) across large landscapes with modest topography. Fires on the Rio Grande side appeared to lack a consistent orientation, and instead appeared constrained by a smaller area of montane forests and more diverse orientations of river valleys (Figure 1b). Some fires burned from valley bottoms in the montane zone up to treeline (e.g., Fire 1 and 18, and the atlas fire on the East Fork of the San Juan River southeast of Fire 7 in Figure 1b), although only the montane forest parts are shown.
How large did historical fires become? Moderate- to high-severity parts of fires appear mostly <5000 ha (Figure 6), but with two or more >13,000 ha in ponderosa pine and mixed conifer, similar to the 14,873 ha of moderate- to high-severity fire in the 2002 Missionary Ridge fire, based on MTBS data [42]. However, potential total area burned in a fire, not just in the montane, at moderate to high severity could historically have reached 38,805 ha (Fire 5), 54,631 ha (Fire 1), 55,975 ha (Fire 9), or even 73,925 ha (Fire 22), approaching the 75,000–90,000 ha estimated to have burned in 1879 on the Uncompahgre Plateau, just north of the San Juan Mountains [39]. If an added 1/3 to 1/2 burned at low severity, as in modern fires, total fire areas could have reached 50,000–100,000 ha, about 2–4 times the 27,903 ha of the 2002 Missionary Ridge fire. However, these very large historical fires need more research, as some could be from smaller adjoining fires in separate years. In any case, these represent very large contiguous areas, likely all burned in a 60-year period, that are still undergoing natural recovery, evident today as large patches of aspen [2,22], middle-aged forests, and openings.
A historically complex landscape with heterogeneous stages of recovery is expected, given high-severity fire rotations of 225–360 years, and moderate- to high-severity fire rotations of about 133–185 years (Table 1), and is documented by the atlases. These rotations were long enough to allow old-growth forests to develop, but short enough so that large fractions of landscapes had younger, recovering forests. About 17% of the ponderosa-pine zone and 21% of all three zones was likely <60 years old, after high-severity fires, at the time of the 1908–1909 atlases, and about 38–39% of these landscapes was burned at moderate to high severity between 1850 and 1909 (Table 1), and is still recovering from these fires. This is a substantial amount of severe fire, but is corroborated by a 1905 observation of limited large ponderosa pine timber on the San Juan relative to other areas (Table S2).
Atlas evidence of moderate- to high-severity fires has several limitations. Large spatial errors affect atlas utility in spatial overlays with modern data. Overlays with parts of the ponderosa and mixed-conifer zones could include some fire area not in the zone, and some parts of the zone could be mis-assigned. A significant constraint is that the resolution or minimum mapping unit is not specified; some grassland and shrubland patches down to about 15–20 ha were mapped, but smaller fires likely were often missed. Atlas evidence of severe fires extends back only to about 1850, and the period 1850–1909 in other parts of the southern Rockies had evidence of extensive burning due to a climatically favorable period for fire and added ignitions by settlers [9]. Ignitions by Indians likely did occur, but were relatively minor [36]. Mapping dates of 1908–1909 are late relative to expanding land uses after the early 1880s and an increased possibility that fires were human-set and forests had been logged and grazed. I presented evidence that railroad logging likely did not produce most woodlands, but logging could have contributed in some areas, and some fires were caused by railroads and logging in this period [9]. Fire severities were not explained in the atlases and, for woodlands, the best estimate from Dubois [16] is that half of woodland area was severely burned. However, woodlands could include some areas of patchy treeline forests, riparian areas, and naturally dry, low-density forests, these latter particularly on the Rio Grande side. Woodlands likely did not generally originate from other disturbances (e.g., beetle outbreaks and droughts) since they had sharp boundaries and contiguous area unlikely to be from other disturbances, and woodlands were explicitly described as from fires. The year of some fires is not known, and corroboration of others is limited, particularly with earlier fires. Further research could add more spatial-accuracy analysis, field dating of fires, and analysis of woodlands. Despite limitations, forest atlases currently represent the best available source of landscape-scale historical fire evidence for this land area.
4.3. Managing Low-, Moderate-, and High-Severity Fires in Montane Landscapes of the San Juan Mountains
Change in ponderosa pine and mixed-conifer landscapes since Euro-American settlement was previously attributed to suppression of frequent fires, with added impact from logging and livestock grazing, leading to increased tree density and basal area, and tree recruitment in grasslands and shrublands. Restoration thus focused on reducing tree density and basal area and reintroducing frequent fires. However, now it is known that ponderosa pine and mixed-conifer landscapes in the San Juan Mountains had frequent fires only on the lowest and driest 15% of the area, as found elsewhere in Colorado [43]. Most (85%) of the southern San Juan montane zone historically had multi-decadal low-severity fire rotations (Table 2), as elsewhere in Colorado [4]. These longer historical low-severity fire rotations enabled dense shrubby understories to persist in a mature state for decades between fires. This likely partly explains, along with southerly-facing valleys and modest topography, the extensive moderate- to high-severity fires now known in this study area (Figure 1b), as also on the adjoining Uncompahgre Plateau just north of the San Juan Mountains [39].
Together this new evidence shows that ponderosa pine, dry mixed-conifer, and moist mixed-conifer landscapes in the San Juan Mountains were all shaped by both low-severity fires, that helped maintain low-density mature and old-growth forests, and by infrequent moderate- to high-severity fires that fostered large expanses of younger, more heterogeneous forests, as well as grasslands and shrublands, in various states of survival and recovery. The resulting landscape heterogeneity of old forests, younger forests, and openings conferred bet-hedging resistance and resilience to unpredictable subsequent disturbances by fires, insects, and droughts, especially important as we enter a period of climate change with expected natural disturbances and tree mortality [41,44]. Bet-hedging at the landscape scale means that the landscape is not uniformly resistant or resilient to any one type of disturbance, but instead provides resistance and resilience to a diversity of disturbances in different parts of the landscape [41,44].
High-severity fires were often thought to have increased since EuroAmerican settlement, but new landscape-scale evidence here refutes this. Fire rotations for high-severity fires, between 1984 and 2012, in analysis polygons that contain the San Juan Mountains, were 1816 years in ponderosa pine and 926 years in dry mixed-conifer forests [40]. Analysis is not available for rates since 1984 in moist mixed-conifer forests. Since estimated historical high-severity fire rotations in ponderosa pine forests were 358 years on the San Juan and 1145 years on the Rio Grande, and in dry mixed-conifer forests were 265 years on the San Juan and 267 years on the Rio Grande (Table 1), high-severity fires have burned since 1984 at well below historical rates. Thinning and reduction of understory shrubs or other fuels to reduce severe fires, in ponderosa pine and dry mixed-conifer forests, is thus fire suppression, which has known adverse effects on biological diversity and ecosystem functioning [9].
If the goal is ecological restoration, it is essential to protect areas primarily undergoing natural postfire recovery, and focus intentional restoration in areas recovering from logging, grazing, and fire suppression. Thinning and logging trees recovering from severe fires is not ecological restoration; it is natural in these areas for tree density and basal area to increase during recovery. Areas today inside atlas fire and woodland areas are still recovering from the moderate- to high-severity fires of 1850–1909. This is 38–39% of San Juan and Rio Grande ponderosa pine and mixed-conifer forest area (Table 1). Digital atlas fires and woodlands provide mapped locations where facilitating natural recovery can be emphasized during restoration (Data S1). Natural recovery favored shade-tolerant trees (Abies concolor, Pseudotsuga menziesii, and Picea pungens), in the middle- to later-stages of succession in mixed-conifer forests [26]; these trees were even dominant in older dry mixed-conifer forests [10]. Where mixed-conifer forests are recovering, restored fires and other disturbances can readjust the abundance of shade-tolerant trees, and in the meantime recovering forests provide a key component of bet-hedging resilience at the stand scale [41,44]. For example, recovering forests, which already have small trees, are increasingly valuable because post-fire tree regeneration has been lower with warmer and drier conditions since 2000 [45].
For other areas, the simplest approach to separation of confounded recovery, logging, and fire-suppression effects, to determine restoration needs, is by dating and field observation. Since fire suppression was ineffective until after World War II [9], small trees <65 years old more likely represent fire suppression or recovery from logging, whereas older trees most likely represent natural recovery after low- to moderate-severity fires, except near early-1900s logging railroads (Figure 4). Other logged areas can often be identified in the field by persistent stumps [8]. In these later logged areas, small trees <65 years old could represent recovery after logging itself, livestock grazing, or fire suppression, which have effects that are difficult to separate. Using natural recovery and managed fire to restore these forests can be just as effective, or more so, than are thinning or other mechanical treatments [46], and do not require particular prescriptions. If mechanical treatment is undertaken anyway in these areas, I suggest now retaining all older trees and sufficient trees <65 years old, of as many species as possible, so that after-treatment stand-structure is numerically dominated by small trees of maximum available species diversity and variable density. These provide bet-hedging against impending future beetle outbreaks, droughts, and fires [41,44].
If the fire management goal is to restore heterogeneous San Juan montane landscapes shaped by historical variability in low-, moderate-, and high-severity fires, managed fires for resource benefit, not prescribed fires, can enable the higher-severity fires needed for effective restoration [47]. Fire rotations are the best available rate estimators to use in burning programs because they are area-based estimates of the historical rate of burning [4]. Biological diversity and ecosystem services will certainly be best maintained by mimicking the large variability in historical fire among forest zones and across topography (Table 5, Figure 1b and Figure 5). In addition, most of the total burned area historically came from the few percent of fires that were large [9]. During the intervals between large fires, there can be ample time and variable settings that allow diverse species to recover. This can be mimicked by concentrating burned area into fewer years, rather than burning similarly each year.
It is not easy to restore and live with dangerous, but ecologically important large, severe fires or even with low-severity fires [48]. New landscape-scale evidence shows that montane landscapes are among the most inherently dangerous places to try to live with fire in the San Juan Mountains.
Supplementary Materials
The following are available online at http://www.mdpi.com/2571-6255/1/2/23/s1, Table S1: Moderate- to high-severity fires during 1850–1909 in the ponderosa pine and mixed-conifer forests of the southern San Juan Mountains from multiple sources, Table S2: General descriptions of fires and forest structure in Colorado and the San Juan Mountains, Data S1: Digital maps (shapefiles) of atlas fires and woodlands, Data S3: Digital fire-history data. Data S2: Georectified forest-atlas mosaics, are available from the Open Science Framework online at: https://osf.io/jk6ce/ (doi:10.17605/OSF.IO/JK6CE).
Funding
This research received no external funding.
Acknowledgments
The author appreciates assistance from the San Juan and Rio Grande National Forests with their GIS data, and the U.S. Geological Survey Denver Library Photographic Collection. Comments from peer reviewers significantly improved the manuscript and are appreciated.
Conflicts of Interest
The author declares no conflict of interest.
References
- Wehner, M.F.; Arnold, J.R.; Knutson, T.; Kunkel, K.E.; LeGrande, A.N. Droughts, floods, and hydrology. In Climate Science Special Report: Fourth National Climate Assessment; Wuebbles, D.J., Fahey, D.W., Hibbard, K.A., Dokken, D.J., Stewart, B.C., Maycock, T.K., Eds.; U.S. Global Change Research Program: Washington, DC, USA, 2017; Volume 1, pp. 231–256. [Google Scholar]
- Romme, W.H.; Floyd-Hanna, L.; Hanna, D.D.; Bartlett, E. Aspen’s ecological role in the West. In Sustaining Aspen in Western Landscapes: Symposium Proceedings; Shepperd, W.D., Binkley, D., Bartos, D.L., Stohlgren, T.J., Eskew, L.G., Eds.; USDA Forest Service Proceedings RMRS-P-18; Rocky Mountain Research Station: Fort Collins, CO, USA, 2001; pp. 243–259. [Google Scholar]
- Aoki, C.F. Fire History and Serotiny in the Rocky Mountains of Colorado. Master’s Thesis, Colorado State University, Fort Collins, CO, USA, 2010. [Google Scholar]
- Baker, W.L. Restoring and managing low-severity fire in dry-forest landscapes of the western USA. PLoS ONE 2017, 12, e0172288. [Google Scholar] [CrossRef] [PubMed]
- Hessburg, P.F.; Salter, R.B.; James, K.M. Re-examining fire severity relations in pre-management era mixed-conifer forests: Inferences from landscape patterns of forest structure. Landsc. Ecol. 2007, 22, 5–24. [Google Scholar] [CrossRef]
- Odion, D.C.; Hanson, C.T.; Arsenault, A.; Baker, W.L.; DellaSala, D.A.; Hutto, R.L.; Klenner, W.; Moritz, M.A.; Sherriff, R.L.; Veblen, T.T.; et al. Examining historical and current mixed-severity fire regimes in ponderosa pine and mixed-conifer forests of western North America. PLoS ONE 2014, 9, e87852. [Google Scholar] [CrossRef] [PubMed]
- Baker, W.L.; Williams, M.A. Land surveys show regional variability of historical fire regimes and dry forest structure of the western United States. Ecol. Appl. 2018, 28, 284–290. [Google Scholar] [CrossRef] [PubMed]
- Romme, W.H.; Floyd, M.L.; Hanna, D. Historical Range of Variability and Current Landscape Condition Analysis: South Central Highlands Section, Southwestern Colorado & Northwestern New Mexico; Colorado Forest Restoration Institute, Colorado State University: Fort Collins, CO, USA, 2009; Available online: https://cfri.colostate.edu/publications/ (accessed on 7 July 2018).
- Baker, W.L. Fire Ecology in Rocky Mountain landscapes; Island Press: Washington, DC, USA, 2009. [Google Scholar]
- Tepley, A.J.; Veblen, T.T. Spatiotemporal fire dynamics in mixed-conifer and aspen forests in the San Juan Mountains of southwestern Colorado, USA. Ecol. Monogr. 2015, 85, 583–603. [Google Scholar] [CrossRef]
- Agee, J.K. Fire ecology of Pacific Northwest Forests; Island Press: Washington, DC, USA, 1993. [Google Scholar]
- Pinchot, G. Preparation of the Forest Atlas; United States Department of Agriculture, Forest Service: Washington, DC, USA, 1907.
- Graves, H.S. Instructions for Making Forest Surveys and Maps; U.S. Government Printing Office: Washington, DC, USA, 1912.
- Baker, W.L.; Veblen, T.T.; Sherriff, R.L. Fire, fuels and restoration of ponderosa pine-Douglas-fir forests in the Rocky Mountains, USA. J. Biogeogr. 2007, 34, 251–269. [Google Scholar] [CrossRef]
- Dubois, C. Report on the Proposed San Juan Forest Reserve, Colorado; Unpublished Report on file at the San Juan National Forest, Supervisor’s Office; San Juan National Forest: Durango, CO, USA, 1903. [Google Scholar]
- Dubois, C. The Proposed Montezuma Forest Reserve, Colorado; Original document is in the National Archives and Records Administration; U.S. Department of Agriculture, Bureau of Forestry: Broomfield, CO, USA, 1904; A Typed Facsimile Version. Available online: https://www.fs.usda.gov/detail/gmug/landmanagement/resourcemanagement/?cid=stelprdb5378367 (accessed on 7 July 2018).
- Michelsen, H. Colorado forest fires in nineteen hundred. Forester 1901, 7, 56–61. [Google Scholar]
- Snedecor, G.W.; Cochran, W.G. Statistical Methods, 6th ed.; Iowa State University Press: Ames, IA, USA, 1967. [Google Scholar]
- Shinneman, D.J.; Baker, W.L.; Rogers, P.C.; Kulakowski, D. Fire regimes of quaking aspen in the Mountain West. For. Ecol. Manag. 2013, 299, 22–34. [Google Scholar] [CrossRef]
- Biodiversity Heritage Library. Available online: https://www.biodiversitylibrary.org (accessed on 26 May 2018).
- Kulakowski, D.; Veblen, T.T.; Drinkwater, S. The persistence of quaking aspen (Populus tremuloides) in the Grand Mesa area, Colorado. Ecol. Appl. 2004, 14, 1603–1614. [Google Scholar] [CrossRef]
- Margolis, E.Q.; Swetnam, T.W.; Allen, C.D. A stand-replacing fire history in upper montane forests of the southern Rocky Mountains. Can. J. For. Res. 2007, 37, 2227–2241. [Google Scholar] [CrossRef]
- Hatton, J.H. The Proposed Cochetopa Forest Reserve: Examination, Report and Recommendations; Bureau of Forestry, U.S. Department of Agriculture, National Archives and Records Administration: Broomfield, CO, USA, 1904.
- Ormes, R.M. Tracking Ghost Railroads in Colorado; Century One Press: Colorado Springs, CO, USA, 1975. [Google Scholar]
- Chappell, G.S. Logging along the Denver & Rio Grande: Narrow Gauge Logging Railroads of Southwestern Colorado and Northern New Mexico; Colorado Railroad Museum: Golden, CO, USA, 1971. [Google Scholar]
- Wu, R. Fire History and Forest Structure in the Mixed Conifer Forests of Southwest Colorado. Master’s Thesis, Colorado State University, Fort Collins, CO, USA, 1999. [Google Scholar]
- Brown, P.M.; Wu, R. Climate and disturbance forcing of episodic tree recruitment in a southwestern ponderosa pine landscape. Ecology 2005, 86, 3030–3038. [Google Scholar] [CrossRef]
- Fulé, P.Z.; Korb, J.E.; Wu, R. Changes in forest structure of a mixed conifer forest, southwestern Colorado, USA. For. Ecol. Manag. 2009, 258, 1200–1210. [Google Scholar] [CrossRef]
- Korb, J.E.; Fulé, P.Z.; Wu, R. Variability of warm/dry mixed conifer forests in southwestern Colorado, USA: Implications for ecological restoration. For. Ecol. Manag. 2013, 304, 182–191. [Google Scholar] [CrossRef]
- Bigio, E.R. Late Holocene Fire and Climate History of the Western San Juan Mountains, Colorado: Results from Alluvial Stratigraphy and Tree-Ring Methods. Ph.D. Thesis, University of Arizona, Tucson, AZ, USA, 2013. [Google Scholar]
- Bigio, E.R.; Swetnam, T.W.; Baisan, C.H. Local-scale and regional climate controls on historical fire regimes in the San Juan Mountains, Colorado. For. Ecol. Manag. 2016, 360, 311–322. [Google Scholar] [CrossRef]
- Brown, P.M.; Ryan, M.G.; Andrews, T.G. Historical surface fire frequency in ponderosa pine stands in Research Natural Areas, central Rocky Mountains and Black Hills, USA. Nat. Areas J. 2000, 20, 133–139. [Google Scholar]
- Grissino-Mayer, H.D.; Romme, W.H.; Floyd, M.L.; Hanna, D.D. Climatic and human influences on fire regimes of the southern San Juan Mountains, CO, USA. Ecology 2004, 85, 1708–1724. [Google Scholar] [CrossRef]
- Colorado Historic Newpapers Collection. Available online: https://www.coloradohistoricnewspapers.org (accessed on 26 May 2018).
- Kaufmann, M.R.; Huisjen, D.W.; Kitchen, S.; Babler, M.; Abella, S.R.; Gardiner, T.S.; McAvoy, D.; Howie, J.; Page, D.H., Jr. Gambel Oak Ecology and Management in the Southern Rockies: The Status of Our Knowledge; Southern Rockies Fire Science Network Publication 2016-1; Colorado State University: Fort Collins, CO, USA, 2016. [Google Scholar]
- Baker, W.L. Indians and fire in the Rocky Mountains: The wilderness hypothesis renewed. In Fire, Native Peoples, and the Natural Landscape; Vale, T.R., Ed.; Island Press: Washington, DC, USA, 2002; pp. 41–76. [Google Scholar]
- Williams, M.A.; Baker, W.L. Spatially extensive reconstructions show variable-severity fire and heterogeneous structure in historical western United States dry forests. Glob. Ecol. Biogeogr. 2012, 21, 1042–1052. [Google Scholar] [CrossRef]
- Baker, W.L. Historical forest structure and fire in Sierran mixed-conifer forests reconstructed from General Land Office survey data. Ecosphere 2014, 5, 79. [Google Scholar] [CrossRef]
- Baker, W.L. The Landscapes They Are A-Changin’–Severe 19th-Century Fires, Spatial Complexity, and Natural Recovery in Historical Landscapes on the Uncompahgre Plateau; Colorado Forest Restoration Institute, Colorado State University: Fort Collins, CO, USA, 2017; Available online: https://cfri.colostate.edu/publications/ (accessed on 7 July 2018).
- Baker, W.L. Are high-severity fires burning at much higher rates recently than historically in dry-forest landscapes of the western USA? PLoS ONE 2015, 10, e0136147. [Google Scholar]
- Baker, W.L. Transitioning western U.S. dry forests to limited committed warming with bet-hedging and natural disturbances. Ecosphere 2018, 9, e02288. [Google Scholar] [CrossRef]
- Monitoring Trends in Burn Severity. Available online: https://www.mtbs.gov (accessed on 26 May 2018).
- Sherriff, R.L.; Platt, R.V.; Veblen, T.T.; Schoennagel, T.L.; Gartner, M.H. Historical, observed, and modeled wildfire severity in montane forests of the Colorado Front Range. PLoS ONE 2014, 9, e106971. [Google Scholar] [CrossRef] [PubMed]
- Baker, W.L.; Williams, M.A. Bet-hedging dry-forest resilience to climate-change threats in the western USA based on historical forest structure. Front. Ecol. Evol. 2015, 2, 88. [Google Scholar] [CrossRef]
- Stevens-Rumann, C.S.; Kemp, K.B.; Higuera, P.E.; Harvey, B.J.; Rother, M.T.; Donato, D.C.; Morgan, P.; Veblen, T.T. Evidence for declining forest resilience to wildfires under climate change. Ecol. Lett. 2018, 21, 243–252. [Google Scholar] [CrossRef] [PubMed]
- Zachmann, L.J.; Shaw, D.W.H.; Dickson, B.G. Prescribed fire and natural recovery produce similar long-term patterns of change in forest structure in the Lake Tahoe basin, California. For. Ecol. Manag. 2018, 409, 276–287. [Google Scholar] [CrossRef]
- Van Wagtendonk, J.W.; Lutz, J.A. Fire regime attributes of wildland fires in Yosemite National Park, USA. Fire Ecol. 2007, 3, 34–52. [Google Scholar] [CrossRef]
- Schoennagel, T.; Balch, J.K.; Brenkert-Smith, H.; Dennison, P.E.; Harvey, B.J.; Krawchuk, M.A.; Mietkiewicz, N.; Morgan, P.; Moritz, M.A.; Rasker, R.; et al. Adapt to more wildfire in western North American forests as climate changes. Proc. Natl. Acad. Sci. USA 2017, 114, 4582–4590. [Google Scholar] [CrossRef] [PubMed]
© 2018 by the author. Licensee MDPI, Basel, Switzerland. This article is an open access article distributed under the terms and conditions of the Creative Commons Attribution (CC BY) license (http://creativecommons.org/licenses/by/4.0/).