Review

Design Considerations for Low-Temperature Plasma Production in Air Using Pulsed Dielectric Barrier Discharges: A Review


by
Luutzen Franciscus Ate Wymenga
1,*,
Jan van Turnhout
2,*,
Mohamad Ghaffarian Niasar
3,
Henk van Zeijl
1,
Willem Dirk van Driel
1 and
Guoqi Zhang
1
1
Electrical Components, Technology and Materials, Delft University of Technology, 2628 CD Delft, The Netherlands
2
Materials Science and Engineering, Delft University of Technology, 2628 CD Delft, The Netherlands
3
High Voltage Technologies, Delft University of Technology, 2628 CD Delft, The Netherlands
*
Authors to whom correspondence should be addressed.
Plasma 2026, 9(2), 15; https://doi.org/10.3390/plasma9020015
Submission received: 18 March 2026 / Revised: 28 April 2026 / Accepted: 7 May 2026 / Published: 14 May 2026

Abstract

Low-temperature atmospheric plasma (LTP) is widely used in industrial processes, such as disinfection, surface modification and wastewater treatment. The dielectric barrier discharge (DBD) is regarded as one of the most robust and reliable methods for generating LTP in ambient air. Compared to conventional AC excitation, pulsed powering offers several advantages (i.e., lower energy use and heat production). The present trend is to use short and fast pulses (in the nano- and picosecond range). In this review, the key design parameters of a DBD (barrier thickness, relative permittivity and gap distance) are discussed. Material-specific phenomena like surface charging and degradation are analyzed. The complex interactions between the pulse source and DBD are examined. By mapping the interdependencies, this review aims to support the rational design and optimization of pulsed DBD systems, and to facilitate their broader industrial use.

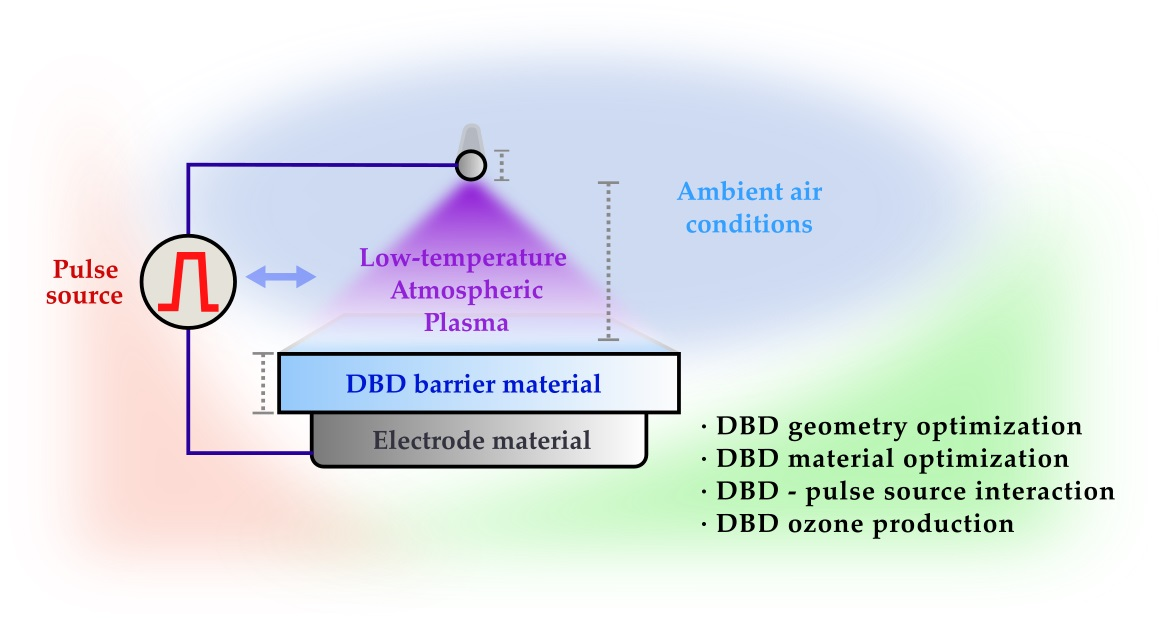
Graphical Abstract

1. Introduction

Low-temperature atmospheric plasma (LTP) has a long history in both laboratory and industrial environments. As early as 1785, van Marum reported an ‘odor of electricity’, later identified as ozone produced by his spark discharge setup. In 1857, von Siemens constructed the first dielectric barrier discharge (DBD) ozoniser using a coaxial design [1].
Since then, numerous LTP applications have been established. In air, LTP enables inactivation of pathogenic aerosols (viruses, bacteria) [2,3], odor removal [4], volatile organic compound (VOC) breakdown [5] and CO2 conversion [6]. On surfaces it is applied for: seed disinfection [7,8], seed priming [9] and surface treatment [10]. In water it facilitates wastewater treatment [11], removal of PFAS [12], breakdown of pharmaceutical residues (such as antibiotics) [13] and inactivation of pathogenic bacteria [14]. LTP is highly versatile: it produces a wide range of reactive oxygen and nitrogen species (RONS), electrons, ions and photons in atmospheric air at near ambient temperature (hence the term ‘cold atmospheric plasma’).
Since the pioneering work of von Siemens, the DBD technology made a lot of progress. DBDs are considered reliable devices for generating LTP in air. Recent research aims at optimizing the scale, efficacy and power efficiency of DBD devices. Extensive overviews of DBD designs are given by Brandenburg et al. [15,16].
The electrical powering has also advanced considerably. The transition from corona discharge to DBDs marked a shift from DC to AC power. The AC frequencies for DBDs increased substantially. For example, a recent innovation is the resonant piezoelectric transformer (RPT) which could replace more bulky AC powering systems to produce plasma with high voltage AC powering (with a frequency of tens of kHz) [17]. In recent years, pulsed powering has emerged, as promising alternative, offering many advantages [18]. Nowadays, there is a focus on pulses with steep rise times (nano- or picosecond range) for enhancing power efficiency. Also, the pulse shape (square, bipolar, multi-stage waveforms) can be tailored for a better performance [19]. Some authors used AC powering in burst mode, through lowering of the duty cycle. This lowers DBD energy use, resulting in lower heat generation (which is discussed in Section 2.4). However, pulsed operation remains superior. Compared to (burst) AC powering, it results in lower heat generation, higher RONS formation, lower electrode damage and lower energy use [20]. Meropoulis & Aggelopoulos achieved a very high energy yield for dye degradation in water using a nanopulsed DBD [21]. Klymenko et al. were able to breakdown perfluor- and fluoroalkyl substances (PFAS) in water using nanopulsed plasma [12]. Fan et al. effectively removed pathogenic microorganisms from melon seeds using a nanopulsed DBD, without harming the seeds [22]. Sun et al. reported a two-step process involving a nanopulsed DBD to produce ammonia in water [23]. Zhang et al. used a pulsed DBD for air disinfection and found that a pulsed source produced a more intense and homogeneous plasma compared to AC powering [24].
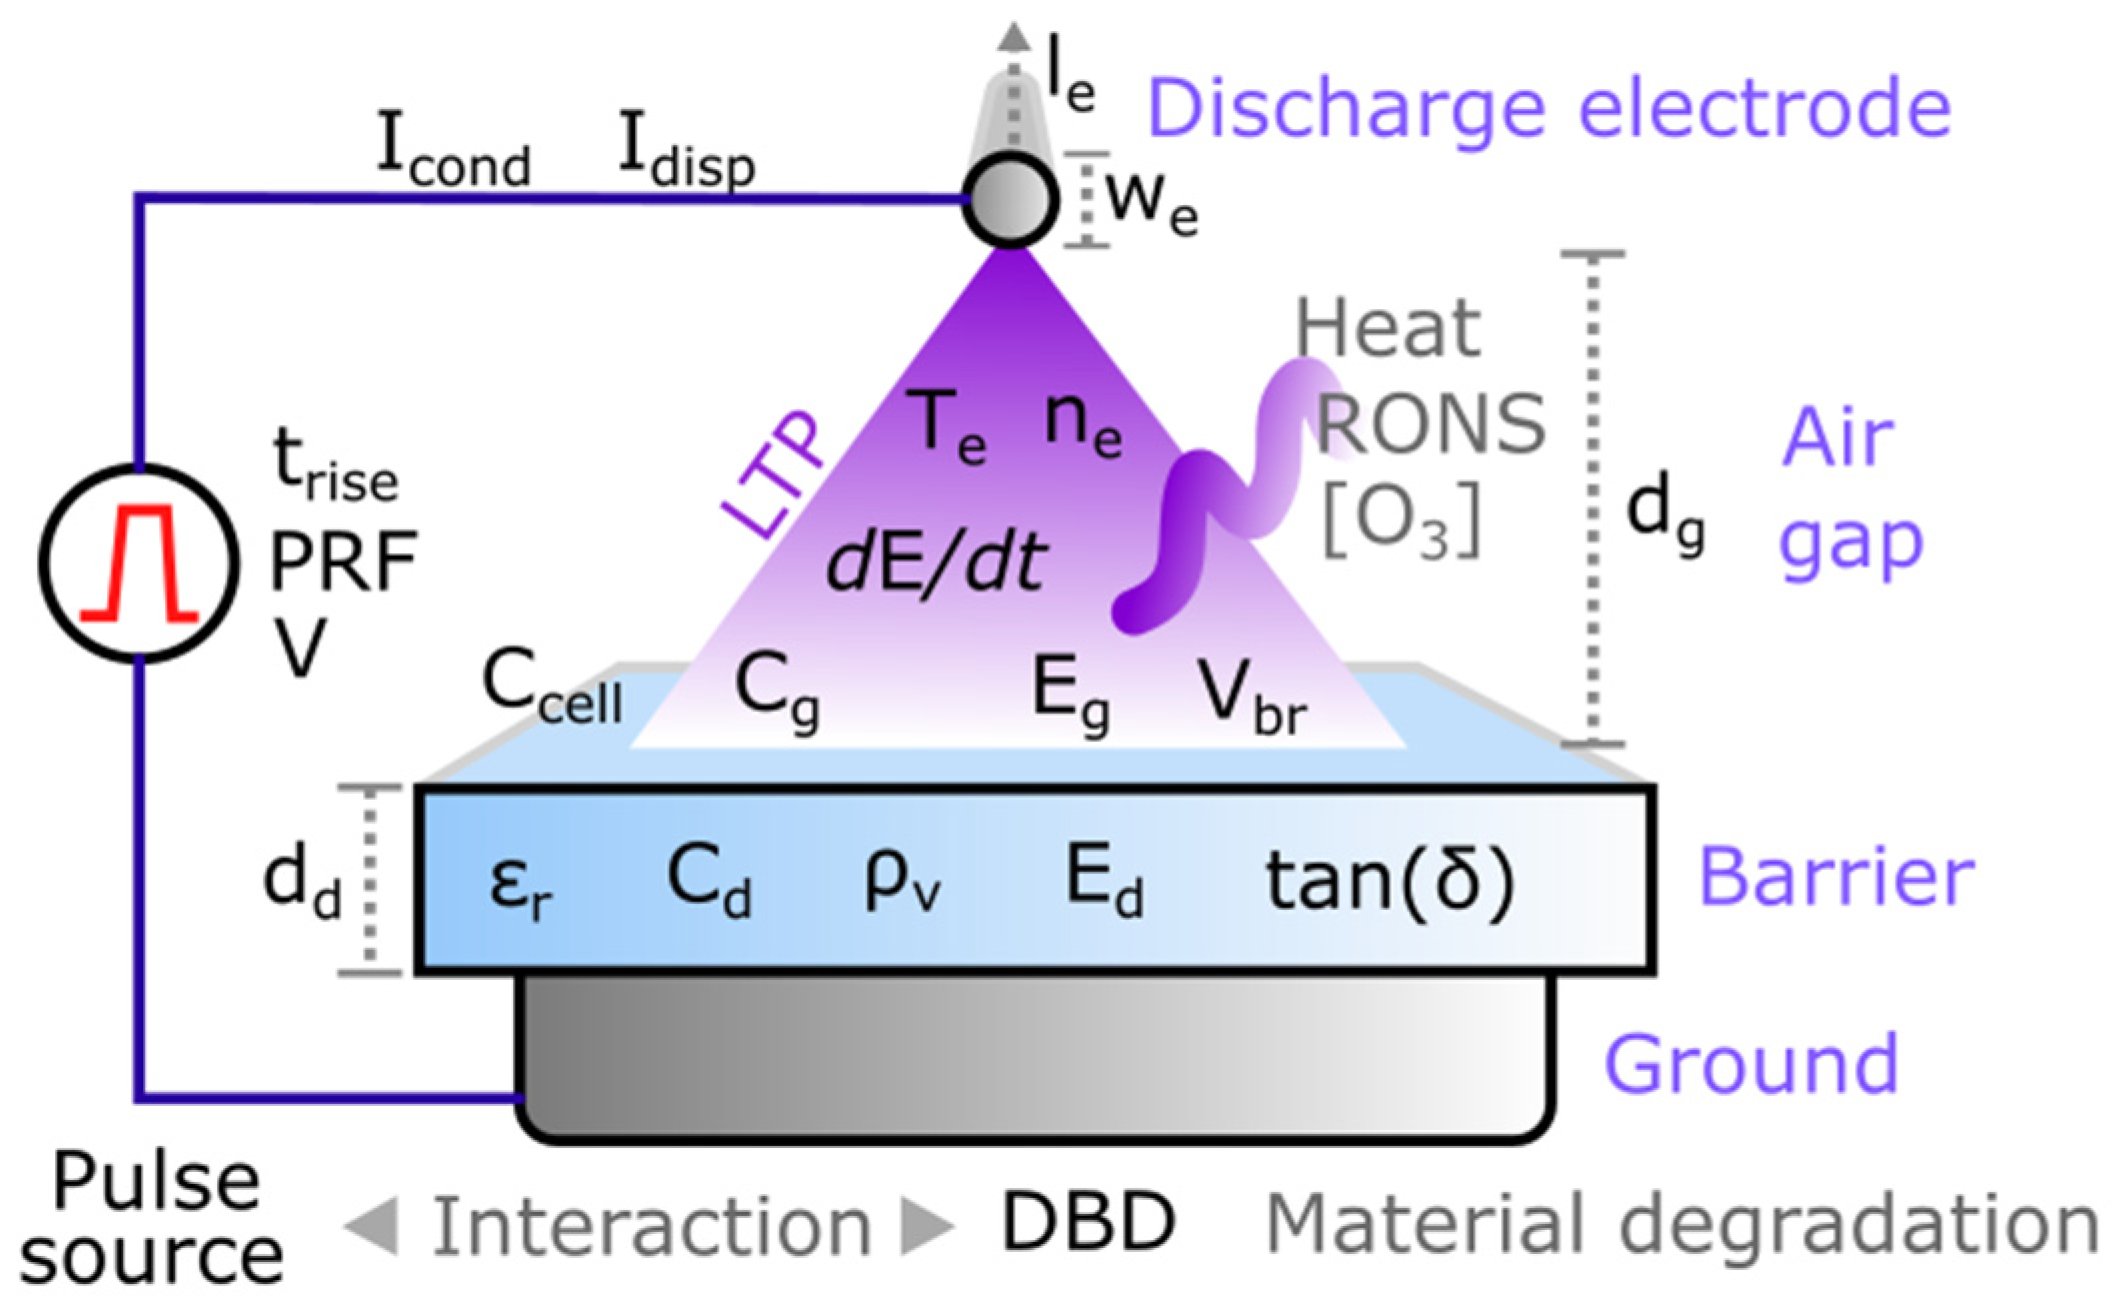
Despite this progress, upscaling DBD systems to an industrial scale remains quite challenging. For DBD reactors to be viable, they must be reliable, durable, power efficient, effective, safe and scalable. A DBD-based LTP system can only be assessed properly when the whole system is considered, from power circuit to DBD to ambient conditions. This integrated system has many interdependent variables as shown in Figure 1. For example, the pulse source influences the DBD and vice versa. The DBD influences the ambient conditions and vice versa. The system under consideration thus evolves over time across electrical, chemical, thermal and material domains.
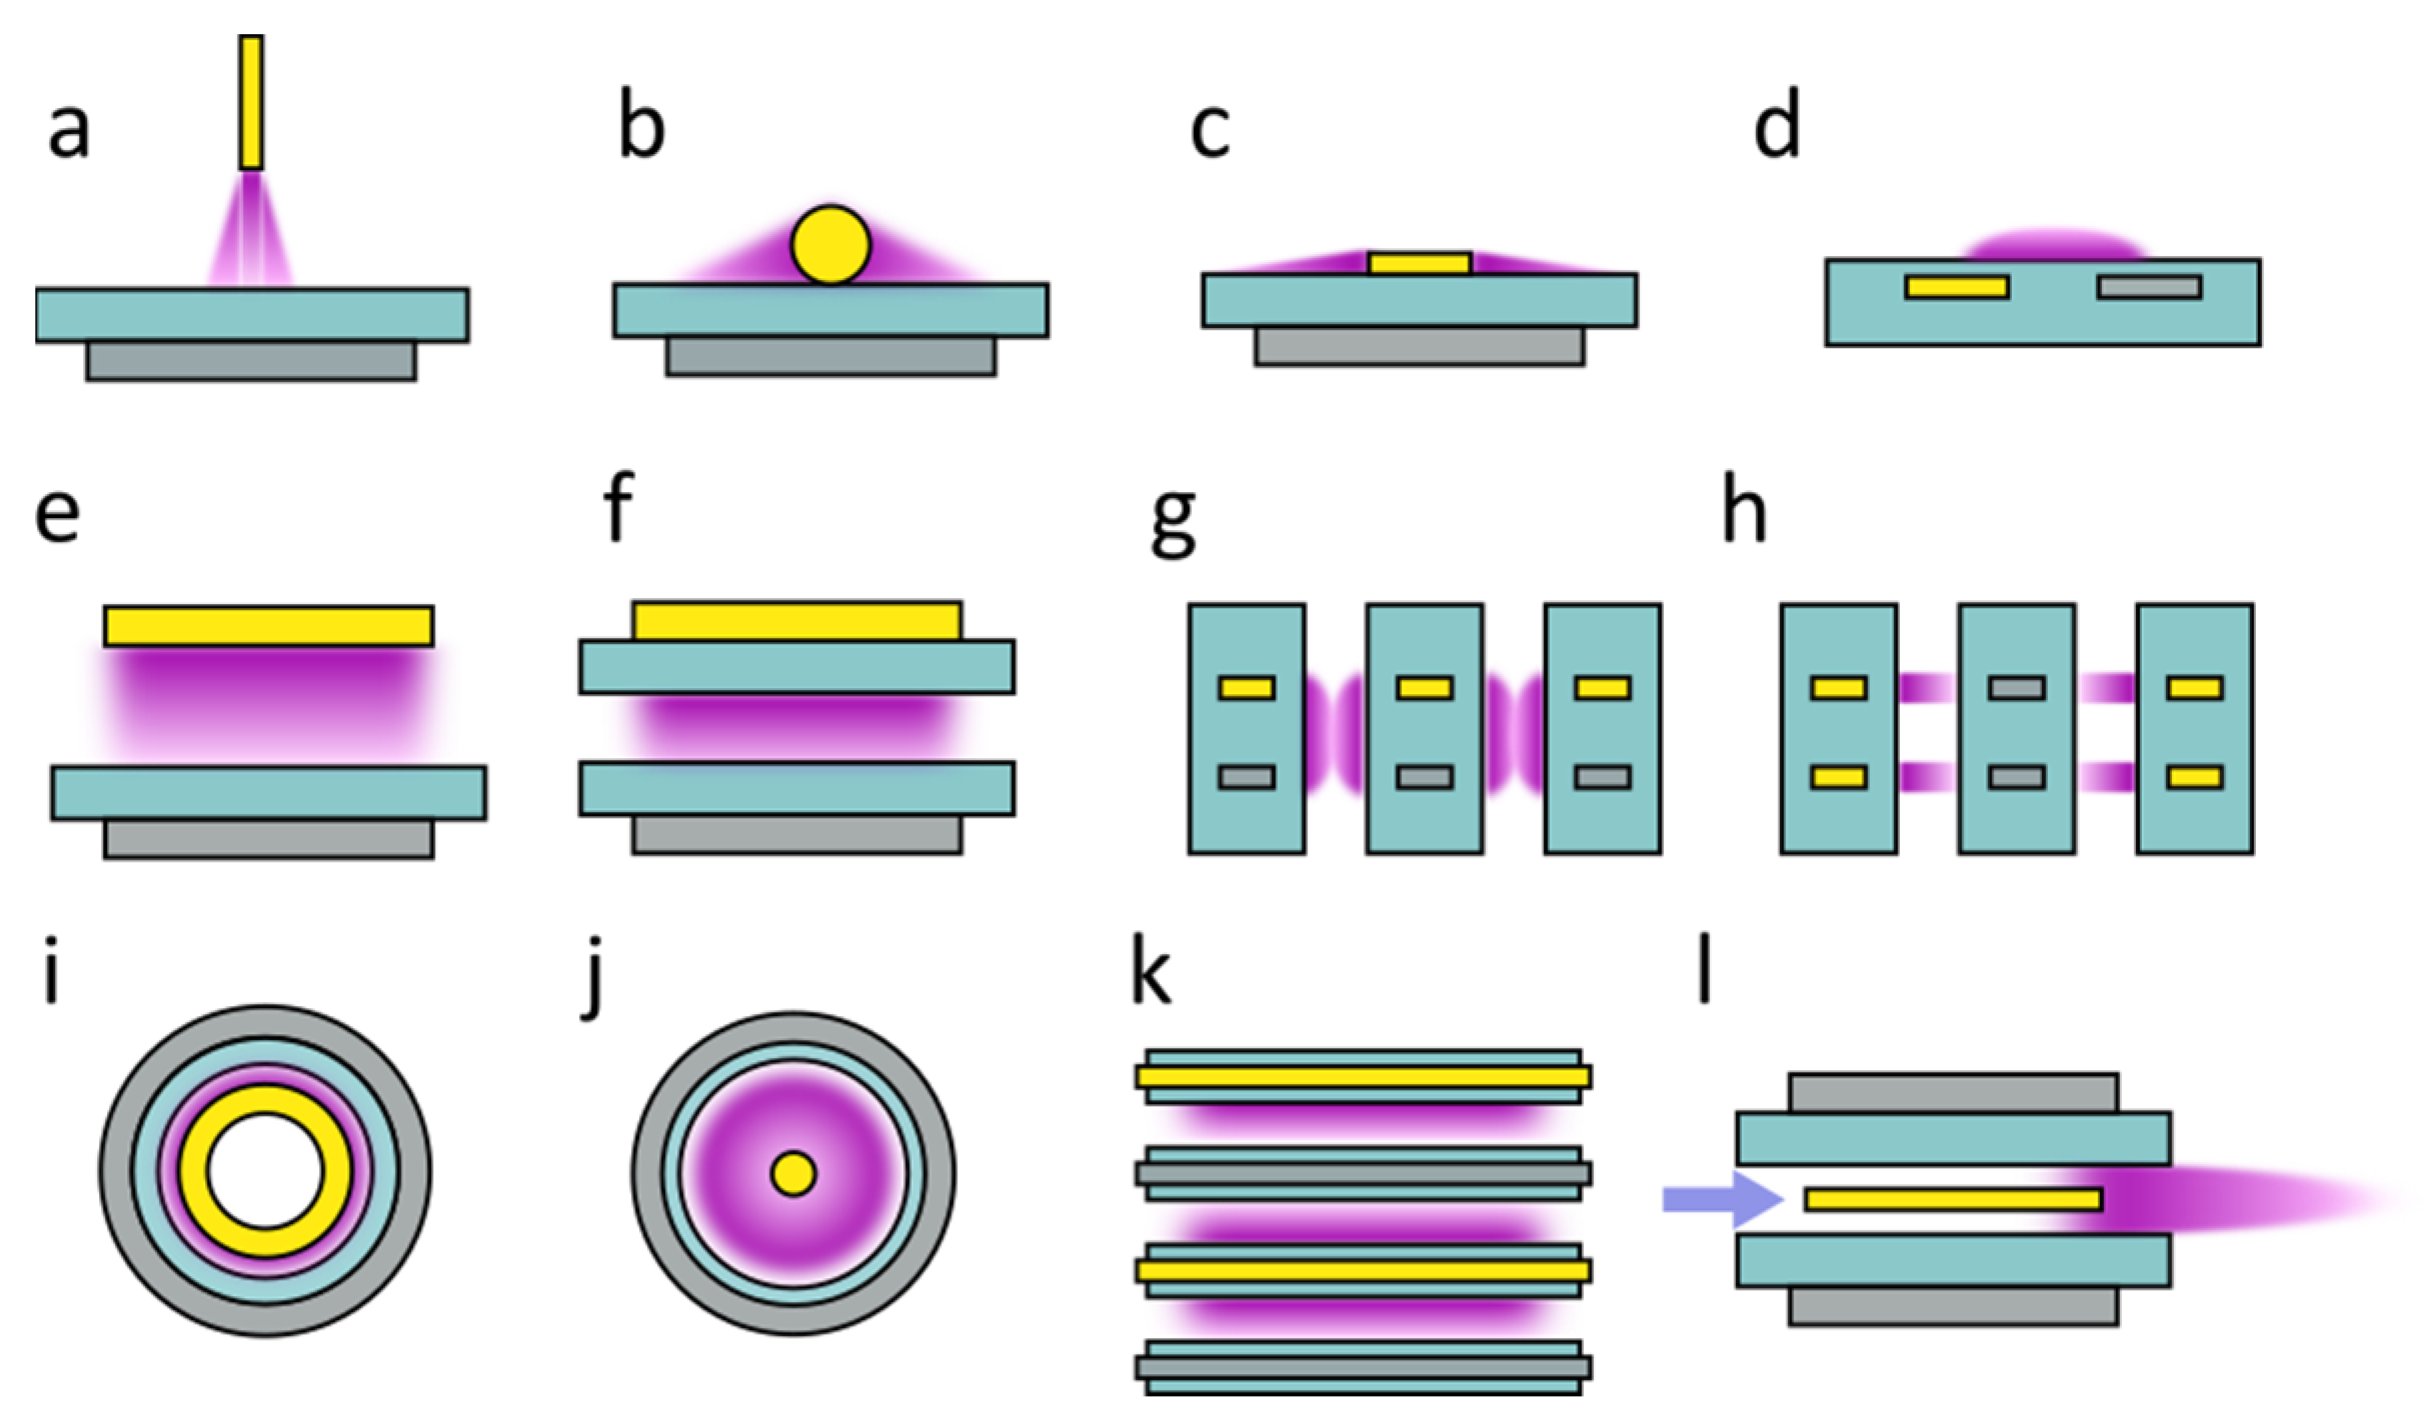
This review gives an overview of the design parameters for pulsed DBD operated in ambient air. It aims to facilitate the design of novel and optimized DBD systems that may advance the industrial use of LTP in ambient air. First, a short survey of streamer dynamics is presented (Section 2.1). Then, the material selection (for both the electrodes and the dielectric barrier) is discussed (Section 2.2 and Section 2.3). The main mechanisms causing DBD heat generation are summarized in Section 2.4. Next, the main design variables controlling the performance of pulsed DBDs are examined. These variables include: dielectric barrier thickness and relative permittivity, electrode shape, gap distance, dielectric loss factor and DBD capacitance (Section 2.5, Section 2.6 and Section 2.7). The factors influencing ozone yield are outlined in Section 2.8. Finally, Section 2.9 covers measurement challenges and the interrelation between DBD and pulse source. A literature search was performed (2022–2025) using the Semantic Scholar research tool (www.semanticscholar.org), by searching on terms such as ‘DBD optimization’, ‘DBD ozone/heat production’, ‘influence of dielectric thickness/relative permittivity’, ‘pulse rise time’. The tool allows to easily dive deeper into the topics by linking to newer studies that cited the used papers, giving an up-to-date overview. A total of >1000 papers was read during the course of the research period, and main findings per paper were systematically categorized in an overview document. From here, the most important findings were selected and summarized in this review. Also, several books on the topic of (pulsed) low-temperature plasma were consulted in the Delft University of Technology library, the Netherlands ([25,26,27,28]). The trends in this review can be applied to a wide range of DBD geometries (coaxial, wire-plate, needle-plate, micro-hollow, grating, surface and volume DBDs in Figure 2) unless otherwise specified.

2. Design Considerations for Pulsed DBDs in Air

2.1. Streamer Dynamics

A low-temperature plasma generated in atmospheric air usually is a streamer discharge (also called filamentary discharge). This discharge consists of many microdischarges (or filaments or streamers), initiated by electron avalanches. When avalanche formation was suppressed by applying a narrow gap or very short pulses (<10 ns in [37]), a diffuse discharge (or glow/homogeneous discharge [16,38]) could be formed [39]. Sustaining a diffuse discharge in atmospheric air is difficult [16,40,41,42], because electron avalanches develop quickly. Several seemingly diffuse discharges turned out to be streamer discharges upon closer inspection [43,44,45]. When the plasma intensity increases (e.g., with a higher voltage), a diffuse discharge will turn almost always into a streamer, which is a preferential ionization path [46]. It is an ‘ionization wave that propagates from a high voltage electrode toward the grounded electrode’ [28].
Positive streamers arise when a positive high voltage is applied to the discharge electrode (anode). They propagate from the anode toward the cathode (ground electrode). As negative streamers have different dynamics, this review focuses solely on positive streamers (the differences between both are discussed in [47,48,49]). Positive streamers are advantageous in practice due to lower breakdown voltage (Vbr) [50], higher electron density (ne), charge deposition (Q) [47,51] and enhanced RONS production [50]. Many studies have been carried out on DBD streamer dynamics. In this review a brief overview of the main processes associated with positive streamers will be given. For a detailed description of streamer dynamics we refer to the comprehensive review of Komuro [52]. Some important streamer observations are summarized in Table 1.
Kogelschatz et al. summarized that typical single streamers could last 1–10 ns, have a diameter of 100 nm and a length of a few mm [53]. Streamer evolution is divided in a primary streamer phase, secondary streamer phase and a post-discharge period. The primary streamer and secondary streamer are stages of the same streamer event, They differ from the primary and secondary discharge discussed in Section 2.2. In a positively pulsed DBD, the primary discharge corresponds to a positive streamer, while the secondary discharge (or back discharge) appears more diffuse [27].
A streamer head creates a very high local electric field and propagates towards the cathode. It forms when the electric field in the air gap (Eg) exceeds the dielectric breakdown strength of air (~3 kV/mm). Background seed electrons start the process by ionizing neutral gas molecules through inelastic collisions. Additional electrons are created due to these collisions and detachment from gas molecules (known as electron avalanche). The streamer head propagates with a certain velocity through air, while ionizing molecules in its trajectory.
In positive streamers, the streamer head propagates in opposite direction to the electron drift and is supported by photoionization (photons emitted by excited gas molecules create seed electrons in front of the streamer head) [49,54]. Its ‘slipstream’ is called the streamer channel. In this region the electric field is below the ionization threshold. Here, the electron density decreases due attachment to gas molecules (particularly in humid air) [52]. Most energy in the streamer channel is transferred to vibrational excitation of air molecules [52].
When the streamer head reaches the cathode (or the barrier on the cathode), a cathode fall (or surface streamer) develops near the surface [29,54]. The strong local electric field in the thin layer separating the streamer head from the barrier, will initiate secondary electron emission. At this stage, a conductive channel connects the anode to the cathode (the streamer head disappears). The electric field between the electrodes is redistributed. Now, a secondary streamer can develop at the anode [29,50]. The electron density in the secondary streamer strongly depends on the applied electric field [52]. After the secondary streamer phase terminates, the post discharge period begins. During this stage various processes such as recombination, relaxation and diffusion occur.
Therefore, when optimizing LTP for production of a specific RONS (such as ozone), one must consider both the discharge and the post-discharge period. In repetitive pulsed operations in air, positive and negative ions remain after the first pulse. These ions may disturb the subsequent pulses (‘pre-ionization’) [47,52,55].
Table 1. Important streamer observations in literature.
ObservationRefs.
An increase in pulse rise rate increases discharge current, streamer velocity and diameter.[56]
A decrease in the air gap decreased the streamer diameter (volume DBD).[57]
Higher streamer velocity, diameter and current observed for positive pulses.[49]
The electrical field magnitude and streamer diameter influence radical yield.[52]
Streamer length is independent of dd, decreases with increasing εr (surface DBD).[58]
Streamer velocity increases when εr increases (needle-plate DBD).[59]
A shorter gap length reduces the streamer duration.[52]
The length of the secondary streamer increases linearly with applied voltage (volume DBD).[29]
A positive streamer has a lower onset voltage and a higher velocity.[60]
The primary streamer length and velocity decreased by increasing the PRF (surface DBD).[61]
Primary streamer velocity and diameter increase by increasing the electric field in the gap (Eg).[62]

2.2. Charge Trapping in and on Barriers

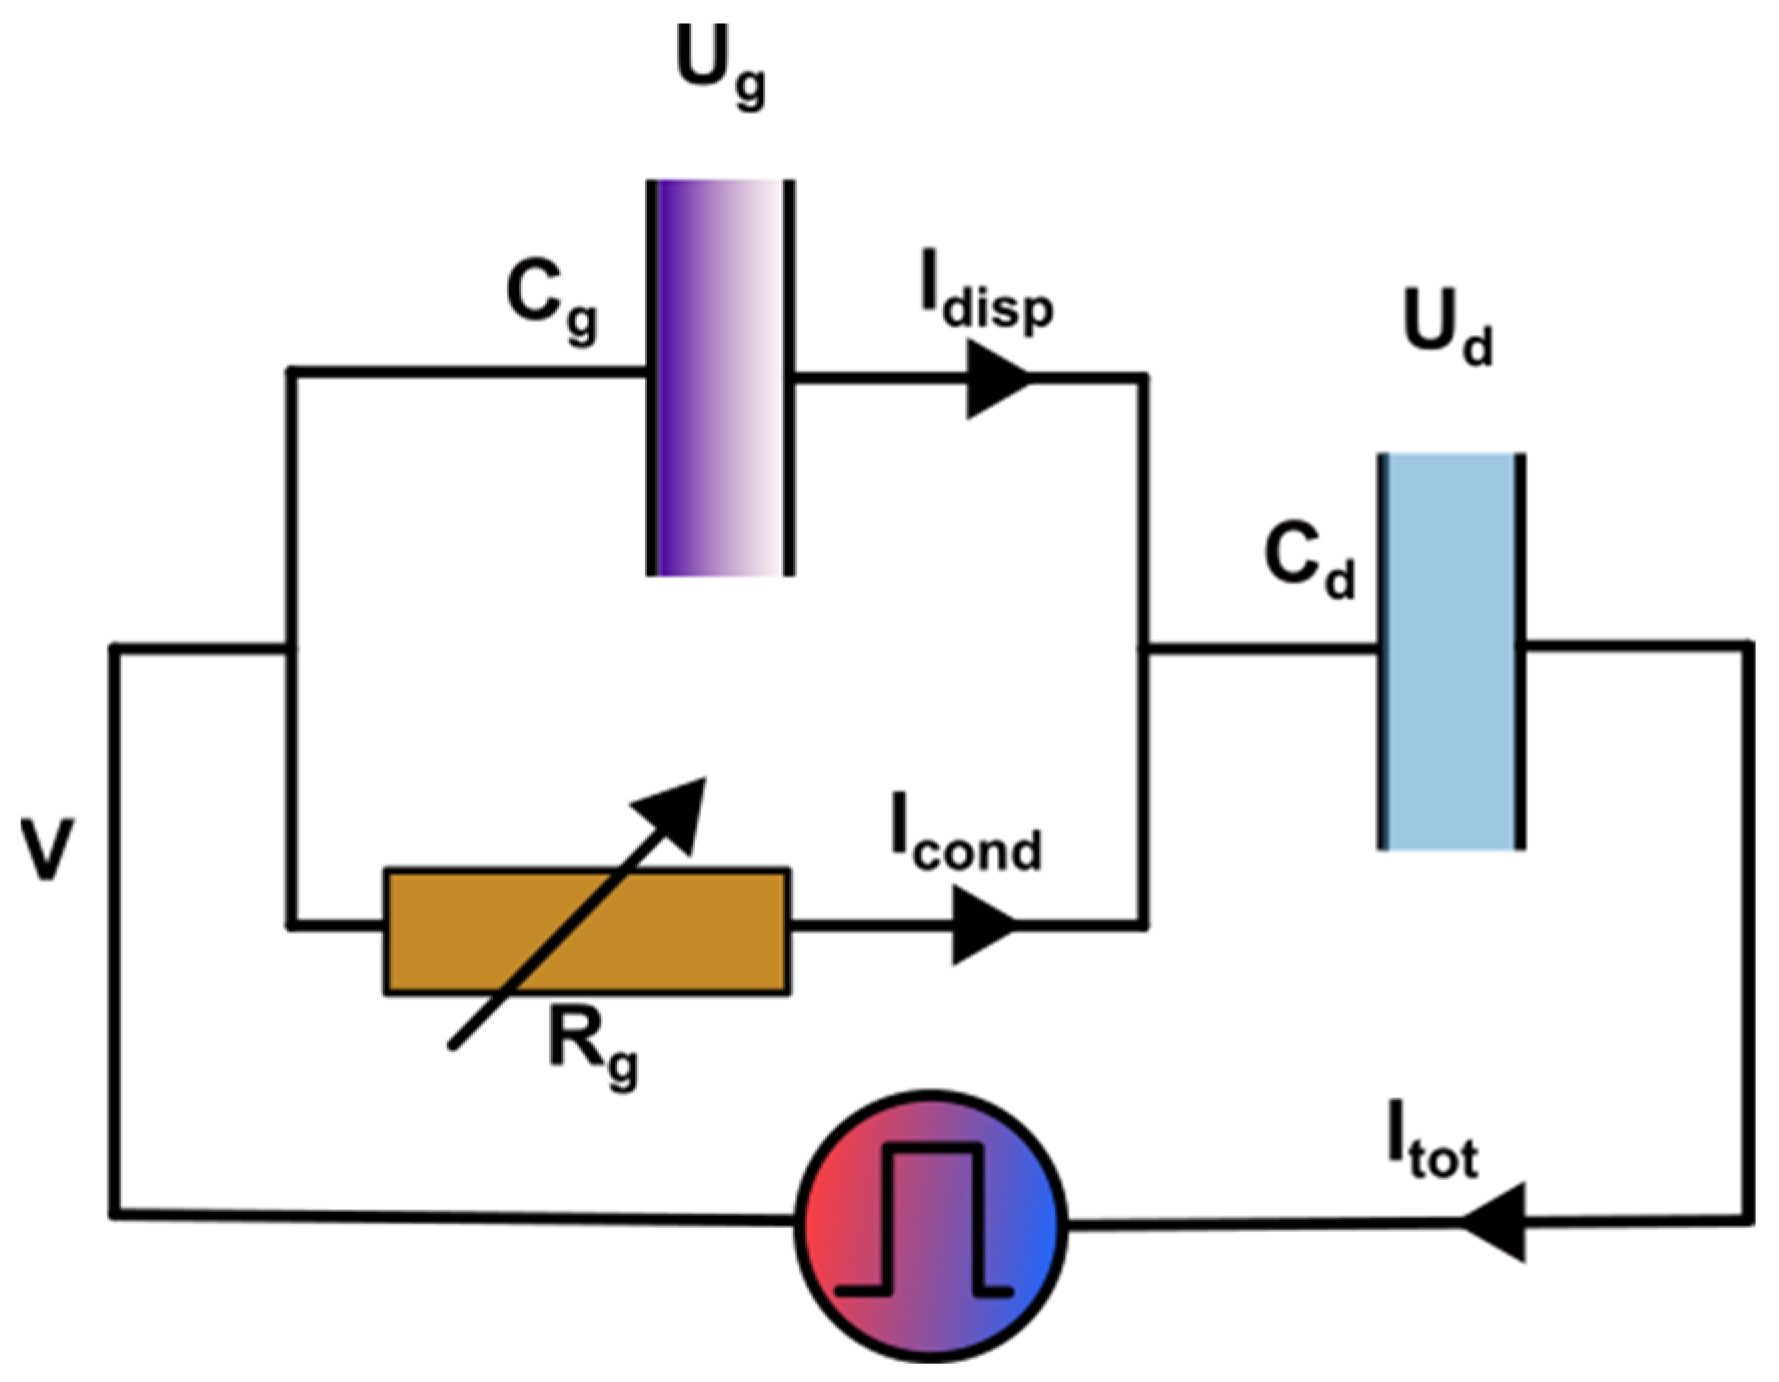
In a pulsed DBD the total current consists of a displacement current (Idisp) and a conduction current (Icond) [27,63]. The displacement current originates from the charging and discharging of the DBD which behaves as a capacitor. It does not contribute to LTP generation [64], and is proportional to the DBD capacitance (Ccell) [1]. The DBD capacitance typically is a series combination of gap capacitance (Cg) and dielectric capacitance (Cd), as shown in the equivalent circuit in Figure 3. For voltages V(t) below the breakdown voltage Vbr both capacitances remain constant. Once breakdown takes place, Cg changes, because plasma is formed in the gap (the resistance of the gap Rg → 0) [45]. Then, a conduction current appears either superimposed on the displacement current or slightly delayed [27,65,66]. It happens when the electric field in the air gap (Eg) is sufficiently strong to produce microdischarges. The conduction current results from electron avalanches in the air gap. It corresponds to the collective current of all microdischarges. A higher conduction current indicates a larger plasma volume, emerging from more streamers and/or longer streamers.
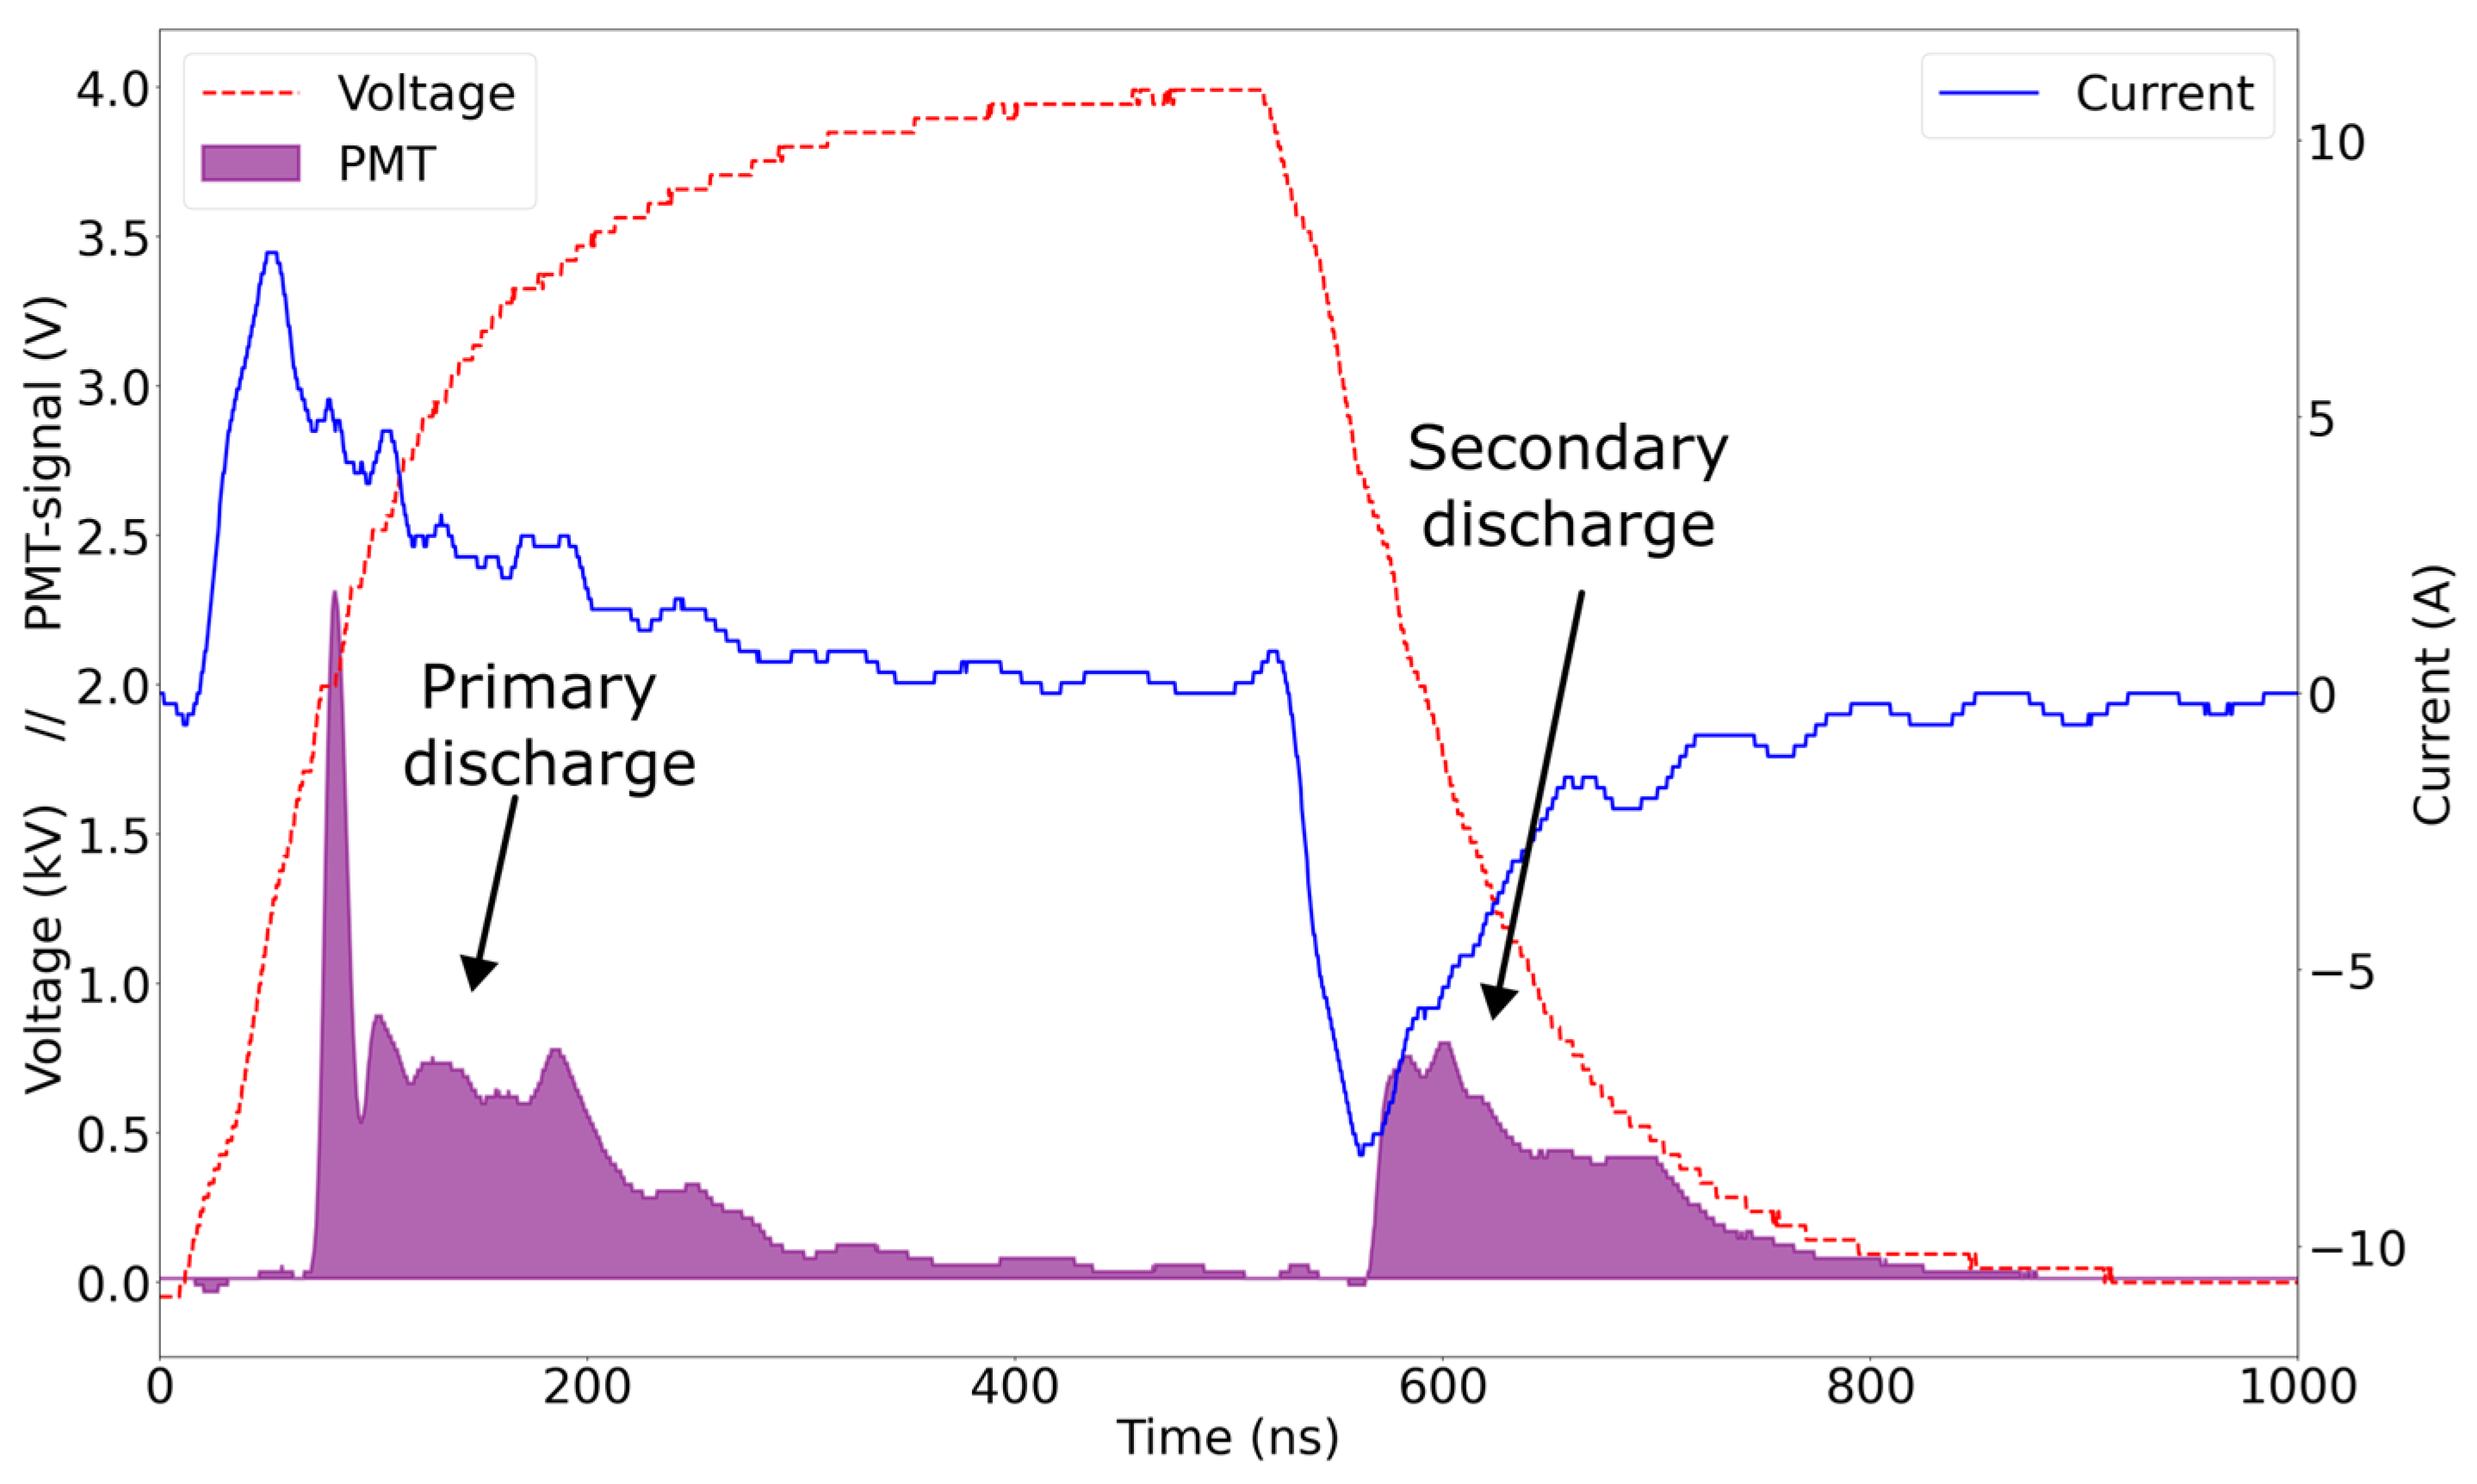
During operation, the dielectric barrier accumulates surface charges. It leads to the characteristic secondary discharge in nanopulsed DBDs, where charge (Q) temporarily stored on the dielectric surface due to the primary discharge is released at the end of the voltage pulse, causing a secondary or back discharge [34,67]. In Figure 4, both discharge events are displayed. A positive pulse, with a peak voltage of 4 kV and a duration of 600 ns produces two distinct current peaks, one during the rising edge and one during the falling edge of the pulse. Each discharge is accompanied by optical light emission detectable with a photomultiplier tube (PMT).
Surface charging shows up for repetitive positive, negative and alternating pulses [51,68]. It can be (partially) removed between pulses by using alternating pulses [51] or using slightly conductive/resistive barriers [69,70]. Although the plasma formation benefits from the secondary discharge, the residual surface charge between pulses suppresses the electric field of the next pulse [71]. When the PRF was increased from 0.1 to 5 kHz, the primary streamer length decreased ~15% and its velocity decreased ~30% in a surface DBD, attributed to higher the residual charge on the surface [61]. Investigations in [72] (based on [51]) identified two decay time scales for surface charge in a surface DBD: around 1 µs, caused by volumetric charge transport around the electrode, and around 100 µs, corresponding to ‘charge transport (redistribution) over the dielectric surface’. But redistribution does not imply complete neutralization. Volumetric charge transport occurs only within a few mm of the high-voltage electrode [72].
Some materials can store charges for a long time, not only on the surface, but also within their bulk. The dielectric barrier then becomes charged, and this charge can be trapped for a long time (days, weeks) [16,47,55,73,74]. It changes the local electric field distribution and typically lowers the conduction current. Other effects were reported such as a higher number of seed electrons [55], longer streamer channels [55] or dielectric breakdown [74]. Pipa et al. also observed a change in Vbr caused by charges persisting for >13 h [35]. Some materials behave as an electret under continued plasma exposure (PTFE, epoxy resin, silicone rubber, PP, PI, alumina) [67,73,74,75,76,77,78].
Three mechanisms are responsible for surface charge decay: bulk neutralization, gas-phase neutralization (recombination with ions in the air) and surface conduction [74]. Bulk neutralization means the neutralization of surface charges through migration of opposite charges (ions or electrons) from within the material (the ‘bulk’) to the surface. Gas neutralization appears to dominate the charge decay in DBDs, as surface conduction and bulk neutralization are often low for thin, insulating barriers [74]. Large amounts of ions (106–108/cm3) are present in the air gap of nanopulsed DBDs [47,55,74]. The higher the ion density in the air volume surrounding the barrier, the faster the surface charge decays [74]. Charge decay through surface conduction varies per barrier material. Silicone rubber shows faster surface charge decay than PTFE and epoxy resin, possibly due to shallower traps and higher polymer chain mobility in silicone rubber at room temperature (associated with its low glass temperature) [74,77].
Ren et al. identified three time constants ruling the decay of surface charges, namely the ion recombination time τr (in air, estimated 10–100 ns [47]), the diffusion time for charges along the dielectric surface τd and the surface charge relaxation time τs (which depends on the volume resistivity ρv and relative permittivity εr since τs = ε0 × εr × ρv) [47,73]. This implies that lower εr and ρv promote a faster charge decay [74]. However, these parameters are constrained by the barrier material chosen (to satisfy oxidation resistance etc.). For some barriers with moderate resistivity the discharge may operate as resistive barrier discharge [69,79]. But these materials (such as silicone) are usually less resistant to electron bombardment and can break down at high voltages. Ren et al. estimated that in atmospheric air τs >> τd >> τr [47]. This means that the surface charge decay is mainly dictated by εr and ρv. Since ρv is a bulk property, the barrier can be thin. A low εr would accelerate surface charge decay. However, charge decay is a complicated phenomenon, which can hardly be entirely predicted by a laboratory test setup, as noted by Molinié [80].
The voltage waveform also affects charge accumulation. AC driven discharges give a net positive surface charge, due to asymmetries between positive and negative microdischarges [72]. Modelling shows that bipolar pulses can potentially increase the charge deposited per pulse by about 30%, as the surface charge enhances the electric field during the opposite polarity pulse [47]. This applies also to alternating pulses, where the charge per pulse may increase by a factor 4 [68]. Leonov et al. used Kapton tape as a barrier and found even larger differences in charge per pulse for unipolar and alternating pulses, namely a factor 5 [51].
From a practical perspective, the hardware to create bipolar/alternating high voltage nanopulses is more complex than that of unipolar pulses. For example, a push-pull circuit needs two DC sources (a positive and a negative) instead of one. Simeni Simeni et al. used a custom-made magnetic pulse compression circuit [68], first described in [81]. Successful production of alternating and bipolar high voltage pulses was achieved using a cascaded H-bridge in [82,83], a solid-state Marx generator [84], and a combination of these [85].
As surface charging can negatively impact LTP production, dielectric barrier materials must be carefully chosen. Polymers appear to be particularly vulnerable to surface charging. They also have the ability to retain charge in and on the surface, forming electrets.

2.3. Electrode and Barrier Degradation

Many materials deteriorate when exposed to plasma due to chemical, mechanical and thermal damage (summarized in Table 2). High concentrations of RONS can cause chemical damage (oxidation of barriers and electrodes). Ozone is one of the strongest oxidizers found in nature (2.07 V, next to fluorine and 1.5× that of chlorine) [86,87,88]. In humid air, other powerful oxidizing agents such as the hydroxyl radical (·OH) are formed as well [20,21,89,90]. Electron and ion bombardment can gradually erode the barrier (eventually leading to breakdown), thereby increasing the air gap and changing the surface properties (e.g., increase hydrophilicity or induce semi-permanent charging) [76,91]. When a DBD is operated with a high intensity for a long time, heat damage may occur [92,93]. Excessive heating even caused melting damage on a high voltage nickel electrode in [92].
Plasma degradation of the following dielectric barrier materials has been investigated: FR-4 (epoxy-fiberglass used as substrate for most printed circuit boards) [94,95], PVC [91,96], PMMA [96], polyimide (‘Kapton’) [95,97,98,99], polypropylene [99], silicone polymer [100], silicon nanowires [101], PTFE (‘Teflon’) [76] and natural quartz [102]. No degradation was noticed in boro(alumino)silicate glass [96,99,103], alumina [97,99,104], mica [105] or man-made quartz [97,99].
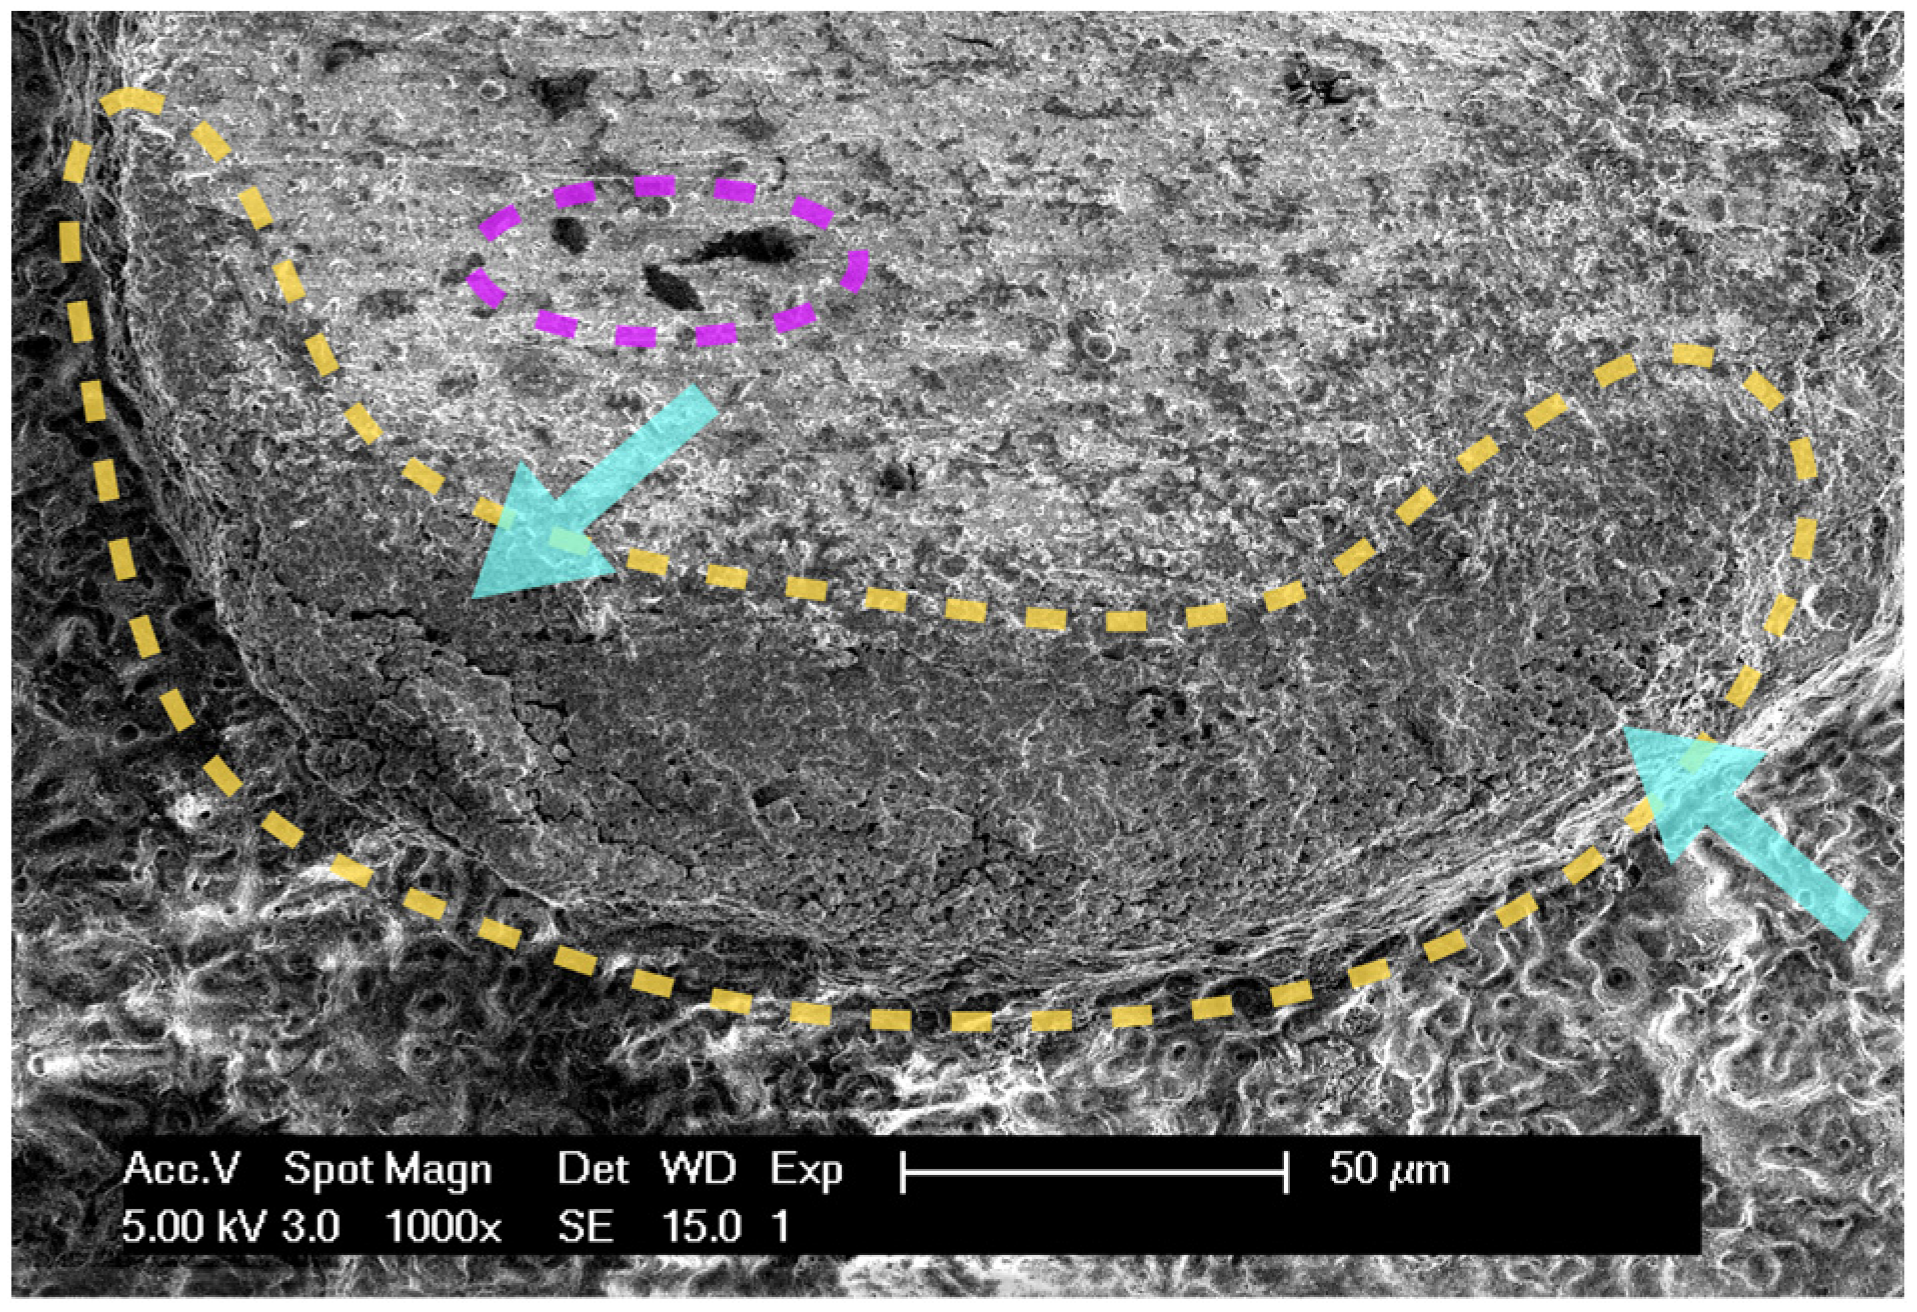
Electrode degradation has been reported for a range of metals: silver/platinum [106], silver/palladium (shown in Figure 5) [106,107], copper [103,106,108], (photolytic deposited) gold [109], aluminum [108], silver [97,100,110], tungsten [103,111,112], nickel [92] and stainless steel [93,111,112]. Typical degradation patterns include oxidation, crater-forming, melting and erosion. Gold wire performed well in air as it did not oxidize [110,111].
The type of powering also affects electrode degradation. Nguyen-Smith et al. experienced melting of the nickel electrode in a pulsed surface DBD when tpulse = 12 µs, whereas this did not occur when tpulse = 340 ns [92]. This effect could be attributed to the much shorter duty cycle of nanopulses, leading to lower electrode heating. In addition, nanopulses produce a more homogeneous discharge [24,92,113], preventing the formation of local ‘hot spots’ on the electrodes.
The electrodes can be protected against plasma by embedding them in a dielectric. Embedded electrodes were employed in coplanar DBDs [7,114,115], grating DBDs [2], multi-hollow DBDs [34,116,117] and volume DBDs [118]. However, embedded electrodes are still subjected to (rapidly changing) high electric fields and may heat up, without the possibility of convectional cooling by air (flow). Another drawback is that part of the applied voltage is ‘lost’ over the barrier. This lowers Eg in the air gap. To compensate for this loss, higher operating voltages are required compared to DBDs with an uncovered electrode. It cannot be excluded that plasma forms in microscopic voids between electrode and adjacent barrier (called parasitic discharges in [1]), which can eventually damage electrode and barrier.
Concluding, electrodes and barriers are prone to degradation during DBD operation. The best material for electrodes appears to be gold, whereas the best materials for barriers appear to be ceramics, quartz and glass.
Table 2. List of materials that were damaged through LTP exposure.
Degraded MaterialObserved Effect
FR-4 (epoxy/fiberglass)Whitening, increased hydrophilicity [94], epoxy erosion [95]
PVCIncreased hydrophilicity [91], discoloration [96]
PMMA (acrylate)Cavities, increased roughness, powder particle formation [96]
Polyimide (Kapton)Erosion [95], structural change polymer chain, whitening, etching [99], hole formation [97], roughening [98]
Polypropylene (PP)Breakdown, structural change polymer chain, whitening [99]
PTFE (Teflon)Charging [76]
Silicone rubberErosion [100]
Silicon nanowiresFracturing of nanowires [101]
Natural quartzMicrosoftening, decreased hydrophilicity [102]
Silver/PlatinumOxidation, deformation [106]
Silver/PalladiumOxidation, deformation [106], erosion, blackening [107]
SilverErosion [97], blackening [100]
Gold (photolytic deposited)Erosion, melting [109]
AluminiumOxidation, microcraters [108]
CopperErosion [103], oxidation [108], blackening [106]
Copper with Ni/Au coatingRough edges, holes [94]
TungstenOxidation [111,112], erosion [103]
NickelErosion, melting [92]
Stainless steelRelease of particles [93], oxidation [111], erosion [112]

2.4. Heat Production and Dielectric Loss Factor

DBD heat production is generally undesirable as it reduces the electrical efficiency, can damage the DBD and lowers ozone production (as discussed in Section 2.8) [26,92]. The heating can be limited by using (nano)pulsed powering instead of conventional AC [60,113,119,120,121]. Zhu et al. showed that ozone production increased 28% when nanopulsed powering was applied instead of AC powering [121]. The maximum temperature of their surface DBD, reached 59 °C when powered by nanopulses, but 73 °C when using AC powering. Two mechanisms contribute to this effect.
Firstly, due to a faster changing electric field (dE/dt), most energy is transferred to the electrons (Te), while less energy is used for vibrational and rotational excitation (Tvib, Trot) of the gas molecules (O2, N2, CO2, H2O). In any LTP, Te >> Tvib > Trot > Tgas [4,119,122,123]. But, the relative increase in Te is larger for nanopulsed excitation than for AC (whether the AC is continuously operating or in burst mode) [119]. Excited gas molecules release heat when relaxing back to their ground state [52]. The local temperature can rise several hundreds of degrees in a few microseconds [52].
Secondly, the relatively long intervals between repetitive nanopulses, allow the air to cool down [31,124]. Another hypothesis is that the streamer channel exists for a shorter time under nanopulsed driving. The electric field in a streamer channel is too weak to ionize air molecules, and most energy goes into vibrational excitation [52]. Shortening the streamer channel duration therefore limits the vibrational heating of the gas [26]. However, the streamer channel might be important in radical formation, as Ono and Oda showed that it could contain the highest ozone densities (up to 150 ppm in their pulsed needle-plate DBD) [29].
Hatamoto et al. recognized three mechanisms for heat generation in DBDs, namely Joule heating, ion flux heating and dielectric heating by time-varying electric fields [125]. Joule heating is caused by the conduction current in the air. Exothermic reactions involved in the formation of RONS, such as ozone, also heat the surrounding air [1]. Hot air warms the barrier by forced convection (depending on barrier’s thermal conductivity). When Joule heating is low, convective transfer to the dielectric barrier is limited. Additional cooling can be achieved through a gentle airflow. Ion flux heating derives from ions which heat the air and the dielectric by collisions. Although ion motion (due to Brownian motion and recombination) cannot be avoided once a plasma is formed, the flux of ions is low under nanopulsed excitation. The dielectric barrier will absorb energy from high frequency electric fields. This interaction is controlled by the dielectric loss factor (dlf) [1,125]. Hatamoto et al. found that Joule heating gives the largest temperature rise for AC powering [125]. However, in nanopulsed DBDs, it is the relative contribution of the dielectric loss factor which becomes more significant.
The dielectric loss factor is defined by [1]:
d l f = ε r · t a n ( δ )
where tan (δ) is the dielectric loss tangential, which depends on the material and the operating frequency. Some values for common barrier materials are listed in Table 3 below:
A higher dlf leads to more heating of the dielectric, as more electromagnetic energy is dissipated by dipolar relaxation processes [1]. Once heated, thermal diffusion spreads the heat through the barrier, and this process is faster in materials with higher thermal conductivity [126]. Barrier materials with low εr and low tan (δ) are most suitable for minimizing dielectric heating, which is beneficial for formation of certain RONS (discussed in Section 2.8).

2.5. Relative Permittivity (εr), DBD Capacitance (Ccell), Dielectric Thickness (dd) and Electrode Length (le)

The dielectric properties of the barrier strongly influence DBD performance. A low εr decreases the electric field in the air gap (Eg) and the charge deposition (Q). This reduction can be compensated, by lowering the barrier thickness dd, further discussed in Section 2.6 and [66,129,130].
For instance, Correale et al. reported a 33% increase in energy per pulse (Ep) when the barrier thickness was reduced by 50% [129]. This can be attributed to an increased DBD capacitance (Ccell). Leonov et al. observed that increasing Ccell from 33 to 55 pF, achieved by increasing electrode overlap, led to a 63% rise in the charge Q per pulse [51,131]. It doubled the discharge efficiency in their setup. Reducing dd brings several benefits: it increases the conduction current, while lowering the displacement current [66]. It also shortens the delay between the voltage pulse and plasma ignition [66]. Hulka and Pietsch found that Q increased 3.6 times in their coplanar DBD, by changing the dielectric material from quartz (εr = 2.3) to float glass (εr = 8.4) [130]. While they used AC powering, the same effect is expected upon pulsed operation, by the fact that Eg will be magnified in the same manner. When they decreased the electrode distance from 2 to 1 mm (effectively lowering dd and dg), the number of visible microdischarges doubled. Similarly, when Zhang et al. reduced the dielectric barrier thickness of their pulsed surface DBD from 1 to 0.5 mm, the measured current peak increased from 4 to 8 A [66]. It resulted in a doubling of the Ep. Patel et al. found that Ep increased from 0.7 to 2.8 mJ when dd was lowered from 9 to 2 mm in a pulsed volume DBD [131]. We thus observe a similar trend in various DBD setups: the energy deposited in the plasma is increased either through increasing εr or decreasing dd.
Both a low dd and a high εr increase Ccell [131], which in turn increases the pulse rise time [85,126]. In nanopulsed DBDs, not only Eg (set by the pulse voltage), but also the rate of field change (dE/dt, controlled by trise, tfall), plays a crucial role in RONS production [50,58,132,133] and plasma uniformity [134,135]. A higher dE/dt enhances the streamer-head velocity and the electron energy (Te) but shortens the duration of a high local Eg [136]. These effects could oppose each other in the formation of specific RONS, such as ozone [57].
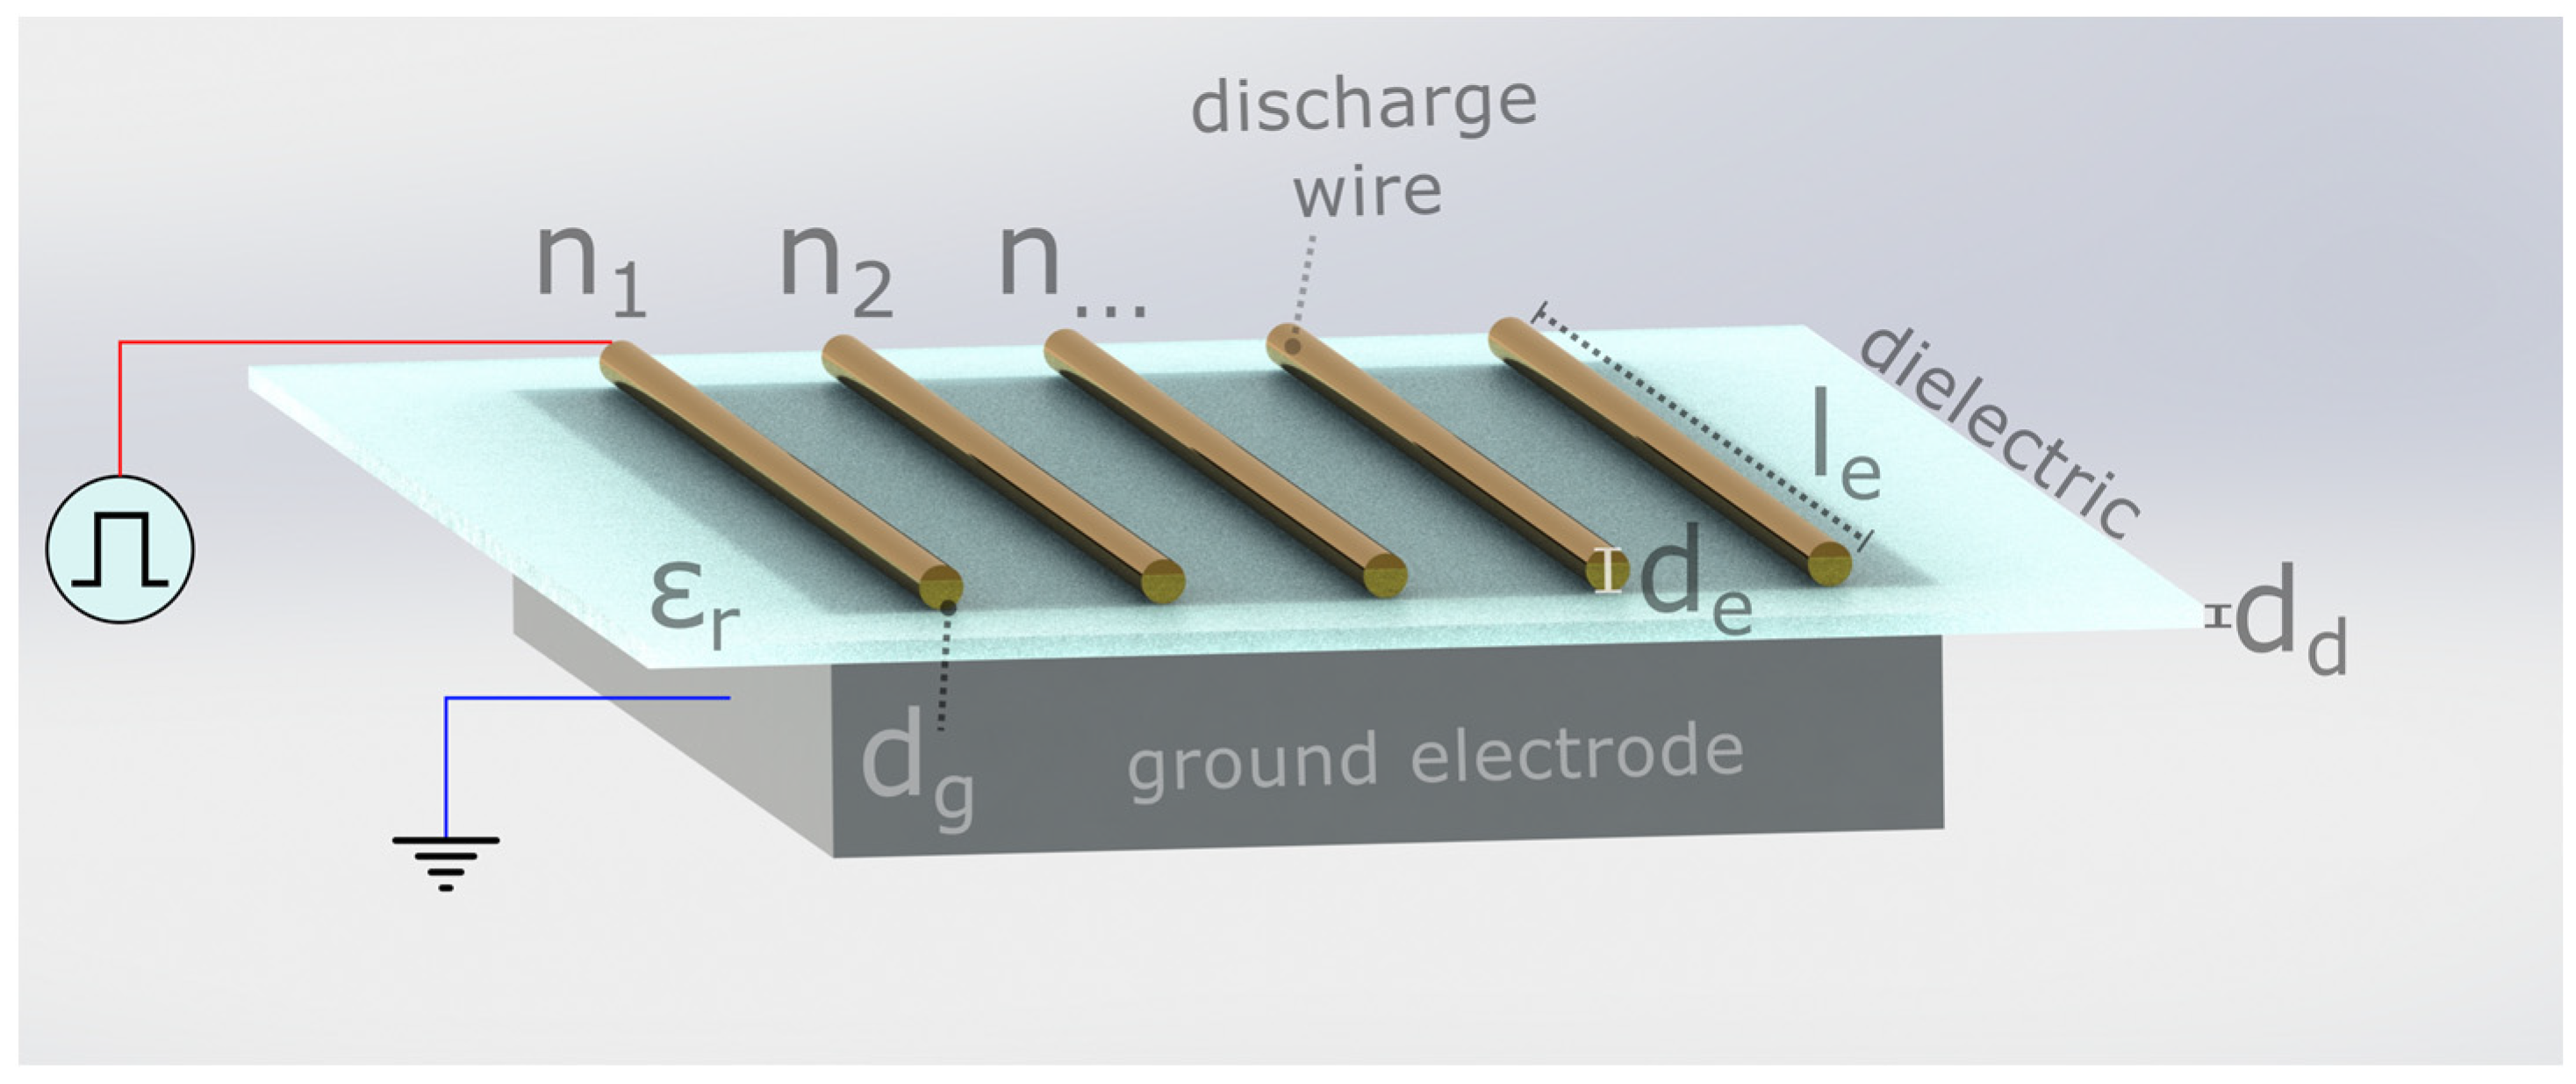
Taken together, these observations suggest that nanopulsed DBDs benefit from a moderate or low εr. It will lower dlf and increase dE/dt by reducing Ccell. Once Ccell is optimized, it can be further matched to the nanopulse source by adjusting the electrode length le (schematically shown in Figure 6). This will increase Ccell which in turn will increase the deposited charge Q (and thus the conduction current Icond per pulse) [66,81,137] and RONS production [123,138]. Zhang et al. increased le from 10 to 50 mm in a pulsed surface DBD. As a result, the measured current increased from 1 to 7 A [66].
Experimental results support this design strategy. Sokolova et al. found that the microdischarge length increased from 6 to 11 mm when εr decreased from to 15 to 7 in a pulsed surface DBD, while the number of microdischarge channels remained nearly constant [58]. A similar finding was reported in [139], where the discharge length more than doubled when εr decreased from 9.8 to 2.4. For positive nanopulses, dd itself did not influence the microdischarge length, reinforcing the preference for thin barriers with modest relative permittivity. Portugal et al. showed that, in a surface DBD, ozone production increased when the ratio ddr declined (from 1.0 to 0.1), under otherwise identical conditions [140]:
d O 3 ( t ) d t 1 l n ( d d / ε r )
This implies an equal contribution of dd and εr to ozone production. It can be explained by a higher power deposition in the plasma, leading to a higher number of energized electrons, which increases the possibility of nonelastic collision with oxygen molecules, leading to ozone formation (as further discussed in Section 2.8). Concluding, a DBD capacitive load (Ccell) should stay within bounds for the pulse source to perform well. Strategies to lower Ccell include lowering the barrier relative permittivity, increasing the barrier thickness, or decreasing the electrode area. However, to effectively deposit energy in the plasma, a low dielectric thickness and a long electrode length are beneficial. This conflict could be best resolved by choosing a thin barrier with a low to moderate εr, while using a thin discharge electrode, with the length le scaled so that Ccell is within bounds for the pulse source to operate reliably. Ccell unavoidably changes during plasma formation. It increases when surface charge remains on the barrier after a microdischarge event (see Section 2.2). Mitigation strategies include lowering the PRF (giving the remaining charge more time to decay), using bipolar pulses and choosing barrier materials with fast charge decay (such as silicone).

2.6. Electric Field Strength (Eg) Enhancement

The applied voltage strongly affects streamer development in DBDs. With the pulse voltage, the streamer length and width can be varied [50]. The voltage controls the magnitude of Eg, and also the duration of the high field period. A higher field allows the streamer head to propagate further along the barrier surface, thereby increasing the discharge length. Ultimately, Eg will define the RONS composition as it controls the electron density ne, Te and Icond [135,141,142].
An effective way to enhance Eg is to reduce dd rather than raising εr. This strategy was applied by Park, Eden et al., who achieved a volume DBD with a long electrode length and a thin alumina barrier of several hundreds of µm through an oxidation process [118]. As a result, ozone was formed at a very low applied voltage of 1.1 kVRMS. Vbr depends on both dd and εr. Vbr is decreases by lowering dd (and/or increasing εr) [66]. Soloviev et al. showed that increasing εr from 10 to 100 reduced the breakdown voltage by ~43% [143]. The dielectric thickness also influenced Vbr as V b r d d , provided that surface roughness is negligible [143]. The following relation holds between Vbr, εr and dd [143]:
V b r = 2.3 × ( 1 + 1 π × ε r ) × d d
where Vbr is in kV and dd in mm (for εr between 3–10). The relationship between Eg and Vbr is important: a decrease in Vbr implies a stronger Eg and more efficient plasma production.
Zhang et al. modelled the effect of εr and dd on the discharge energy (mJ/cm2, which is the energy per pulse Ep divided by the plasma area) [144]. They found that the discharge energy relies much more on dd than on εr. Specifically, when dd was lowered 6 times, the discharge energy increased 15 times. When εr was raised 3.7 times, the discharge energy increased 4.9 times. In this model, dE/dt was held constant, so the effect of changing Ccell (either through εr or dd) on the voltage rise time was not accounted for. They further reported that increasing εr from 2.7 to 10 raised Eg by 9%, ne by 83% and Te by 1.4%. Reducing dd from 0.9 to 0.15 mm also raised Eg by 2.7%, ne by 143% and Te by 0.9%. Experimental studies also confirm the dominant effect of barrier thickness. Using the Lissajous method for an AC-driven volume DBD, Yang et al. found that increasing εr from 3.9 (quartz) to 9.6 (alumina) increased the discharge power by ~54%, whereas decreasing dd from 3 to 1 mm increased the power > 400% [145].
Kogelschatz proposed that the charge Q is proportional to εr/dd, implying equal contributions from both parameters [146]. Peeters also observed an increase in charge per pulse with increasing εr/dd, although the magnitude depended strongly on the material [147]. The increase was four times stronger for quartz (0.08 nCmm) than for alumina (0.02 nCmm). Zhang et al. found that a DBD with a quartz barrier showed higher microorganism disinfection efficacy per energy input compared to other barriers (alumina, PEEK) [2].
In practice, not only εr and dd contribute to Q (and thus Icond). Other factors like the surface roughness also play a role. Alumina surfaces are rougher than quartz surfaces [126]. Rougher surfaces cause microscopic deviations in the electric field distribution, and lead to localized microdischarges [41,52]. This effect becomes more pronounced for thin electrodes and barriers [143]. It leads to ‘hot spots’, locations where microdischarges more frequently occur. This local heating may lead to faster material degradation. Other material properties such as water absorption, secondary electron emission and shallow traps also affect the discharge characteristics [39,52,148]. Shallow traps are structural defects where electrons with a low energy Te (<1 eV) can be temporarily stored [39]. These provide seed electrons for subsequent discharges.
An alternative route to enhancing RONS formation involves the application of a magnetic field in the air gap [149,150,151,152,153,154]. Electrons in the air gap follow helical trajectories (Larmor precession), thereby increasing the probability of collision with gas molecules [151]. Although beyond the scope of this review, this mechanism suggests that adding magnets to a DBD may further increase the RONS yield. A summary of the influence of all these DBD variables is given in Table 4. In general, a thin dielectric enhances the electric field in air, similarly to a high relative permittivity of the barrier. Lowering the barrier thickness appears to be the most effective strategy to this end, however, as εr often is not free to choose.

2.7. Electrode Width (we) and Gap Distance (dg)

The geometry of the electrode strongly influences the electric field in the discharge region. Electrodes with sharp or narrow features are commonly employed in LTP systems because they enhance Eg due to their small radii of curvature (compared to a flat or wide electrode) [46]. As a result, Vbr will then also become lower [107]. Therefore, many DBD setups use thin wires, needles, sharpened edges or narrow electrodes, with small electrode width we [155,156,157]. Using sharp or narrow electrodes produces several beneficial effects. It promotes faster streamer head initiation, increases streamer density and leads to a more uniform plasma [60]. It boosts the ionic wind (thrust) [155] and enhances ozone yield [158]. Lowering we also decreases Ccell (by lowering area A in the equation C = ε0 × εr × A/d), allowing a higher dE/dt and a lower displacement current Idisp [62].
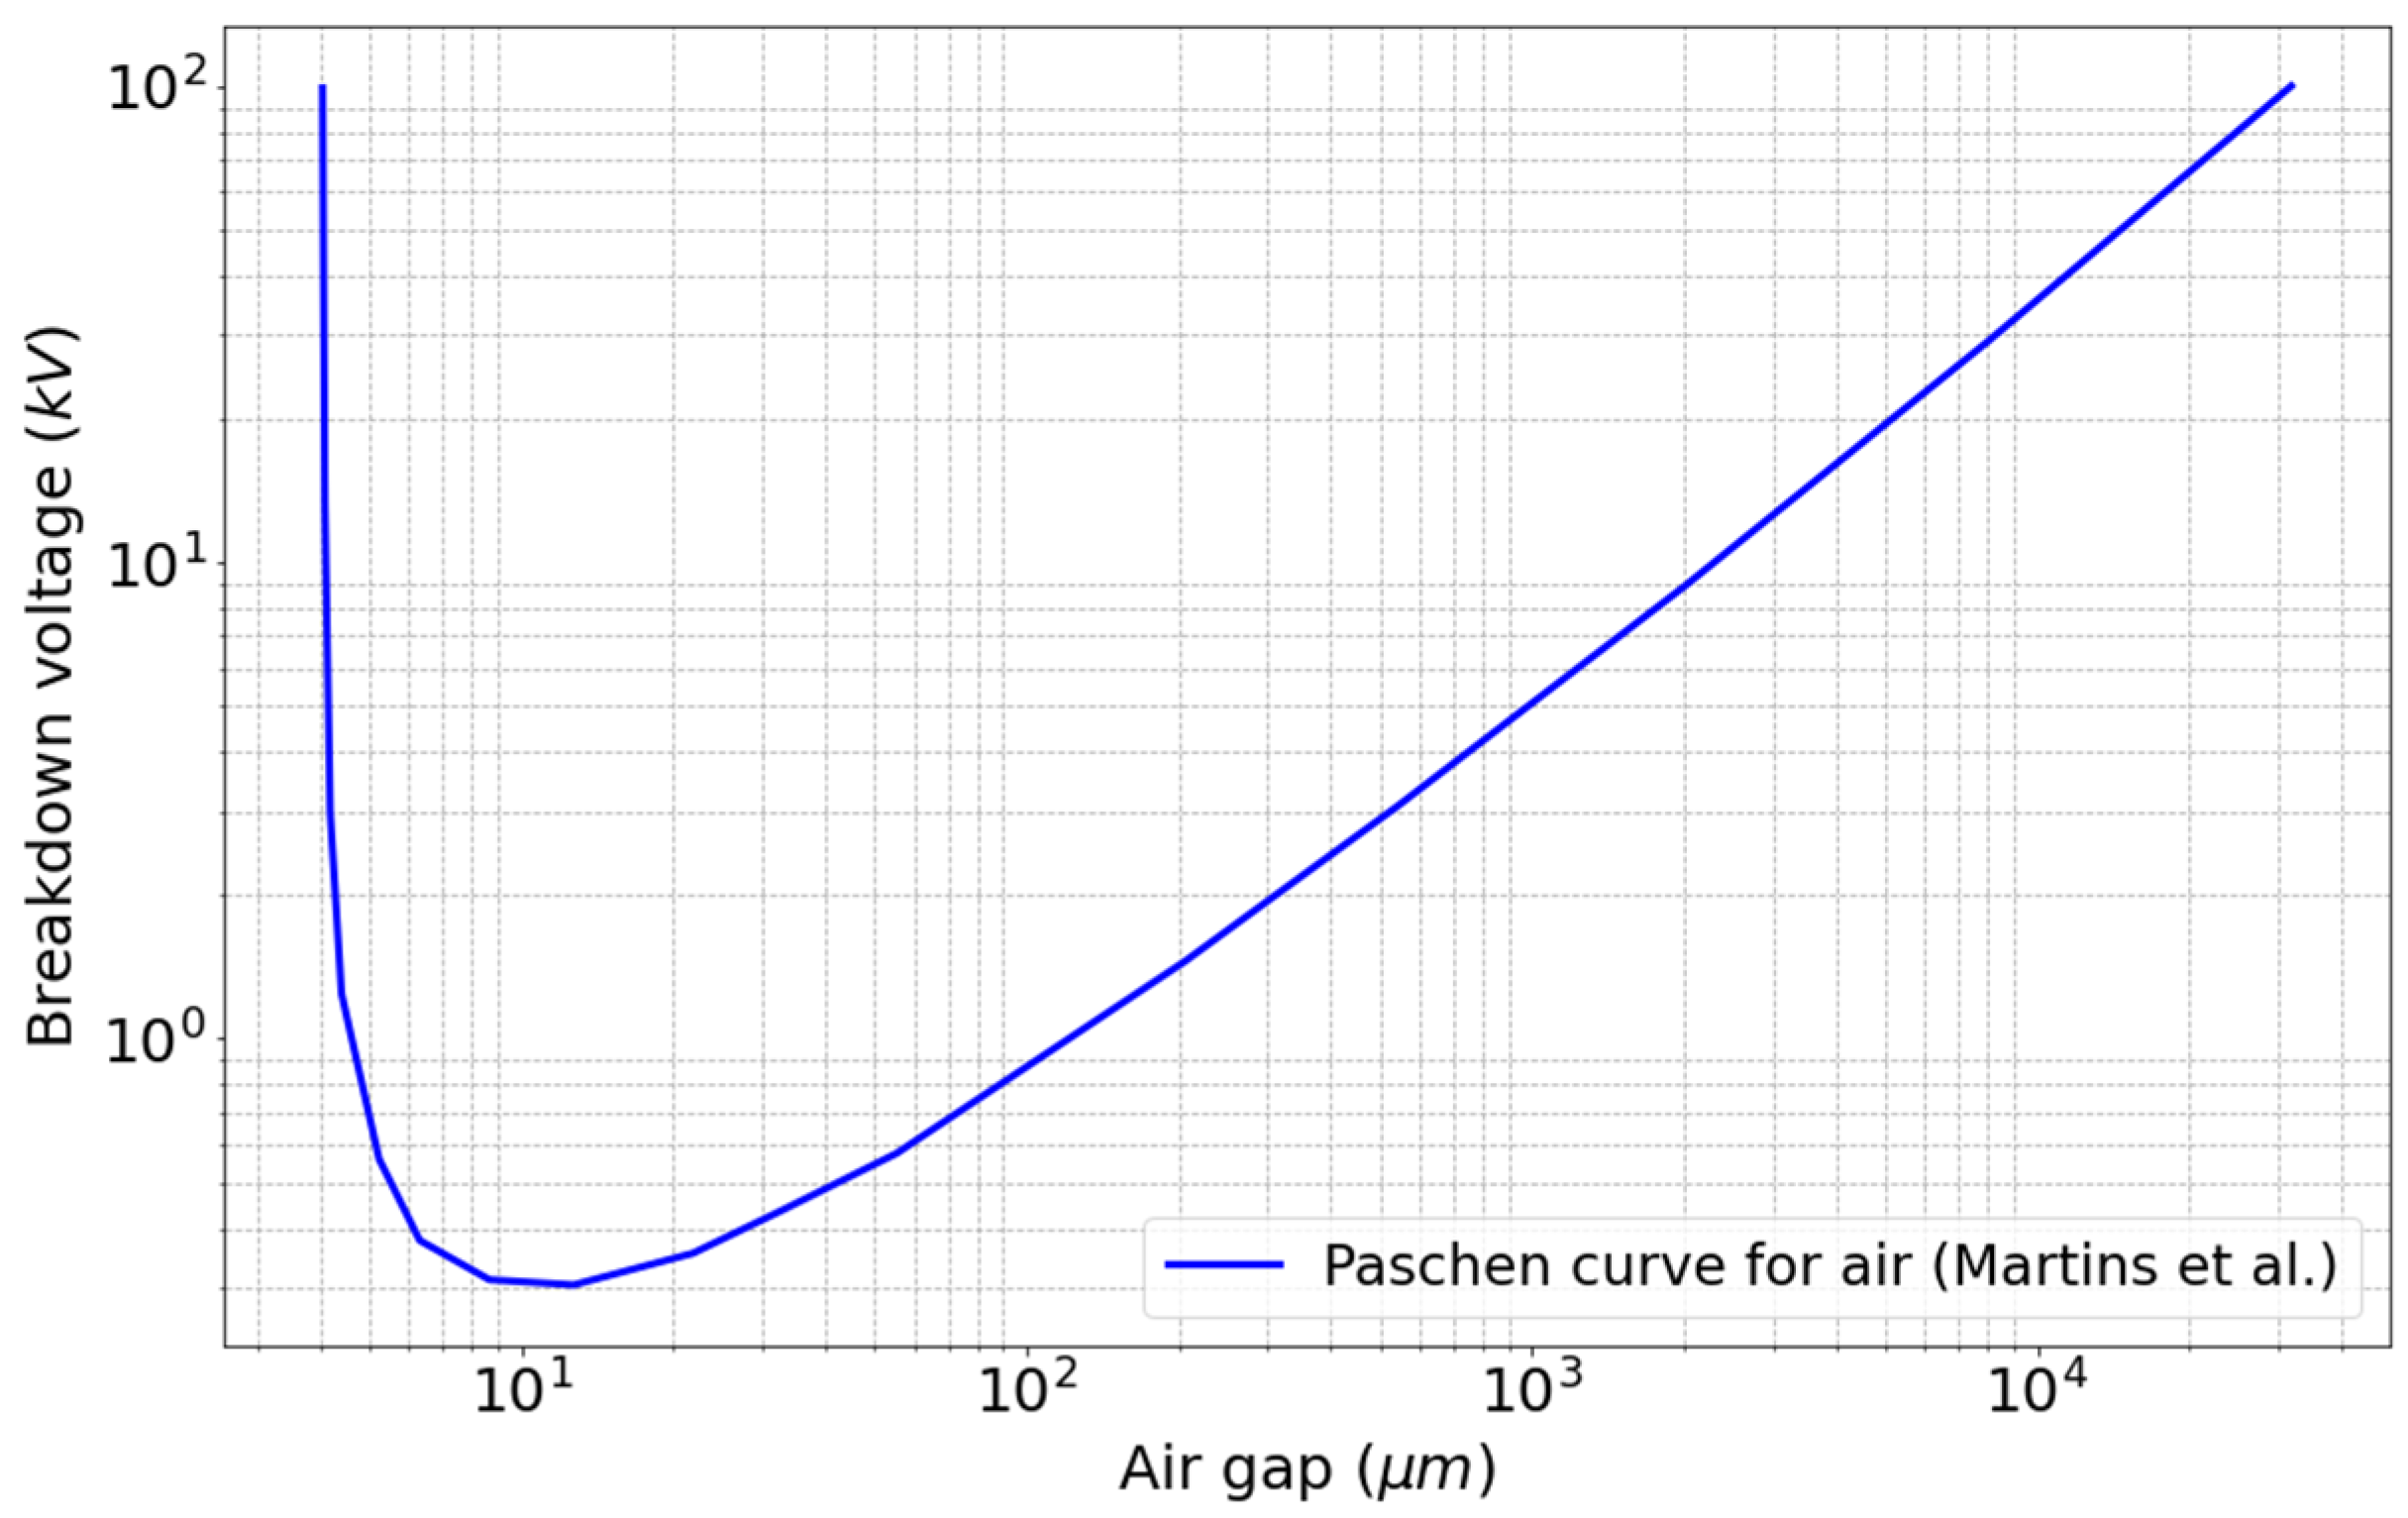
The gap distance dg also plays a crucial role. It was explained in [62] that a small gap distance increases Eg, which boosts the primary streamer head velocity, the streamer diameter, and oxygen radical production in air. It was shown that as dg increases, Eg will weaken, causing the conduction current to drop sharply [159,160]. The conduction current peak dropped from ~2 to 0.6 A when the gap distance in a pulsed corona discharge went up from 3.5 to 4.5 cm [159]. It follows from Paschen’s law that Vbr increases when dg increases (this occurs for gaps > 7.5 µm in atmospheric air, depicted in Figure 7) [161]. Small gaps (<1 mm) decrease the energy per individual microdischarge [162]. Then, charge deposition will become more homogeneous (given that le is sufficient to accommodate multiple microdischarges simultaneously [53]). This behaviour was observed for gap distances of 1 and 4 mm in [162]. A short gap distance was for example applied in the multi-hollow DBD (by Homola et al. in [116]), where dg = 0.6 mm, promoting ozone production with a yield of up to 205.5 g/kWh in air Aerts et al. found that lowering dg (from 3.3 to 1.8 mm) increased CO2 conversion in their DBD from 20 to 30% [163]. They related this to the smaller gap having a higher power density, a higher electron density and a stronger electric field in the air gap. Buntat et al. found that a decrease in dg from 3 to 1.5 mm resulted in an increase in ozone production (500 vs. 1200 ppm) in a volume DBD [33]. Additionally, a small dg appears to suppress the production of low energy electrons that would otherwise contribute to ozone dissociation through electron-impact processes [1,164]. A small electrode width and gap distance could thus, in summary, facilitate plasma formation in air.
The combined findings in Section 2.5, Section 2.6 and Section 2.7 are summarized in Table 4 and Figure 8.

2.8. Ozone Production and Decomposition

Ozone production is one of the most important applications of nanopulsed DBDs. LTP is regarded as one of the most efficient technologies to produce ozone on an industrial scale [165]. Ozone is used for gas cleaning, odour removal, disinfection and water treatment [3,4,12]. The production of ozone in air depends strongly on microdischarge channel temperature, ambient temperature and humidity, air flow, electric field strength and voltage pulse rise time.

2.8.1. Formation, Decomposition and Transport of Ozone

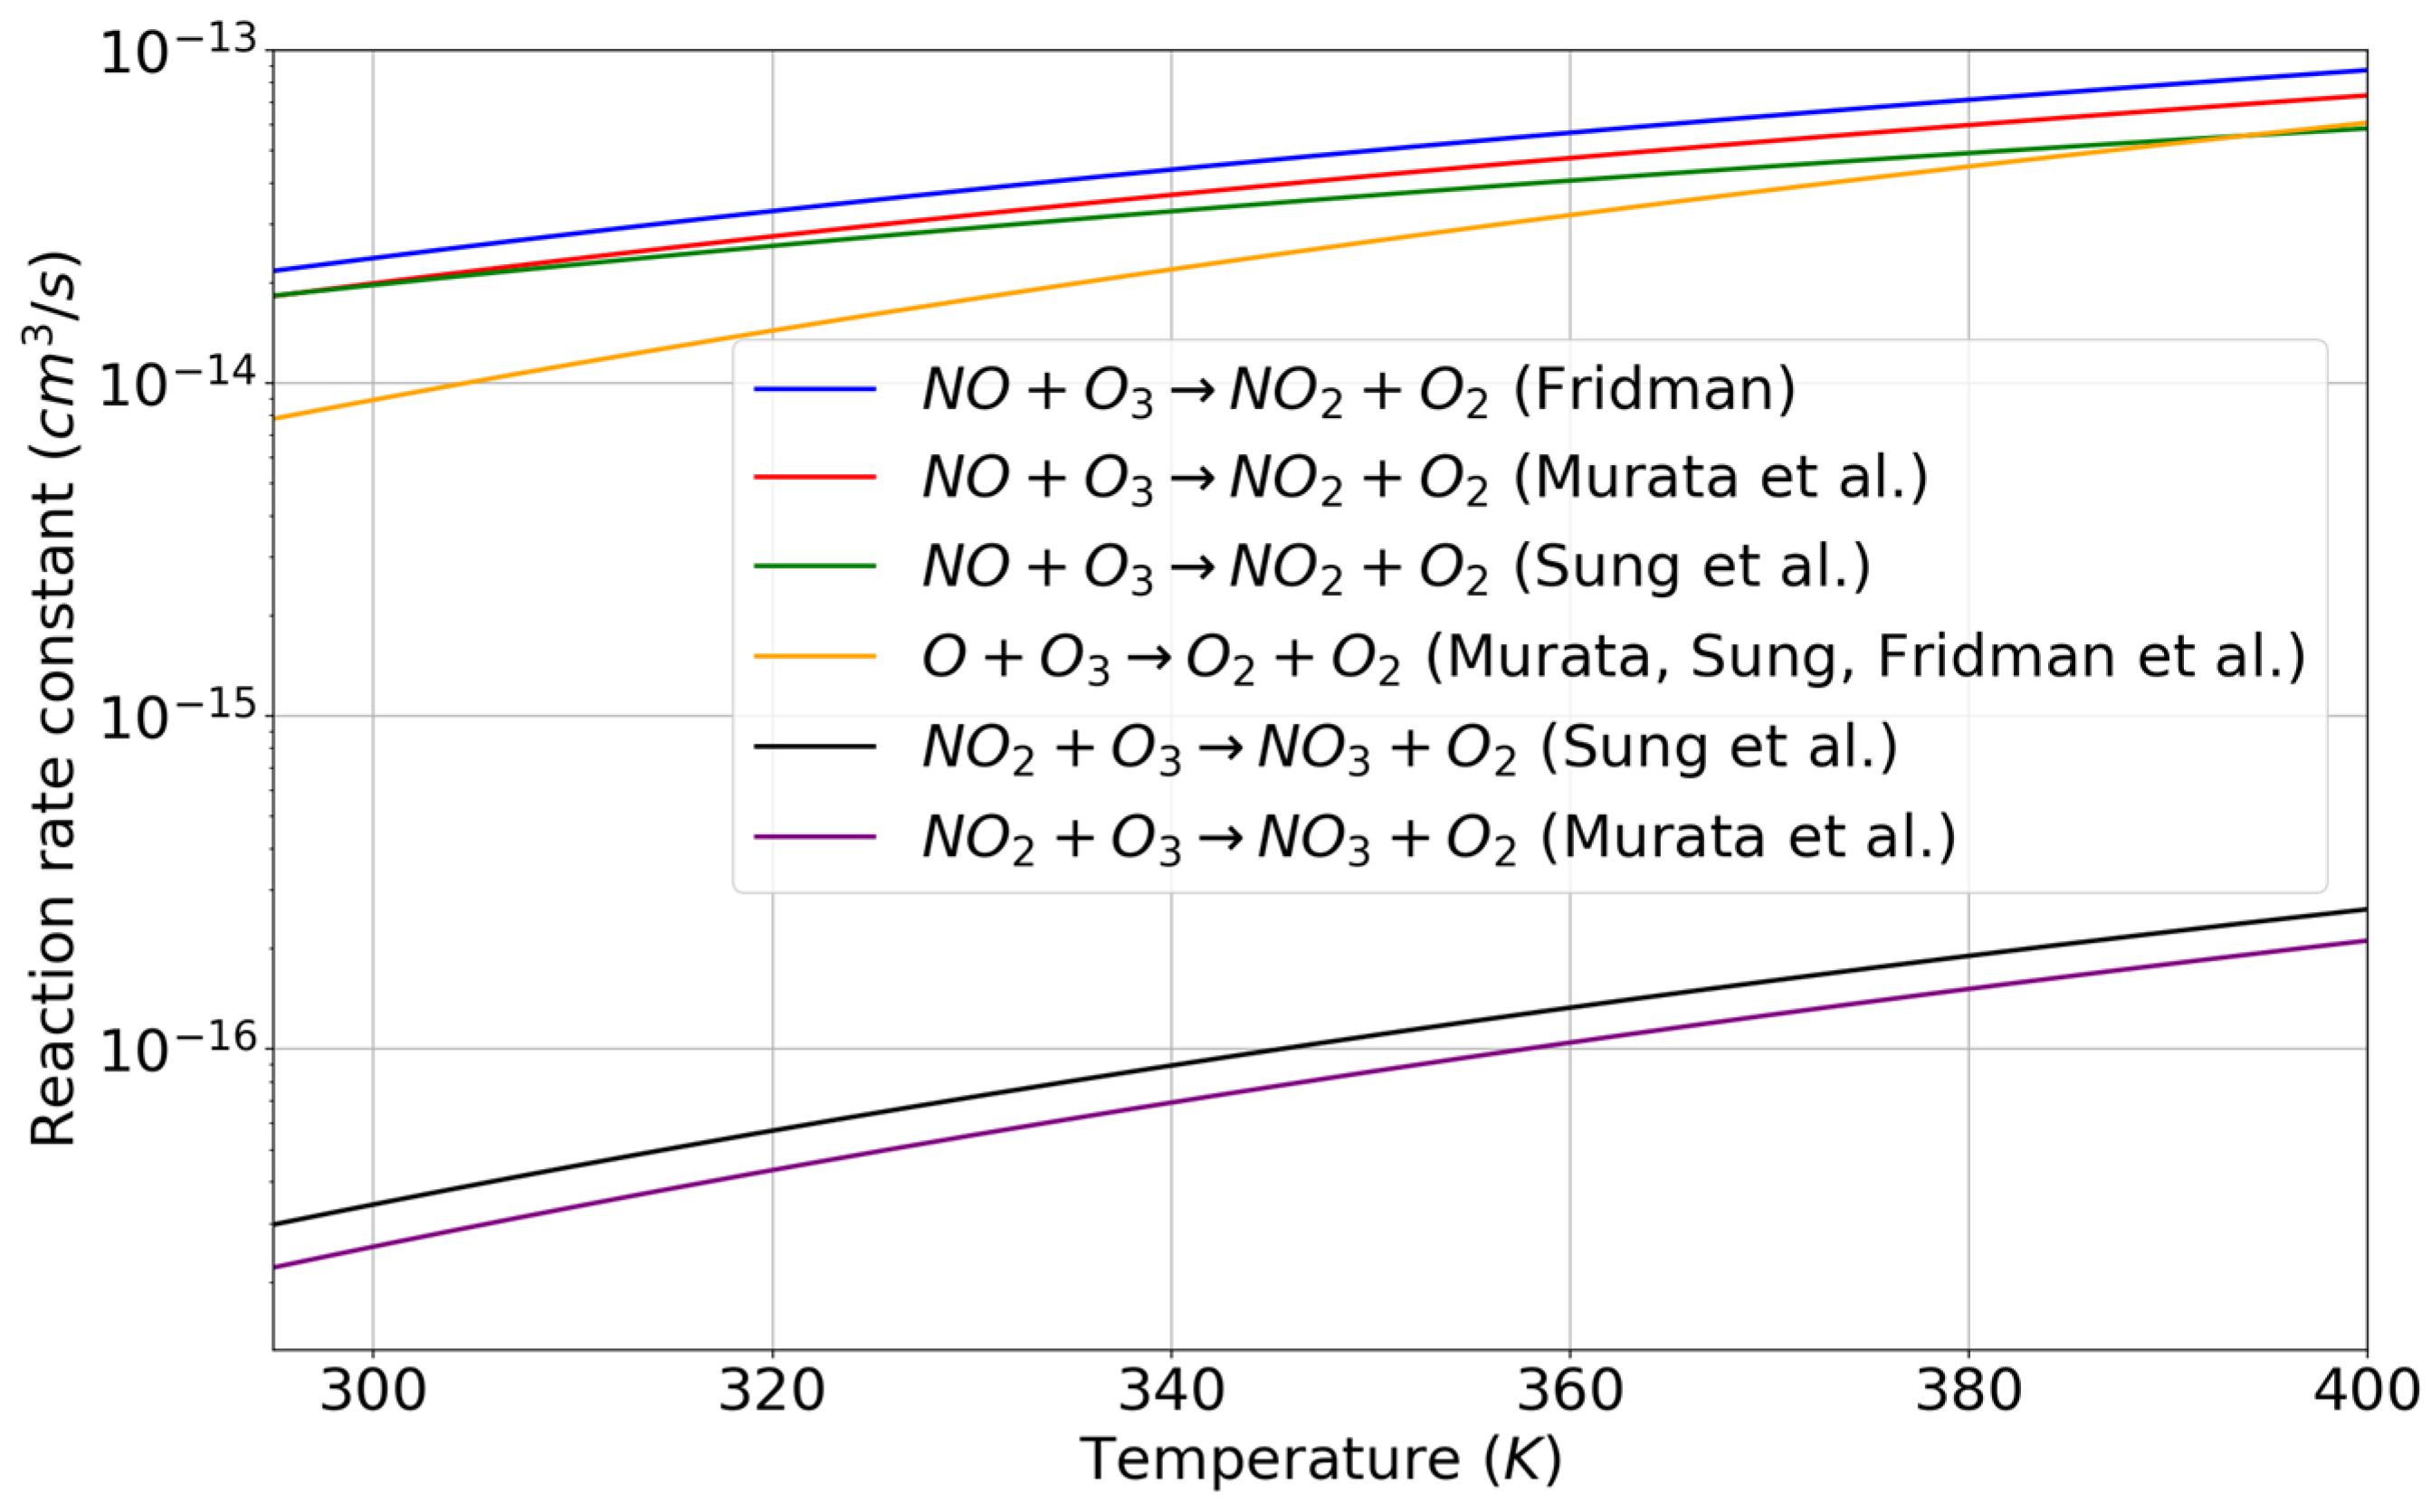
Ozone formation can be lowered, when the ambient temperature and/or microdischarge channel temperature increase [32,166,167,168,169,170]. This effect, called ‘quenching’ [171,172,173] or discharge poisoning [15,26,174], occurs when O atoms rapidly react with nitrogen molecules before they can form ozone [26]. Under such conditions, the discharge shifts from the O3 mode (producing mainly O3 and some N2O, NO2, N2O4 N2O5 and HNO3) to the NOx mode (producing mainly HNO3, NO, N2O5, NO2 and N2O) [117,174,175,176]. Active cooling can delay this shift by lowering the temperature rise [20,26]. Similarly, excessive voltages and pulse repetition frequencies can quickly heat the plasma (by a too high power density or specific input energy (SIE)) and also trigger a transition from O3 to NOx mode [177].
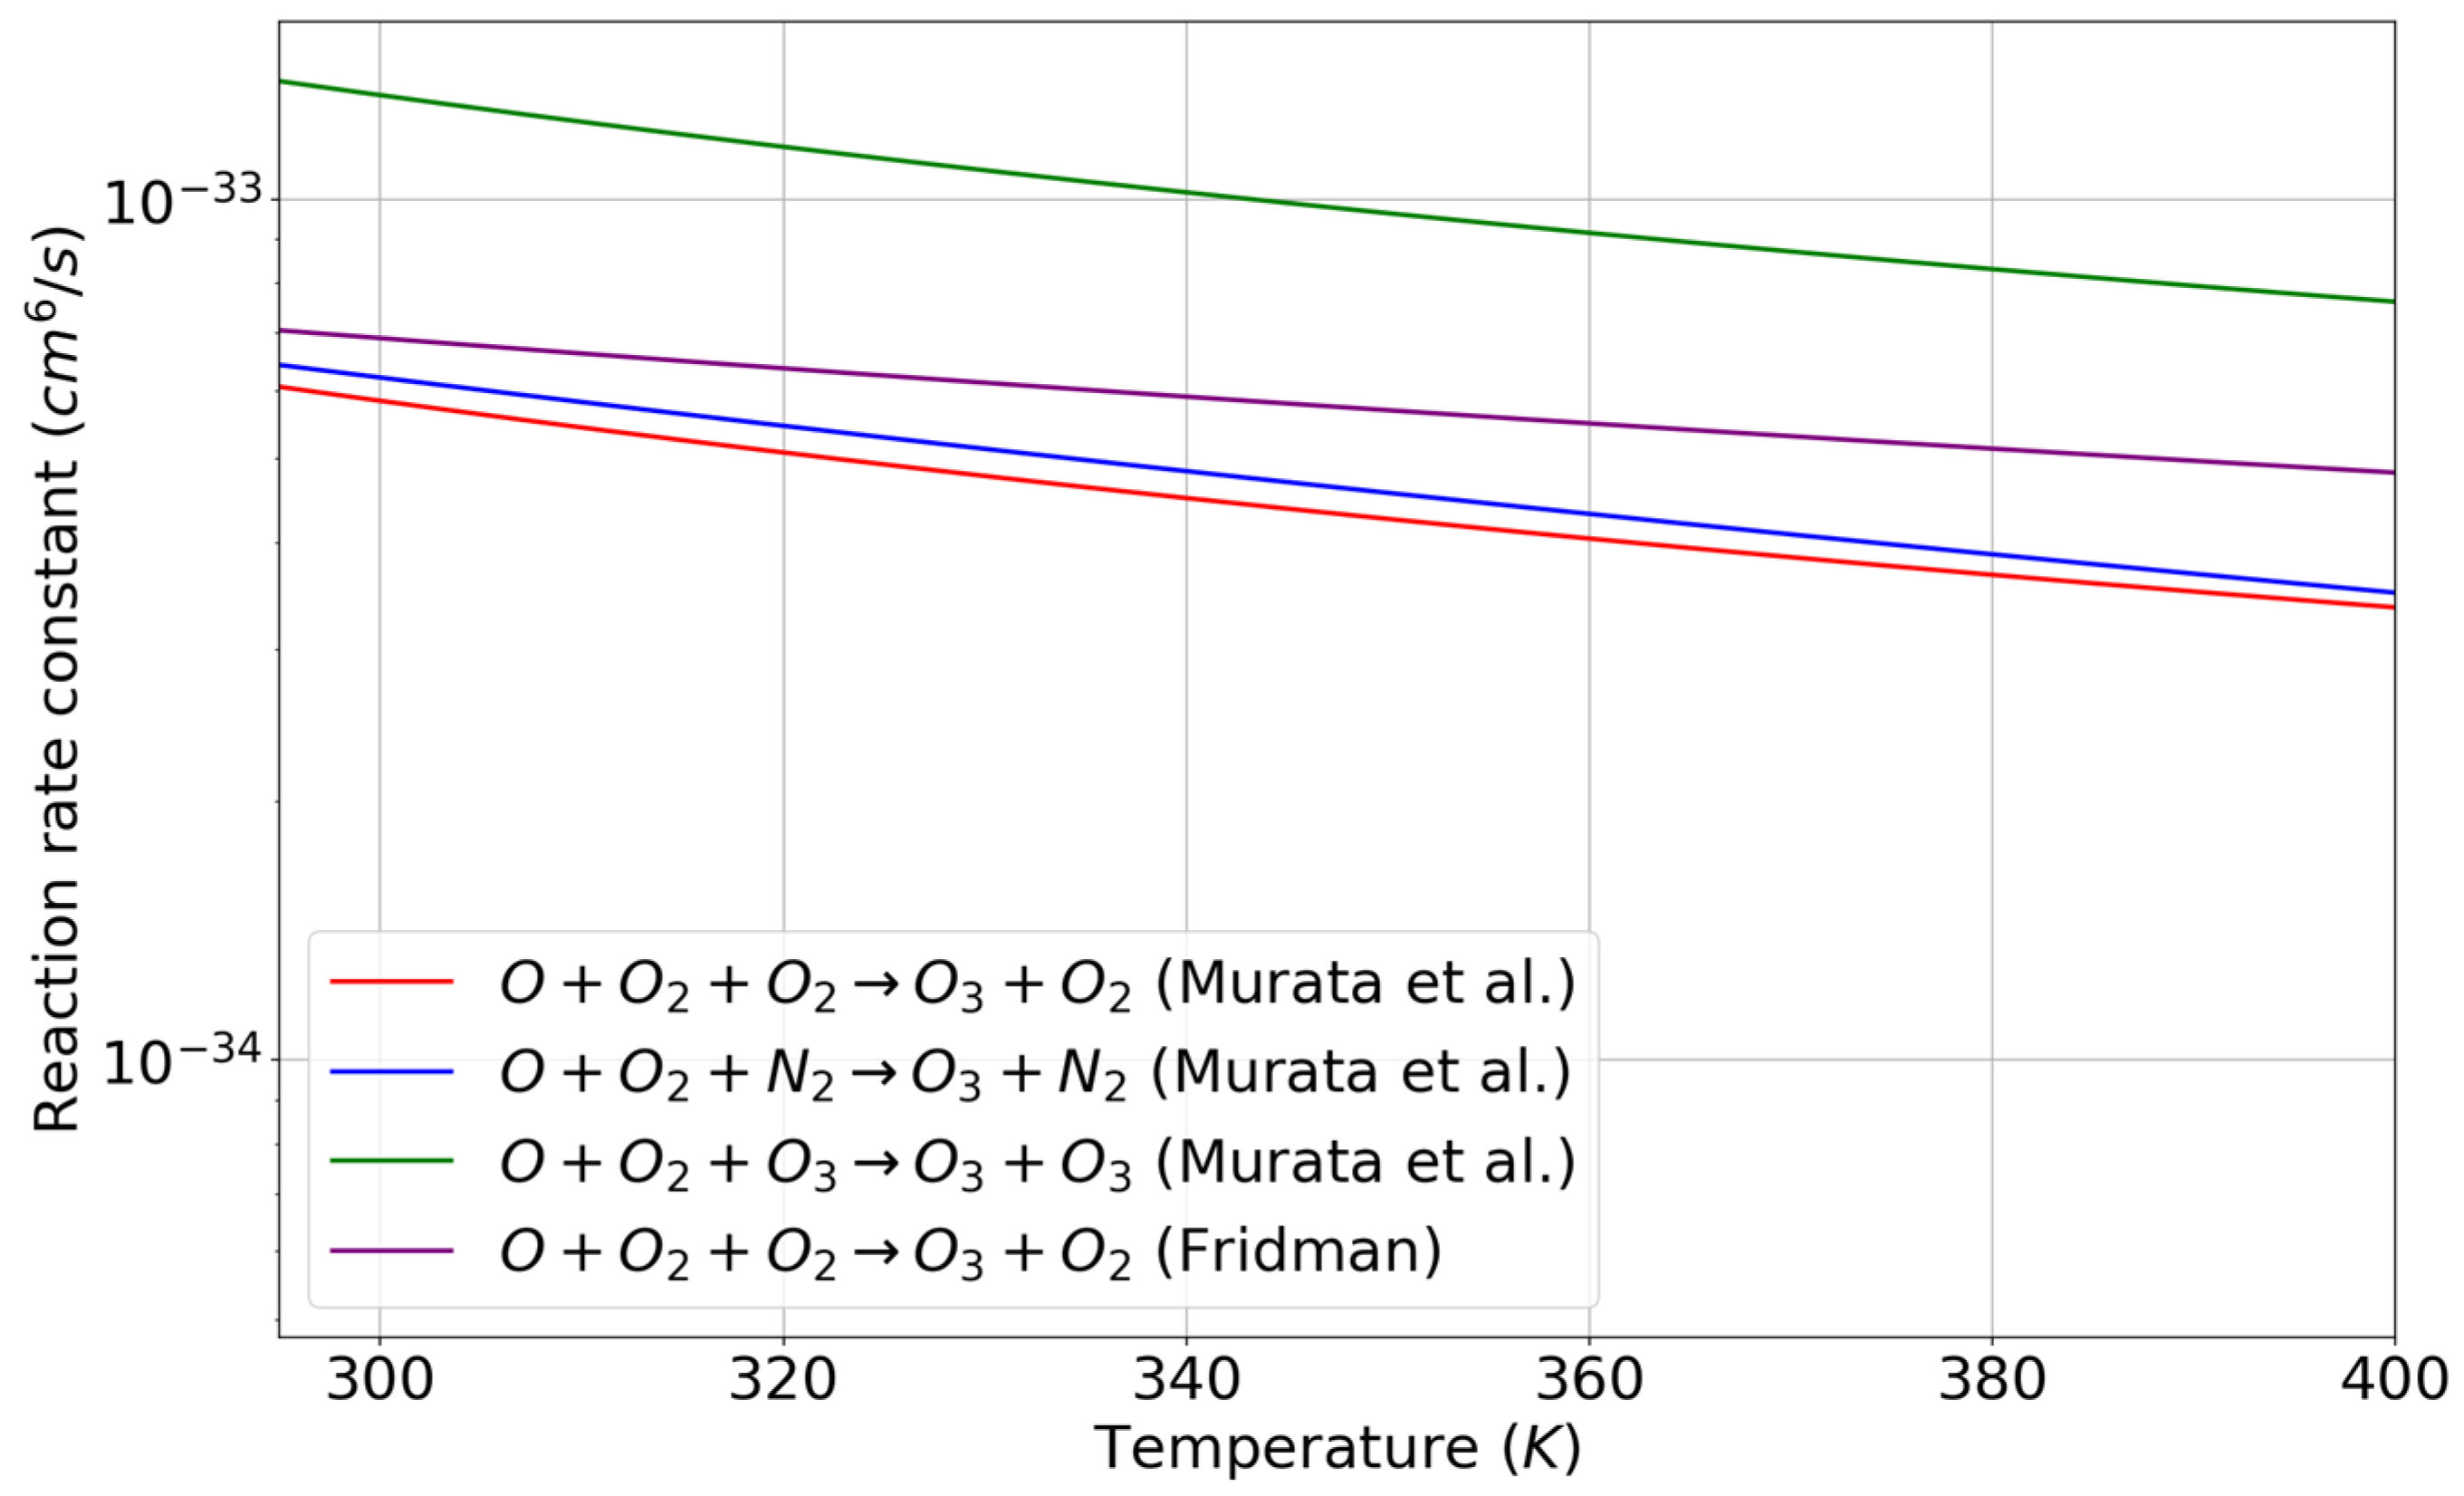
Some ozone formation and dissociation reaction rates are plotted against air temperature in Figure 9 and Figure 10.
Ozone can decompose, once formed, by several ambient factors. Air flow can be useful to transport ozone away from the plasma area. However, high air flow can promote ozone decomposition by mechanical force [20,117,176,178,179]. Increasing the humidity also reduces the ozone yield (Equation (5)) [20,94,117,178], because atomic oxygen (O) participates in competing reaction pathways, leading to HO2 and hydroxyl radicals production, rather than ozone [26,89]. A high humidity also affects the plasma dynamics by lowering streamer radius and propagation speed [52], increasing the surface conductivity of the barrier and modifying the electric field in the air gap [26,165]. Charged water clusters can be formed in humid air, which capture ions and electrons, further limiting ozone formation [52,180].
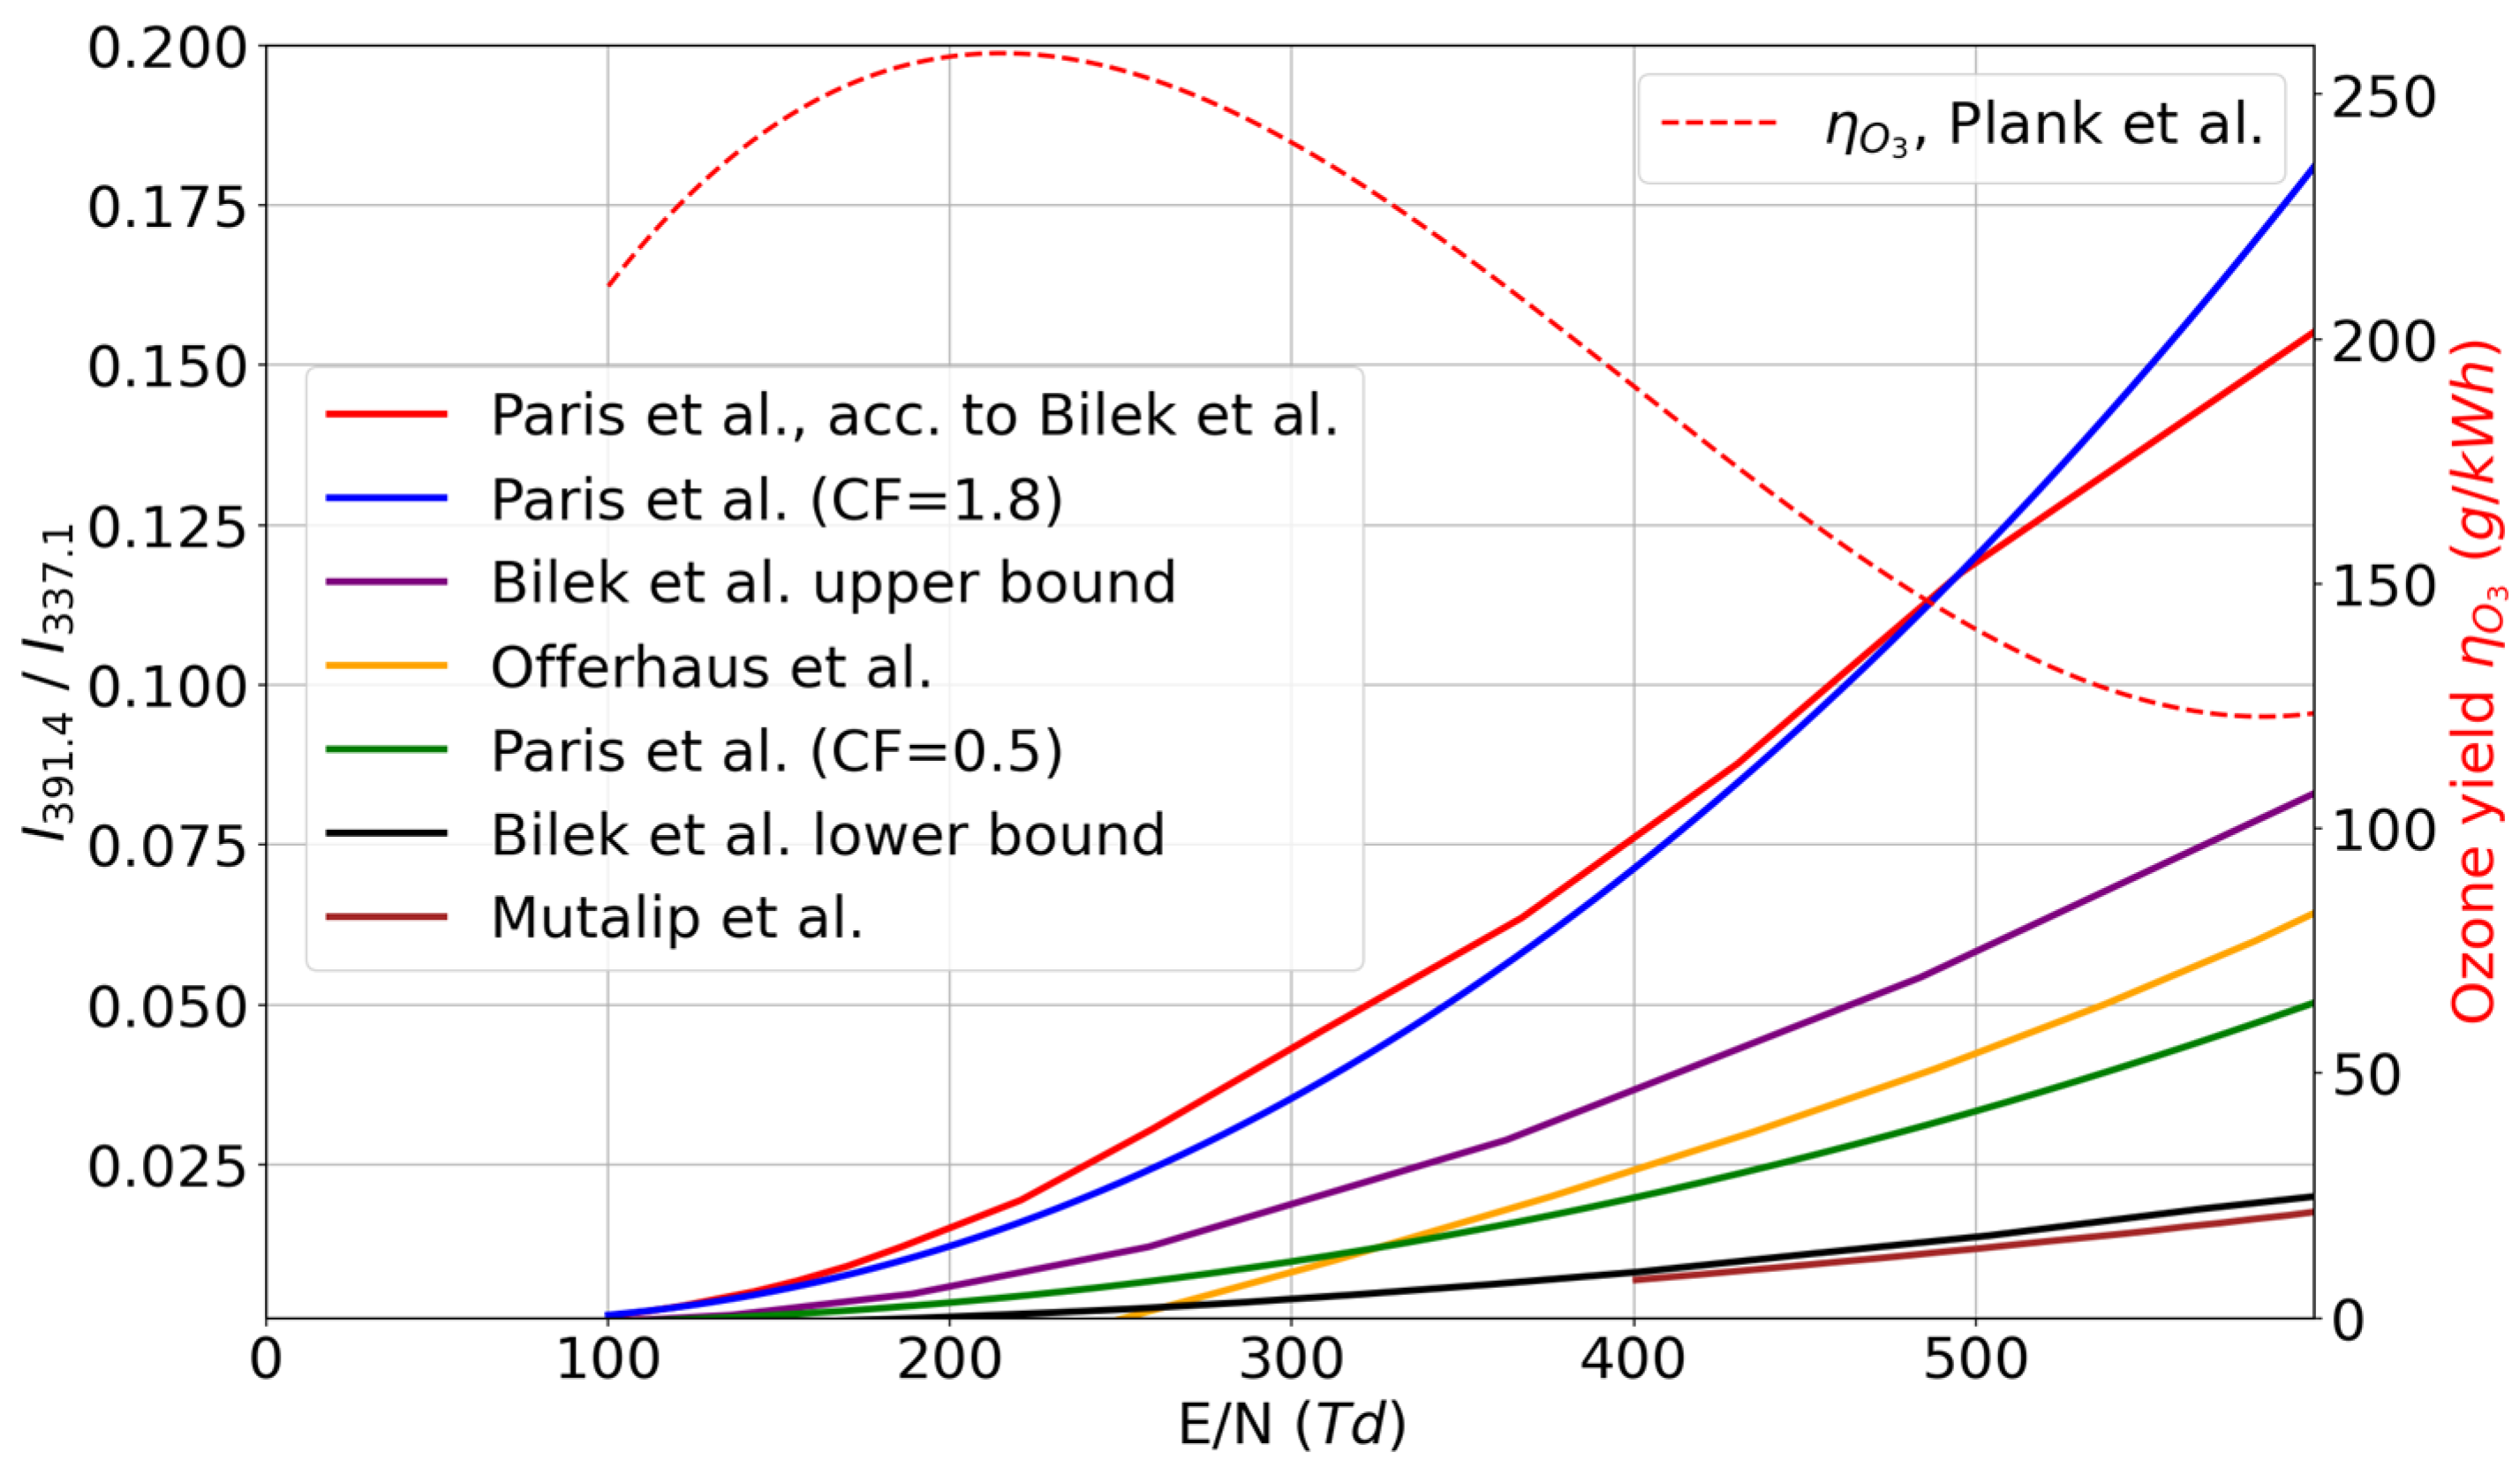
Ozone production in air relates closely to the electric field in the air gap [181]. The parameter commonly used is the reduced electric field E/N (in Townsend units, Td), where E equals Eg and N is the number density of neutral particles (N = 2.46 × 1025 in air). E/N can be estimated using optical emission spectroscopy (OES, shown in Figure 11) [182,183,184,185], the EFISH [73], SHG [68] or Pockels technique [186]. But, this is not simple, as E/N varies both in time (by AC or pulsed powering, and by streamer propagation) and in space (especially in the case of asymmetric and/or sharp electrodes). OES therefore uses time- and space integration. With a correction factor (CF), the streamer head field (Es) and the average field (Ee) can be estimated (with Es = 1.4 × Ee in atmospheric air) [187]. Surface charging may alter E/N markedly in a DBD (see Section 2.2). Even though E/N is not precisely known, it is well established that for optimal ozone production V(t) must be moderate, only slightly above Vbr (displayed in Figure 12) [26,181]. Buntat et al. showed that ozone production in a volume DBD clearly increased by increasing the air flow rate (0.2–1 L/min) [33]. But, at each rate they found the highest ozone yield at the same voltage, underscoring the importance of Eg in ozone production.
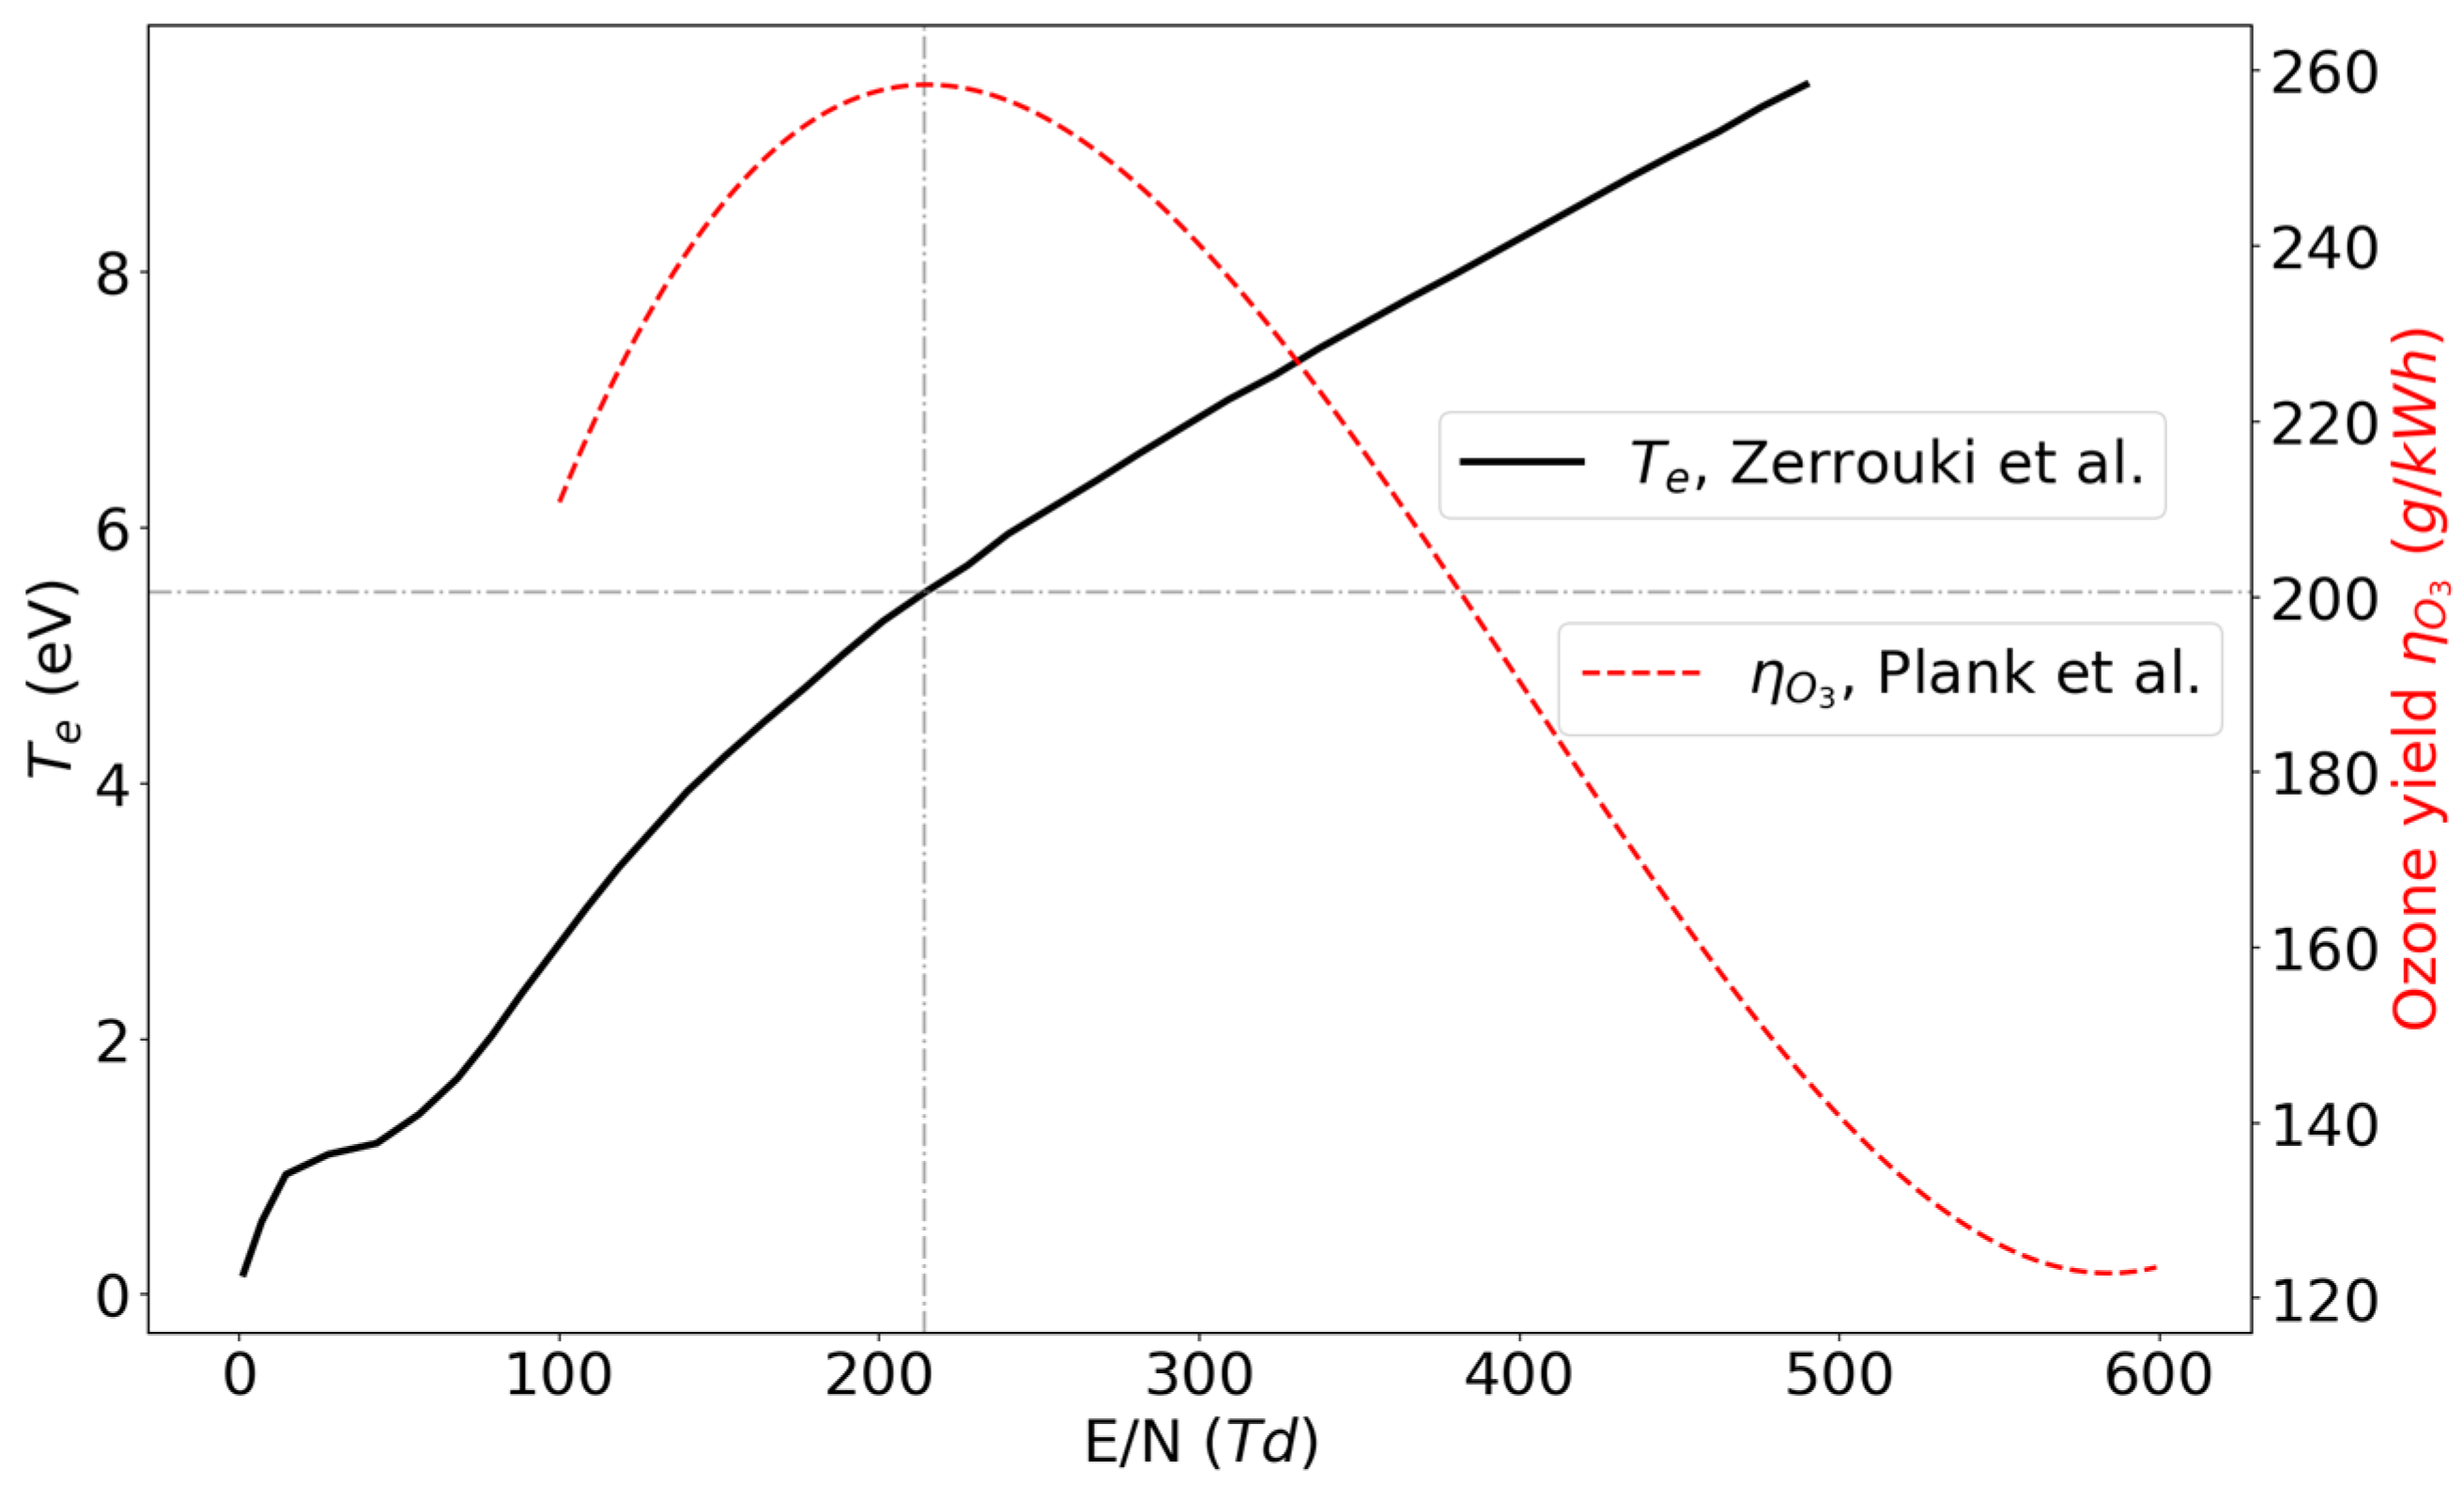
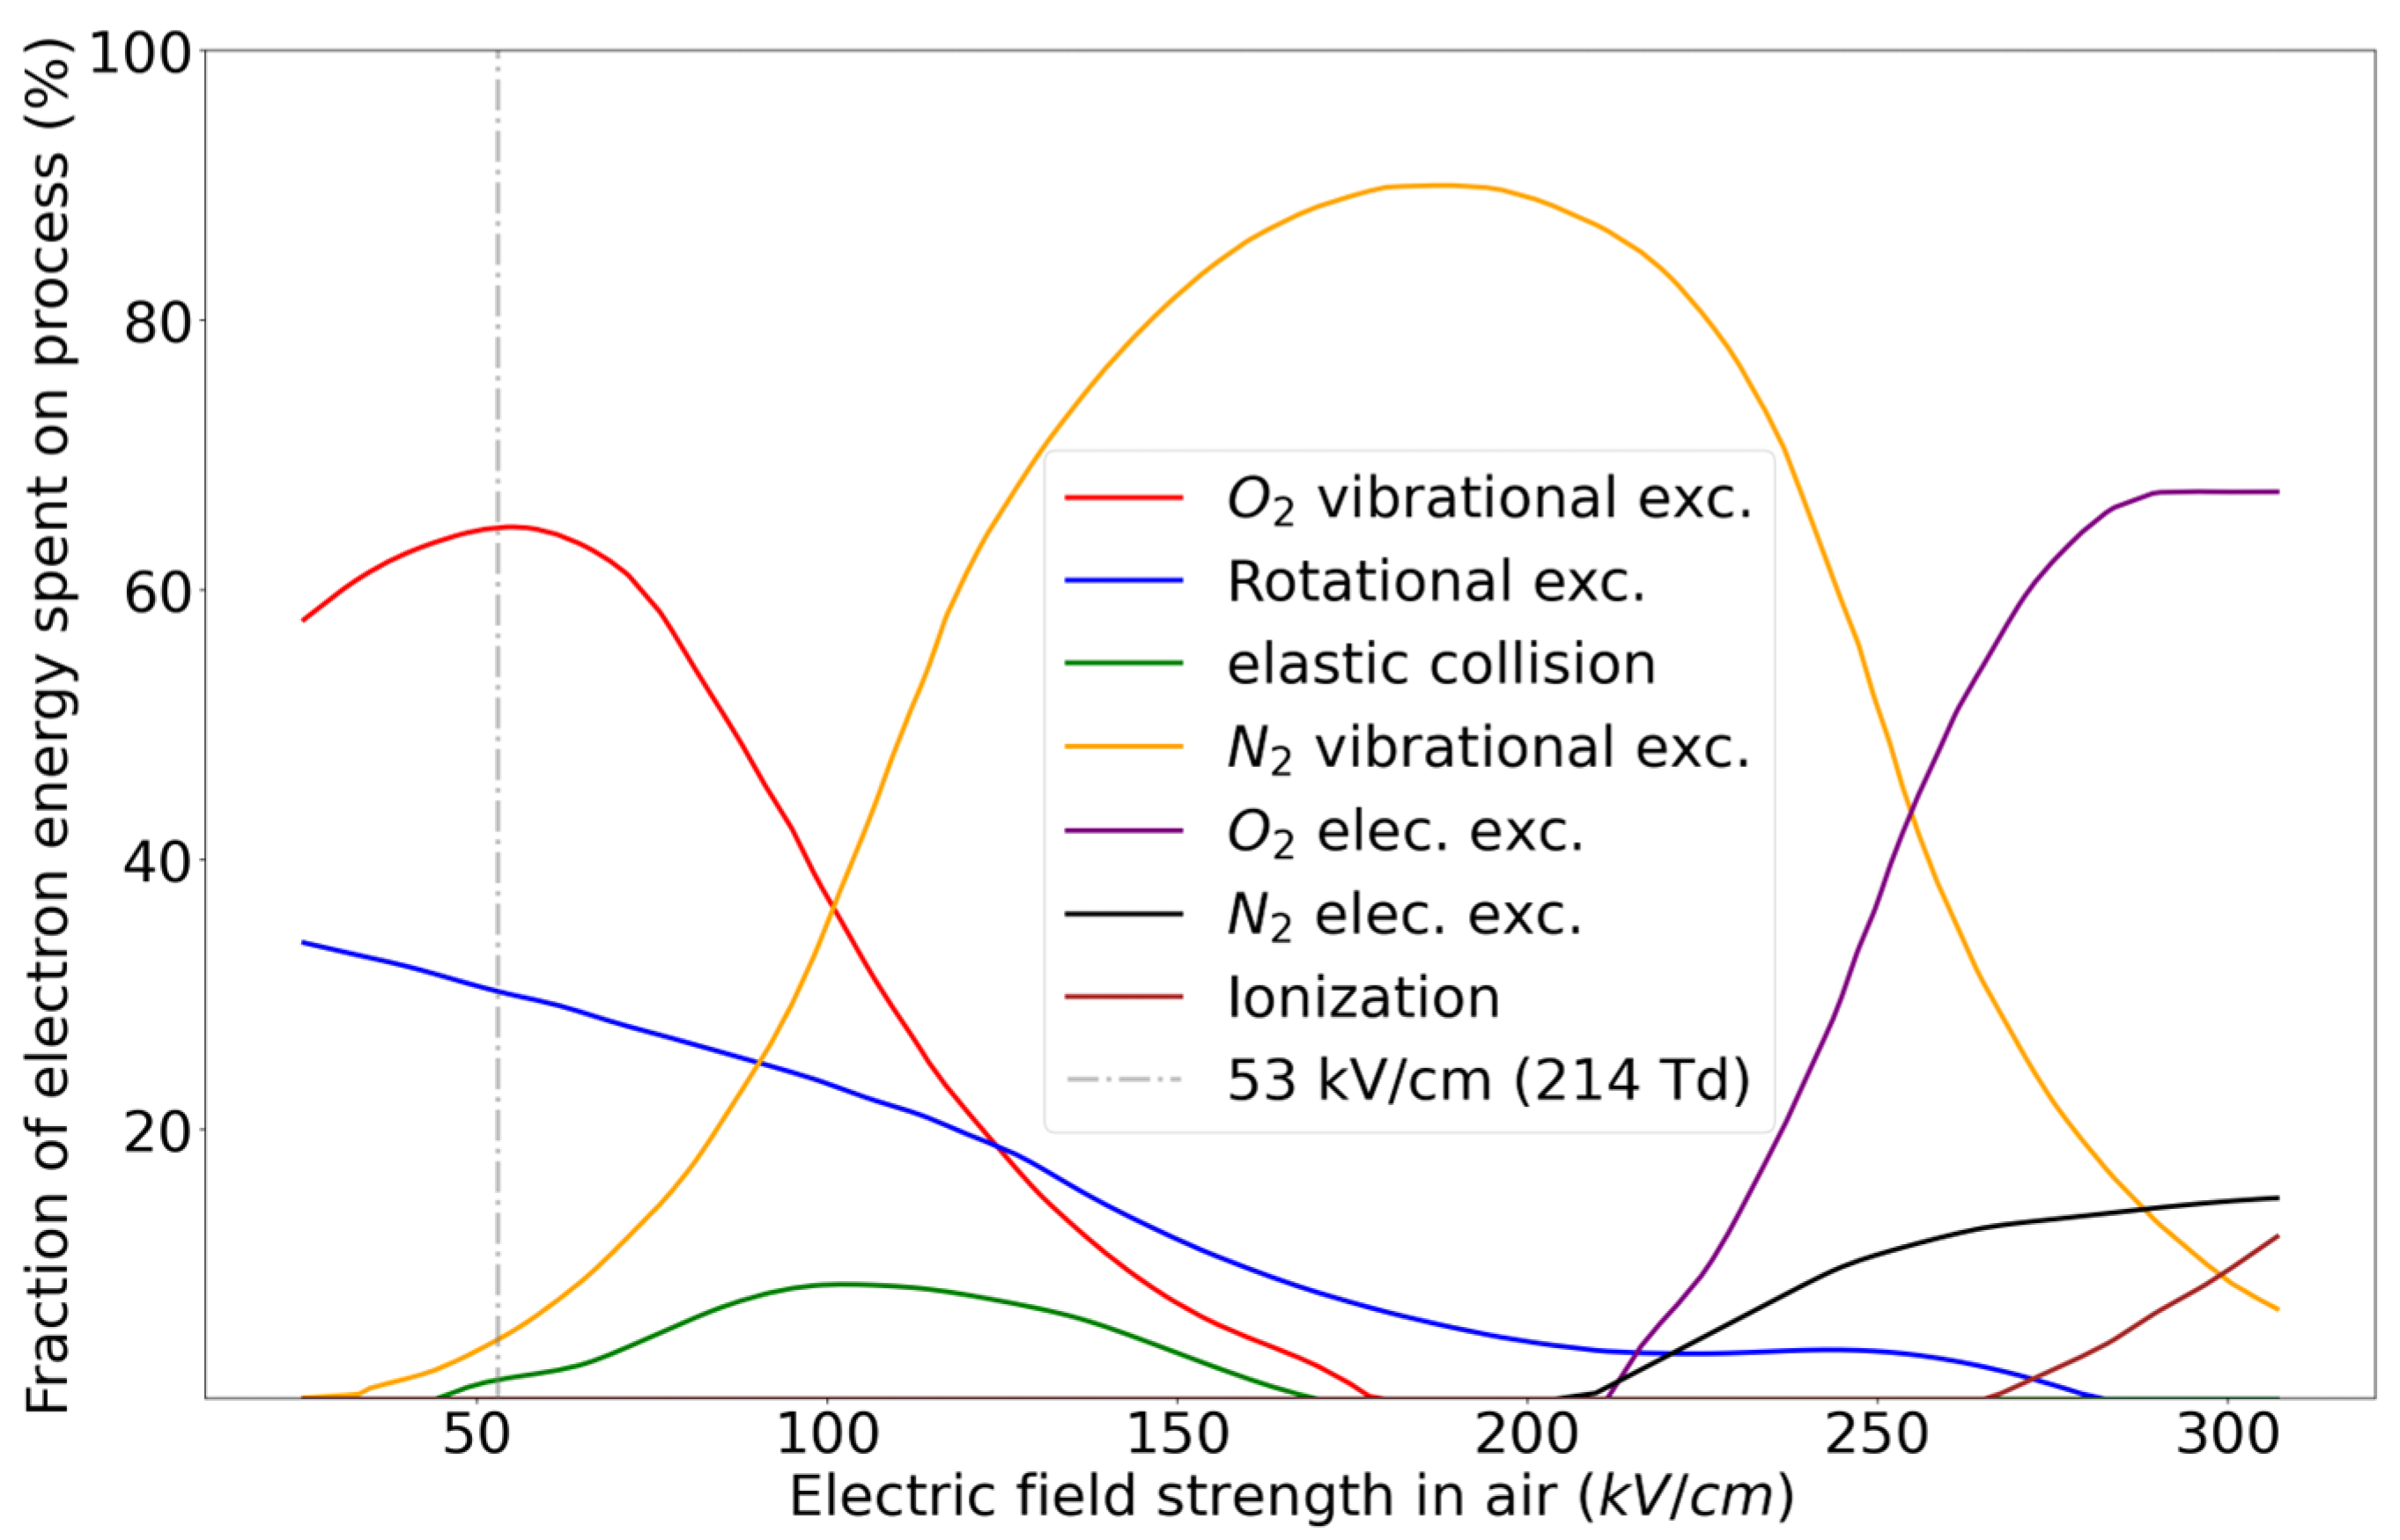
Figure 13 shows how the electron energy is separated among different processes in air [25]. Plank et al. and Haacke et al. found maximum ozone production at E/N = 214 Td, which equals ~53 kV/cm in ambient air [181,190]. At this point the largest fraction of electron energy goes into O2 vibrational excitation, which drives O2 dissociation, forming atomic oxygen. Atomic oxygen next forms ozone (shown in Figure 9 and [26,181,187]. The optimal electron energy for ozone production is ~5.5 eV [26,141,191], while the threshold for O2 vibrational excitation is 4.63 eV [192], easily reachable with pulsed DBDs.
Ozone diffusion cannot be neglected. When ozone is formed, it should travel from the plasma region to mix with the surrounding air. After a microdischarge, ozone appears in 8–10 µs via the ‘third body reaction’ O + O2 + M → O3 + M (various molecules can act as M, as displayed in Figure 9) [193]. The total reaction time to form ozone through all pathways may take up to 100 µs [26,29,136,194]. Therefore, pulse or AC frequencies of >10 kHz can interfere with ozone production by limiting the post-discharge period needed for proper ozone formation and diffusion. For example, Park et al. found that the ozone concentration more than doubled in their surface DBD by using positive nanopulses with a PRF of 1 kHz compared to 3 kHz [31]. They also hypothesized that a higher PRF promoted ozone quenching, which is probable as it increases the gas temperature due to a higher number of microdischarges over time. Diffusion of ozone out of the plasma region and subsequent mixing with the background gas could take up to 100 ms (depending on geometry [195]) [52,90,194,196]. The diffusion coefficient for ozone is about 0.1–0.2 cm2/s [165]. Pressure waves originating from microdischarges create an additional air flow, as observed by Schlieren imaging in [45,129,197].

2.8.2. Influence of Pulse Rise Time on Ozone Production

The density of atomic oxygen increases with pulse rise rate, accelerating streamer head propagation [62]. However, it is unclear whether this really produces more ozone, as not only reactions in the streamer head, but also those in the streamer channel, cathode fall, secondary streamer and post-discharge period contribute to ozone formation and decomposition [136]. Ono and Oda observed that, in a pulsed wire-plate DBD, the secondary streamer (which contained the highest ozone density) elongated at higher pulse voltages [29]. But, excessively long secondary streamers may cause gas heating, and potentially provoke ozone dissociation [198].
Sun et al. found that the ozone concentration increased when the pulse rise time increased from 125 to 225 ns in a bipolar pulsed surface DBD, possibly due to a lower electrode temperature [175]. They calculated that faster rise times increased the vibrational N2 excitations, raising NO production and decreasing O3. Iza et al. found that pulses with 40 ns rise times produced higher mean electron energies than those with a rise time of 20, 10 or 1 ns [37]. Jin et al. observed only a moderate ozone yield rise (from 25 to 35 g/kWh) when the rise time was lowered greatly from 250 to 50 ns in a pulsed multi-hollow DBD [34]. However, the specific input energy (SIE, regulated by the pulse voltage) had a much larger impact on ozone yield in their study. Zhang et al. found that the peak total current increased from 3.3 to 18.2 A when the pulse rise time was shortened from 500 to 50 ns [24]. However, even higher peak currents were obtained by simply increasing the pulse voltage from 12 to 16 kV (ozone was not measured). Rao et al. confirmed this finding by showing that higher light emission occurred when the pulse rise time decreased from 1239 to 132 ns in a volume DBD [132]. Thus, the conduction current, responsible for plasma formation, can be increased effectively by lowering the pulse rise time, but also by increasing the pulse voltage. Komuro et al. concluded that the average applied electric field during streamer propagation is more important than the rise time for oxygen radical production [62,198]. The conduction current depends on E/N as well [135]:
I c o n d ~ n e × µ e × ( E / N ) ~ ( E / N ) 0.88
where µe is the electron mobility.

2.8.3. Ozone Yield

Ozone yield (in g/kWh) is often calculated as [34,116,173]:
η O 3 = 60 × C × Q s P
where C is the ozone concentration (in g/Nm3) and Qs the gas flow rate (in standard litre per minute). P is the discharge power, calculated by integrating the voltage-current product over a single pulse, multiplied with the PRF. In AC reactors, it is the area of the Lissajous figure [34,116]. Ozone yields of ~200 g/kWh in air are considered high [4,60,116]. Cimerman et al. reported that a shift from ozone mode to NOx mode occurred when the specific input energy (SIE = 60 × P/Qs) was 1000–1100 J/L in dry air and 600–450 J/L when the relative humidity increased from 20 to 80%, using AC power [117]. Absorption spectra showed that NO2 and N2O are the most prominent species in NOx mode. Jin et al. used a similar DBD with nanopulsed power [34]. They found that ozone concentration increased with SIE up until 300 J/L (with minimal NO2 and N2O concentrations). At higher SIE, NO2 and N2O started to rise up to 3 and 35 ppm, respectively, at the expense of ozone [34].
Several factors complicate the use of Equation (5). First, the impact of ambient temperature and humidity on ozone production is not included [20,117,170]. Some authors tried active cooling or air drying to increase ozone production [20,199]. The extra power needed for cooling and drying is not added to P. Second, air flow patterns are complex and affect ozone formation and dissociation. Ozone yield differs for laminar and turbulent flow, it is also affected by the flow direction and interaction with the electrodes and reactor walls [32,36,135,142,170,179]. For example, an air flow of 60 m/s over the electrode improved discharge homogeneity in a pulsed surface DBD [135]. Xie et al. reported a ~30% increase in ηO3 when the air flow direction changed from lateral to transversal towards the electrodes [179].
The calculation of P is prone to errors [116]. A time delay between voltage probe and current coil changes the outcome of the voltage-current integral. The current measurement may be distorted by EM interference coming from the cables powering a nanopulsed DBD (called ‘loop inductance’ in [200]). To minimize this effect, the cable loops must be kept short. Voltage probes and current coils should be calibrated by measuring the V-I relationship of a resistor driven by a waveform generator. The voltage and current values then obey Ohm’s law. Time delays between probe and coil are also made visible by this method. Lastly, reflections of the voltage pulse may cause additional distortions (see Section 2.9). An detailed error analysis is given in [116].
In general, ozone yield will maximize when microdischarge temperature is low, as formation is then promoted, and dissociation lowered. It can be achieved by various strategies: applying moderately high voltages (slightly above Vbr), moderate PRFs (100–1000 Hz) and short pulses (in the range of several hundreds of ns with a fast rise time). Additional air flow can increase ozone yields, but this depends on air flow velocity and direction. As such, it can heavily complicate yield calculations. A low ambient humidity promotes ozone yield. DBD heating, which promotes ozone decomposition, could also be partially mitigated by choosing thin dielectric barriers.

2.9. DBD—Pulse Source Interaction

Interactions between the DBD and the pulse source occur virtually in all systems, yet are seldom discussed in detail. Some important effects are summarized below.
A voltage pulse, fed to a plasma reactor, can be (partially) reflected back into the pulse source. Such reflections disturb the pulse shape [201], reduce power efficiency and may damage the pulse source [124,129,191,202]. One way to prevent this is by matching the pulse source and plasma device impedances [158,203,204,205]. This approach is used in an impedance matched Marx generator (IMG) and is equally necessary for single-line and Blumlein-line pulse sources [85,133,191,206]. These pulse sources operate efficiently only when connected to a predetermined load impedance (and thus DBD size). Reducing the barrier thickness from 1 to 0.5 mm decreased the fraction of reflected energy from 72 to 51%, by lowering the DBD impedance [129]. It should be noted that plasma formation temporarily increases the capacitive load, complicating matching [50,204,207]. A high pulse source impedance further increases the characteristic time for potential variation of the HV electrode [72]. This decreases the (conduction) current and thus plasma formation.
Ccell and the resistance of the electrode both increase the pulse rise time in push-pull nanopulse switches [208,209,210]. Barrier surface roughness can also distort the applied waveform [39]. Ccell limits the operational range of the switching device, as its maximum operational power is the product of DC input voltage, PRF and capacitive load [209,211]. The pulse source output voltage is influenced by the effective impedance of the load, which may change due to electrode erosion, barrier degradation and surface charging. Likewise, some pulse sources, particularly spark-gap switches, erode during long-term operation. This may affect the pulse source output voltage characteristics [85,206].

3. Summary & Outlook

This review investigates the key parameters for the design and operation of a pulsed DBD for low-temperature plasma production in ambient air. In general, low-temperature plasma production using a pulsed DBD benefits from a thin dielectric barrier, with moderate to high relative permittivity, a small gap distance (in the order of tens-hundreds of µm) and the use of sharp, long electrodes. Regarding electrode material, gold appears to perform very well, as it is oxidation resistant. Barrier materials such as ceramics, glass and quartz are clearly superior to polymers, as polymers show signs of (semi)permanent charging and plasma damage (heat, etching, oxidation). For optimal performance of a pulse source, the DBD capacitance (Ccell) should ideally be as low as possible (or match the source impedance for some pulse sources). This allows for high voltage pulses with short rise times and low reflections. Short pulses (in the range of several hundreds of ns or shorter) limit electrode and barrier degradation.
The operation of a pulsed DBD in air is largely dependent on ambient factors such as temperature, humidity, air flow direction and speed. One also has to consider if the DBD should operate in ozone mode or NOx mode. Heat production varies largely per DBD geometry (i.e., electrode shape) and powering (waveform, repetition frequency). Therefore, optimal settings varied among different studies.
The electrification of the power grid provides opportunities for upscaling of pulsed DBD systems. This is supported by the fact that high voltage components (such as MOSFET switches) are becoming less costly at increasing voltage ratings. The market demand for such systems is expected to increase, based on regulatory pressure (for example the outlawing of pesticides) and the trend towards lowering energy costs.

Author Contributions

Conceptualization, L.F.A.W.; investigation, L.F.A.W.; resources, L.F.A.W.; data curation, L.F.A.W.; writing—original draft preparation, L.F.A.W.; writing—review and editing, L.F.A.W., J.v.T., W.D.v.D., M.G.N., H.v.Z. and G.Z.; visualization, L.F.A.W. All authors have read and agreed to the published version of the manuscript.

Funding

This research is funded by the Delft University of Technology, the Netherlands, under the PowerizeD project (EU 101096387).

Data Availability Statement

No new data was created for the writing of this review.

Conflicts of Interest

The authors declare no conflicts of interest. The funders had no role in the design of the study; in the collection, analyses, or interpretation of data; in the writing of the manuscript; or in the decision to publish the results.

Abbreviations

The following abbreviations are used in this manuscript:
LTPLow-temperature atmospheric plasma
RONSReactive oxygen and nitrogen species
ε0Vacuum permittivity
εrRelative permittivity
weElectrode width
dgGap distance
ddDielectric barrier thickness
leElectrode length
CcellDBD capacitance
CdDielectric barrier capacitance
CgAir gap capacitance
UgVoltage over the air gap
UdVoltage over the dielectric barrier
RgVariable resistance of the air gap
triseRise time of voltage pulse
tfallFall time of voltage pulse
trise,sourceRise time of the pulse source without load
EgElectric field strength in the air gap
EdElectric field strength in the dielectric barrier
dE/dtChange of electric field strength over time
NNumber density of neutral particles
E/NReduced electric field
TgasGas temperature
TvibVibrational temperature
TrotRotational temperature
TeElectron energy (electron temperature)
neElectron density
µeElectron mobility
VApplied (peak) voltage
V-IVoltage-current
VbrBreakdown (ignition) voltage
IcondConduction current
IdispDisplacement current
QCharge per pulse
EpEnergy per pulse
PDischarge power
PRFPulse repetition frequency
COzone concentration
ηO3Ozone yield
SIESpecific input energy
QsStandardized air flow
AC Alternating current
tan (δ)Tangential loss factor
dlfDielectric loss factor
PMTPhotomultiplier tube
OESOptical emission spectroscopy
EFISHElectric field-induced second harmonic
SHGSecond harmonics
IMGImpedance-matched Marx generator
τrIon recombination time
τdSpace charge diffusion time on dielectric surface
τsSurface charge relaxation time
ρvMaterial volume resistivity
AnodeElectrode with positive voltage applied
CathodeGrounded electrode
PFASPer- and polyfluoroalkyl substances
PTFEPolytetrafluorethyleen (Teflon)
PIPolyimide (Kapton)
PPPolypropylene
PMMAPolymethylmethacrylate (Plexiglas)
PVCPolyvinylchloride
PEEKPolyether ether ketone

References

  1. Kim, H.H.; Abdelaziz, A.A.; Teramoto, Y.; Nozaki, T.; Kim, D.Y.; Brandenburg, R.; Schiorlin, M.; Hensel, K.; Song, Y.H.; Lee, D.H.; et al. Revisiting Why DBDs Can Generate O3 against the Thermodynamic Limit. Int. J. Plasma Environ. Sci. Technol. 2023, 17, e02004. [Google Scholar]
  2. Zhang, L.; Guo, Y.; Tie, J.; Yao, Z.; Feng, Z.; Wu, Q.; Wang, X.; Luo, H. Grating-like DBD Plasma for Air Disinfection: Dose and Dose-Response Characteristics. J. Hazard. Mater. 2023, 447, 130780. [Google Scholar] [CrossRef]
  3. Klämpfl, T.G.; Isbary, G.; Shimizu, T.; Li, Y.F.; Zimmermann, J.L.; Stolz, W.; Schlegel, J.; Morfill, G.E.; Schmidt, H.U. Cold Atmospheric Air Plasma Sterilization against Spores and Other Microorganisms of Clinical Interest. Appl. Environ. Microbiol. 2012, 78, 5077–5082. [Google Scholar] [CrossRef] [PubMed]
  4. Van Heesch, E.J.M.; Huiskamp, T.; Yan, K.; Beckers, F.J.C.M.; Smulders, H.W.M.; Winands, G.J.J.; Lemmens, R.H.P.; Blom, P.P.M.; Segura, S.D.; Hoeben, W.F.L.M.; et al. Pulsed Processing by Cold Plasma, Applied to Industrial Emission Control. Front. Chem. 2024, 12, 1386055. [Google Scholar] [CrossRef]
  5. Jiang, N.; Guo, L.; Qiu, C.; Zhang, Y.; Shang, K.; Lu, N.; Li, J.; Wu, Y. Reactive Species Distribution Characteristics and Toluene Destruction in the Three-Electrode DBD Reactor Energized by Different Pulsed Modes. Chem. Eng. J. 2018, 350, 12–19. [Google Scholar] [CrossRef]
  6. Hayakawa, Y.; Emeraldi, P.; Imai, T.; Kambara, S. CO2 Conversion Characteristics by Micro-Gap DBD Plasma Reactor. Int. J. Plasma Environ. Sci. Technol. 2023, 17, 1007–1019. [Google Scholar] [CrossRef]
  7. Zahoranová, A.; Hoppanová, L.; Šimončicová, J.; Tučeková, Z.; Medvecká, V.; Hudecová, D.; Kaliňáková, B.; Kováčik, D.; Černák, M. Effect of Cold Atmospheric Pressure Plasma on Maize Seeds: Enhancement of Seedlings Growth and Surface Microorganisms Inactivation. Plasma Chem. Plasma Process. 2018, 38, 969–988. [Google Scholar] [CrossRef]
  8. Jo, Y.K.; Cho, J.; Tsai, T.C.; Staack, D.; Kang, M.H.; Roh, J.H.; Shin, D.B.; Cromwell, W.; Gross, D. A Non-Thermal Plasma Seed Treatment Method for Management of a Seedborne Fungal Pathogen on Rice Seed. Crop Sci. 2014, 54, 796–803. [Google Scholar] [CrossRef]
  9. Yemeli, G.B.N.; Janda, M.; Machala, Z. Non-Thermal Plasma as a Priming Tool to Improve the Yield of Pea in Outdoor Conditions. Plasma Chem. Plasma Process. 2022, 42, 1143–1168. [Google Scholar] [CrossRef]
  10. Walsh, J.L.; Kong, M.G. 10 Ns Pulsed Atmospheric Air Plasma for Uniform Treatment of Polymeric Surfaces. Appl. Phys. Lett. 2007, 91, 251504. [Google Scholar] [CrossRef]
  11. Aggelopoulos, C.A. Recent Advances of Cold Plasma Technology for Water and Soil Remediation: A Critical Review. Chem. Eng. J. 2022, 428, 131657. [Google Scholar] [CrossRef]
  12. Klymenko, R.; de Kroon, E.; Agostinho, L.L.F.; Fuchs, E.C.; Woisetschläger, J.; Hoeben, W.F.L.M. Characterization of a Hyperbolic Vortex Plasma Reactor for the Removal of Aqueous Phase Micropollutants. J. Phys. D Appl. Phys. 2024, 57, 215204. [Google Scholar] [CrossRef]
  13. Bilea, F.; Tian, T.; Magureanu, M.; Rabat, H.; Antoissi, M.A.; Aubry, O.; Hong, D. Removal of a Mixture of Antibiotics in Water Using Nonthermal Plasma. Plasma Process. Polym. 2023, 20, e2300020. [Google Scholar] [CrossRef]
  14. Li, Y.; Wen, J.Y.; Jiang, Q.Y.; Zhao, L.Y.; Zhang, G.J. Influences of Discharge Modes and Gas Bubbling Conditions on E. Coli Sterilization by Pulsed Underwater Discharge Treatments. AIP Adv. 2020, 10, 025207. [Google Scholar] [CrossRef]
  15. Brandenburg, R.; Becker, K.H.; Weltmann, K.D. Barrier Discharges in Science and Technology Since 2003: A Tribute and Update. Plasma Chem. Plasma Process. 2023, 43, 1303–1334. [Google Scholar] [CrossRef]
  16. Brandenburg, R. Dielectric Barrier Discharges: Progress on Plasma Sources and on the Understanding of Regimes and Single Filaments. Plasma Sources Sci. Technol. 2017, 26, 053001. [Google Scholar] [CrossRef]
  17. Korzec, D.; Hoppenthaler, F.; Shestakov, A.; Burger, D.; Shapiro, A.; Andres, T.; Lerach, S.; Nettesheim, S. Multi-Device Piezoelectric Direct Discharge for Large Area Plasma Treatment. Plasma 2021, 4, 281–293. [Google Scholar] [CrossRef]
  18. Williamson, J.M.; Trump, D.D.; Bletzinger, P.; Ganguly, B.N. Comparison of High-Voltage Ac and Pulsed Operation of a Surface Dielectric Barrier Discharge. J. Phys. D Appl. Phys. 2006, 39, 4400–4406. [Google Scholar] [CrossRef]
  19. Scaltriti, S.G.; Cristofolini, A.; Neretti, G. Design and Characterization of an Atmospheric Pressure Dielectric Barrier Discharge Reactor for Potential Air Disinfection Applications. IEEE Access 2025, 13, 45037–45047. [Google Scholar] [CrossRef]
  20. Korzec, D.; Freund, F.; Bäuml, C.; Penzkofer, P.; Nettesheim, S. Hybrid Dielectric Barrier Discharge Reactor: Characterization for Ozone Production. Plasma 2024, 7, 585–615. [Google Scholar] [CrossRef]
  21. Meropoulis, S.; Aggelopoulos, C.A. Plasma Microbubbles vs. Gas-Liquid DBD Energized by Low-Frequency High Voltage Nanopulses for Pollutants Degradation in Water: Destruction Mechanisms, Composition of Plasma-Activated Water and Energy Assessment. J. Environ. Chem. Eng. 2023, 11, 109855. [Google Scholar] [CrossRef]
  22. Fan, T.; Chen, Y.; Zhang, N.; Wang, Y.; Wang, X.; Chang, D.; Yang, K. Nanosecond Pulsed Atmospheric-Pressure Plasma Enhanced the Germination of Melon (Cucumis melo L.) Seeds. Plasma Chem. Plasma Process. 2023, 43, 1149–1167. [Google Scholar] [CrossRef]
  23. Sun, J.; Zhou, R.; Hong, J.; Gao, Y.; Qu, Z.; Liu, Z.; Liu, D.; Zhang, T.; Zhou, R.; Ostrikov, K.; et al. Sustainable Ammonia Production via Nanosecond-Pulsed Plasma Oxidation and Electrocatalytic Reduction. Appl. Catal. B 2024, 342, 123426. [Google Scholar] [CrossRef]
  24. Zhang, L.; Wang, K.; Wu, K.; Guo, Y.; Liu, Z.; Yang, D.; Zhang, W.; Luo, H.; Fu, Y. Air Disinfection by Nanosecond Pulsed DBD Plasma. J. Hazard. Mater. 2024, 472, 134487. [Google Scholar] [CrossRef]
  25. Fridman, A. Elementary Plasma-Chemical Reactions. In Plasma Chemistry; Cambridge University Press: Cambridge, UK, 2008; pp. 12–91. ISBN 9780521847353. [Google Scholar]
  26. Fridman, A. Gas-Phase Inorganic Synthesis in Plasma. In Plasma Chemistry; Cambridge University Press: Cambridge, UK, 2008; pp. 355–416. ISBN 9780521847353. [Google Scholar]
  27. Jiang, H.; Shao, T. Surface Dielectric Barrier Discharge Driven by Nanosecond Pulses. In Pulsed Discharge Plasmas; Shao, T., Zhang, C., Eds.; Springer Nature: Singapore, 2023; pp. 635–672. ISBN 978-981-99-1140-0. [Google Scholar]
  28. Machala, Z.; Pai, D.Z.; Janda, M.; Laux, C.O. Atmospheric Pressure Nanosecond Pulsed Discharge Plasmas. In Low Temperature Plasma Technology: Methods and Applications; Chu, P.K., Lu, X., Eds.; CRC Press: Boca Raton, FL, USA, 2013; pp. 119–172. ISBN 9781466509917. [Google Scholar]
  29. Ono, R.; Oda, T. Ozone Production Process in Pulsed Positive Dielectric Barrier Discharge. J. Phys. D Appl. Phys. 2007, 40, 176–182. [Google Scholar] [CrossRef]
  30. Tański, M.; Reza, A.; Przytuła, D.; Garasz, K. Ozone Generation by Surface Dielectric Barrier Discharge. Appl. Sci. 2023, 13, 7001. [Google Scholar] [CrossRef]
  31. Park, S.; Kim, J.; Lee, H.; Han, D.; Park, S.; Kim, S.B.; Choe, W. Nonheating Ozone Suppression in Pulsed Air Discharges: Role of Pulse Duration and Repetition Rate. J. Phys. D Appl. Phys. 2021, 54, 394003. [Google Scholar] [CrossRef]
  32. Murata, T.; Okita, Y.; Noguchi, M.; Takase, I. Basic Parameters of Coplanar Discharge Ozone Generator. Ozone Sci. Eng. 2004, 26, 429–442. [Google Scholar] [CrossRef]
  33. Buntat, Z.; Smith, I.R.; Razali, N.A.M. Ozone Generation Using Atmospheric Pressure Glow Discharge in Air. J. Phys. D Appl. Phys. 2009, 42, 235202. [Google Scholar] [CrossRef]
  34. Jin, C.; Lin, F.; Peng, B.; Wei, L.; Ling, Z.; Zeng, X.; Yuan, D. Nanosecond Pulsed Multi-Hollow Surface Dielectric Barrier Discharge for Ozone Production. Vacuum 2025, 238, 114252. [Google Scholar] [CrossRef]
  35. Pipa, A.V.; Hoder, T.; Koskulics, J.; Schmidt, M.; Brandenburg, R. Experimental Determination of Dielectric Barrier Discharge Capacitance. Rev. Sci. Instrum. 2012, 83, 075111. [Google Scholar] [CrossRef]
  36. Morabit, Y.; Hasan, M.I.; Whalley, R.D.; Robert, E.; Modic, M.; Walsh, J.L. A Review of the Gas and Liquid Phase Interactions in Low-Temperature Plasma Jets Used for Biomedical Applications. Eur. Phys. J. D 2021, 75, 32. [Google Scholar] [CrossRef]
  37. Iza, F.; Walsh, J.L.; Kong, M.G. From Submicrosecond- to Nanosecond-Pulsed Atmospheric-Pressure Plasmas. IEEE Trans. Plasma Sci. 2009, 37, 1289–1296. [Google Scholar] [CrossRef]
  38. Massines, F.; Gherardi, N.; Naudé, N.; Ségur, P. Recent Advances in the Understanding of Homogeneous Dielectric Barrier Discharges. EPJ Appl. Phys. 2009, 47, 22805. [Google Scholar] [CrossRef]
  39. Zhang, Y.; Wang, H. The Effect of Discharge Uniformity on the Tailing Phenomenon of Spore Inactivation by Cold Atmospheric Plasma. AIP Adv. 2025, 15, 105108. [Google Scholar] [CrossRef]
  40. Qi, F.; Li, Y.; Zhou, R.; Zhou, R.; Wan, J.; Xian, Y.; Cullen, P.J.; Lu, X.; Ostrikov, K. Uniform Atmospheric Pressure Plasmas in a 7 Mm Air Gap. Appl. Phys. Lett. 2019, 115, 194101. [Google Scholar] [CrossRef]
  41. Ran, J.; Li, C.; Ma, D.; Luo, H.; Li, X. Homogeneous Dielectric Barrier Discharges in Atmospheric Air and Its Influencing Factor. Phys. Plasmas 2018, 25, 033511. [Google Scholar] [CrossRef]
  42. Li, J.; Li, X.; Dong, P.; Xie, Y.; Long, J.; Zhang, L. Research on Homogeneous Multilayer DBD Driven by Submicrosecond Pulsed Power at Atmospheric Pressure Air. IEEE Trans. Plasma Sci. 2018, 46, 2–7. [Google Scholar] [CrossRef]
  43. Tardiveau, P.; Moreau, N.; Bentaleb, S.; Postel, C.; Pasquiers, S. Diffuse Mode and Diffuse-to-Filamentary Transition in a High Pressure Nanosecond Scale Corona Discharge under High Voltage. J. Phys. D Appl. Phys. 2009, 42, 175202. [Google Scholar] [CrossRef]
  44. Ren, C.; Huang, B.; Qiu, J.; Zhang, C.; Qi, B.; Chen, W.; Shao, T. Is an Extended Barrier-Free Discharge under Nanosecond-Pulse Excitation Really Diffuse? J. Phys. D Appl. Phys. 2022, 55, 235204. [Google Scholar] [CrossRef]
  45. Moreau, E.; Bayoda, K.; Benard, N. Streamer Propagation and Pressure Waves Produced by a Nanosecond Pulsed Surface Sliding Discharge: Effect of the High-Voltage Electrode Shape. J. Phys. D Appl. Phys. 2021, 54, 075207. [Google Scholar] [CrossRef]
  46. Bruggeman, P.; Brandenburg, R. Atmospheric Pressure Discharge Filaments and Microplasmas: Physics, Chemistry and Diagnostics. J. Phys. D Appl. Phys. 2013, 46, 464001. [Google Scholar] [CrossRef]
  47. Ren, C.; Huang, B.; Zhang, C.; Qi, B.; Chen, W.; Shao, T. Impact of Surface Charges on Energy Deposition in Surface Dielectric Barrier Discharge: A Modeling Investigation. Plasma Sources Sci. Technol. 2023, 32, 025004. [Google Scholar] [CrossRef]
  48. Zhang, Q.Z.; Nguyen-Smith, R.T.; Beckfeld, F.; Liu, Y.; Mussenbrock, T.; Awakowicz, P.; Schulze, J. Computational Study of Simultaneous Positive and Negative Streamer Propagation in a Twin Surface Dielectric Barrier Discharge via 2D PIC Simulations. Plasma Sources Sci. Technol. 2021, 30, 075017. [Google Scholar] [CrossRef]
  49. Starikovskiy, A.Y.; Aleksandrov, N.L. How Pulse Polarity and Photoionization Control Streamer Discharge Development in Long Air Gaps. Plasma Sources Sci. Technol. 2020, 29, 075004. [Google Scholar] [CrossRef]
  50. Huiskamp, T. Nanosecond Pulsed Streamer Discharges Part I: Generation, Source-Plasma Interaction and Energy-Efficiency Optimization. Plasma Sources Sci. Technol. 2020, 29, 023002. [Google Scholar] [CrossRef]
  51. Leonov, S.B.; Petrishchev, V.; Adamovich, I.V. Dynamics of Energy Coupling and Thermalization in Barrier Discharges over Dielectric and Weakly Conducting Surfaces on Us to Ms Time Scales. J. Phys. D Appl. Phys. 2014, 47, 465201. [Google Scholar] [CrossRef]
  52. Komuro, A. A Review of Streamer Discharge-Induced Plasma Chemistry at Atmospheric Pressure: Key Mechanisms and Future Perspectives. J. Electrostat. 2025, 137, 104087. [Google Scholar] [CrossRef]
  53. Kogelschatz, U.; Eliasson, B.; Egli, W. Dielectric Barrier Discharges. Principle and Applications. J. Phys. IV 1997, C4, 4–47. [Google Scholar] [CrossRef]
  54. Zhang, L.; Wu, K.; Zhao, Z.; Li, Y.; Liu, Z.; Wang, K.; Guo, Y.; Jiang, Y.; Fu, Y. Numerical Study on Positive Streamer in Parallel-Rod Dielectric Barrier Discharge in Atmospheric Air. Phys. Plasmas 2024, 31, 103905. [Google Scholar] [CrossRef]
  55. Zhao, Z.; Li, J. Repetitively Pulsed Gas Discharges: Memory Effect and Discharge Mode Transition. High Volt. 2020, 5, 569–582. [Google Scholar] [CrossRef]
  56. Komuro, A.; Ono, R.; Oda, T. Effects of Pulse Voltage Rise Rate on Velocity, Diameter and Radical Production of an Atmospheric-Pressure Streamer Discharge. Plasma Sources Sci. Technol. 2013, 22, 045002. [Google Scholar] [CrossRef]
  57. Komuro, A. Recent Advances in Surface Charge Dynamics in Dielectric Barrier Discharge: Future Strategies for Control and Technological Optimisation. J. Phys. D Appl. Phys. 2025, 58, 133003. [Google Scholar] [CrossRef]
  58. Sokolova, M.V.; Voevodin, V.V.; Malakhov, J.I.; Aleksandrov, N.L.; Anokhin, E.M.; Soloviev, V.R. Barrier Properties Influence on the Surface Dielectric Barrier Discharge Driven by Single Voltage Pulses of Different Duration. J. Phys. D Appl. Phys. 2019, 52, 324001. [Google Scholar] [CrossRef]
  59. Yoshida, K.; Komuro, A.; Ando, A. Effects of Relative Permittivity on Primary and Secondary Streamers in Atmospheric Pressure Dielectric Barrier Discharge. J. Phys. D Appl. Phys. 2021, 54, 315203. [Google Scholar] [CrossRef]
  60. Wang, D.; Namihira, T. Nanosecond Pulsed Streamer Discharges: II. Physics, Discharge Characterization and Plasma Processing. Plasma Sources Sci. Technol. 2020, 29, 023001. [Google Scholar] [CrossRef]
  61. Peng, B.; Jiang, N.; Liu, Z.; Yao, X.; Li, J.; Wu, Y. Discharge Dynamics of Primary and Secondary Streamers in a Repetitively Pulsed Surface Dielectric Barrier Discharge. J. Appl. Phys. 2022, 131, 113301. [Google Scholar] [CrossRef]
  62. Komuro, A.; Ryu, T.; Yoshino, A.; Namihira, T.; Wang, D.; Ono, R. Streamer Propagation in Atmospheric-Pressure Air: Effect of the Pulse Voltage Rise Rate from 0.1 to 100 KV Ns-1and Streamer Inception Voltage. J. Phys. D Appl. Phys. 2021, 54, 364004. [Google Scholar] [CrossRef]
  63. Pipa, A.V.; Brandenburg, R. The Equivalent Circuit Approach for the Electrical Diagnostics of Dielectric Barrier Discharges: The Classical Theory and Recent Developments. Atoms 2019, 7, 14. [Google Scholar] [CrossRef]
  64. Pipa, A.V.; Hoder, T.; Brandenburg, R. On the Role of Capacitance Determination Accuracy for the Electrical Characterization of Pulsed Driven Dielectric Barrier Discharges. Contrib. Plasma Phys. 2013, 53, 469–480. [Google Scholar] [CrossRef]
  65. Elchaninov, V.M.; Shemet, M.V.; Malashin, M.V. Dielectric Barrier Discharge Excited by Unipolar Pulse Voltage in Submillimetric Air Gaps. In Proceedings of the IEEE Conference of Russian Young Researchers in Electrical and Electronic Engineering (EIConRus); St. Petersburg Electrotechnical University “LETI” and National Research University of Electronic Technology “MIET”: Saint Petersburg, Russia, 2017; pp. 1135–1137. [Google Scholar]
  66. Zhang, C.; Wang, Y.; Zhou, Y.; Xie, Q.; Wang, R.; Yan, P.; Shao, T. Electrical Characteristics in Surface Dielectric Barrier Discharge Driven by Microsecond Pulses. IEEE Trans. Plasma Sci. 2016, 44, 2772–2778. [Google Scholar] [CrossRef]
  67. Liu, Y.; Yan, H.; Fan, Z.; Guo, H.; Ren, C. Influence of Residual Charge on Repetitively Nanosecond Pulsed Dielectric Barrier Discharges in Atmospheric Air. Phys. Plasmas 2017, 24, 113514. [Google Scholar] [CrossRef]
  68. Simeni Simeni, M.; Tang, Y.; Frederickson, K.; Adamovich, I.V. Electric Field Distribution in a Surface Plasma Flow Actuator Powered by Ns Discharge Pulse Trains. Plasma Sources Sci. Technol. 2018, 27, 104001. [Google Scholar] [CrossRef]
  69. Laroussi, M.; Stapelmann, K.; Longo, S.; Ranieri, P. The Resistive Barrier Discharge: A Brief Review of the Device and Its Biomedical Applications. Plasma 2021, 4, 75–80. [Google Scholar] [CrossRef]
  70. Starikovskiy, A.; Tkach, N.; Post, M.; Miles, R. Dielectric Barrier Discharge Control and Flow Acceleration Enhancement by Diode Surface. In Proceedings of the 52nd Aerospace Sciences Meeting; American Institute of Aeronautics and Astronautics Inc.: Reston, VA, USA, 2014. [Google Scholar]
  71. Lei, P.; Kun, H.; Qiaogen, Z. The Discharge Characteristics of Surface Dielectric Barrier Discharge Sustained by Repetitive Nanosecond Pulses in Open Air. J. Appl. Phys. 2016, 120, 103302. [Google Scholar] [CrossRef]
  72. Leonov, S.B.; Adamovich, I.V.; Soloviev, V.R. Dynamics of Near-Surface Electric Discharges and Mechanisms of Their Interaction with the Airflow. Plasma Sources Sci. Technol. 2016, 25, 063001. [Google Scholar] [CrossRef]
  73. Huang, B.; Zhang, C.; Adamovich, I.; Akishev, Y.; Shao, T. Surface Ionization Wave Propagation in the Nanosecond Pulsed Surface Dielectric Barrier Discharge: The Influence of Dielectric Material and Pulse Repetition Rate. Plasma Sources Sci. Technol. 2020, 29, 044001. [Google Scholar] [CrossRef]
  74. Zhang, B.; Zhang, G. Interpretation of the Surface Charge Decay Kinetics on Insulators with Different Neutralization Mechanisms. J. Appl. Phys. 2017, 121, 105105. [Google Scholar] [CrossRef]
  75. Opaits, D.F.; Shneider, M.N.; Miles, R.B.; Likhanskii, A.V.; MacHeret, S.O. Surface Charge in Dielectric Barrier Discharge Plasma Actuators. Phys. Plasmas 2008, 15, 073505. [Google Scholar] [CrossRef]
  76. Wegener, M.; Wirges, W.; Paajanen, M.; Gerhard, R. Charging Behavior and Thermal Stability of Porous and Non-Porous Polytetrafluoroethylene (PTFE) Electrets. In Proceedings of the 2007 Annual Report Conference on Electrical Insulation and Dielectric Phenomena, Vancouver, BC, Canada, 14–17 October 2007; pp. 449–452. [Google Scholar]
  77. Labiod, S.; Ziari, Z.; Benterrouche, L.; Sahli, S. Surface Potential Decay Evolution of Polypropylene Films Treated by Dielectric Barrier Discharge in Atmospheric Air. In Proceedings of the 2022 2nd International Conference on Advanced Electrical Engineering, ICAEE 2022; Institute of Electrical and Electronics Engineers Inc.: New York, NY, USA, 2022. [Google Scholar]
  78. Ambrico, P.F.; Ambrico, M.; Schiavulli, L.; Ligonzo, T.; Augelli, V. Charge Trapping Induced by Plasma in Alumina Electrode Surface Investigated by Thermoluminescence and Optically Stimulated Luminescence. Appl. Phys. Lett. 2009, 94, 051501. [Google Scholar] [CrossRef]
  79. Uhm, H.S.; Kang, J.G.; Choi, E.H.; Cho, G.S. Sterilization of Medical Equipment and Contaminated Articles by Making Use of a Resistive Barrier Discharge. J. Korean Phys. Soc. 2012, 61, 551–556. [Google Scholar] [CrossRef]
  80. Molinié, P. How Fast Does a Static Charge Decay? An Updated Review on a Classical Problem. J. Electrostat. 2024, 129, 103390. [Google Scholar] [CrossRef]
  81. Takashima, K.; Adamovich, I.V.; Xiong, Z.; Kushner, M.J.; Starikovskaia, S.; Czarnetzki, U.; Luggenhölscher, D. Analysis of Fast Ionization Wave Discharge Propagation in a Rectangular Geometry. In Proceedings of the 42nd AIAA Plasmadynamics and Lasers Conference, Honolulu, HI, USA, 27–30 June 2011. [Google Scholar]
  82. Dragonas, F.A.; Neretti, G.; Sanjeevikumar, P.; Grandi, G. High-Voltage High-Frequency Arbitrary Waveform Multilevel Generator for DBD Plasma Actuators. IEEE Trans. Ind. Appl. 2015, 51, 3334–3342. [Google Scholar] [CrossRef]
  83. Zhao, W.; Lagerweij, G.W.; Hurkmans, B.; Niasar, M.G. Design of a High-Voltage Arbitrary Waveform Generator Using a Modular Cascaded H-Bridge Topology. Electronics 2024, 13, 4390. [Google Scholar] [CrossRef]
  84. Redondo, L.M.; Canacsinh, H.; Lisbon, J.; Fernando, S. Generalized Solid-State Marx Modulator Topology. IEEE Trans. Dielectr. Electr. Insul. 2009, 16, 1037–1042. [Google Scholar] [CrossRef]
  85. Zhuge, Y.; Liang, J.; Fu, M.; Long, T.; Wang, H. Comprehensive Overview of Power Electronics Intensive Solutions for High-Voltage Pulse Generators. IEEE Open J. Power Electron. 2024, 5, 21–40. [Google Scholar] [CrossRef]
  86. Batagoda, J.H.; Hewage, S.D.A.; Meegoda, J.N. Nano-Ozone Bubbles for Drinking Water Treatment. J. Environ. Eng. Sci. 2018, 14, 57–66. [Google Scholar] [CrossRef]
  87. Ponce-Robles, L.; Pagán-Muñoz, A.; Lara-Guillén, A.J.; Masdemont-Hernández, B.; Munuera-Pérez, T.; Nortes-Tortosa, P.A.; Alarcón-Cabañero, J.J. Full-Scale O3/Micro-Nano Bubbles System Based Advanced Oxidation as Alternative Tertiary Treatment in WWTP Effluents. Catalysts 2023, 13, 188. [Google Scholar] [CrossRef]
  88. Hoskinson, A.R. Microplasmas. In Encyclopedia of Plasma Technology; Shohet, J.L., Ed.; CRC Press: Boca Raton, FL, USA, 2017; Volume 2, pp. 780–805. ISBN 9781498782814. [Google Scholar]
  89. Zhang, X.; Lee, B.J.; Im, H.G.; Cha, M.S. Ozone Production with Dielectric Barrier Discharge: Effects of Power Source and Humidity. IEEE Trans. Plasma Sci. 2016, 44, 2288–2296. [Google Scholar] [CrossRef]
  90. Ono, R.; Oda, T. Dynamics of Ozone and OH Radicals Generated by Pulsed Corona Discharge in Humid-Air Flow Reactor Measured by Laser Spectroscopy. J. Appl. Phys. 2003, 93, 5876–5882. [Google Scholar] [CrossRef]
  91. Wang, T.; Wang, J.; Wang, S.; Chen, S.; Wang, X.; Yang, W.; Li, M.; Shi, L. Atmospheric Micro-Sized Cold Plasma Jet Created by a Long and Ultra-Flexible Generator with Sputtered Gold Thin Film Electrode. J. Micromech. Microeng. 2022, 32, 095006. [Google Scholar] [CrossRef]
  92. Nguyen-Smith, R.T.; Böddecker, A.; Schücke, L.; Bibinov, N.; Korolov, I.; Zhang, Q.Z.; Mussenbrock, T.; Awakowicz, P.; Schulze, J. Us and Ns Twin Surface Dielectric Barrier Discharges Operated in Air: From Electrode Erosion to Plasma Characteristics. Plasma Sources Sci. Technol. 2022, 31, 035008. [Google Scholar] [CrossRef]
  93. De Meyer, R.; Verbeeck, J.; Bals, S.; Bogaerts, A. Contamination in Dielectric Barrier Discharge Plasmas by Electrode Erosion. ACS Mater. Lett. 2025, 7, 52–58. [Google Scholar] [CrossRef]
  94. Avino, F.; Howling, A.A.; Von Allmen, M.; Waskow, A.; Ibba, L.; Han, J.; Furno, I. Surface DBD Degradation in Humid Air, and a Hybrid Surface-Volume DBD for Robust Plasma Operation at High Humidity. J. Phys. D Appl. Phys. 2023, 56, 345201. [Google Scholar] [CrossRef]
  95. Hanson, R.E.; Kimelman, J.; Houser, N.M.; Lavoie, P. Effect of Dielectric Degradation on Dielectric Barrier Discharge Plasma Actuator Performance. In Proceedings of the 51st AIAA Aerospace Sciences Meeting Including the New Horizons Forum and Aerospace Exposition, Grapevine, TX, USA, 7–10 January 2013. [Google Scholar]
  96. Pons, J.; Oukacine, L.; Moreau, E.; Tatibouët, J.M. Observation of Dielectric Degradation after Surface Dielectric Barrier Discharge Operation in Air at Atmospheric Pressure. IEEE Trans. Plasma Sci. 2008, 36, 1342–1343. [Google Scholar] [CrossRef]
  97. Bian, D.; Wu, Y.; Long, C.; Lin, B. Effects of Material Degradation on Electrical and Optical Characteristics of Surface Dielectric Barrier Discharge. J. Appl. Phys. 2018, 124, 183301. [Google Scholar] [CrossRef]
  98. Wei, Q.; Yang, G.; Liu, G.; Jiang, H.; Zhang, T. Effects and Mechanism on Kapton Film under Ozone Exposure in a Ground near Space Simulator. Appl. Surf. Sci. 2018, 440, 1083–1090. [Google Scholar] [CrossRef]
  99. Kim, J.; Kim, S.J.; Lee, Y.N.; Kim, I.T.; Cho, G. Discharge Characteristics and Plasma Erosion of Various Dielectric Materials in the Dielectric Barrier Discharges. Appl. Sci. 2018, 8, 1294. [Google Scholar] [CrossRef]
  100. Kim, J.; Park, S.; Choe, W. Surface Plasma with an Inkjet-Printed Patterned Electrode for Low-Temperature Applications. Sci. Rep. 2021, 11, 12206. [Google Scholar] [CrossRef]
  101. Ma, X.; Wang, Y.; Chen, L.; Hu, L.; Wang, W.; Zhang, X.; Liu, C. Silicon Nanowires: The Promoter of Performance Improvement of Microplasma in a Microcavity Array Device. Plasma Sources Sci. Technol. 2021, 30, 025010. [Google Scholar] [CrossRef]
  102. Bunin, I.Z.; Chanturiya, V.A.; Ryazantseva, M.V.; Anashkina, N.E.; Koporulina, E.V. Effect of High-Voltage Nanosecond Pulses on the Structural Defects and Technological Properties of Naturally Occurring Dielectric Minerals. In Proceedings of the Springer Proceedings in Physics; Springer Science and Business Media, LLC: Berlin/Heidelberg, Germany, 2019; Volume 224, pp. 131–145. [Google Scholar]
  103. Houser, N.M.; Gimeno, L.; Hanson, R.E.; Goldhawk, T.; Simpson, T.; Lavoie, P. Microfabrication of Dielectric Barrier Discharge Plasma Actuators for Flow Control. Sens. Actuators Phys. 2013, 201, 101–104. [Google Scholar] [CrossRef]
  104. Cheng, L.; Zhitao, Z.; Xiaofeng, Z. A Study of the Aging of A-Al2O3 Dielectric Material in DBD Plasma. Plasma Sci. Technol. 2006, 8, 693–696. [Google Scholar] [CrossRef]
  105. Francke, K.P.; Rudolph, R.; Miessner, H. Design and Operating Characteristics of a Simple and Reliable DBD Reactor for Use with Atmospheric Air. Plasma Chem. Plasma Process. 2003, 23, 47–57. [Google Scholar] [CrossRef]
  106. Warlitz, P.; Hehner, M.T.; Pasch, S.; Serpieri, J.; Blank, T.; Kriegseis, J. On Durable Materials for Dielectric-Barrier Discharge Plasma Actuators. Sens. Actuators Phys. 2024, 366, 114985. [Google Scholar] [CrossRef]
  107. Wymenga, L.F.A.; van Turnhout, J.; Niasar, M.G.; van Zeijl, H.W.; van Driel, W.D.; Zhang, G.Q. Twin Surface Dielectric Barrier Discharge for Pulsed Atmospheric Plasma Production Using Novel Interfractal Electrodes. J. Phys. D Appl. Phys. 2026, 59, 025203. [Google Scholar] [CrossRef]
  108. Selivonin, I.; Moralev, I. Microdischarges Properties in SDBD: The Role of the Exposed Electrode Oxidation. Plasma Sources Sci. Technol. 2021, 30, 035005. [Google Scholar] [CrossRef]
  109. Pescini, E.; de Giorgi, M.G.; Francioso, L.; Taurino, A.; Lavoie, P. Electrode Material Degradation Monitoring for Durable Dielectric Barrier Discharge Plasma Actuators Manufacturing. In Proceedings of the 54th AIAA Aerospace Sciences Meeting; American Institute of Aeronautics and Astronautics Inc., AIAA: Reston, VA, USA, 2016. [Google Scholar]
  110. Asbach, C.; Kuhlbusch, T.A.J.; Fissan, H. Effect of Corona Discharge on the Gas Composition of the Sample Flow in a Gas Particle Partitioner. J. Environ. Monit. 2005, 7, 877–882. [Google Scholar] [CrossRef]
  111. Staack, D.; Farouk, B.; Gutsol, A.F.; Fridman, A. Spatially Resolved Temperature Measurements of Atmospheric-Pressure Normal Glow Microplasmas in Air. IEEE Trans. Plasma Sci. 2007, 35, 1448–1455. [Google Scholar] [CrossRef]
  112. Post, A.; Budde, M.; Vervloedt, S.C.L.; Engeln, R.; Huiskamp, T. Nanosecond Repetitively Pulsed Plasmas with MHz Bursts for CO2 Dissociation. J. Phys. D Appl. Phys. 2024, 57, 305203. [Google Scholar] [CrossRef]
  113. Zhang, S.; Wang, W.C.; Jiang, P.C.; Yang, D.Z.; Jia, L.; Wang, S. Comparison of Atmospheric Air Plasmas Excited by High-Voltage Nanosecond Pulsed Discharge and Sinusoidal Alternating Current Discharge. J. Appl. Phys. 2013, 114, 163301. [Google Scholar] [CrossRef]
  114. Černák, M.; Černáková, L.; Hudec, I.; Kováčik, D.; Zahoranová, A. Diffuse Coplanar Surface Barrier Discharge and Its Applications for In-Line Processing of Low-Added-Value Materials. EPJ Appl. Phys. 2009, 47, 22806. [Google Scholar] [CrossRef]
  115. Mošovská, S.; Medvecká, V.; Halászová, N.; Ďurina, P.; Valík, Ľ.; Mikulajová, A.; Zahoranová, A. Cold Atmospheric Pressure Ambient Air Plasma Inhibition of Pathogenic Bacteria on the Surface of Black Pepper. Food Res. Int. 2018, 106, 862–869. [Google Scholar] [CrossRef] [PubMed]
  116. Homola, T.; Prukner, V.; Hoffer, P.; Šimek, M. Multi-Hollow Surface Dielectric Barrier Discharge: An Ozone Generator with Flexible Performance and Supreme Efficiency. Plasma Sources Sci. Technol. 2020, 29, 095014. [Google Scholar] [CrossRef]
  117. Cimerman, R.; Hensel, K. Multi-Hollow Surface Dielectric Barrier Discharge: Production of Gaseous Species Under Various Air Flow Rates and Relative Humidities. Plasma Chem. Plasma Process. 2023, 43, 1411–1433. [Google Scholar] [CrossRef]
  118. Kim, M.H.; Cho, J.H.; Park, S.J.; Eden, J.G. Modular and Efficient Ozone Systems Based on Massively Parallel Chemical Processing in Microchannel Plasma Arrays: Performance and Commercialization. Eur. Phys. J. Spec. Top. 2017, 226, 2923–2944. [Google Scholar] [CrossRef]
  119. Machala, Z.; Janda, M.; Hensel, K.; Jedlovský, I.; Leštinská, L.; Foltin, V.; Martišovitš, V.; Morvová, M. Emission Spectroscopy of Atmospheric Pressure Plasmas for Bio-Medical and Environmental Applications. J. Mol. Spectrosc. 2007, 243, 194–201. [Google Scholar] [CrossRef]
  120. Yuan, D.; Zhang, G.; Ling, Z.; Wu, A.; He, Y.; Wang, Z. Characteristics of Temperature Distribution in Atmospheric Pulsed Surface Dielectric Barrier Discharge for Ozone Production. Vacuum 2020, 176, 109351. [Google Scholar] [CrossRef]
  121. Zhu, Z.; Zhang, M.; Wang, L.; Zhang, J.; Luo, S.; Wang, Z.; Guo, L.; Liu, Z.; Liu, D.; Rong, M. Comparison of Discharge Mode Transition of Air Plasma under Pulsed and Sinusoidal Excitations. J. Phys. D Appl. Phys. 2023, 56, 355201. [Google Scholar] [CrossRef]
  122. Guedah, H.; Abahazem, A.; Merbahi, N.; Yousfi, M.; Saber, K.; Ihlal, A. Experimental Investigation of Effects of Electric Operating Parameters on Pulsed Corona Discharges in Humid Air at Atmospheric Pressure. J. Anal. Sci. Methods Instrum. 2018, 08, 49–64. [Google Scholar] [CrossRef]
  123. Jiang, S.; Li, A.; Wang, Y.; Li, Z.; Rao, J.; Wu, Z. Discharge Characteristics and Hydrogen Peroxide Generation of Multi-Needles Plate Discharge Under Pulsed Power. IEEE Trans. Plasma Sci. 2023, 51, 177–183. [Google Scholar] [CrossRef]
  124. Tischler, C.M.; Walker, R.Z.; Szczuka, A.; Foster, J.E. Atmospheric Pressure Plasma Device With Secondary Flow for Gas-Phase Modification and Selectivity Control in Point-of-Use Water Disinfection Applications. IEEE Trans. Plasma Sci. 2025, 53, 3335–3347. [Google Scholar] [CrossRef]
  125. Hatamoto, A.; Emori, K.; Nishida, H. Surface Temperature Characterization of Dielectric Barrier Discharge Plasma Actuator in Quiescent Air. J. Phys. D Appl. Phys. 2023, 56, 155203. [Google Scholar] [CrossRef]
  126. Ozkan, A.; Dufour, T.; Bogaerts, A.; Reniers, F. How Do the Barrier Thickness and Dielectric Material Influence the Filamentary Mode and CO2 Conversion in a Flowing DBD? Plasma Sources Sci. Technol. 2016, 25, 045016. [Google Scholar] [CrossRef]
  127. Sun, A.; Guo, Y.; Li, Y.; Zhu, Y. Effect of Dielectric Thickness on Filamentary Mode Nanosecond-Pulse Dielectric Barrier Discharge at Low Pressure. Plasma 2026, 9, 4. [Google Scholar] [CrossRef]
  128. Ivankov, A.; Capela, T.; Rueda, V.; Bru, E.; Piquet, H.; Schitz, D.; Florez, D.; Diez, R. Experimental Study of a Nonthermal DBD-Driven Plasma Jet System Using Different Supply Methods. Plasma 2022, 5, 75–97. [Google Scholar] [CrossRef]
  129. Correale, G.; Avallone, F.; Starikovskiy, A.Y. Experimental Method to Quantify the Efficiency of the First Two Operational Stages of Nanosecond Dielectric Barrier Discharge Plasma Actuators. J. Phys. D Appl. Phys. 2016, 49, 505201. [Google Scholar] [CrossRef]
  130. Hulka, L.; Pietsch, G.J. Influence of Dimensions and Materials of Coplanar Arrangements on Ozone Production. Plasma Process. Polym. 2005, 2, 222–226. [Google Scholar] [CrossRef]
  131. Patel, R.; Peelen, R.; van Oijen, J.; Dam, N.; Nijdam, S. How Pulse Energy Affects Ignition Efficiency of DBD Plasma-Assisted Combustion. J. Phys. D Appl. Phys. 2024, 57, 025501. [Google Scholar] [CrossRef]
  132. Rao, J.; Zhang, R.; Shi, F.; Zhuang, L.; Ji, Z.; Zhuang, J. A High-Voltage Solid-State Marx Generator with Adjustable Pulse Edges. High Volt. 2023, 8, 878–888. [Google Scholar] [CrossRef]
  133. Huiskamp, T.; Beckers, F.J.C.M.; Hoeben, W.F.L.M.; Van Heesch, E.J.M.; Pemen, A.J.M. Matching a (Sub)Nanosecond Pulse Source to a Corona Plasma Reactor. Plasma Sources Sci. Technol. 2016, 25, 054006. [Google Scholar] [CrossRef]
  134. Zhang, Q.G.; Tao, F.B.; Li, Z.; Ding, W.D.; Qiu, A.C. Effect of Pulse Rise Time on the Glow Discharge in Nonuniform Electric Field. IEEE Trans. Plasma Sci. 2008, 36, 1008–1009. [Google Scholar] [CrossRef]
  135. Lei, P.; Kun, H.; Qiaogen, Z.; Dongxu, D.; Tianjun, L. Investigation on the Characteristics of Dielectric Barrier Surface Discharge Driven by Repetitive Nanosecond Pulses in Airflows. IEEE Trans. Plasma Sci. 2016, 44, 2812–2818. [Google Scholar] [CrossRef]
  136. Van Heesch, E.J.M.; Winands, G.J.J.; Pemen, A.J.M. Evaluation of Pulsed Streamer Corona Experiments to Determine the O * Radical Yield. J. Phys. D Appl. Phys. 2008, 41, 234015. [Google Scholar] [CrossRef]
  137. Höft, H.; Becker, M.M.; Kettlitz, M.; Brandenburg, R. Upscaling from Single- to Multi-Filament Dielectric Barrier Discharges in Pulsed Operation. J. Phys. D Appl. Phys. 2022, 55, 424003. [Google Scholar] [CrossRef]
  138. Hong, D.; Rabat, H.; Bauchire, J.M.; Chang, M.B. Measurement of Ozone Production in Non-Thermal Plasma Actuator Using Surface Dielectric Barrier Discharge. Plasma Chem. Plasma Process. 2014, 34, 887–897. [Google Scholar] [CrossRef]
  139. Gibalov, V.I.; Pietsch, G.J. The Development of Dielectric Barrier Discharges in Gas Gaps and on Surfaces. J. Phys. D Appl. Phys. 2000, 33, 2618–2636. [Google Scholar] [CrossRef]
  140. Portugal, S.; Roy, S.; Lin, J. Functional Relationship between Material Property, Applied Frequency and Ozone Generation for Surface Dielectric Barrier Discharges in Atmospheric Air. Sci. Rep. 2017, 7, 6388. [Google Scholar] [CrossRef]
  141. Zerrouki, A.; Motomura, H.; Ikeda, Y.; Jinno, M.; Yousfi, M. Optical Emission Spectroscopy Characterizations of Micro-Air Plasma Used for Simulation of Cell Membrane Poration. Plasma Phys. Control. Fusion 2016, 58, 075006. [Google Scholar] [CrossRef]
  142. Li, M.; Yan, Y.; Jin, Q.; Liu, M.; Zhu, B.; Wang, L.; Li, T.; Tang, X.J.; Zhu, Y.M. Experimental Study on Ozone Generation from Oxygen in Double Surface Dielectric Barrier Discharge. Vacuum 2018, 157, 249–258. [Google Scholar] [CrossRef]
  143. Soloviev, V.R.; Selivonin, I.V.; Moralev, I.A. Breakdown Voltage for Surface Dielectric Barrier Discharge Ignition in Atmospheric Air. Phys. Plasmas 2017, 24, 103528. [Google Scholar] [CrossRef]
  144. Zhang, S.; Chen, Z.; Zhang, B.; Chen, Y. Numerical Investigation on the Effects of Dielectric Barrier on a Nanosecond Pulsed Surface Dielectric Barrier Discharge. Molecules 2019, 24, 3933. [Google Scholar] [CrossRef]
  145. Yang, X.; Cheng, J.H.; Sun, D.W. Enhancing Microorganism Inactivation Performance through Optimization of Plate-to-Plate Dielectric Barrier Discharge Cold Plasma Reactors. Food Control 2024, 157, 110164. [Google Scholar] [CrossRef]
  146. Kogelschatz, U. Dielectric-Barrier Discharges: Their History, Discharge Physics, and Industrial Applications. Plasma Chem. Plasma Process. 2003, 23, 1–46. [Google Scholar] [CrossRef]
  147. Peeters, F.J.J. The Electrical Dynamics of Dielectric Barrier Discharges. Ph.D. Thesis, Technological University of Eindhoven, Eindhoven, The Netherlands, 2015. [Google Scholar]
  148. Luo, H.; Liu, K.; Ran, J.; Yue, Y.; Wang, X.; Yap, S.; Wong, C.S. Study of Dielectric Barrier Townsend Discharge in 3-Mm Air Gap at Atmospheric Pressure. IEEE Trans. Plasma Sci. 2014, 42, 1211–1215. [Google Scholar] [CrossRef]
  149. Amizhtan, S.K.; Amalanathan, A.J.; Sarathi, R.; Edin, H.; Taylor, N. Impact of Magnetic Field on Corona Discharge Behavior of Mineral Oil Under AC Voltage. IEEE Trans. Dielectr. Electr. Insul. 2022, 29, 1417–1424. [Google Scholar] [CrossRef]
  150. Jiang, N.; Lu, X.; Peng, B.; Li, J.; Shang, K.; Lu, N.; Wu, Y. Physical and Chemical Properties of a Magnetic-Assisted DC Superimposed Nanosecond-Pulsed Streamer Discharge Plasma. J. Phys. D Appl. Phys. 2021, 54, 245203. [Google Scholar] [CrossRef]
  151. Jiang, N.; Sun, Y.; Peng, B.; Li, J.; Shang, K.; Lu, N.; Wu, Y. Promoting Volatile Organic Compounds Removal by a Magnetically Assisted Nanosecond Pulsed Gear-Cylinder Dielectric Barrier Discharge. Plasma Process. Polym. 2022, 19, e2100108. [Google Scholar] [CrossRef]
  152. Wang, J.; Liu, Y.J.; Zhu, T.; Chen, Y.Q.; Wang, J.B. Magnetic Field Enhanced Ionic Wind for Environment-Friendly Improvement and Thermal Management Application. Appl. Therm. Eng. 2021, 194, 117054. [Google Scholar] [CrossRef]
  153. Yang, W.; Zhang, M.; Li, C.; Wang, Z.; Xiao, M.; Li, J.; Li, D.; Zheng, W. Influence of Magnetic Field on Corona Discharge Characteristics under Different Humidity Conditions. In Proceedings of the 2022 IEEE 3rd China International Youth Conference on Electrical Engineering, CIYCEE 2022; Institute of Electrical and Electronics Engineers Inc.: New York, NY, USA, 2022. [Google Scholar]
  154. Guo, H.; Xu, Y.; Wang, Y.; Ren, C. Experimental Study on the Effects of Airflow, Magnetic Field and Combination of Airflow with Magnetic Field on Nanosecond Pulsed Dielectric Barrier Discharge in Atmospheric Air. Phys. Plasmas 2020, 27, 023519. [Google Scholar] [CrossRef]
  155. Li, J.Q.; Yan, H.J.; Li, T.; Yu, S.Q.; Fan, J.W.; Song, J. Surface Charge Characteristics in Surface Dielectric Barrier Discharge Actuators with Thin Cylindrical Exposed Electrode. J. Appl. Phys. 2023, 133, 063301. [Google Scholar] [CrossRef]
  156. Lai, F.C.; Sharma, R.K. EHD-Enhanced Drying with Multiple Needle Electrode. J. Electrostat. 2005, 63, 223–237. [Google Scholar] [CrossRef]
  157. Liu, M.; Tang, J.; Yao, Q.; Miao, Y. Development Processes of Positive and Negative DC Corona under Needle-Plate Electrode in Air. In Proceedings of the ICHVE 2016—2016 IEEE International Conference on High Voltage Engineering and Application; Institute of Electrical and Electronics Engineers Inc.: New York, NY, USA, 2016. [Google Scholar]
  158. Huiskamp, T.; Subramanian, S.; Gururajan, V.; Schroeder, W.P.; Schroeder, C.A.; Gundersen, M.A.; Cronin, S.B. Boosting the Energy Efficiency of a Nanosecond Pulsed Corona Plasma System with a Multiple-Wire Plasma Reactor. IEEE Trans. Plasma Sci. 2020, 48, 245–257. [Google Scholar] [CrossRef]
  159. Zhang, C.; Shao, T.; Ma, H.; Zhang, D.; Ren, C.; Yan, P.; Tarasenko, V.F.; Schamiloglu, E. Experimental Study on Conduction Current of Positive Nanosecond-Pulse Diffuse Discharge at Atmospheric Pressure. IEEE Trans. Dielectr. Electr. Insul. 2013, 20, 1304–1314. [Google Scholar] [CrossRef]
  160. Zhao, Y.; Shi, Y.; Liu, S.; Huang, Y.; Liu, Z.; Zhang, L.; Jin, S.; Fang, Z. Study on the Mode Transition of Multi-Hollow Dielectric Barrier Discharge. J. Appl. Phys. 2023, 134, 103301. [Google Scholar] [CrossRef]
  161. Martins, A.A.; Pinheiro, M.J. On the Propulsive Force Developed by Asymmetric Capacitors in a Vacuum. Phys. Procedia 2011, 20, 112–119. [Google Scholar] [CrossRef]
  162. Natsume, C.; Komuro, A.; Ando, A. Characterisation of Surface Charge Density and Net Electric Field during Parallel-Plate Dielectric Barrier Discharge Generated in Atmospheric-Pressure Air. Plasma Sources Sci. Technol. 2022, 31, 095019. [Google Scholar] [CrossRef]
  163. Aerts, R.; Somers, W.; Bogaerts, A. Carbon Dioxide Splitting in a Dielectric Barrier Discharge Plasma: A Combined Experimental and Computational Study. ChemSusChem 2015, 8, 702–716. [Google Scholar] [CrossRef]
  164. Kitayama, J.; Kuzumoto, M. Analysis of Ozone Generation from Air in Silent Discharge. J. Phys. D Appl. Phys. 1999, 32, 3032–3040. [Google Scholar] [CrossRef]
  165. Kim, H.H.; Abdelaziz, A.A.; Teramoto, Y.; Nozaki, T.; Hensel, K.; Mok, Y.S.; Saud, S.; Nguyen, D.B.; Lee, D.H.; Kang, W.S. Interim Report of Plasma Catalysis: Footprints in the Past and Blueprints for the Future. Int. J. Plasma Environ. Sci. Technol. 2021, 15, e01004. [Google Scholar] [CrossRef]
  166. Jodzis, S.; Baran, K. The Influence of Gas Temperature on Ozone Generation and Decomposition in Ozone Generator. How Is Ozone Decomposed? Vacuum 2022, 195, 110647. [Google Scholar] [CrossRef]
  167. Xie, L.; Yuan, D.; Wang, L.; Zhang, G.; Peng, B.; Wei, L.; Ling, Z. A Novel Dielectric Barrier Discharge Ozone Generator with Excellent Microdischarge Temperature Behavior. Appl. Therm. Eng. 2024, 250, 123453. [Google Scholar] [CrossRef]
  168. Sung, Y.M.; Sakoda, T. Optimum Conditions for Ozone Formation in a Micro Dielectric Barrier Discharge. Surf. Coat. Technol. 2005, 197, 148–153. [Google Scholar] [CrossRef]
  169. Wei, L.; Deng, H.; Neretti, G.; Zhang, Y. Ozone Yield Limit in Low Temperature Plasmas Based on Thermodynamics. Eur. Phys. J. D 2019, 73, 136. [Google Scholar] [CrossRef]
  170. Pekárek, S.; Mikeš, J. Temperature-and Airflow-Related Effects of Ozone Production by Surface Dielectric Barrier Discharge in Air. Eur. Phys. J. D 2014, 68, 310. [Google Scholar] [CrossRef]
  171. Xia, C.; Shen, X.; Gu, J.; Zhou, W.; Liu, Y. Wire-Tube DBD Reactor for H2S Treatment: Optimization of Materials and Configurations. Water Air Soil Pollut. 2022, 233, 398. [Google Scholar] [CrossRef]
  172. Pavlovich, M.J.; Ono, T.; Galleher, C.; Curtis, B.; Clark, D.S.; Machala, Z.; Graves, D.B. Air Spark-like Plasma Source for Antimicrobial NOx Generation. J. Phys. D Appl. Phys. 2014, 47, 505202. [Google Scholar] [CrossRef]
  173. Yuan, D.; Wang, Z.; Ding, C.; He, Y.; Whiddon, R.; Cen, K. Ozone Production in Parallel Multichannel Dielectric Barrier Discharge from Oxygen and Air: The Influence of Gas Pressure. J. Phys. D Appl. Phys. 2016, 49, 455203. [Google Scholar] [CrossRef]
  174. Hojnik, N.; Modic, M.; Ni, Y.; Filipič, G.; Cvelbar, U.; Walsh, J.L. Effective Fungal Spore Inactivation with an Environmentally Friendly Approach Based on Atmospheric Pressure Air Plasma. Environ. Sci. Technol. 2019, 53, 1893–1904. [Google Scholar] [CrossRef]
  175. Sun, Z.; Zheng, X.; Zheng, H.; Zhao, Z.; Li, J. Effects of Pulse Rise Time and Pulse Width on Discharge Mode Transition of SDBD Plasma under Repetitive Pulses. J. Phys. D Appl. Phys. 2025, 58, 045202. [Google Scholar] [CrossRef]
  176. Torres Segura, A.N.; Ikuse, K.; Hamaguchi, S.; Gibson, A.R.; Schücke, L. Influence of Gas Flow Rate on Modes of Reactive Oxygen and Nitrogen Species in a Grid-Type Surface Dielectric Barrier Discharge. J. Appl. Phys. 2025, 137, 203306. [Google Scholar] [CrossRef]
  177. Shimizu, T.; Sakiyama, Y.; Graves, D.B.; Zimmermann, J.L.; Morfill, G.E. The Dynamics of Ozone Generation and Mode Transition in Air Surface Micro-Discharge Plasma at Atmospheric Pressure. New J. Phys. 2012, 14, 103028. [Google Scholar] [CrossRef]
  178. Nemmich, S.; Benabboun, A.; Hammadi, N.; Tilmatine, A.; Brahami, M.N.; Nassour, K.; Jbilou, M.; Bechekir, S. Investigation of the Half-Life of Ozone Generated by Dielectric Barrier Discharge Using Response Surface Modeling. J. Korean Phys. Soc. 2024, 85, 138–146. [Google Scholar] [CrossRef]
  179. Xie, S.; He, Y.; Yuan, D.; Wang, Z.; Kumar, S.; Zhu, Y.; Cen, K. The Effects of Gas Flow Pattern on the Generation of Ozone in Surface Dielectric Barrier Discharge. Plasma Sci. Technol. 2019, 21, 055505. [Google Scholar] [CrossRef]
  180. Timmermann, E.; Prehn, F.; Schmidt, M.; Höft, H.; Brandenburg, R.; Kettlitz, M. Indoor Air Purification by Dielectric Barrier Discharge Combined with Ionic Wind: Physical and Microbiological Investigations. J. Phys. D Appl. Phys. 2018, 51, 164003. [Google Scholar] [CrossRef]
  181. Plank, T.; Jalakas, A.; Aints, M.; Paris, P.; Valk, F.; Viidebaum, M.; Jõgi, I. Ozone Generation Efficiency as a Function of Electric Field Strength in Air. J. Phys. D Appl. Phys. 2014, 47, 335205. [Google Scholar] [CrossRef]
  182. Paris, P.; Aints, M.; Laan, M.; Valk, F. Measurement of Intensity Ratio of Nitrogen Bands as a Function of Field Strength. J. Phys. D Appl. Phys. 2004, 37, 1179–1184. [Google Scholar] [CrossRef]
  183. Paris, P.; Aints, M.; Valk, F.; Plank, T.; Haljaste, A.; Kozlov, K.V.; Wagner, H.E. Intensity Ratio of Spectral Bands of Nitrogen as a Measure of Electric Field Strength in Plasmas. J. Phys. D Appl. Phys. 2005, 38, 3894–3899. [Google Scholar] [CrossRef]
  184. Bilek, P.; Obrusnik, A.; Hoder, T.; Šimek, M.; Bonaventura, Z. Electric Field Determination in Air Plasmas from Intensity Ratio of Nitrogen Spectral Bands: II. Reduction of the Uncertainty and State-of-the-Art Model. Plasma Sources Sci. Technol. 2018, 27, 085012. [Google Scholar] [CrossRef]
  185. Obrusnik, A.; Bilek, P.; Hoder, T.; Šimek, M.; Bonaventura, Z. Electric Field Determination in Air Plasmas from Intensity Ratio of Nitrogen Spectral Bands: I. Sensitivity Analysis and Uncertainty Quantification of Dominant Processes. Plasma Sources Sci. Technol. 2018, 27, 085013. [Google Scholar] [CrossRef]
  186. Lu, Y.; Ono, R.; Komuro, A. Simultaneous Measurement of Electrical Potential on Both Sides of the Dielectric Surface in a Parallel-Plate Dielectric Barrier Discharges and Analysis of Net Electric Field. Plasma Sources Sci. Technol. 2024, 33, 04LT01. [Google Scholar] [CrossRef]
  187. Bonaventura, Z.; Bourdon, A.; Celestin, S.; Pasko, V.P. Electric Field Determination in Streamer Discharges in Air at Atmospheric Pressure. Plasma Sources Sci. Technol. 2011, 20, 035012. [Google Scholar] [CrossRef]
  188. Offerhaus, B.; Lackmann, J.W.; Kogelheide, F.; Bracht, V.; Smith, R.; Bibinov, N.; Stapelmann, K.; Awakowicz, P. Spatially Resolved Measurements of the Physical Plasma Parameters and the Chemical Modifications in a Twin Surface Dielectric Barrier Discharge for Gas Flow Purification. Plasma Process. Polym. 2017, 14, e1600255. [Google Scholar] [CrossRef]
  189. Mutalip, A.A.; Ussenov, Y.A.; Akildinova, A.K.; Dosbolayev, M.K.; Gabdullin, M.T.; Ramazanov, T.S. Determination of the Reduced Electric Field in Surface Dielectric Barrier Discharge Plasmas. Bull. Karaganda Univ. Phys. Ser. 2021, 103, 35–44. [Google Scholar] [CrossRef]
  190. Haacke, M.; Humpert, C.; Pietsch, G.J. Influence of Field Strength and Energy Distribution of Different Barrier Discharge Arrangements on Ozone Generation. Ozone Sci. Eng. 2002, 24, 193–201. [Google Scholar] [CrossRef]
  191. Okada, S.; Namihira, T.; Wang, D. Yield Improvement of Air-Fed Ozonizer Using Shorter Pulsed Discharges. Plasma Med. 2020, 10, 181–190. [Google Scholar] [CrossRef]
  192. Liu, S.; Neiger, M. Excitation of Dielectric Barrier Discharges by Unipolar Submicrosecond Square Pulses. J. Phys. D Appl. Phys. 2001, 34, 1632–1638. [Google Scholar] [CrossRef]
  193. Eliasson, B.; Hirth, M.; Kogelschatz, U. Ozone Synthesis from Oxygen in Dielectric Barrier Discharges. J. Phys. D Appl. Phys. 1987, 20, 1421–1437. [Google Scholar] [CrossRef]
  194. Ono, R.; Oda, T. Spatial Distribution of Ozone Density in Pulsed Corona Discharges Observed by Two-Dimensional Laser Absorption Method. J. Phys. D Appl. Phys. 2004, 37, 730–735. [Google Scholar] [CrossRef]
  195. Taglioli, M.; Shaw, A.; Wright, A.; FitzPatrick, B.; Neretti, G.; Seri, P.; Borghi, C.A.; Iza, F. EHD-Driven Mass Transport Enhancement in Surface Dielectric Barrier Discharges. Plasma Sources Sci. Technol. 2016, 25, 06LT01. [Google Scholar] [CrossRef]
  196. Sakiyama, Y.; Graves, D.B.; Chang, H.W.; Shimizu, T.; Morfill, G.E. Plasma Chemistry Model of Surface Microdischarge in Humid Air and Dynamics of Reactive Neutral Species. J. Phys. D Appl. Phys. 2012, 45, 425201. [Google Scholar] [CrossRef]
  197. Takashima, K.; Zuzeek, Y.; Lempert, W.R.; Adamovich, I.V. Characterization of a Surface Dielectric Barrier Discharge Plasma Sustained by Repetitive Nanosecond Pulses. Plasma Sources Sci. Technol. 2011, 20, 055009. [Google Scholar] [CrossRef]
  198. Komuro, A.; Teramoto, Y.; Kim, H.H. Simulation-Based Parametric Correlation Analysis of O and N Radical Production in Atmospheric-Pressure Streamer Discharges. J. Phys. D Appl. Phys. 2025, 58, 425203. [Google Scholar] [CrossRef]
  199. Homola, T.; Pongrác, B.; Zemánek, M.; Šimek, M. Efficiency of Ozone Production in Coplanar Dielectric Barrier Discharge. Plasma Chem. Plasma Process. 2019, 39, 1227–1242. [Google Scholar] [CrossRef]
  200. Braun, D.; Kuchler, U. Pietsch Microdischarges in Air-Fed Ozonizers. J. Phys. D Appl. Phys. 1991, 24, 564. [Google Scholar] [CrossRef]
  201. Yang, D.Z.; Wang, W.C.; Zhang, S.; Tang, K.; Liu, Z.J.; Wang, S. Multiple Current Peaks in Room-Temperature Atmospheric Pressure Homogenous Dielectric Barrier Discharge Plasma Excited by High-Voltage Tunable Nanosecond Pulse in Air. Appl. Phys. Lett. 2013, 102, 194102. [Google Scholar] [CrossRef]
  202. Starikovskii, A.Y.; Nikipelov, A.A.; Nudnova, M.M.; Roupassov, D.V. SDBD Plasma Actuator with Nanosecond Pulse-Periodic Discharge. Plasma Sources Sci. Technol. 2009, 18, 034015. [Google Scholar] [CrossRef]
  203. Xu, G.; Zhang, W.; Wang, N.; Wang, G.; Yuan, S. Impedance Matching Study of Surface Dielectric Barrier Discharge Plasma Generator. In Proceedings of the Energy Reports; Elsevier Ltd.: Amsterdam, The Netherlands, 2020; Volume 6, pp. 276–281. [Google Scholar]
  204. Kriegseis, J.; Möller, B.; Grundmann, S.; Tropea, C. Capacitance and Power Consumption Quantification of Dielectric Barrier Discharge (DBD) Plasma Actuators. J. Electrostat. 2011, 69, 302–312. [Google Scholar] [CrossRef]
  205. Huiskamp, T.; Van Oorschot, J.J.; Ton, C.; Doornbos, L.; Van Kuik, B.; Pemen, A.J.M.; Beckers, F.J.C.M.; Hoeben, W.F.L.M.; Azizi, M.; Van Heesch, E.J.M. Compact, Repetitive Nanosecond Pulse Generation for Industrial Applications: The Advance of the Solid-State Impedance Matched Marx Generator. In Proceedings of the 2024 IEEE International Power Modulator and High Voltage Conference, IPMHVC 2024; Institute of Electrical and Electronics Engineers Inc.: New York, NY, USA, 2024. [Google Scholar]
  206. Huiskamp, T.; Van Heesch, E.; Pemen, A. Pulsed Power Generators. In Pulsed Discharge Plasmas; Shao, T., Zhang, C., Eds.; Springer Nature: Singapore, 2023; pp. 3–44. ISBN 978-981-99-1140-0. [Google Scholar]
  207. Pipa, A.V.; Hink, R.; Foest, R.; Brandenburg, R. Dependence of Dissipated Power on Applied Voltage for Surface Barrier Discharge from Simplest Equivalent Circuit. Plasma Sources Sci. Technol. 2020, 29, 12LT01. [Google Scholar] [CrossRef]
  208. Gui, H.; Zhao, Z.; Shi, Q.; Liu, X.; Yao, C. All-Solid-State Nanosecond Pulse Power Supply Based on BLTs and Pulse Transformer for DBD Application. IEEE Trans. Power Electron. 2023, 38, 10085–10092. [Google Scholar] [CrossRef]
  209. Behlke GmbH. Behlke GTHS Operating Manual 2024; Behlke GmbH: Kronberg im Taunus, Germany, 2024. [Google Scholar]
  210. Schweiger, C.; Door, M.; Filianin, P.; Herkenhoff, J.; Kromer, K.; Lange, D.; Marschall, D.; Rischka, A.; Wagner, T.; Eliseev, S.; et al. Fast Silicon Carbide MOSFET Based High-Voltage Push-Pull Switch for Charge State Separation of Highly Charged Ions with a Bradbury-Nielsen Gate. Rev. Sci. Instrum. 2022, 93, 094702. [Google Scholar] [CrossRef] [PubMed]
  211. Lippmann, M.; Hitzemann, M.; Winkelholz, J.; Bailey, D.; Zimmermann, S. A Modular, Isolated High-Voltage Switch for Application in Ion Mobility Spectrometry. HardwareX 2024, 19, e00574. [Google Scholar] [CrossRef]
Figure 1. Schematic of a DBD. It shows the main design parameters discussed in this review. The meaning of the symbols is given in the list of abbreviations.
Plasma 09 00015 g001
Figure 2. Schematic side view of commonly used DBD geometries for pulsed plasma production in air. Yellow: high-voltage electrode. Blue: dielectric barrier. Gray: ground electrode. Purple: plasma formation. (a): Needle–plate DBD [29]. (b): Wire–plate DBD [30]. (c): Surface DBD [31]. (d): Coplanar DBD [32]. (e,f): Volume DBDs [33]. (g,h): Multi-hollow DBDs [34]. (i,j): Coaxial DBDs [35]. (k): Grating DBD [2]. (l): Plasma jet (arrow depicts direction of air flow) [36].
Plasma 09 00015 g002
Figure 3. Equivalent circuit of a pulsed DBD. V: Applied voltage. Cg: Gap capacitance. Cd: Dielectric capacitance. Idisp: Displacement current. Icond: Conduction current. Itot: Total current. Ug: Voltage over the gap. Ud: Voltage over the barrier. Rg: Variable resistance of the gap.
Plasma 09 00015 g003
Figure 4. Primary and secondary discharge observed during a 600 ns positive pulse applied to a DBD in ambient air (experiments performed in our laboratory).
Plasma 09 00015 g004
Figure 5. SEM image of erosion of an Ag/Pd electrode after long nanopulse operation. The arrows show the cracks. Black spots are encircled in purple, the eroded area in yellow, from [107].
Plasma 09 00015 g005
Figure 6. Wire-to-plate DBD, with dielectric barrier between the wires and the flat ground electrode. The high voltage pulses are applied to the thin discharge wires. Several parameters can be varied: the number of wires (n), εr, dg, de, le and dd.
Plasma 09 00015 g006
Figure 7. Paschen curve for atmospheric air. Plotted based on the data given in [161].
Plasma 09 00015 g007
Figure 8. Many variables could be considered when designing pulsed DBD systems for treating a material or biological substrate in ambient air. These variables could be categorized in the electrical domain (pulse source, DBD parameters), the chemical domain (RONS and heat production, ambient temperature, humidity and presence of air flows) and the biological/material domain (interaction of the plasma with the object to be treated). The main variables are displayed in this figure. Black arrows point to a variable that is influenced by another variable (i.e., Eg influences Icond, which then influences ne). Red terms are varying in time (during plasma operation), and black terms are constant over time. Dashed arrows: External and ambient factors influencing DBD performance.
Plasma 09 00015 g008
Figure 9. Ozone formation reaction rate constants versus air temperature, based on the rate coefficients provided in [26,32].
Plasma 09 00015 g009
Figure 10. Ozone dissociation reaction rate constants versus air temperature, plotted by using the rate coefficients given in [26,32,168]. Note that the curves given by the authors for the same dissociation reaction differ somewhat.
Plasma 09 00015 g010
Figure 11. OES wavelength intensity ratio (391.4 vs. 337.1 nm) versus reduced electric field and ozone yield. The equations given in [181,182,184,188,189] were plotted. Notice that the authors make different predictions of the course of the intensity ratio vs. E/N.
Plasma 09 00015 g011
Figure 12. Electron energy and ozone production yield versus electric field strength in air, based on [141,181]. The value of Te is marked where the ozone yield is maximal.
Plasma 09 00015 g012
Figure 13. Fractions of electron energy spent on different chemical processes versus electric field strength in air. Plotted based on data given in [25].
Plasma 09 00015 g013
Table 3. Tangential loss factor, relative permittivity and dielectric loss factor of commonly used dielectric barrier materials.
Materialtan (δ)εrdlfRefs.
Quartz1 × 10−3–1 × 10−43.8–43.7 × 10⁻³–3.7 × 10⁻⁴[126,127]
Alumina1 × 10−2–1 × 10−39.6–9.79.5 × 10−3–9.8 × 10⁻²[104,126]
Borosilicate glass1 × 10−3–1 × 10−44.6–74 × 10−4–5 × 10⁻³[126,128]
Table 4. Influence of the dielectric barrier relative permittivity (εr), dielectric thickness (dd), electrode length (le), electrode width (we) and air gap (dg) on various plasma parameters. Eg: electric field strength in air gap. Ed: electric field strength in dielectric barrier. Vbr: breakdown voltage, dlf: dielectric loss factor, Ccell: DBD capacitance (plasma off), trise/tfall: rise and fall time of the voltage (nano)pulse, ne: electron density, Te: electron temperature (electron energy), Icond: conduction current, RONS: reactive oxygen and nitrogen species, Q: deposited charge (per pulse), Ep: energy per pulse, ηO3: ozone yield.
εrddle ↑ *wedg
Eg-
Ed-
Vbr↓ **-
dlf----
Barrier heating
Ccell
trise, tfall
dE/dt
Icond, ne,Te↑ ***↑ ***↑ ***↑ ***
RONS
Q, Ep↑ ****
ηO3-
↑: Increase of parameter value. ↓: Decrease of parameter value. * Provided that the change in resistance is negligible with the increase in electrode length (for example by using bypasses). ** Vbr is more dependent on dd than on εr [143]. *** An increase in Eg increases this variable, but a decrease in dE/dt decreases this variable. We here assumed that the effect of Eg is dominant over that of dE/dt, based on [2,34,62]. **** Magnitude varies per material [147].
Disclaimer/Publisher’s Note: The statements, opinions and data contained in all publications are solely those of the individual author(s) and contributor(s) and not of MDPI and/or the editor(s). MDPI and/or the editor(s) disclaim responsibility for any injury to people or property resulting from any ideas, methods, instructions or products referred to in the content.