Article

Study on Development of Hydrogen Peroxide Generation Reactor with Pin-to-Water Atmospheric Discharges

Plasma Technology Research Center, Korea Institute of Fusion Energy, 37 Dongjangsan-ro, Gunsan-si 54004, Jeollabuk-do, Republic of Korea
*
Author to whom correspondence should be addressed.
Current address: Samsung Electronics, 1-1 Samsungjeonja-ro, Hwaseong-si 18448, Gyeonggi-do, Republic of Korea.
Plasma 2025, 8(4), 41; https://doi.org/10.3390/plasma8040041
Submission received: 3 September 2025 / Revised: 29 September 2025 / Accepted: 8 October 2025 / Published: 14 October 2025
(This article belongs to the Special Issue Feature Papers in Plasma Sciences 2025)

Abstract

We present an experimentally validated, engineering-oriented framework for the design and operation of pin-to-water (PTW) atmospheric discharges to produce hydrogen peroxide (H2O2) on demand. Motivated by industrial needs for safe, point-of-use oxidant supply, we combine time-resolved diagnostics (FTIR, OES), liquid-phase analysis (ion chromatography, pH, conductivity), and coupled plasma-chemistry/fluid simulations to link plasma state to aqueous H2O2 yield. Under the tested conditions (14.3 kHz, 0.2 kW; electrode to quartz wall distance 12–14 mm; coolant setpoints 0–40 °C), H2O2 concentration follows a reproducible non-monotonic trajectory: rapid accumulation during the early treatment (typical peak at ~15–25 min), followed by decline with continued operation. The decline coincides with a robust vibrational-temperature (Tvib) threshold near ~4900 K measured from N2 emission, and with concurrent NOX accumulation and bulk acidification. Global chemistry modeling and Fluent flow fields reproduce the observed trend and show that both vibrational excitation (kinetics) and convective transport (mass/heat transfer) determine the productive time window. Based on these results, we formulate practical design rules—electrode gap (power density), discharge current control, thermal/flow management, water quality, and OES-based Tvib monitoring with an automated stop rule—that maximize H2O2 yield while avoiding NOX-dominated suppression. The study provides a clear path for transforming mechanistic plasma insights into deployable, industrial H2O2 generator designs.

1. Introduction

Hydrogen peroxide (H2O2) is a versatile reactive oxygen species (ROS) that plays an important role in semiconductor processing [1,2], sterilization [3], and agricultural biotechnology [4]. Especially in the semiconductor industry, high-purity H2O2 is indispensable for wet cleaning processes, where organic residues and particles must be removed without surface damage at advanced technology nodes [1,2]. Conventionally, semiconductor fabs depend on bulk delivery of concentrated H2O2, followed by on-site dilution to working concentrations. However, this approach is increasingly challenged by stringent environmental regulations, high logistics costs, and safety risks associated with handling large volumes of concentrated oxidants [5]. An attractive alternative is the in situ generation of H2O2 directly from water, enabling point-of-use supply without external chemical procurement. Such a system would simultaneously reduce contamination risk, mitigate storage hazards, and improve operational flexibility in fab environments [6]. In the semiconductor industry, biological treatment processes coupled with UV and H2O2 pretreatment have been reported to effectively degrade organic effluents from semiconductor manufacturing. To prevent damage to microstructured and chemically fragile components, the process is typically conducted by immersing them for extended periods in H2O2 solutions at concentrations ranging from several hundred to several thousand ppm [7]. Also, vapor-phase H2O2 monitors require frequent calibration, during which ppm-level H2O2 solutions are commonly employed [8].
Plasma–liquid interaction offers a unique route for on-site H2O2 generation [5,6]. When a discharge is sustained in contact with water, reactive oxygen and nitrogen species (ROS/RNS) form in the plasma phase and drive secondary aqueous reactions that yield H2O2. Among the various approaches, pin-to-water discharges are particularly appealing due to their simplicity, scalability, and atmospheric pressure operation [9]. Recent experimental studies have clarified several design-relevant factors that control H2O2 production at the plasma–liquid interface. Liu et al. demonstrated that interfacial processes–notably sputtering, electric-field-induced hydrated-ion emission, and surface evaporation–exert a dominant influence on H2O2 yield, and reported production rates approaching ~1200 μmol h−1 under optimized conditions; their work also emphasizes the strong dependence of yield on initial liquid conductivity and discharge polarity [10]. Nguyen et al. investigated pin-to-pin underwater pulsed discharges across pulse energies from 10 to 45 mJ and showed that higher pulse energy and operation in the anode regime enhance H2O2 formation, while electrode erosion mechanisms (which depend on electrode material and polarity) can strongly affect long-term performance and reliability [11]. Together, these reports highlight that (i) interfacial plasma processes and bulk conductivity set the intrinsic productivity limits, and (ii) practical device design must balance instantaneous H2O2 generation against electrode durability and energy input—considerations that motivate the device-level design rules developed in the present study.
Building on these insights, the present work directly connects plasma diagnostics and transport modeling to concrete design recommendations for on-demand H2O2 generators based on pin-to-water discharges. In addition, this configuration offers clear environmental and practical advantages, including negligible chemical waste generation, low-cost operation without the need for expensive catalysts or high-pressure systems, and straightforward applicability in on-site equipment installation. However, previous studies have consistently observed that H2O2 concentration in plasma-activated water does not increase monotonically with treatment time, but rather exhibits non-linear dynamics: an initial rise followed by a decline under prolonged exposure [12,13]. This phenomenon has been linked to plasma mode transitions from ROS-dominated to RNS-dominated regimes, strongly correlated with the vibrational temperature (Tvib) of nitrogen [14].
While the correlation between Tvib and plasma chemistry has been reported, translating this mechanistic insight into actionable design guidelines remains largely unexplored. Existing patents on on-site ultra-pure H2O2 generation systems for semiconductor fabrication [15] highlight industrial interest but do not provide plasma diagnostics, mechanistic rationale, or operational criteria for maximizing H2O2 yield. These documents establish engineering concepts but lack the scientific foundation necessary for rational reactor design. Thus, a critical knowledge gap exists between industrial demand and plasma science: how to configure a plasma device to sustain efficient H2O2 production while avoiding transitions that suppress it.
In this work, we address this gap by systematically investigating H2O2 generation in a pin-to-water discharge system using time-resolved spectroscopy (OES, FTIR), ion chromatography, global plasma modeling, and fluid simulations. We identify the vibrational excitation of nitrogen as a control parameter that dictates the operational window for efficient H2O2 production. Based on this mechanistic understanding, we propose device-level design strategies, including guidelines for electrode geometry, discharge current, and treatment duration, to maximize H2O2 yield before the abnormal glow transition occurs. By explicitly linking plasma diagnostics with engineering design, this study advances beyond prior mechanistic observations and patent-level proposals, offering a framework for compact, scalable H2O2 generators capable of addressing industrial requirements in sterilization, food processing, agriculture, and particularly semiconductor manufacturing.

2. Methods

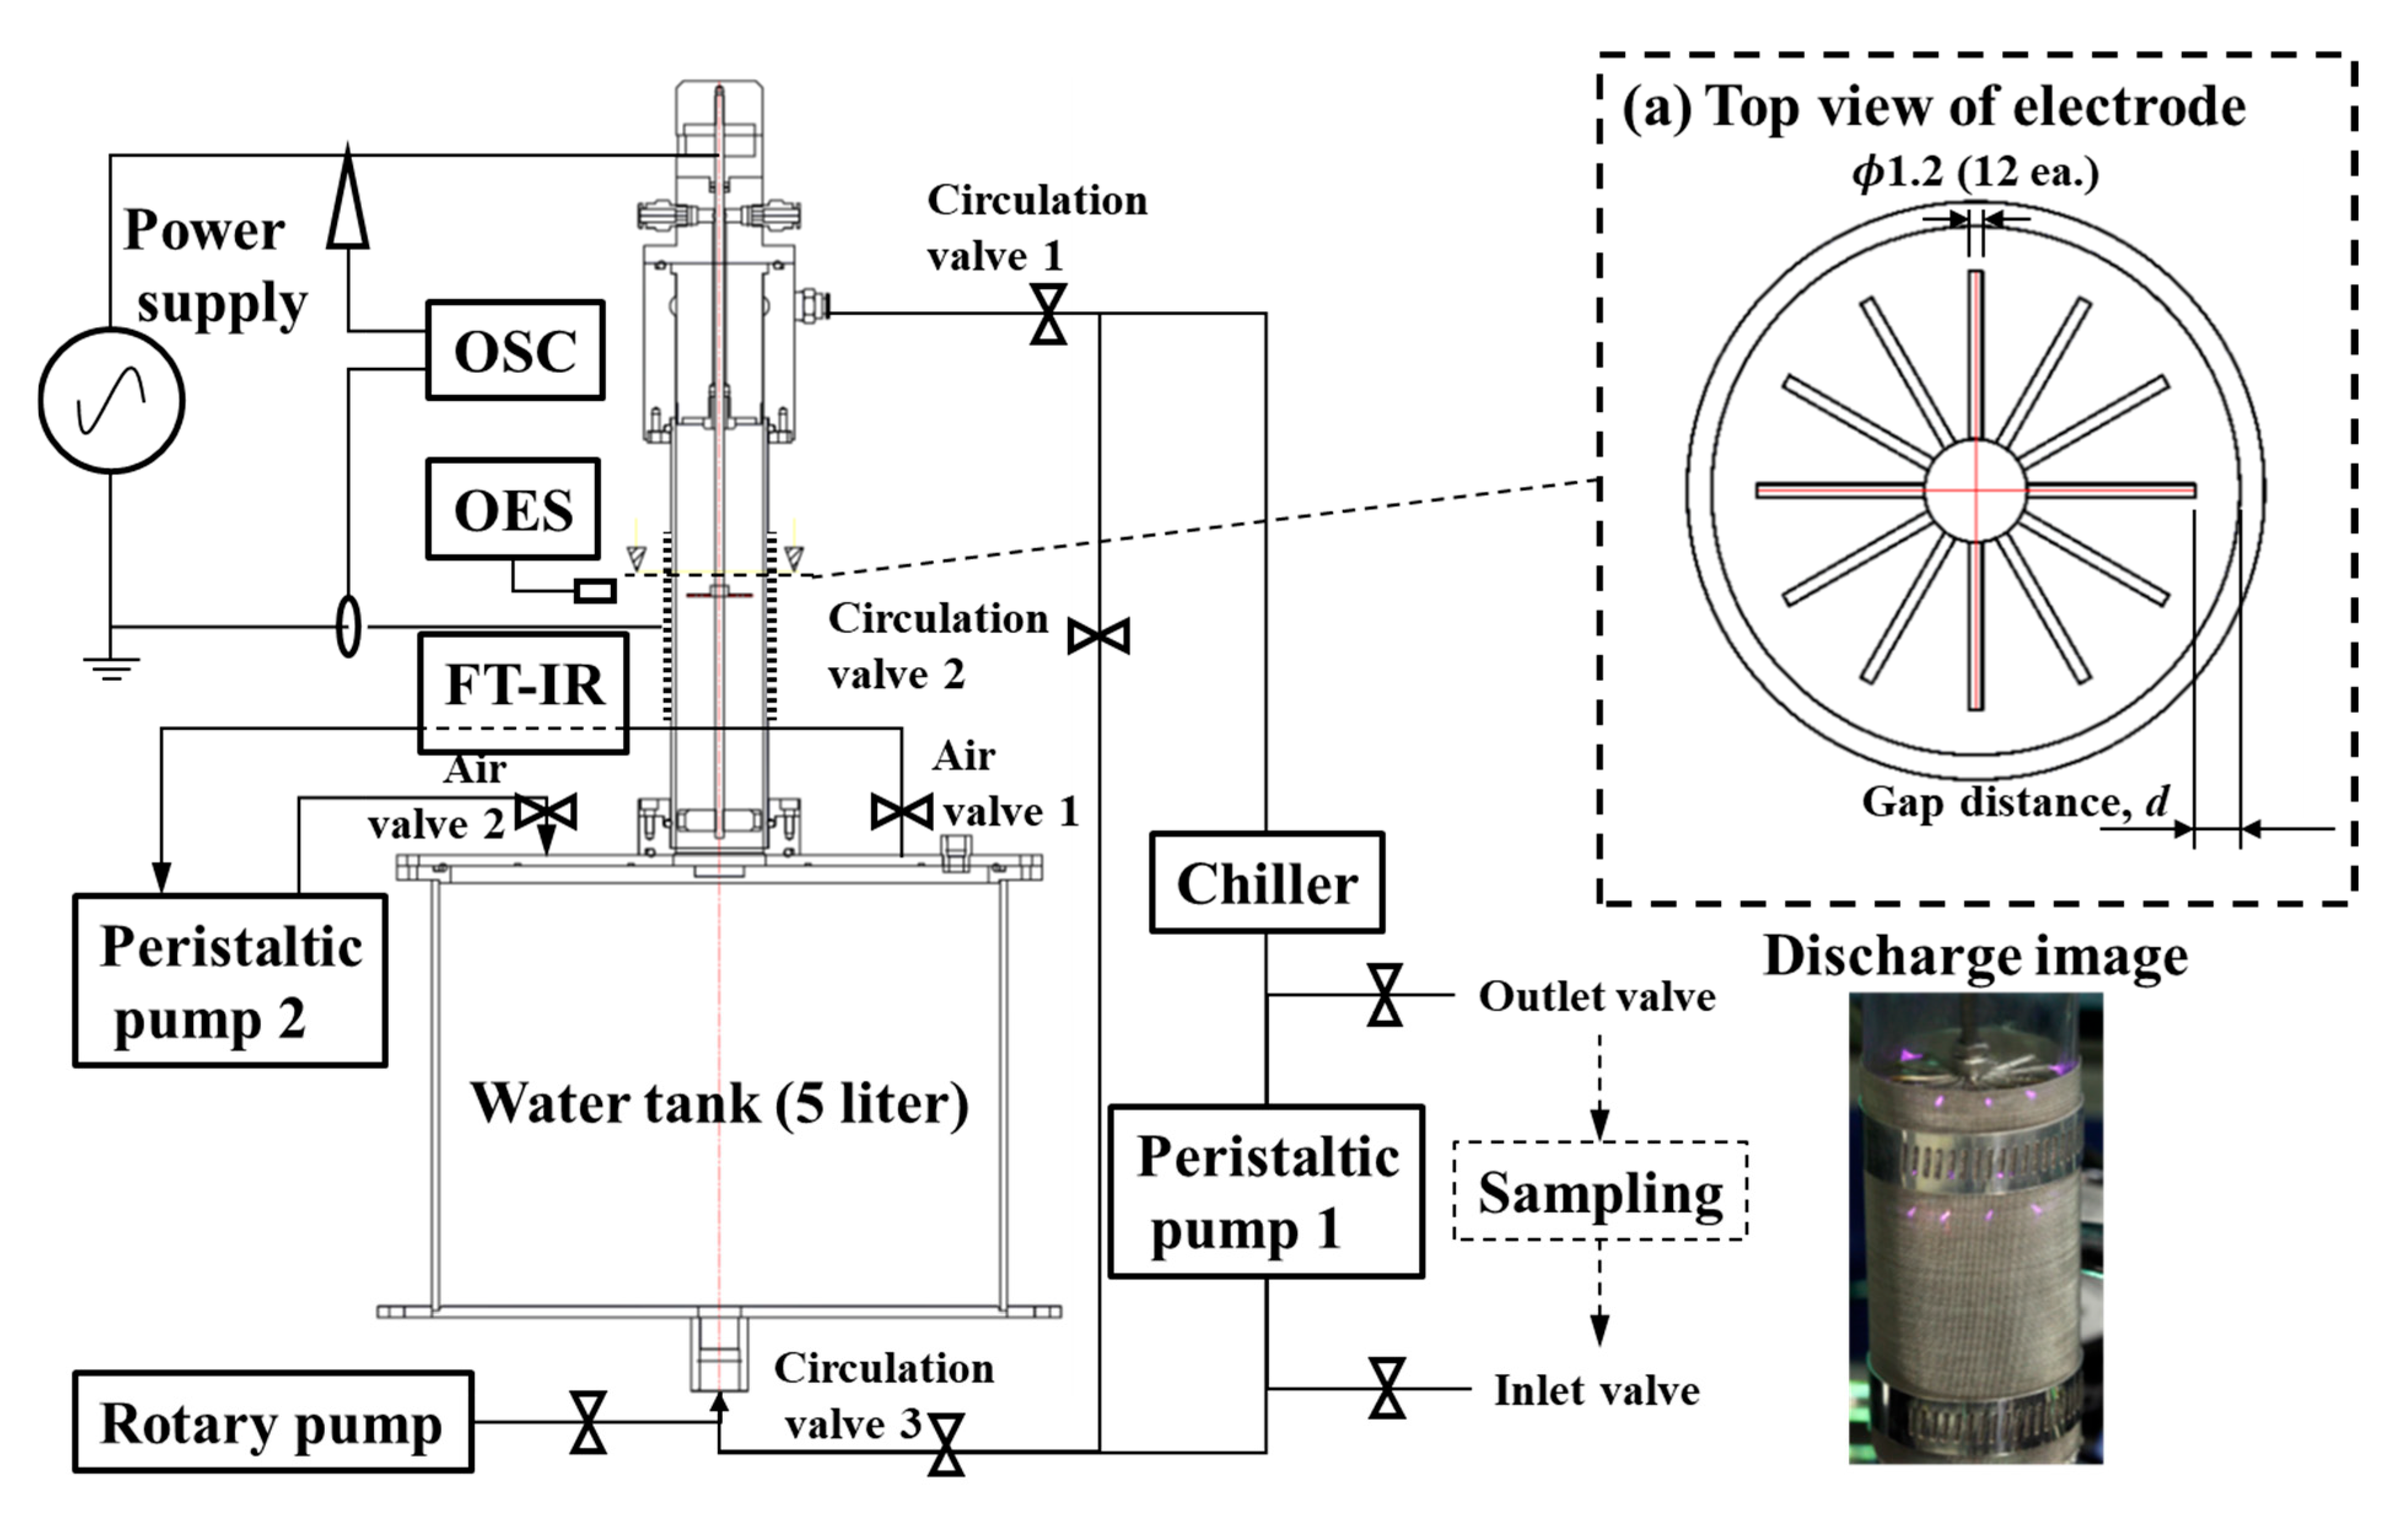
The experimental setup is shown in Figure 1. Detailed descriptions of the setup and procedures are provided in our previous publication [13]. The reactor consisted of a quartz tube (ID: 41 mm, OD: 45 mm) with three stainless steel spoke-type electrodes (12 pins per spoke, radius 1.2 mm). The gap between the electrode end and the quartz tube inner wall, d in Figure 1, is 12, 13, and 14 mm. A 10 cm wide stainless steel mesh was wound around the quartz tube and used as the ground electrode. Before the experiment, we evacuated the chamber to 500 Torr using the rotary pump to remove the impurities and then brought it back to atmospheric pressure with ultrapure water and ambient air. During treatment, 600 mL of water was circulated using a peristaltic pump (LongerPump, WT600–2 J) at 3 slpm through a 5 L reservoir, with tangential injection along the inner wall to form a thin liquid film. Note the two liquid circulation paths. This reactor is designed for multiple discharge conditions, for example, flowing water like this experiment or pin-to-quartz discharge. The circulation value is 1–3 for circulation, cleaning, and exchanging the water without opening the tube cover.
Plasma was generated by applying 0.2 kW at 14.3 kHz (EESYS, AP150-20-02). The optical emission spectra were acquired with a fiber-coupled spectrometer (Teledyne Princeton Instruments, IsoPlane 320, grating i3-030-300-P with wavelength resolution 0.05 nm). Optical emission spectra were used to extract N2 vibrational (Tvib) and rotational (Trot) temperatures following the band-fitting procedures described in our previous work [13]. In brief, the N2 second–positive band envelope was fitted to obtain Tvib, and the resolved rotational structure was fitted to estimate Trot. Spectroscopic measurements were acquired at a coarser temporal resolution, 12 samples per discharge condition, while FTIR H2O2 absorbance was recorded at a higher temporal resolution, ~180 samples per discharge condition. To quantitatively compare gas-phase diagnostics and liquid-phase H2O2, we aligned the datasets using nearest-time matching: for each spectroscopic timestamp, we selected the closest FTIR H2O2 measurement in time. To quantify linear association, we computed the Pearson correlation coefficient (r) and two-tailed p-value for each condition. Pearson r ranges from −1 (perfect anticorrelation) to +1 (perfect correlation); in this study we note that with n = 12 paired spectroscopic–chemical points per condition the critical |r| for two-tailed significance at α = 0.05 is approximately 0.576; hence correlations with |r| ≥ 0.58 and p < 0.05 indicate statistically significant linear association under our sampling scheme. Because correlation does not imply causation–and because the spectroscopic sampling is sparser than the chemical sampling–we treat Pearson r as an indicator of association (trend) rather than definitive proof of mechanistic causality.
PTW samples were periodically collected (<10% of total volume) for analysis using the outlet and inlet values. The pH and electrical conductivity were measured using the pH meter (Elmetron, CX-50, Zabrze, Poland). The temperature and ion concentration in the PTW are monitored by using a thermocouple gauge (Thermolyne, Series589 PM20700, Thermo Fisher Scientific, Seoul, Republic of Korea) and ion chromatography (Thermo Dionex, ICS-2100, Thermo Fisher Scientific, Seoul, Republic of Korea), respectively.
The air in the chamber is circulated to the FT-IR (Bruker, Invenio) to monitor the H2O2 absorption spectrum. The reproducibility was confirmed by repeating all measurements three times. A global plasma-chemistry model coupled with a 3D Fluent® flow solver was implemented to capture species kinetics and thermal–flow interactions. The global model employed in this study follows the framework of Yi et al., which divides the plasma–liquid system into three coupled regions (discharge layer, afterglow layer, and bulk volume) [16]. This model has been validated against FTIR measurements of plasma-treated water, demonstrating accurate reproduction of RONS concentrations under similar humid-air discharge conditions. Therefore, it provides a reliable basis for interpreting the non-linear trends in H2O2 production observed in the present work.

3. Results and Discussion

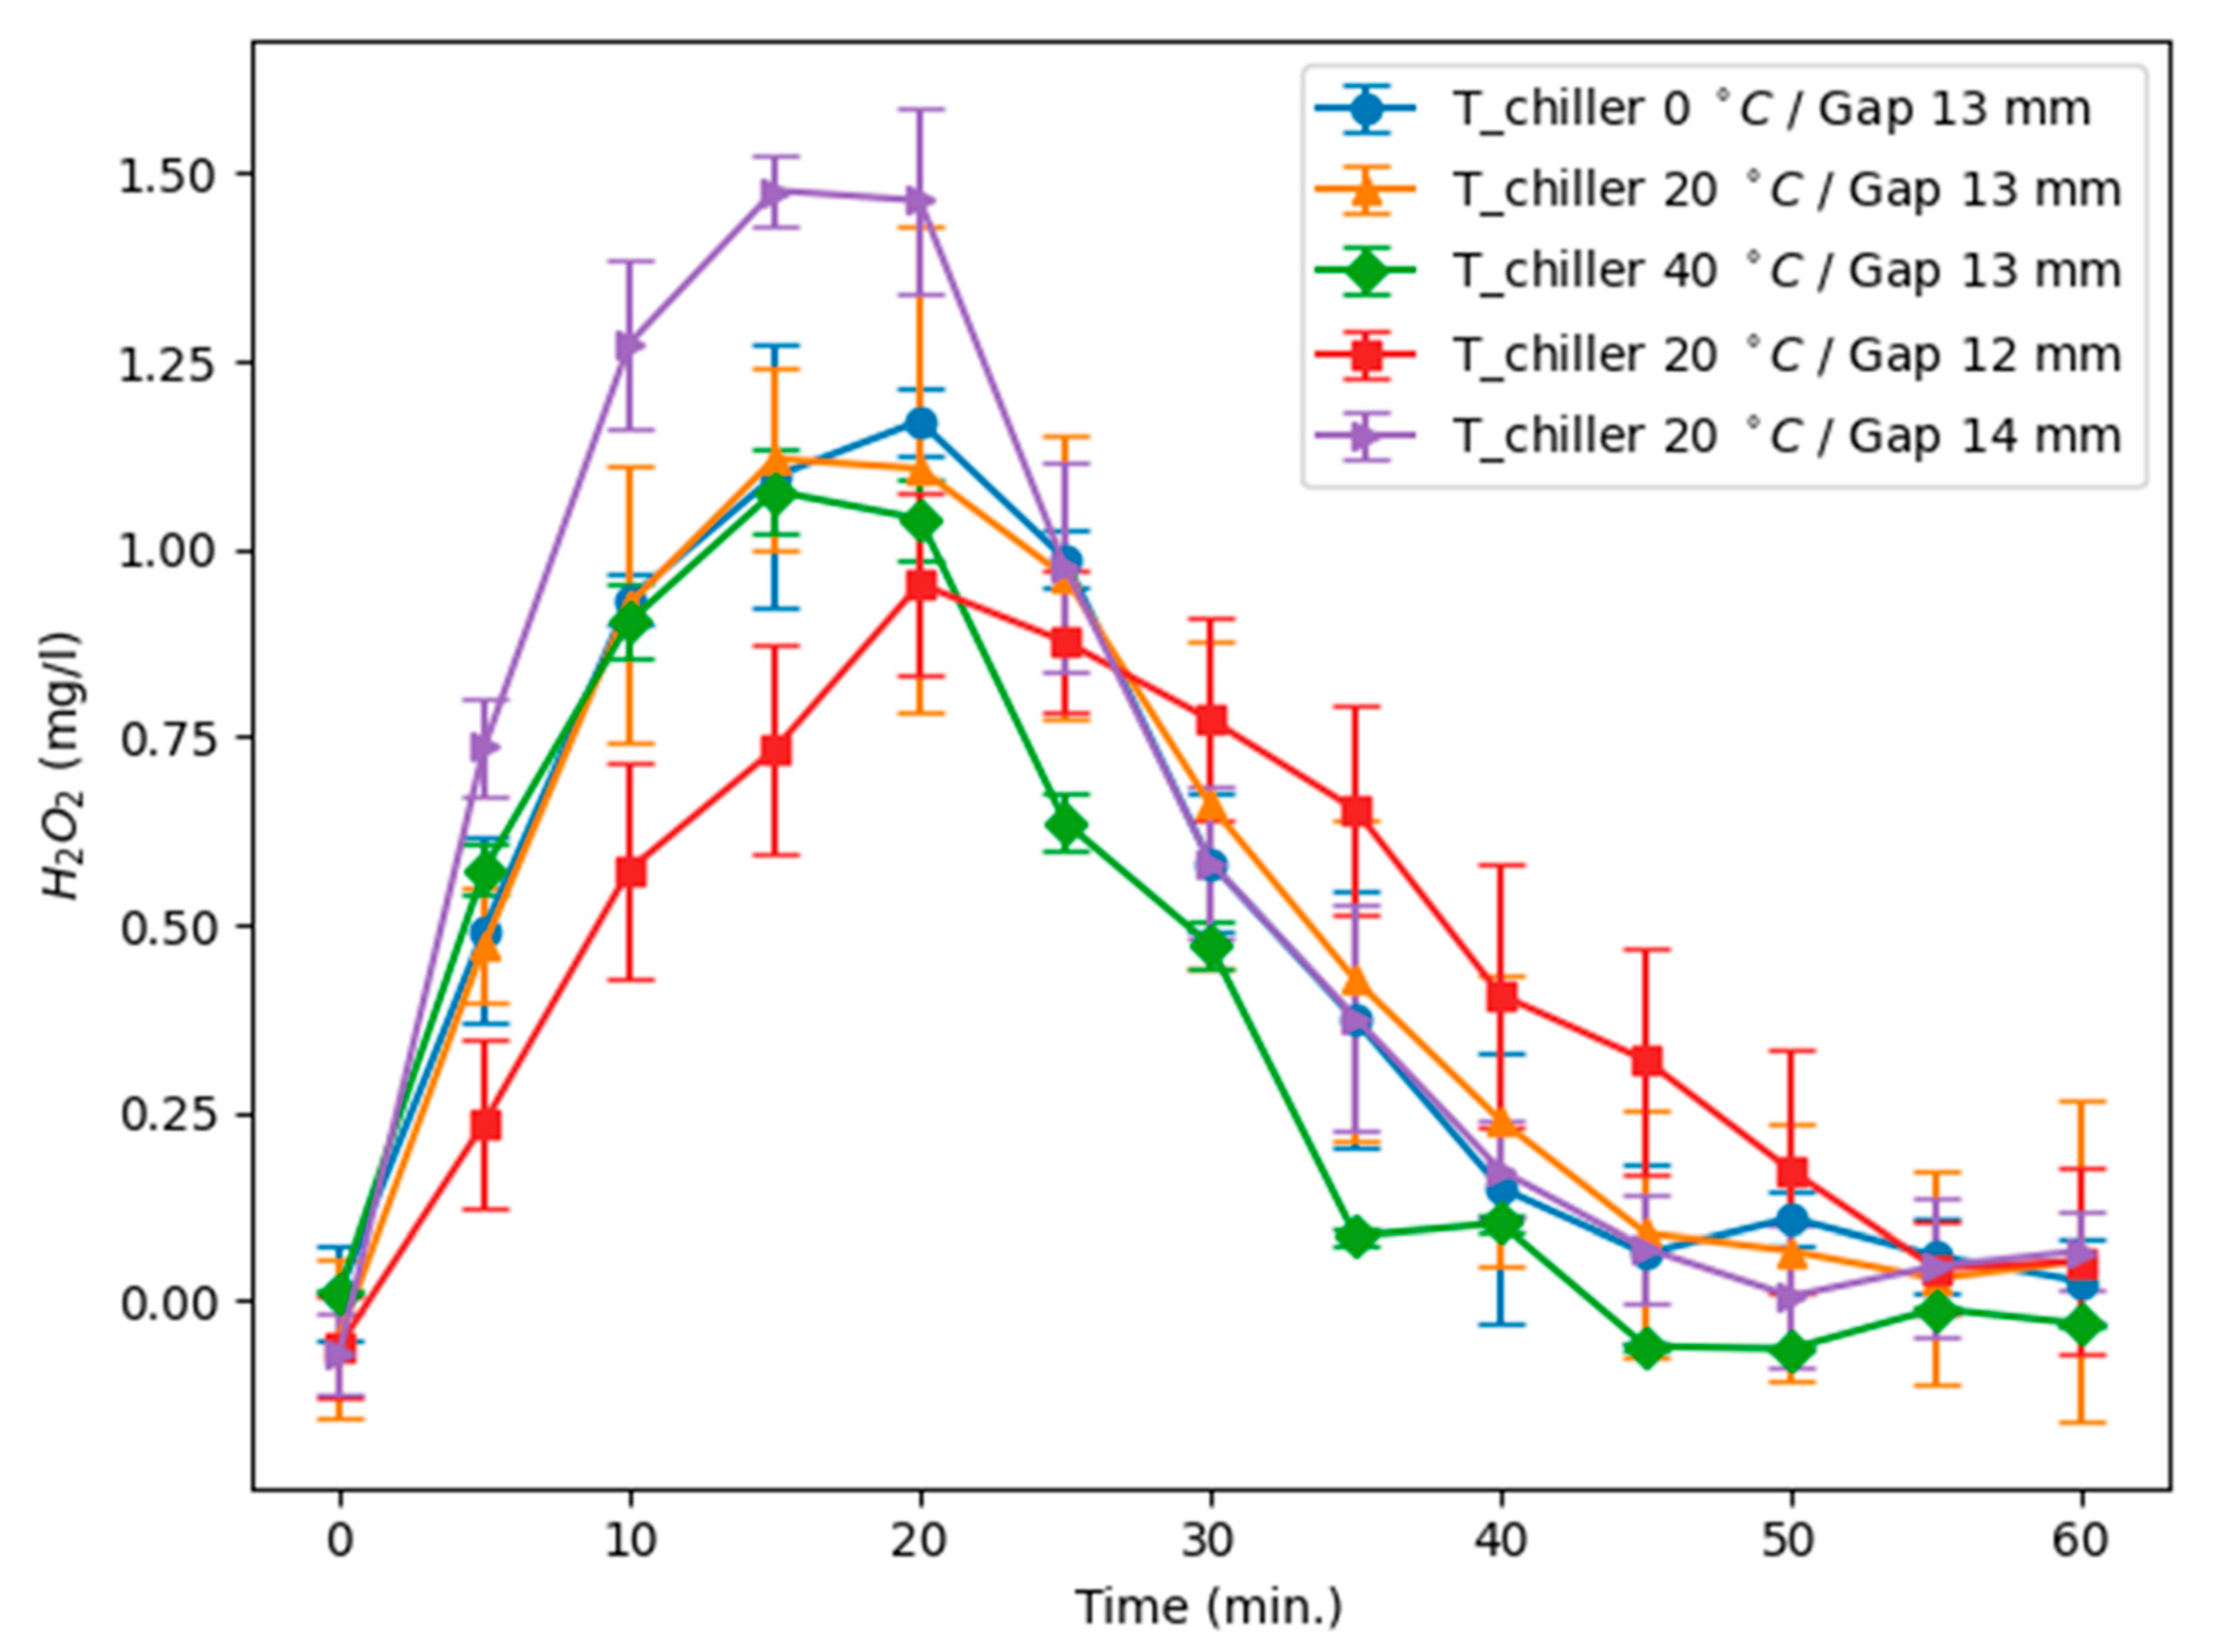
The experiments were carried out on a pin-to-water (PTW) discharge operating at 14.3 kHz and 0.2 kW, with electrode to quartz wall distance of 12, 13, and 14 mm and chiller setpoints of 0, 20, and 40 °C; the full apparatus is shown in Figure 1. Across all tested conditions, the key, reproducible observation is that H2O2 concentration in the treated water does not increase monotonically with treatment time. Instead, the concentration rises rapidly during an initial period and then falls after reaching a clear maximum. Representative time traces in Figure 2 show that H2O2 typically attains its peak within ~15–25 min and declines over a longer interval (roughly 35–45 min under our conditions). This non-monotonic behavior was observed for every tested geometry and thermal setpoint and was reproduced in triplicate for each condition, establishing it as a systematic feature of these PTW discharges.

3.1. Time-Resolved Gas Phase Characteristics from Optical Diagnostics

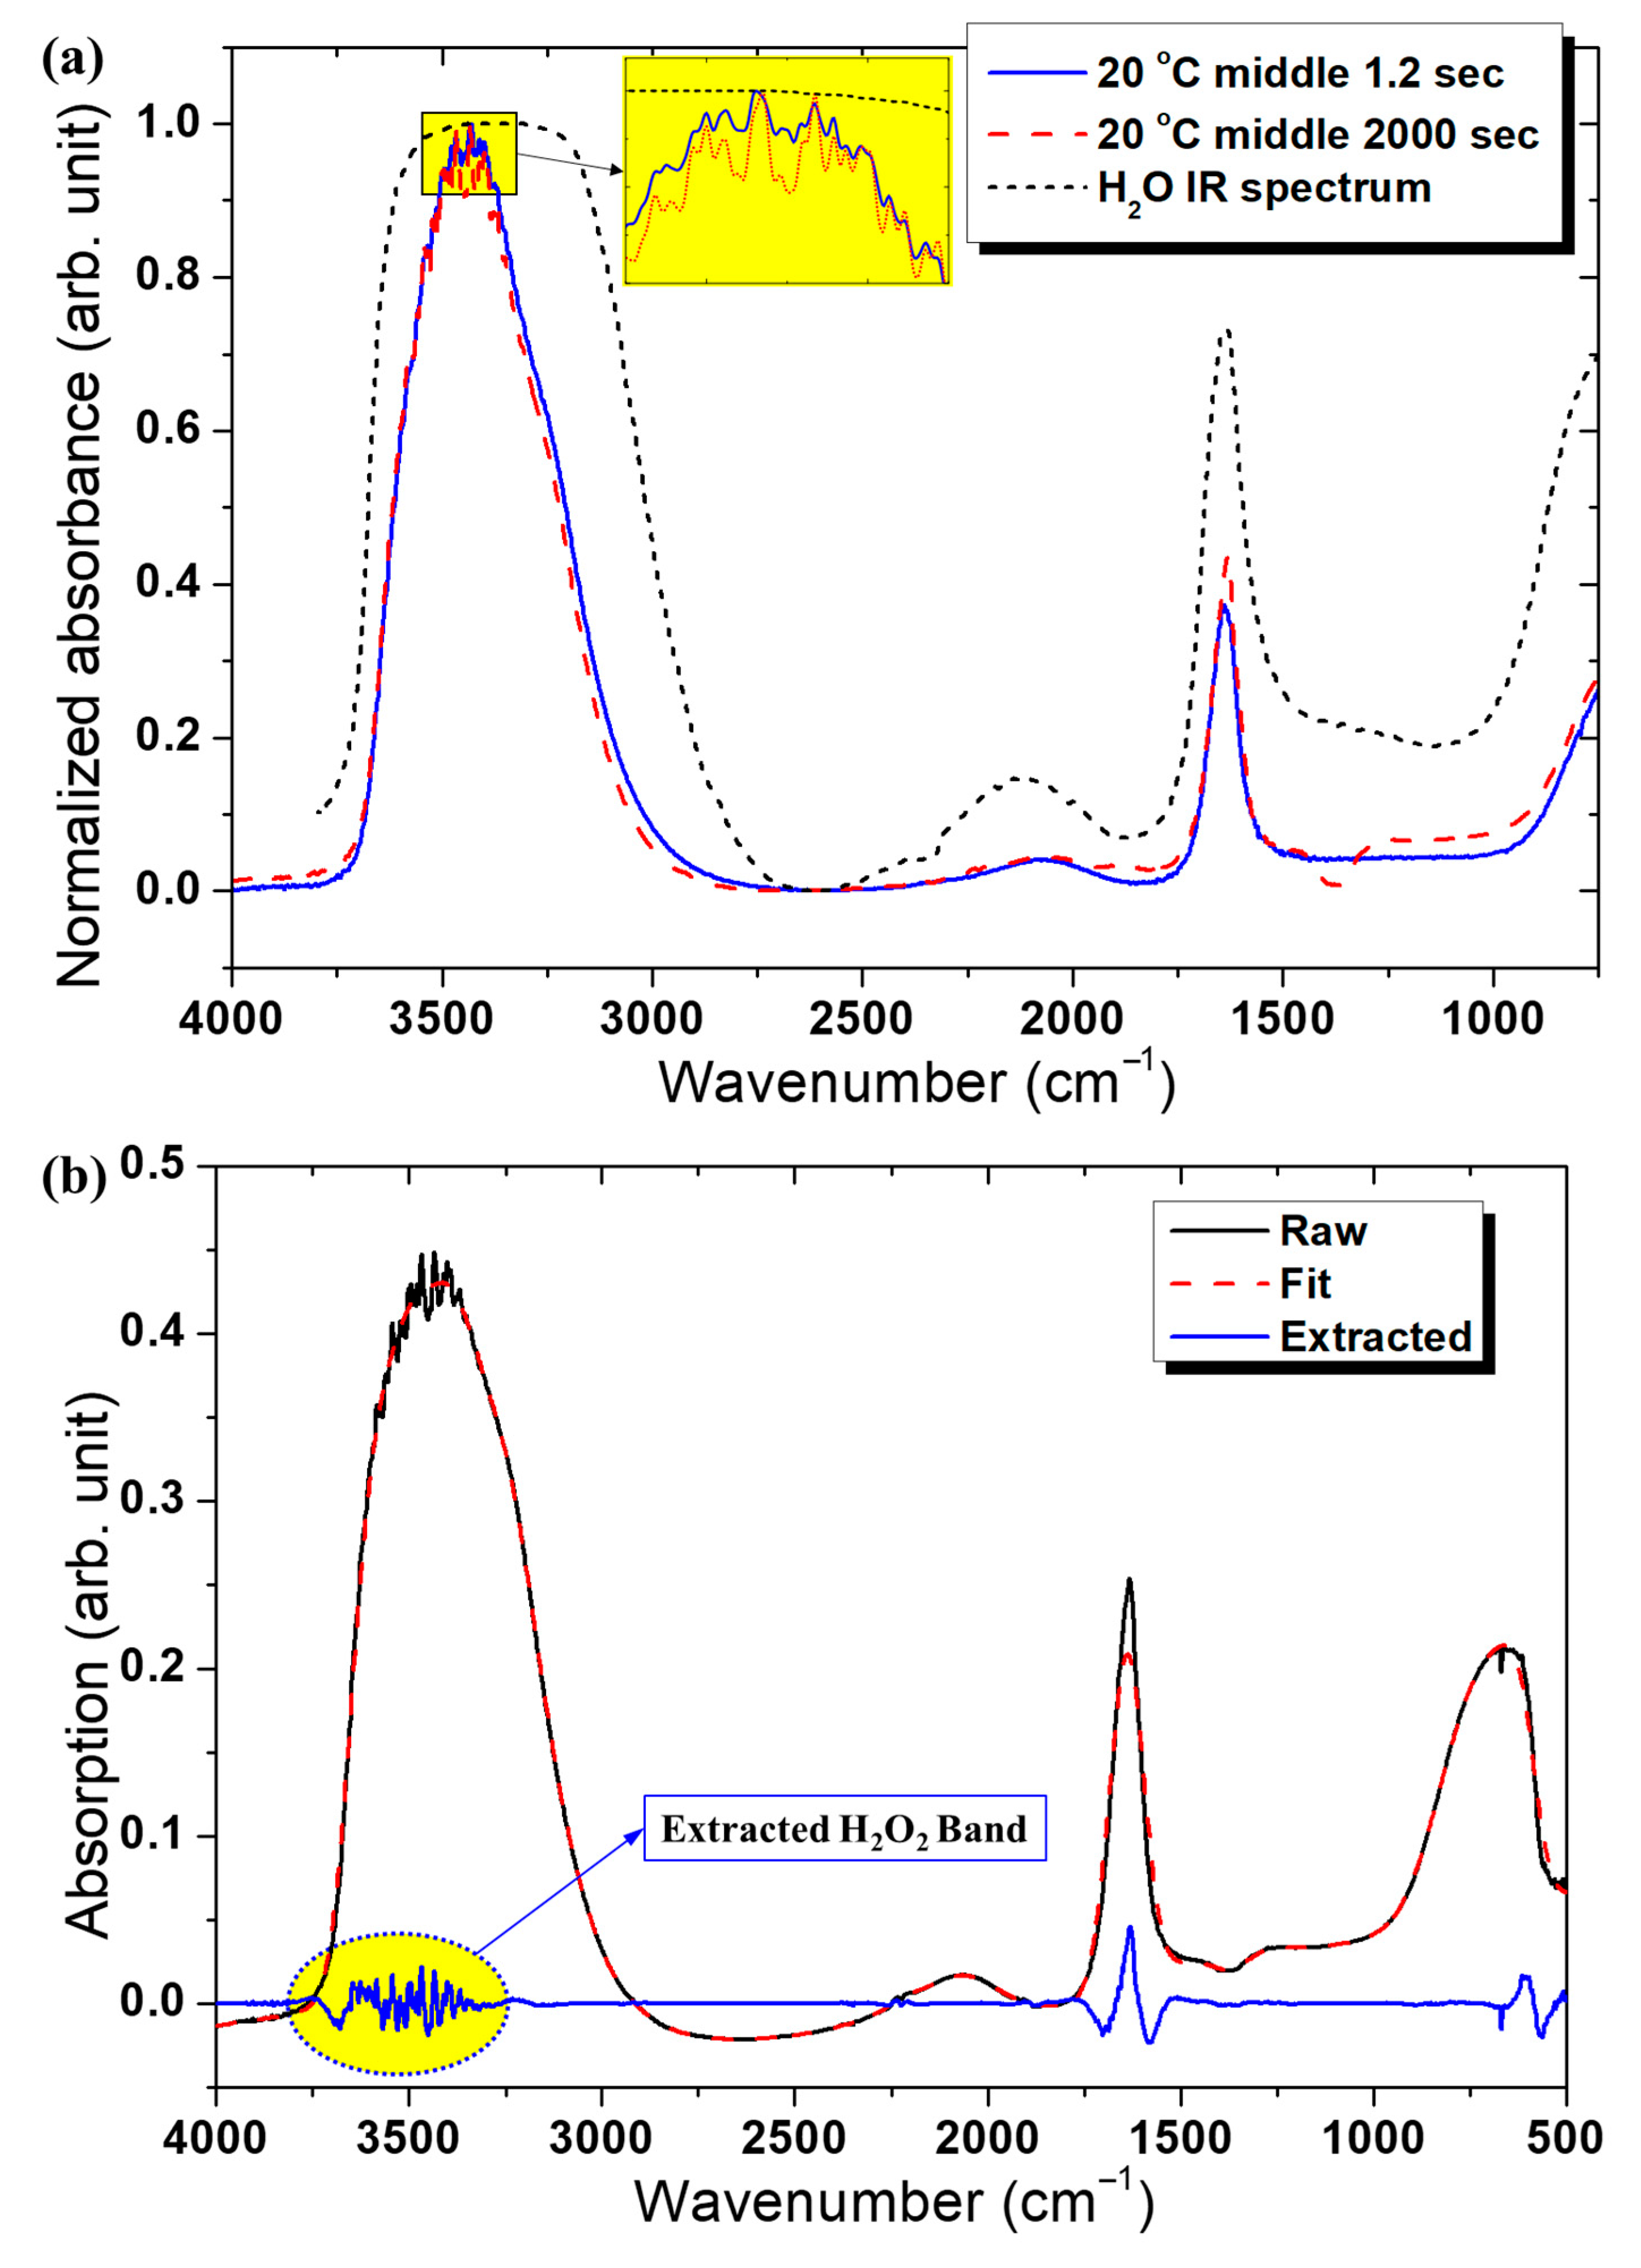
To determine whether the drop in liquid H2O2 reflects changes in gas-phase production or a post-transfer liquid loss, we acquired time-resolved FTIR spectra of the discharge effluent. Figure 3 illustrates the spectral evolution. Gas-phase H2O2 was quantified from FTIR absorbance near 3500 cm−1 after subtraction of the dominant H2O vibrational envelope. Baseline correction employed a third-order polynomial fit across adjacent continuum windows; calibration was accomplished using prepared H2O2 reference gas mixtures. The reported FTIR intensities represent integrated absorbance within the 3490–3510 cm−1 band, and the limit of detection under our optical path was estimated at 0.01 mg L−1 (determined as 3σ of the baseline noise). After subtraction of the dominant H2O background, a weak but identifiable H2O2 absorption band around 3500 cm−1 [17] becomes apparent and increases in intensity during the early operation period. Crucially, the FTIR H2O2 band shows an inflection and subsequent decrease at roughly the same time that the liquid-phase H2O2 peaks (~30 min), demonstrating that the reduction in aqueous H2O2 is mirrored by a decline in gas-phase H2O2 production rather than by a purely aqueous decomposition process. In Figure 3c,d, the main absorption bands corresponding to H2O2 and unfiltered H2O have been identified for clarity. The discontinuities observed at approximately 25 min, 31–35 min, and 54 min originate from periodic recalibration of the FT-IR spectrometer during long-term measurements, which slightly perturbs the baseline but does not affect the overall spectral trends.
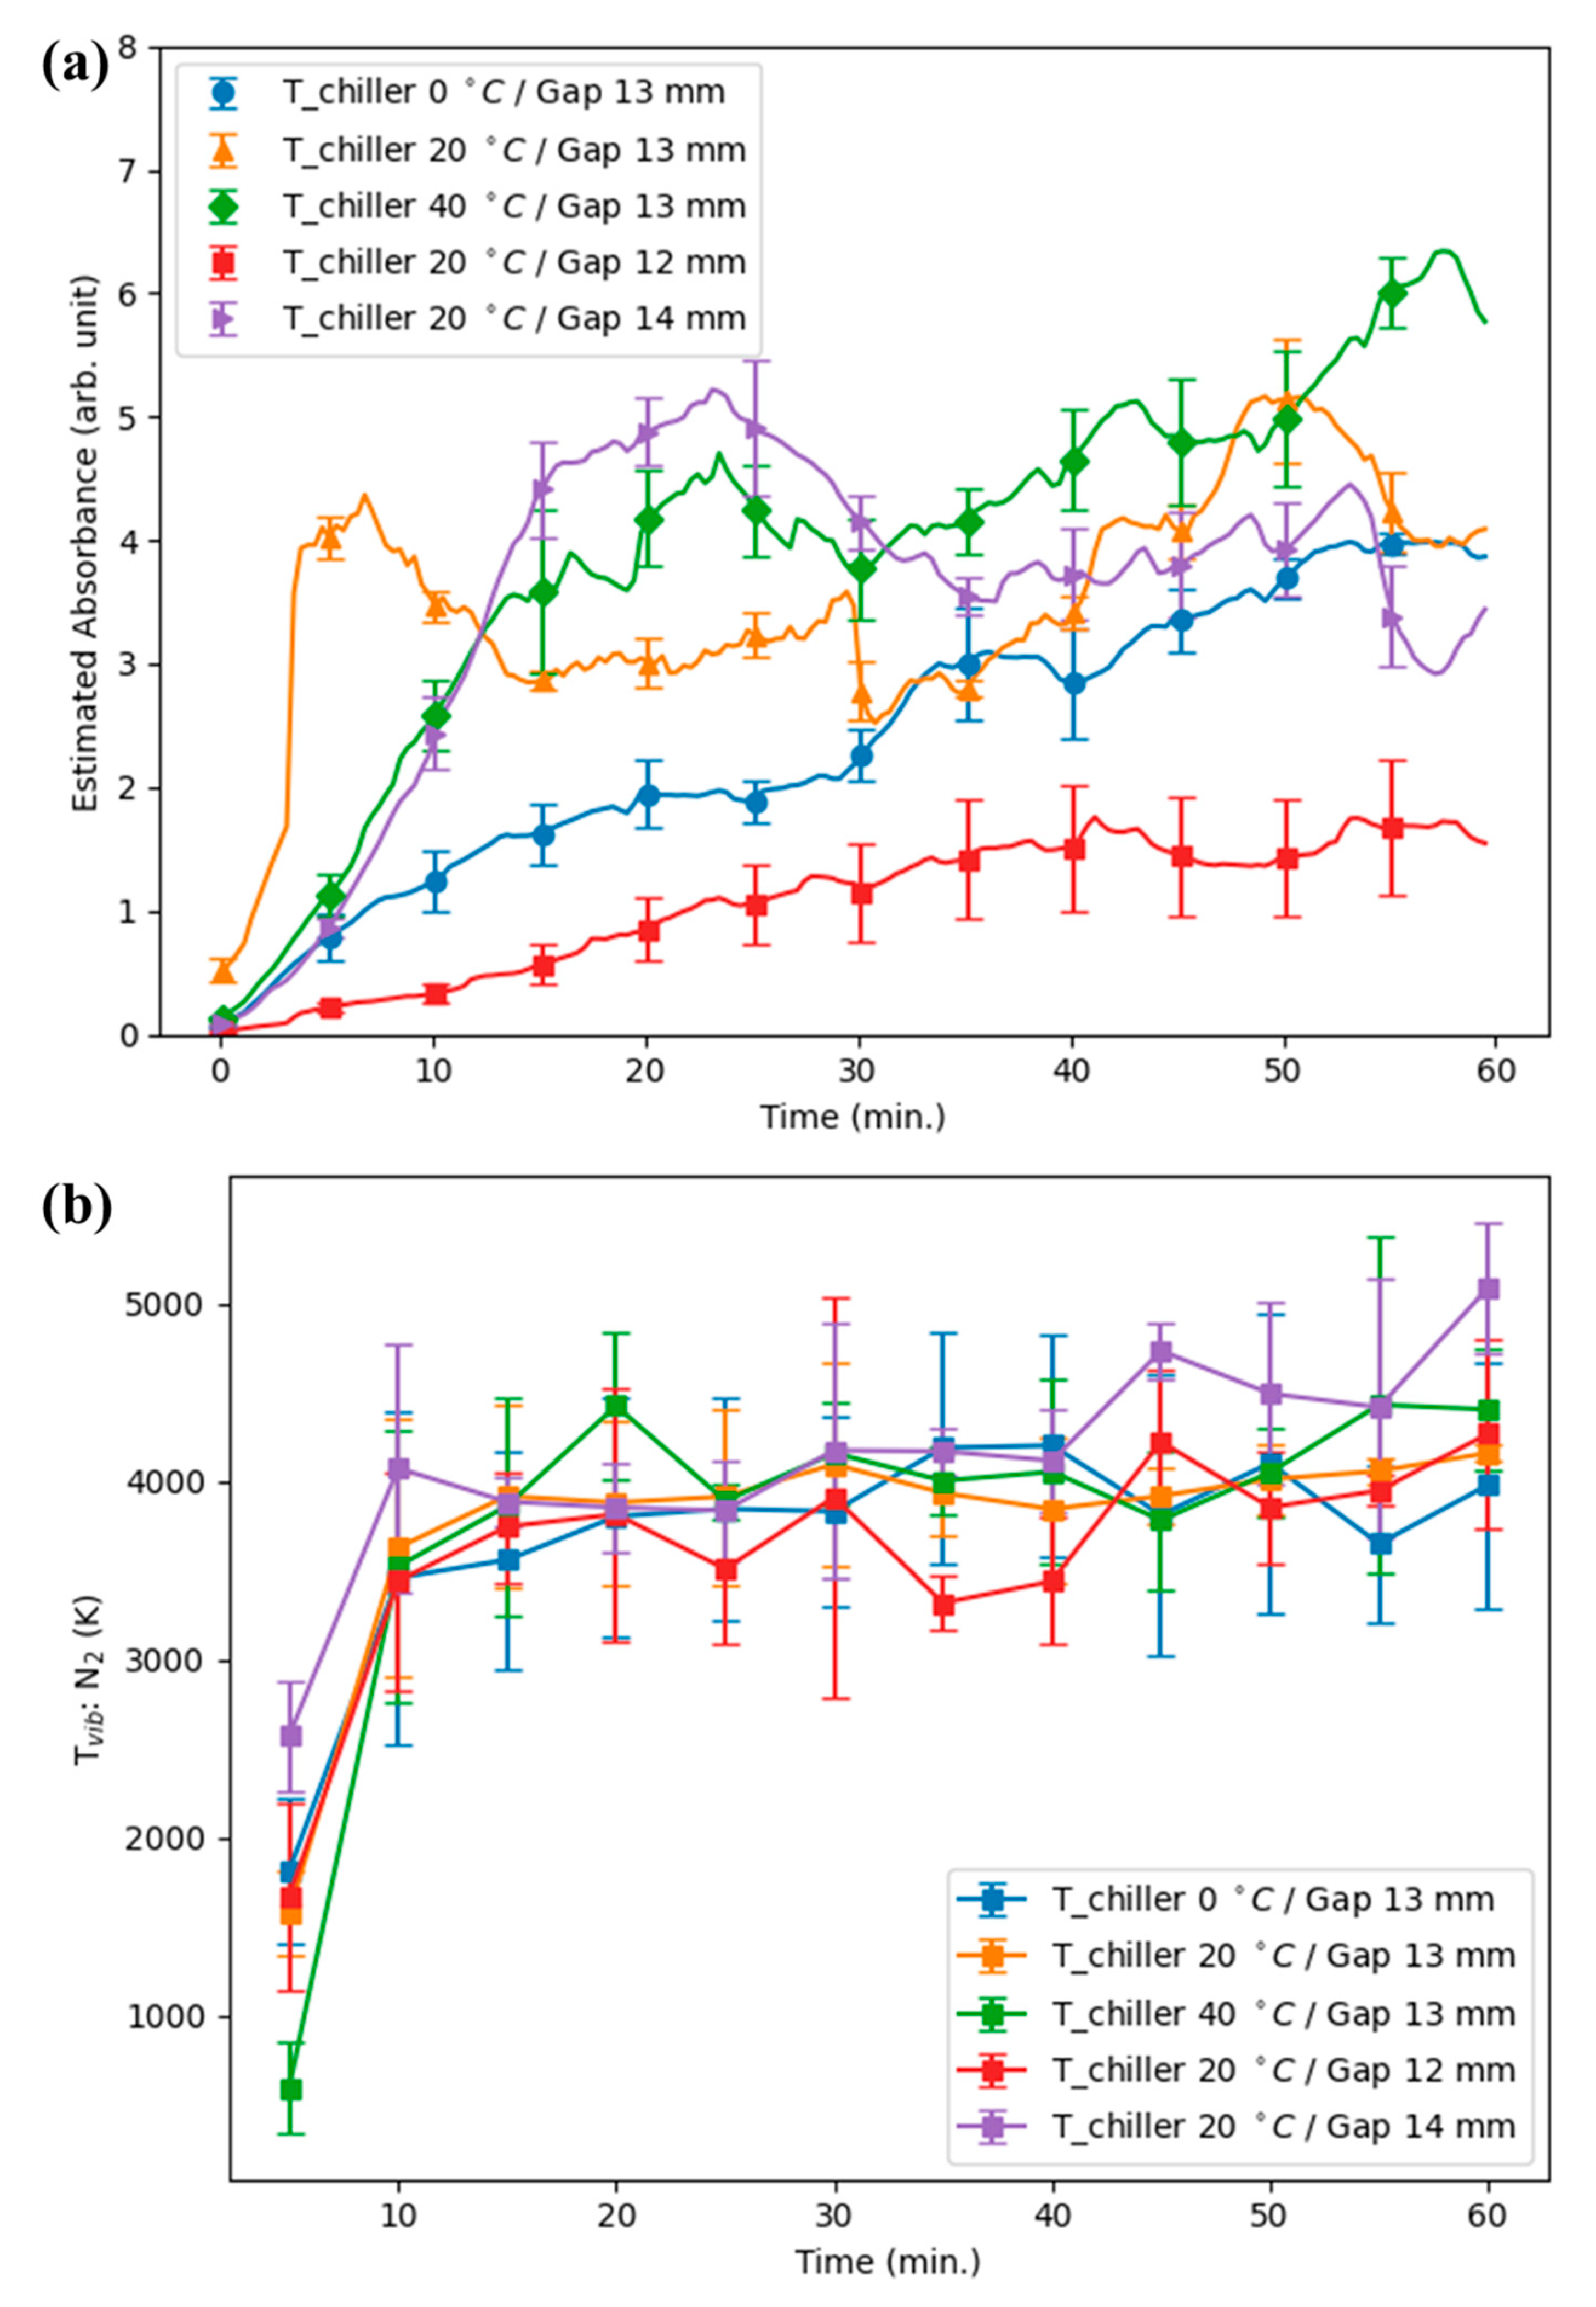
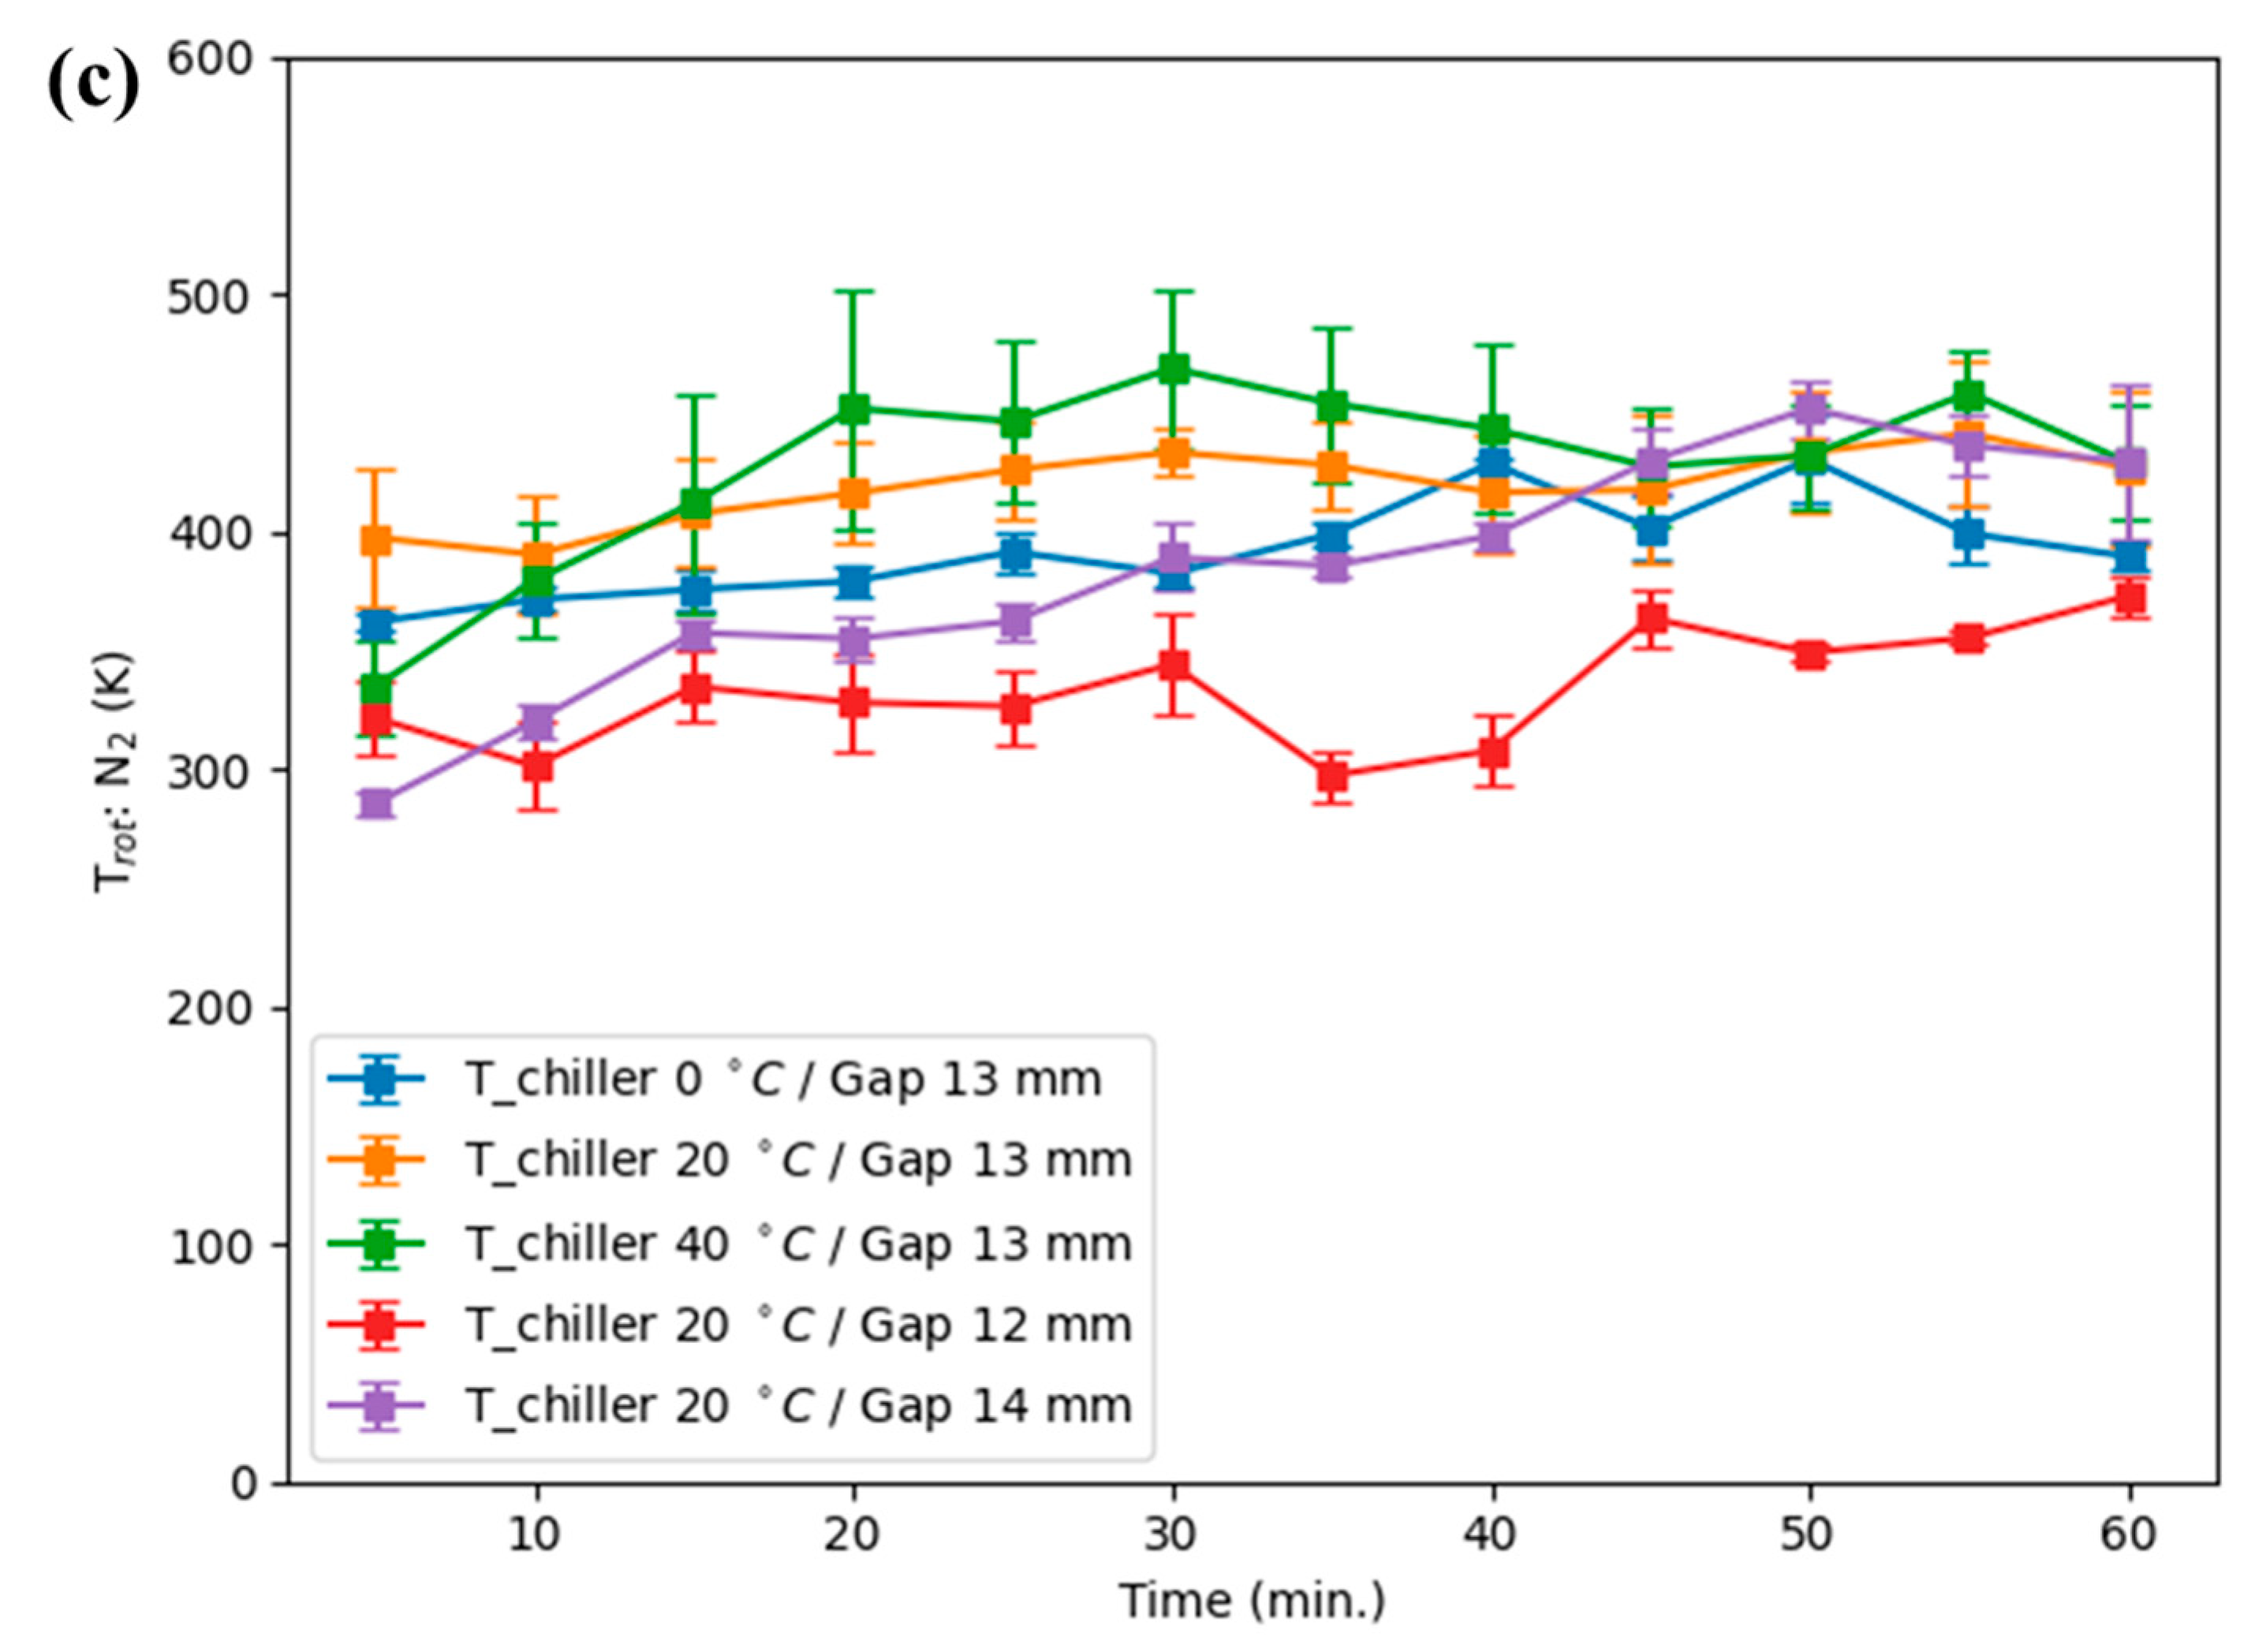
Optical emission spectroscopy (OES) provides the link between plasma state and reactive-species production. Figure 4a shows the time evolution of N2 vibrational temperature (Tvib) extracted from OES [18]: Tvib increases gradually from near 3000 K at ignition to beyond 5500 K with prolonged operation. When H2O2 production begins to decline, Tvib is consistently near ~4900 K (see the overlay and condition panels in Figure 4b,c). Around Tvib~4900 K-where high-ν N2 (ν ≥ 12) becomes significant; the reaction channel between excited N2 and atomic O competes effectively with oxygen-radical recombination, diverting O and OH away from O3 and H2O2 formation and into NO formation, in line with prior reports on mode transitions in humid air discharges [19]. Shorter electrode gaps—i.e., higher local power density—accelerate the Tvib rise and thus bring forward the time of H2O2 suppression. The coincidence of the H2O2 inflection and a characteristic Tvib value across multiple conditions indicates that vibrational excitation of N2 is a robust marker for the plasma-state change that reduces H2O2 yield; this observation is consistent with previous reports linking high N2 vibrational excitation to mode transitions and altered ROS/RNS balance in humid air plasmas [12,13,14].
The vibrational temperature obtained from OES fitting spanned a range of 3000–5000 K (Figure 4). The value of ~4900 K has been inferred from global modeling and from theoretical analysis reported previously [14], and therefore represents an upper bound rather than a directly validated threshold in the present experiments. While this model-based estimate suggests a possible condition for significant changes in plasma–liquid chemistry, our current measurements only confirm the broader 3000–5000 K window. Table 1 reports Pearson correlation coefficients (r) and two-tailed p-values between the nearest-time matched H2O2 absorbance and the spectroscopically fitted temperatures (Tvib and Trot) for each experimental condition (n = 12 matched points per condition). The primary numerical outcomes are reproduced below:
0 °C, 13 mm: r(Tvib, H2O2) = 0.643 (p = 0.024); r(Trot, H2O2) = 0.721 (p = 0.008).
20 °C, 13 mm: r(Tvib, H2O2) = −0.134 (p = 0.679); r(Trot, H2O2) = 0.189 (p = 0.555).
40 °C, 13 mm: r(Tvib, H2O2) = 0.821 (p = 0.001); r(Trot, H2O2) = 0.763 (p = 0.004).
20 °C, 12 mm: r(Tvib, H2O2) = 0.632 (p = 0.027); r(Trot, H2O2) = 0.453 (p = 0.139).
20 °C, 14 mm: r(Tvib, H2O2) = 0.462 (p = 0.131); r(Trot, H2O2) = 0.452 (p = 0.140).
These results show that Tvib exhibits statistically significant positive correlation with H2O2 in several operating conditions (notably 40 °C, 13 mm, 20 °C, 12 mm, and 0 °C, 13 mm), while Trot is statistically significant in some cases (notably 0 °C, 13 mm and 40 °C, 13 mm). The relative importance of Tvib vs. Trot is condition-dependent.
Note that the lowest Tvib values observed in this study (~1000 K) should be interpreted as detection-limited estimates obtained under conditions of weak N2 emission, rather than as representative of the vibrational excitation under typical discharge operation. Similar low-end values have also been reported in the literature: Richard et al. observed Tvib as low as ~1000 K in pin-to-liquid plasma configurations, where plasma–liquid interactions and reduced excitation conditions limit vibrational energy transfer [20], and Shimizu et al. demonstrated vibrational temperatures spanning 1000–4700 K in atmospheric pressure surface micro-discharges, noting that the lower-end values corresponded to regimes of reduced vibrational excitation [14]. Taken together, these findings indicate that ~1000 K values can appear as plausible lower-bound estimates under constrained power density or signal-to-noise conditions, while the operationally relevant regime of our device consistently produces multi-thousand K vibrational excitation, consistent with the broader literature.
The combined quantitative evidence indicates that the decrease in H2O2 observed under prolonged operation is not primarily due to direct thermal decomposition, as Trot values remained in the hundreds of K (well below temperatures for rapid thermal H2O2 breakdown). Instead, rising Tvib–frequently preceding H2O2 decline–appears to mark a plasma-state transition that favors reaction channels (e.g., N2(v) + O → NOx) which divert reactive O and OH away from H2O2 formation. Trot plays a supporting role by modestly increasing collisional rates and transport, but it does not alone account for the observed suppression. Therefore, Tvib is a robust operational marker for plasma-mode change affecting H2O2 yield, while Trot provides complementary information relevant to thermal and transport effects.

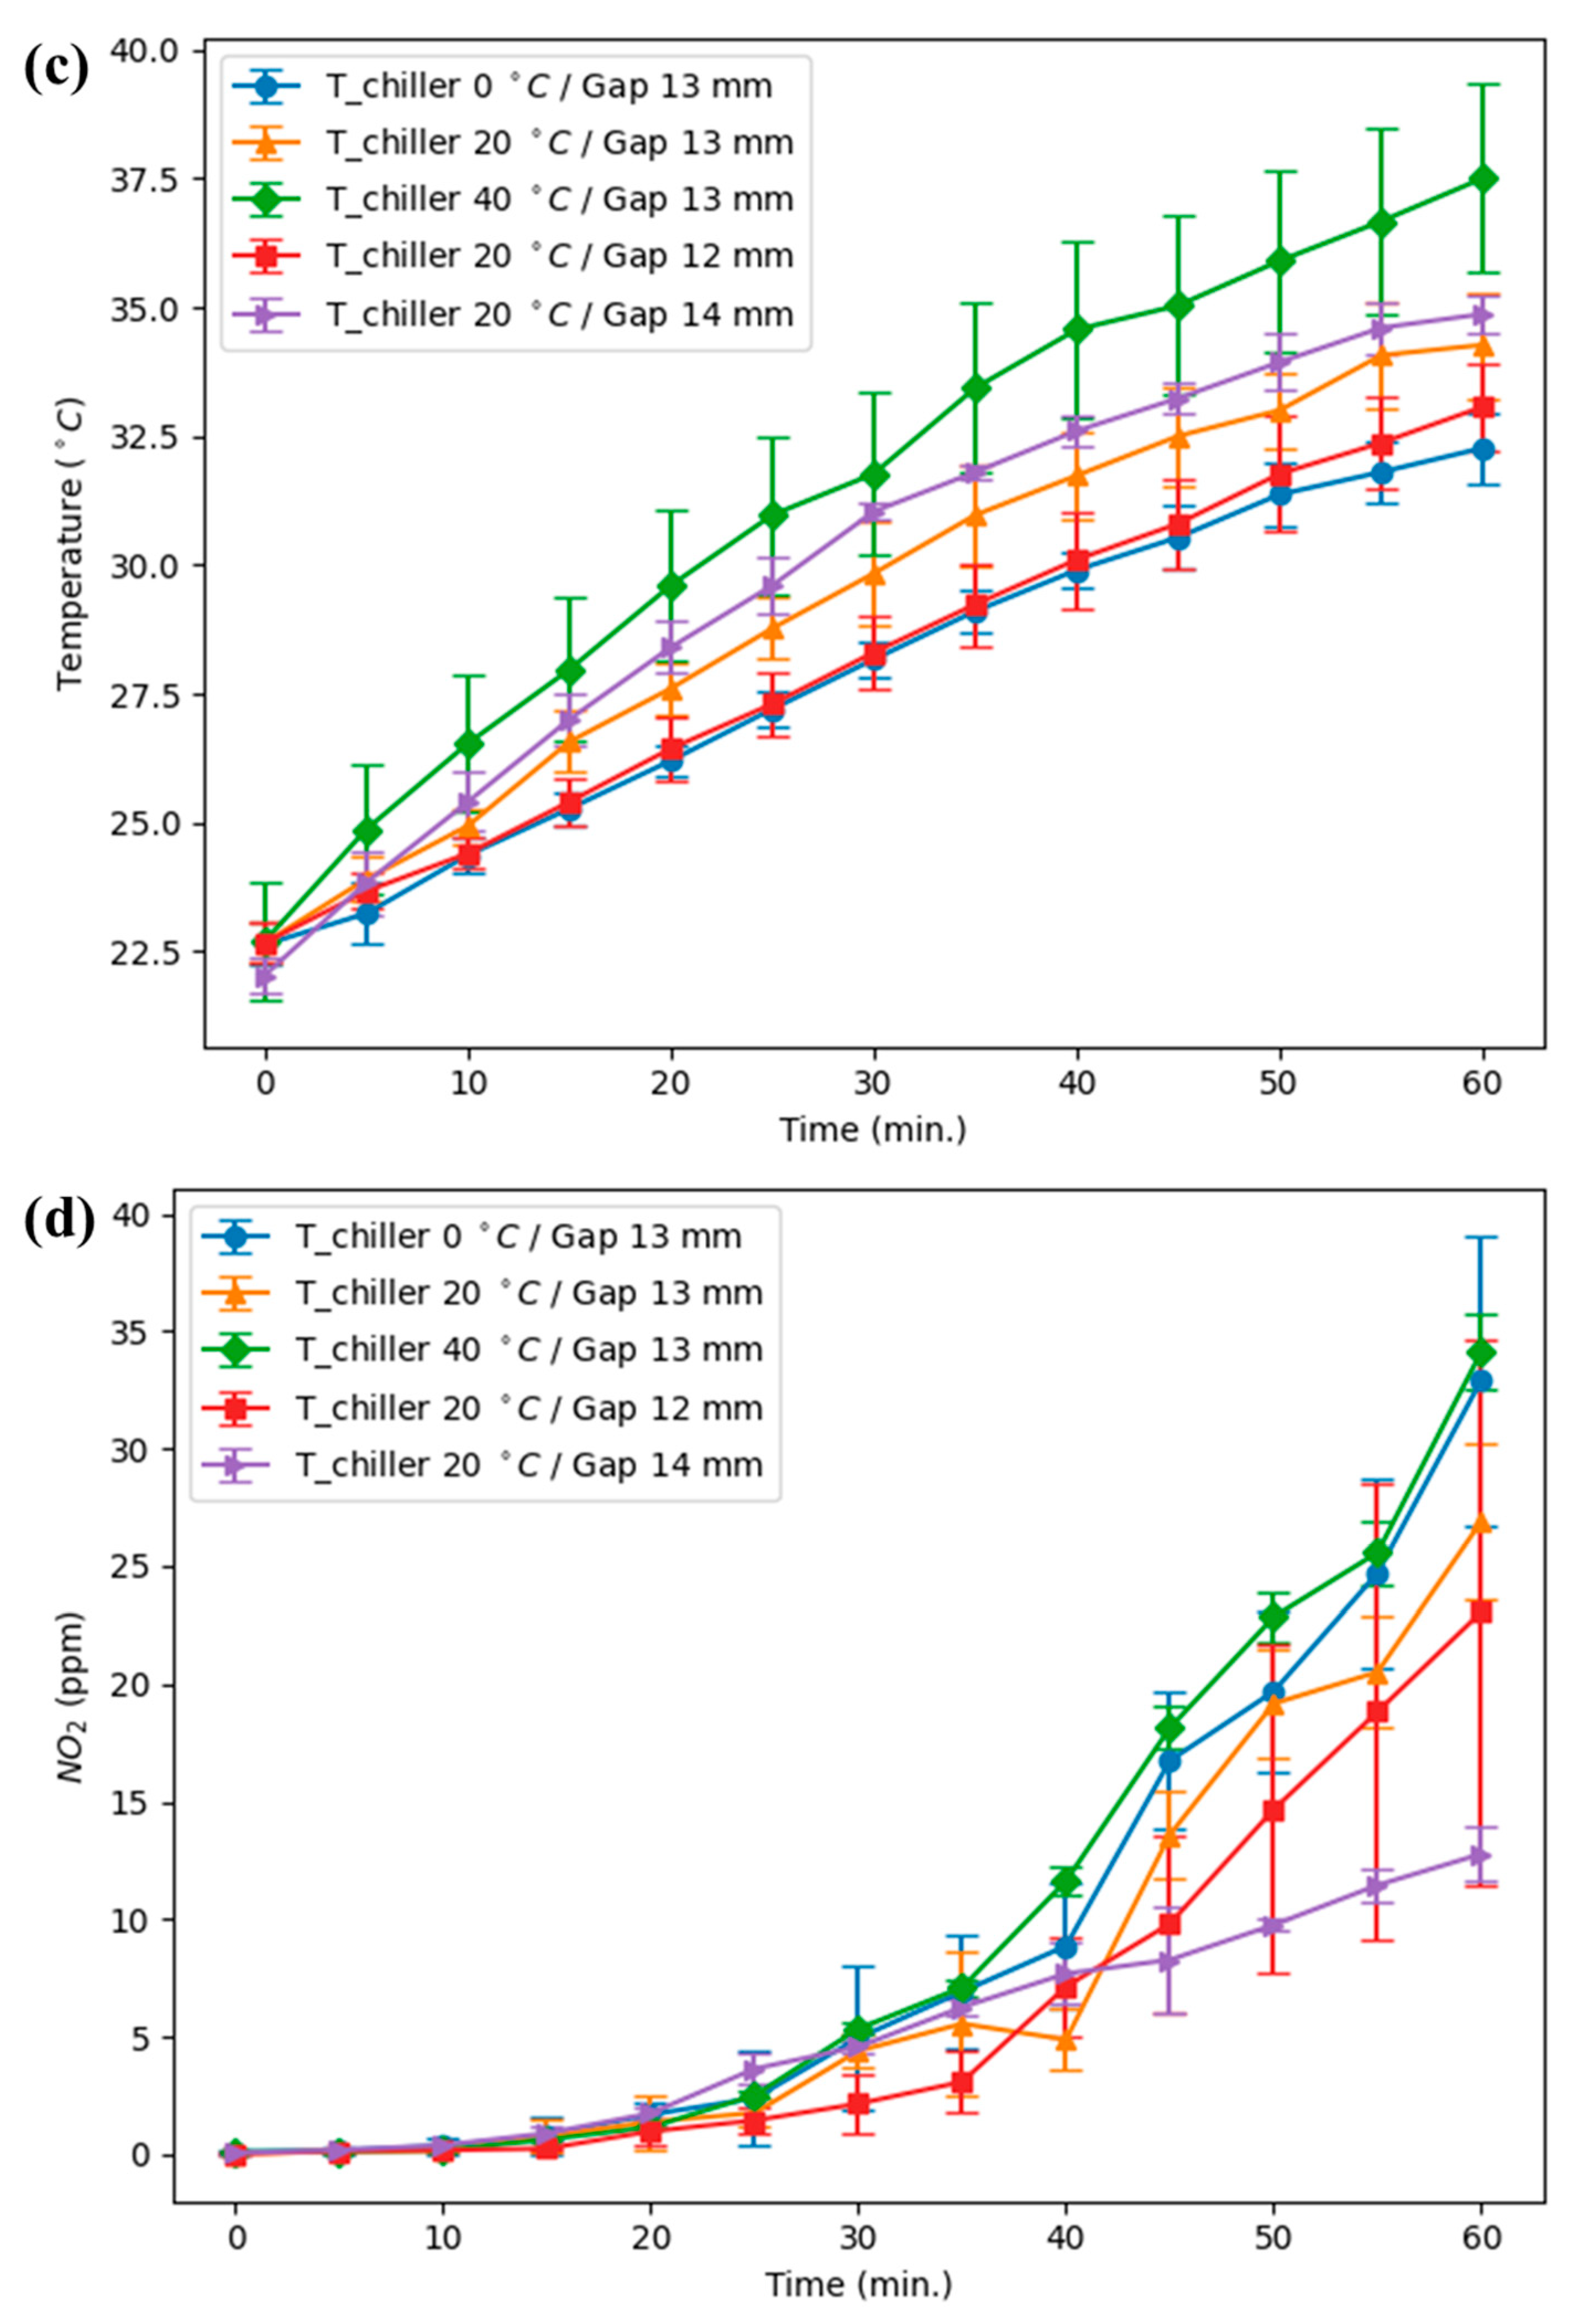
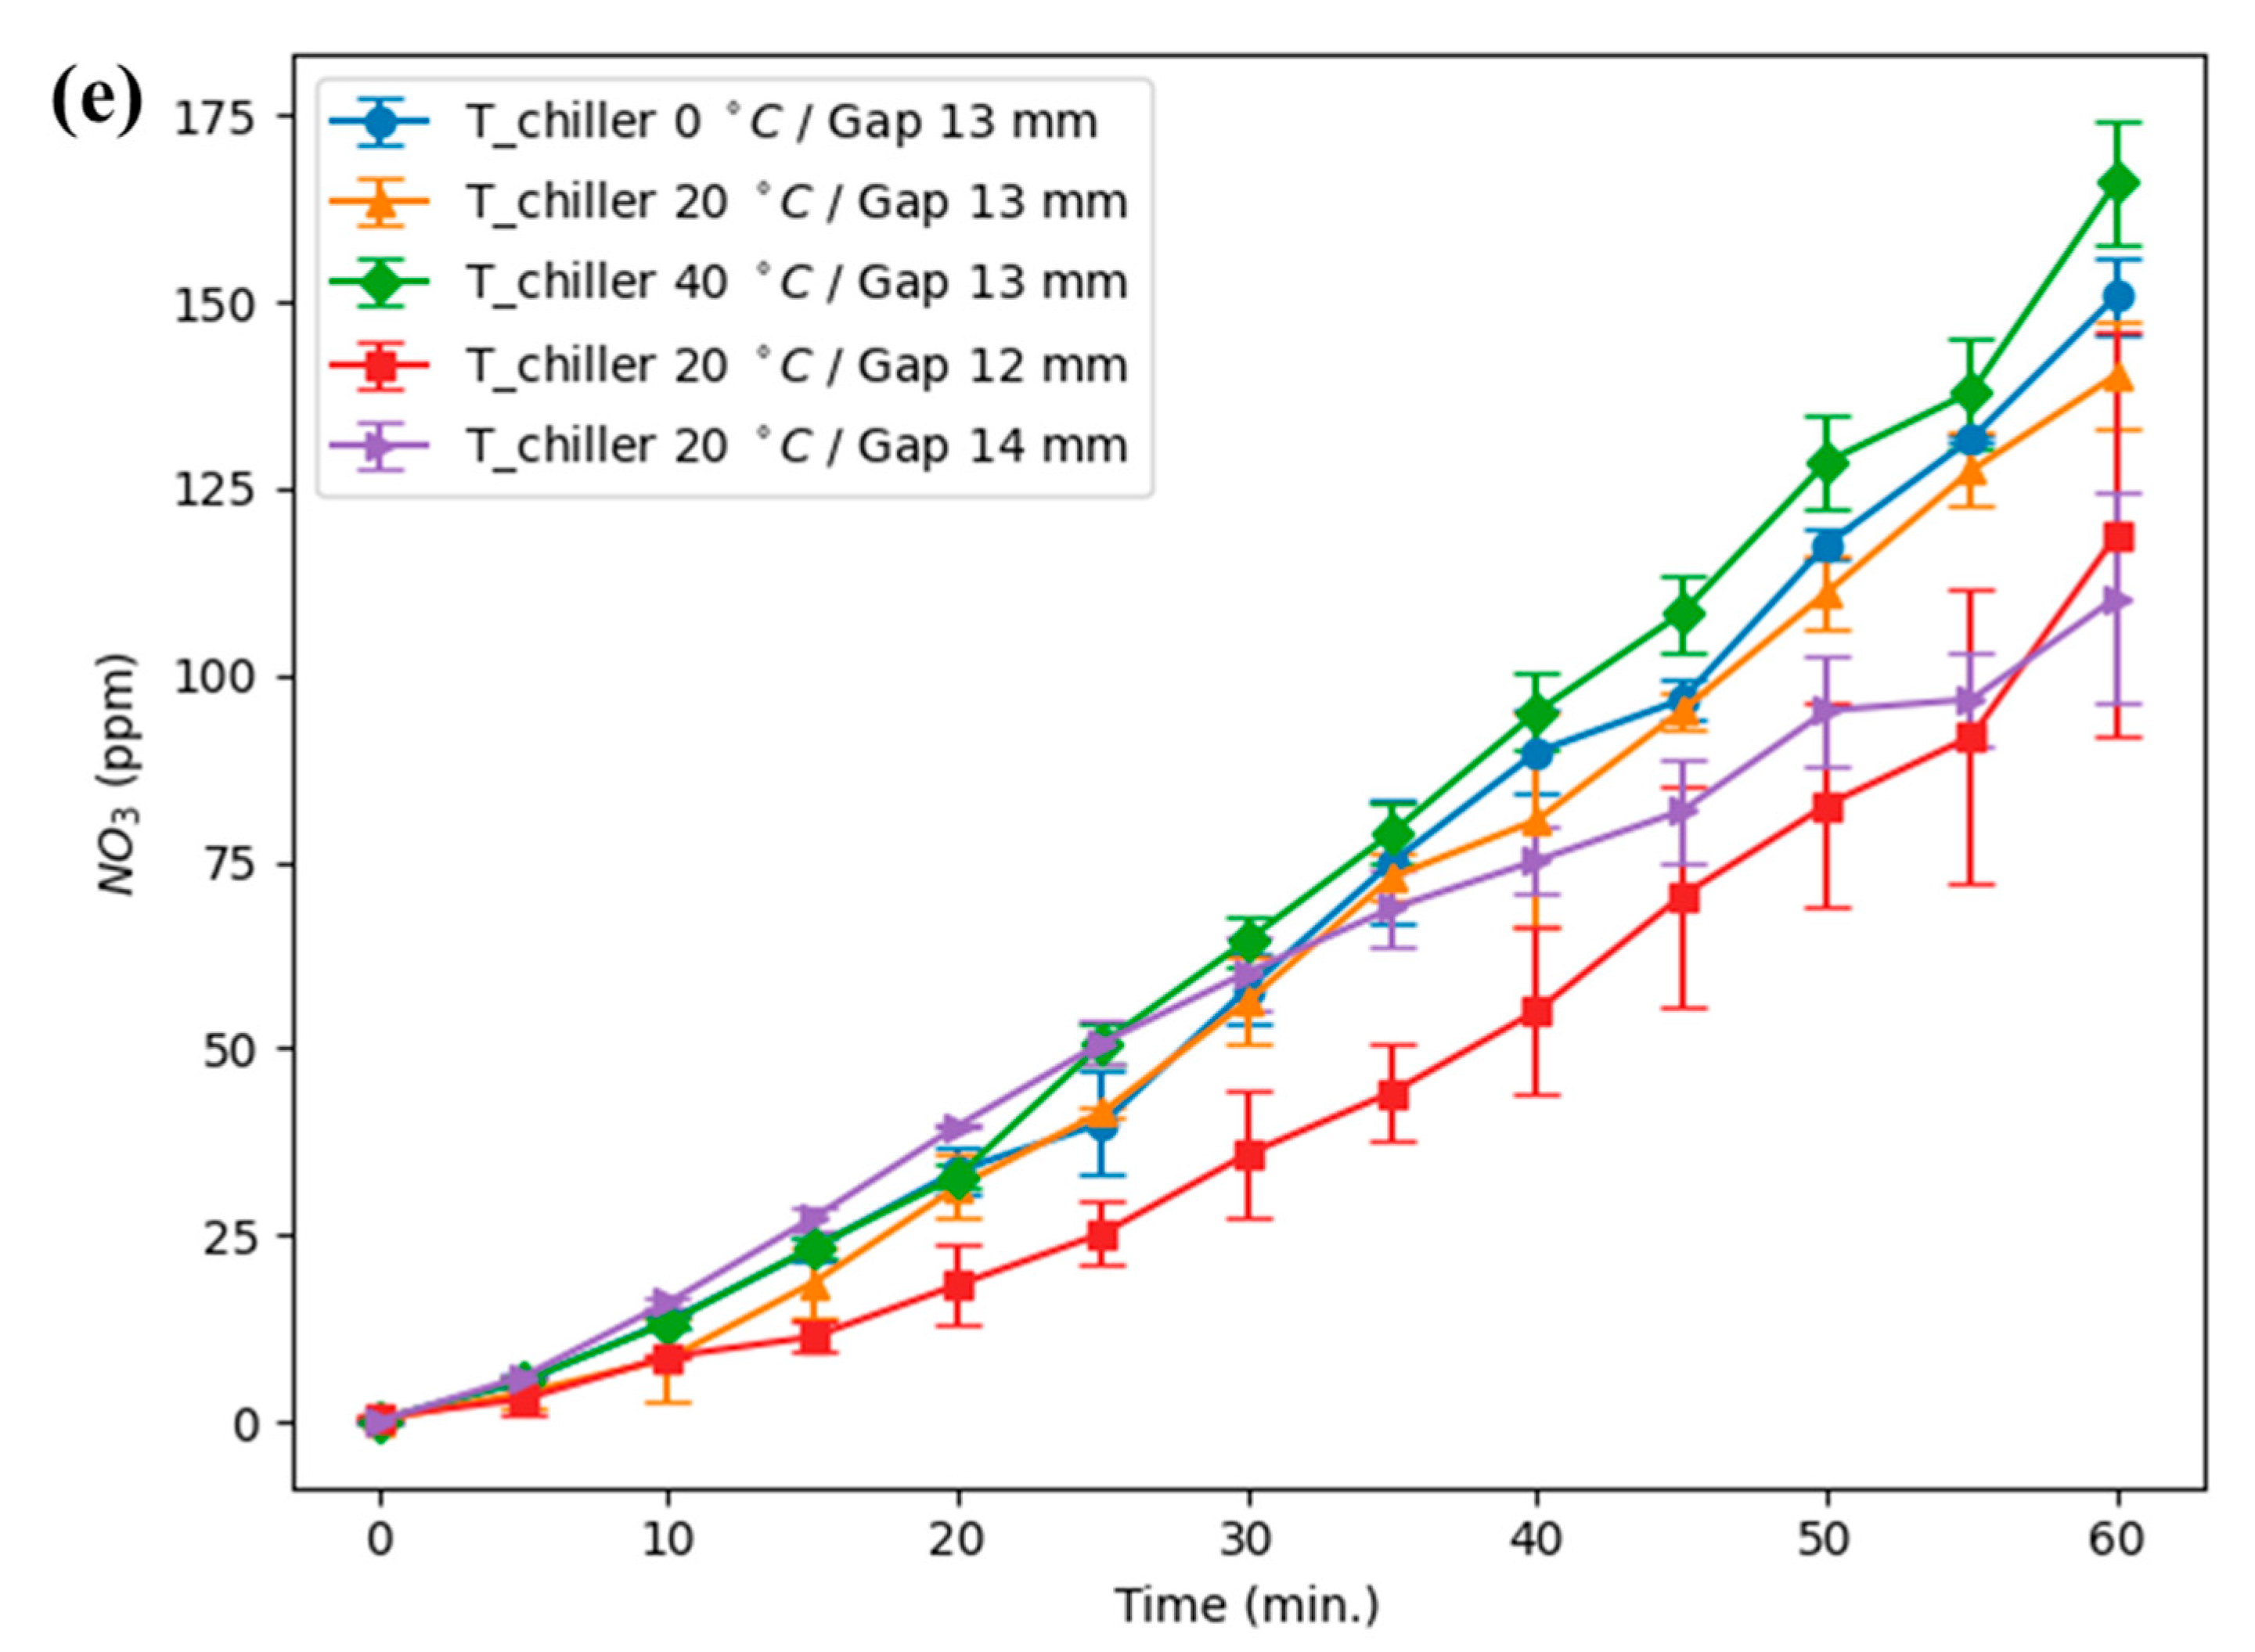
3.2. Time-Resolved PTW Properties

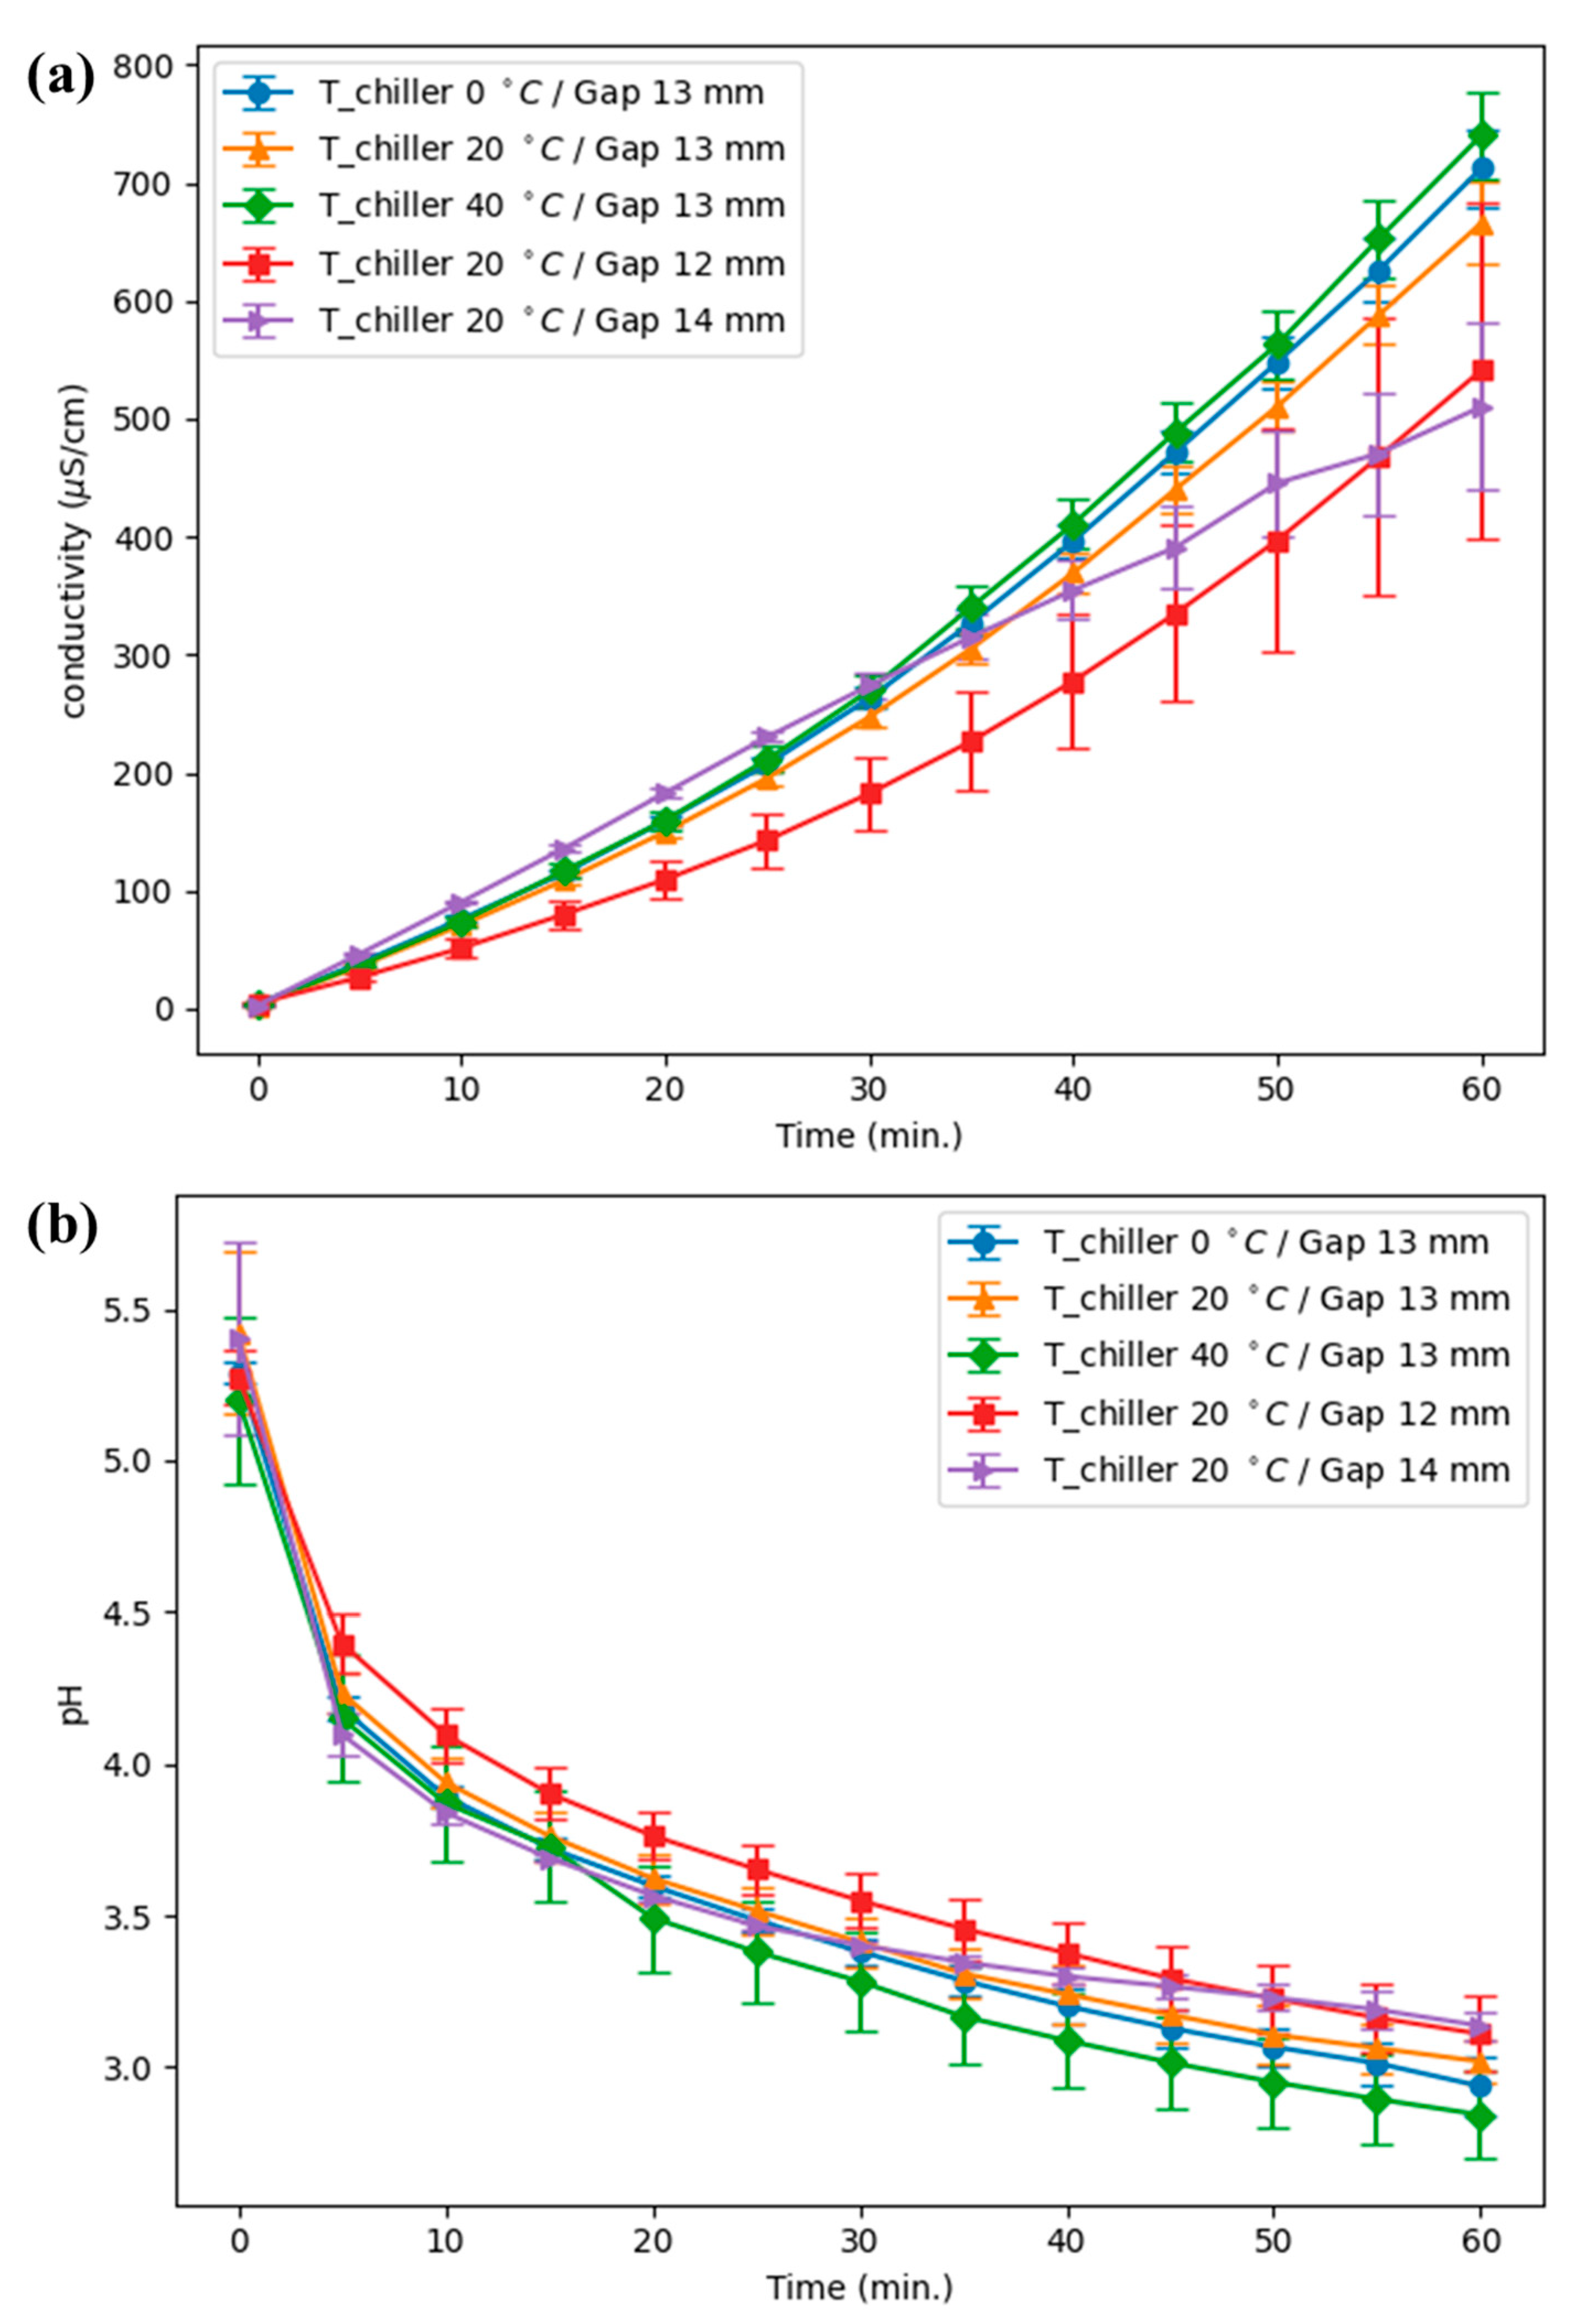
Liquid-phase diagnostics further substantiate a chemistry shift as the cause of the observed H2O2 decline. Figure 5 shows that, during the same 15–25 min interval in which H2O2 peaks and then falls, the electrical conductivity of the water increases substantially (to the order of 102 μS cm−1), the pH decreases, and nitrite/nitrate (NO2/NO3) concentrations rise sharply. These co-occurring changes indicate dissolution of RNS species and acidification of the bulk liquid concurrent with H2O2 loss. Taken together with the FTIR and OES data, the liquid diagnostics demonstrate that the system transitions from an ROS-dominated chemistry (which favors H2O2 accumulation) to an RNS-dominated chemistry (which consumes H2O2 and acidifies the solution). It should be noted that while Tvib rises rapidly in the early discharge period, the aqueous H2O2 absorbance evolves more gradually. This discrepancy originates from the intermediate diffusion and dissolution processes at the plasma–liquid interface, which decouple the immediate plasma excitation state from the slower bulk-liquid response.

3.3. Numerical Analysis

A control experiment explicitly ruled out bulk thermal decomposition as the dominant cause of H2O2 decline: an aqueous H2O2 solution held at 60 °C without plasma exposure showed negligible loss over the same time window. Therefore, the post-peak H2O2 decrease during plasma treatment is attributable to changes in plasma chemistry and transport rather than to direct thermal decomposition in the reservoir.
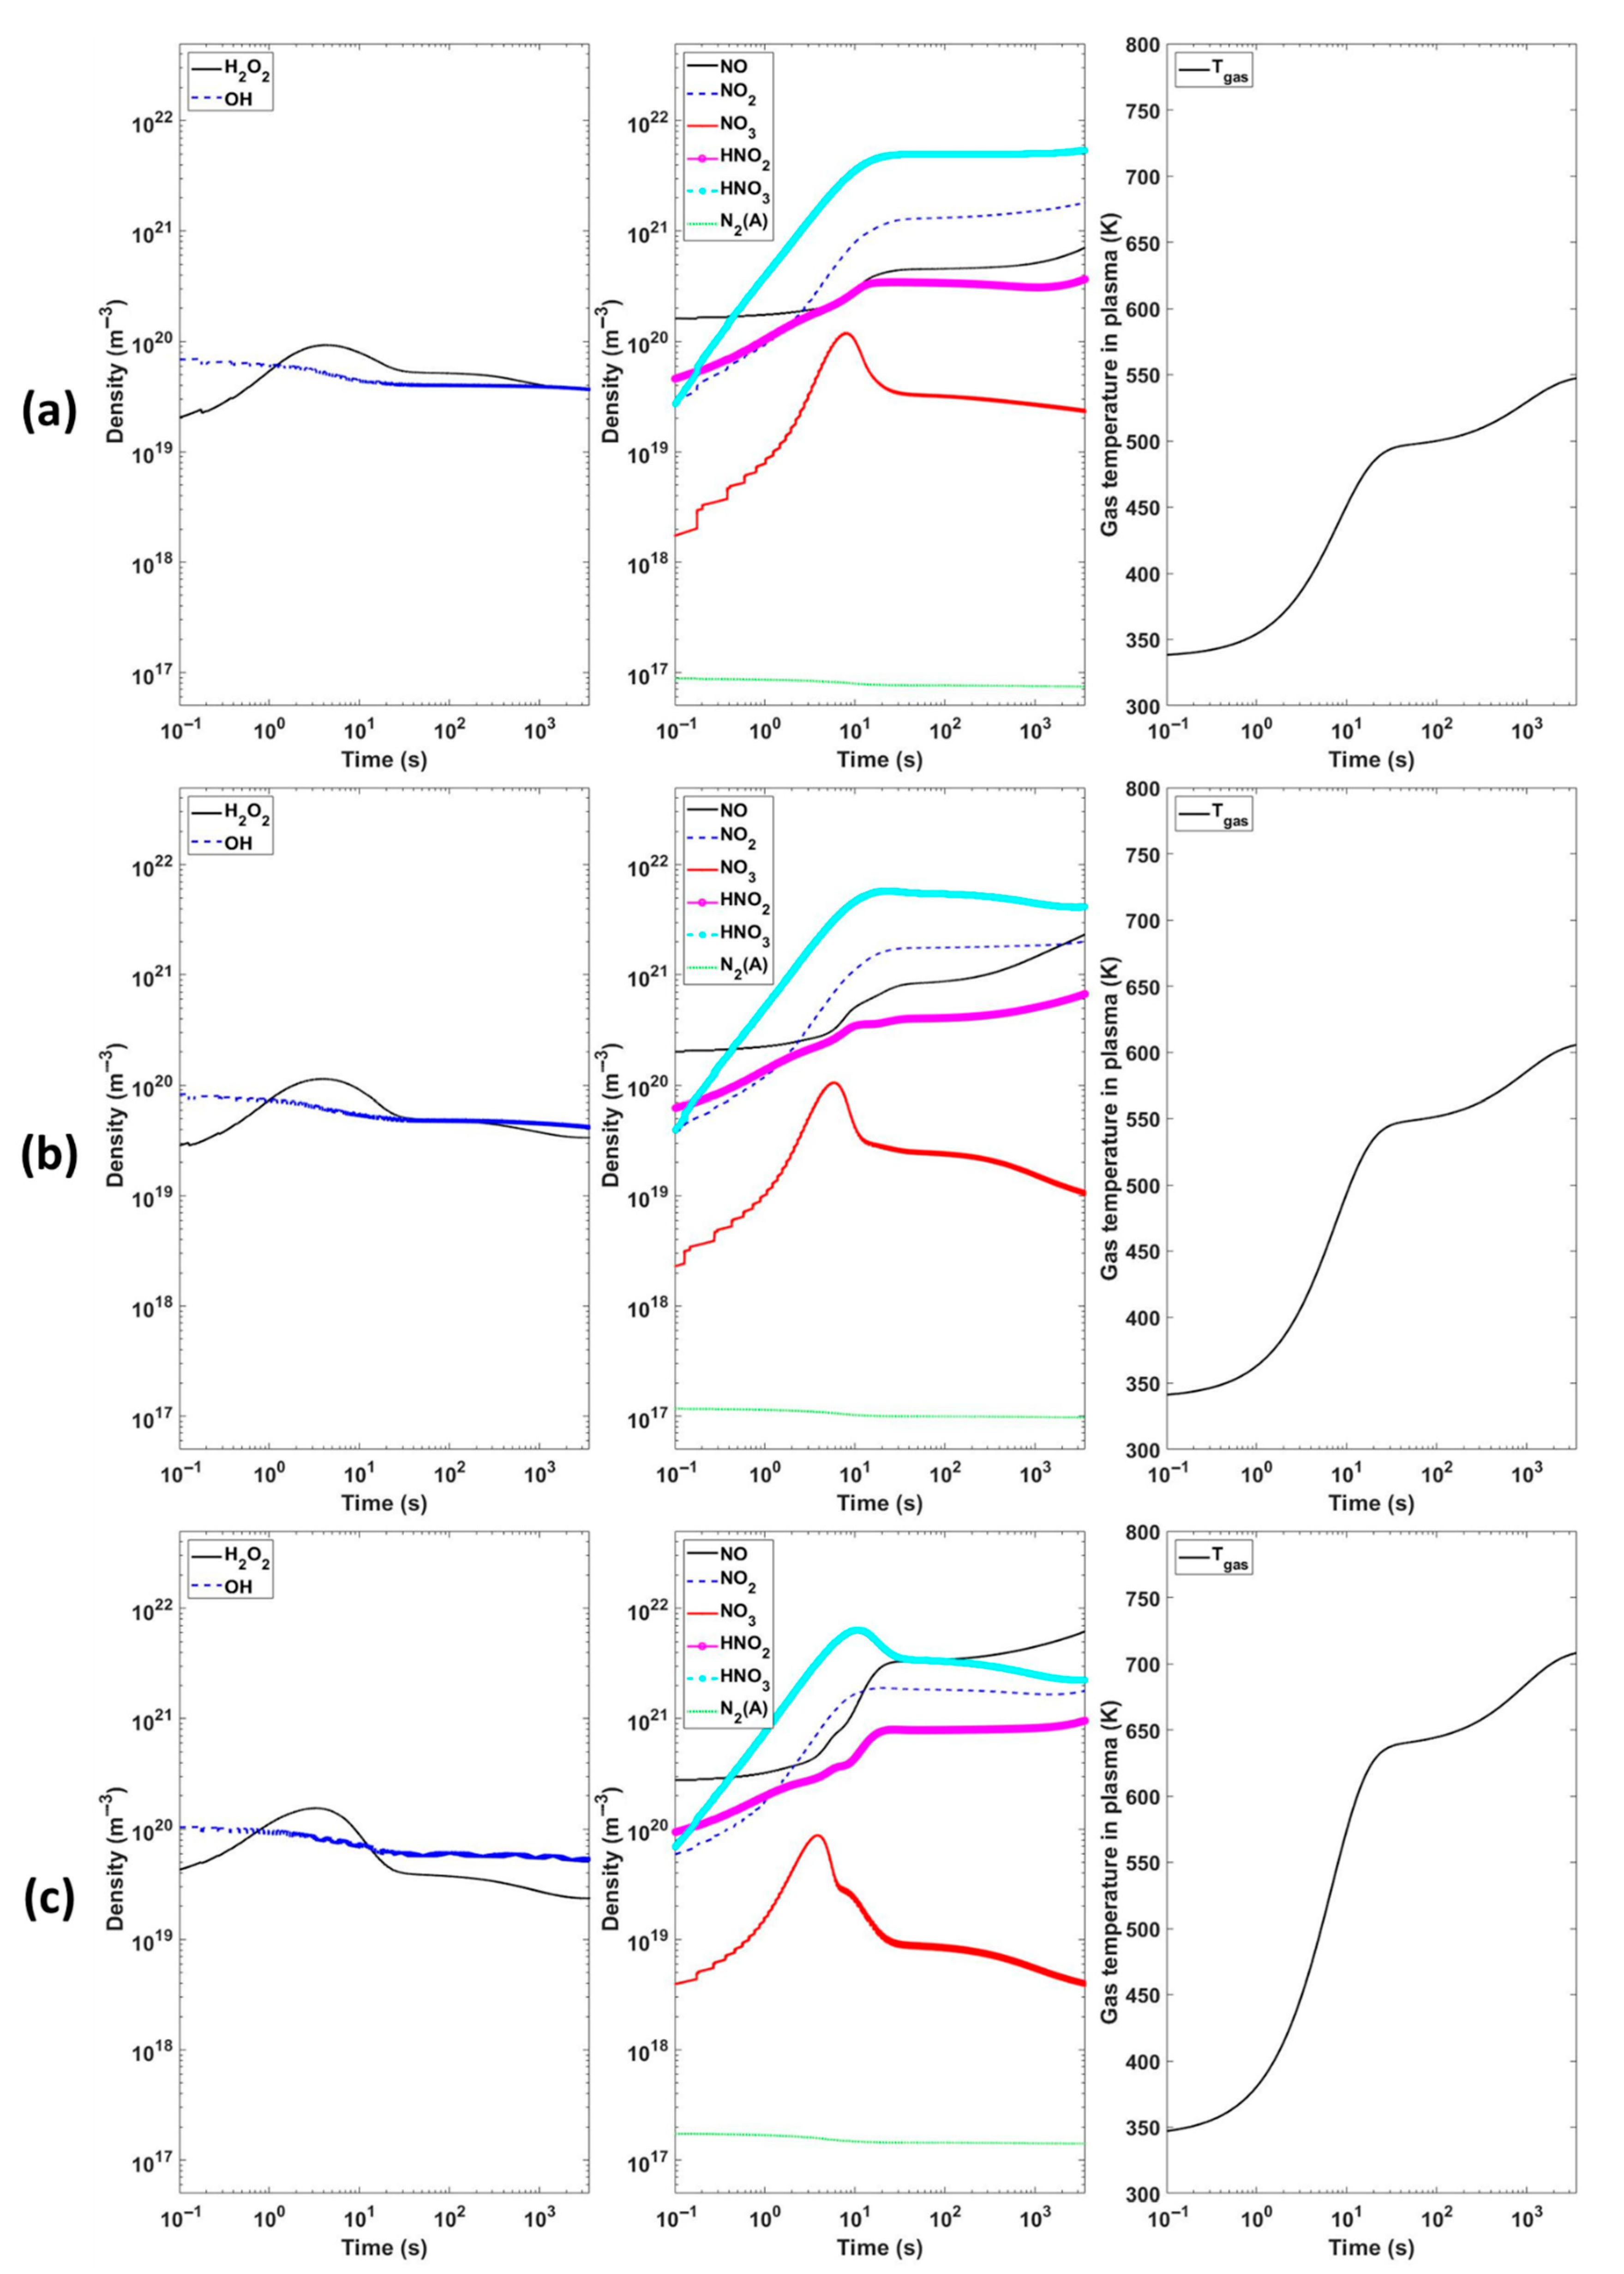
To mechanistically connect the measured trends and to explore parameter sensitivity, we coupled a global plasma chemistry model to 3D fluid dynamics simulations. The model, implemented as described in [16], incorporates a comprehensive reaction set that has been previously validated against FTIR-measured RONS concentrations in humid-air discharges. Using this framework, we reproduce the characteristic non-monotonic H2O2 evolution: H2O2 initially accumulates and then declines while NO and NO2 rise monotonically as effective gas temperature and vibrational excitation increase (Figure 6). The agreement between simulation and our present measurements supports the interpretation that increasing Tvib shifts OH radical pathways away from H2O2 formation and toward NOX chemistry.
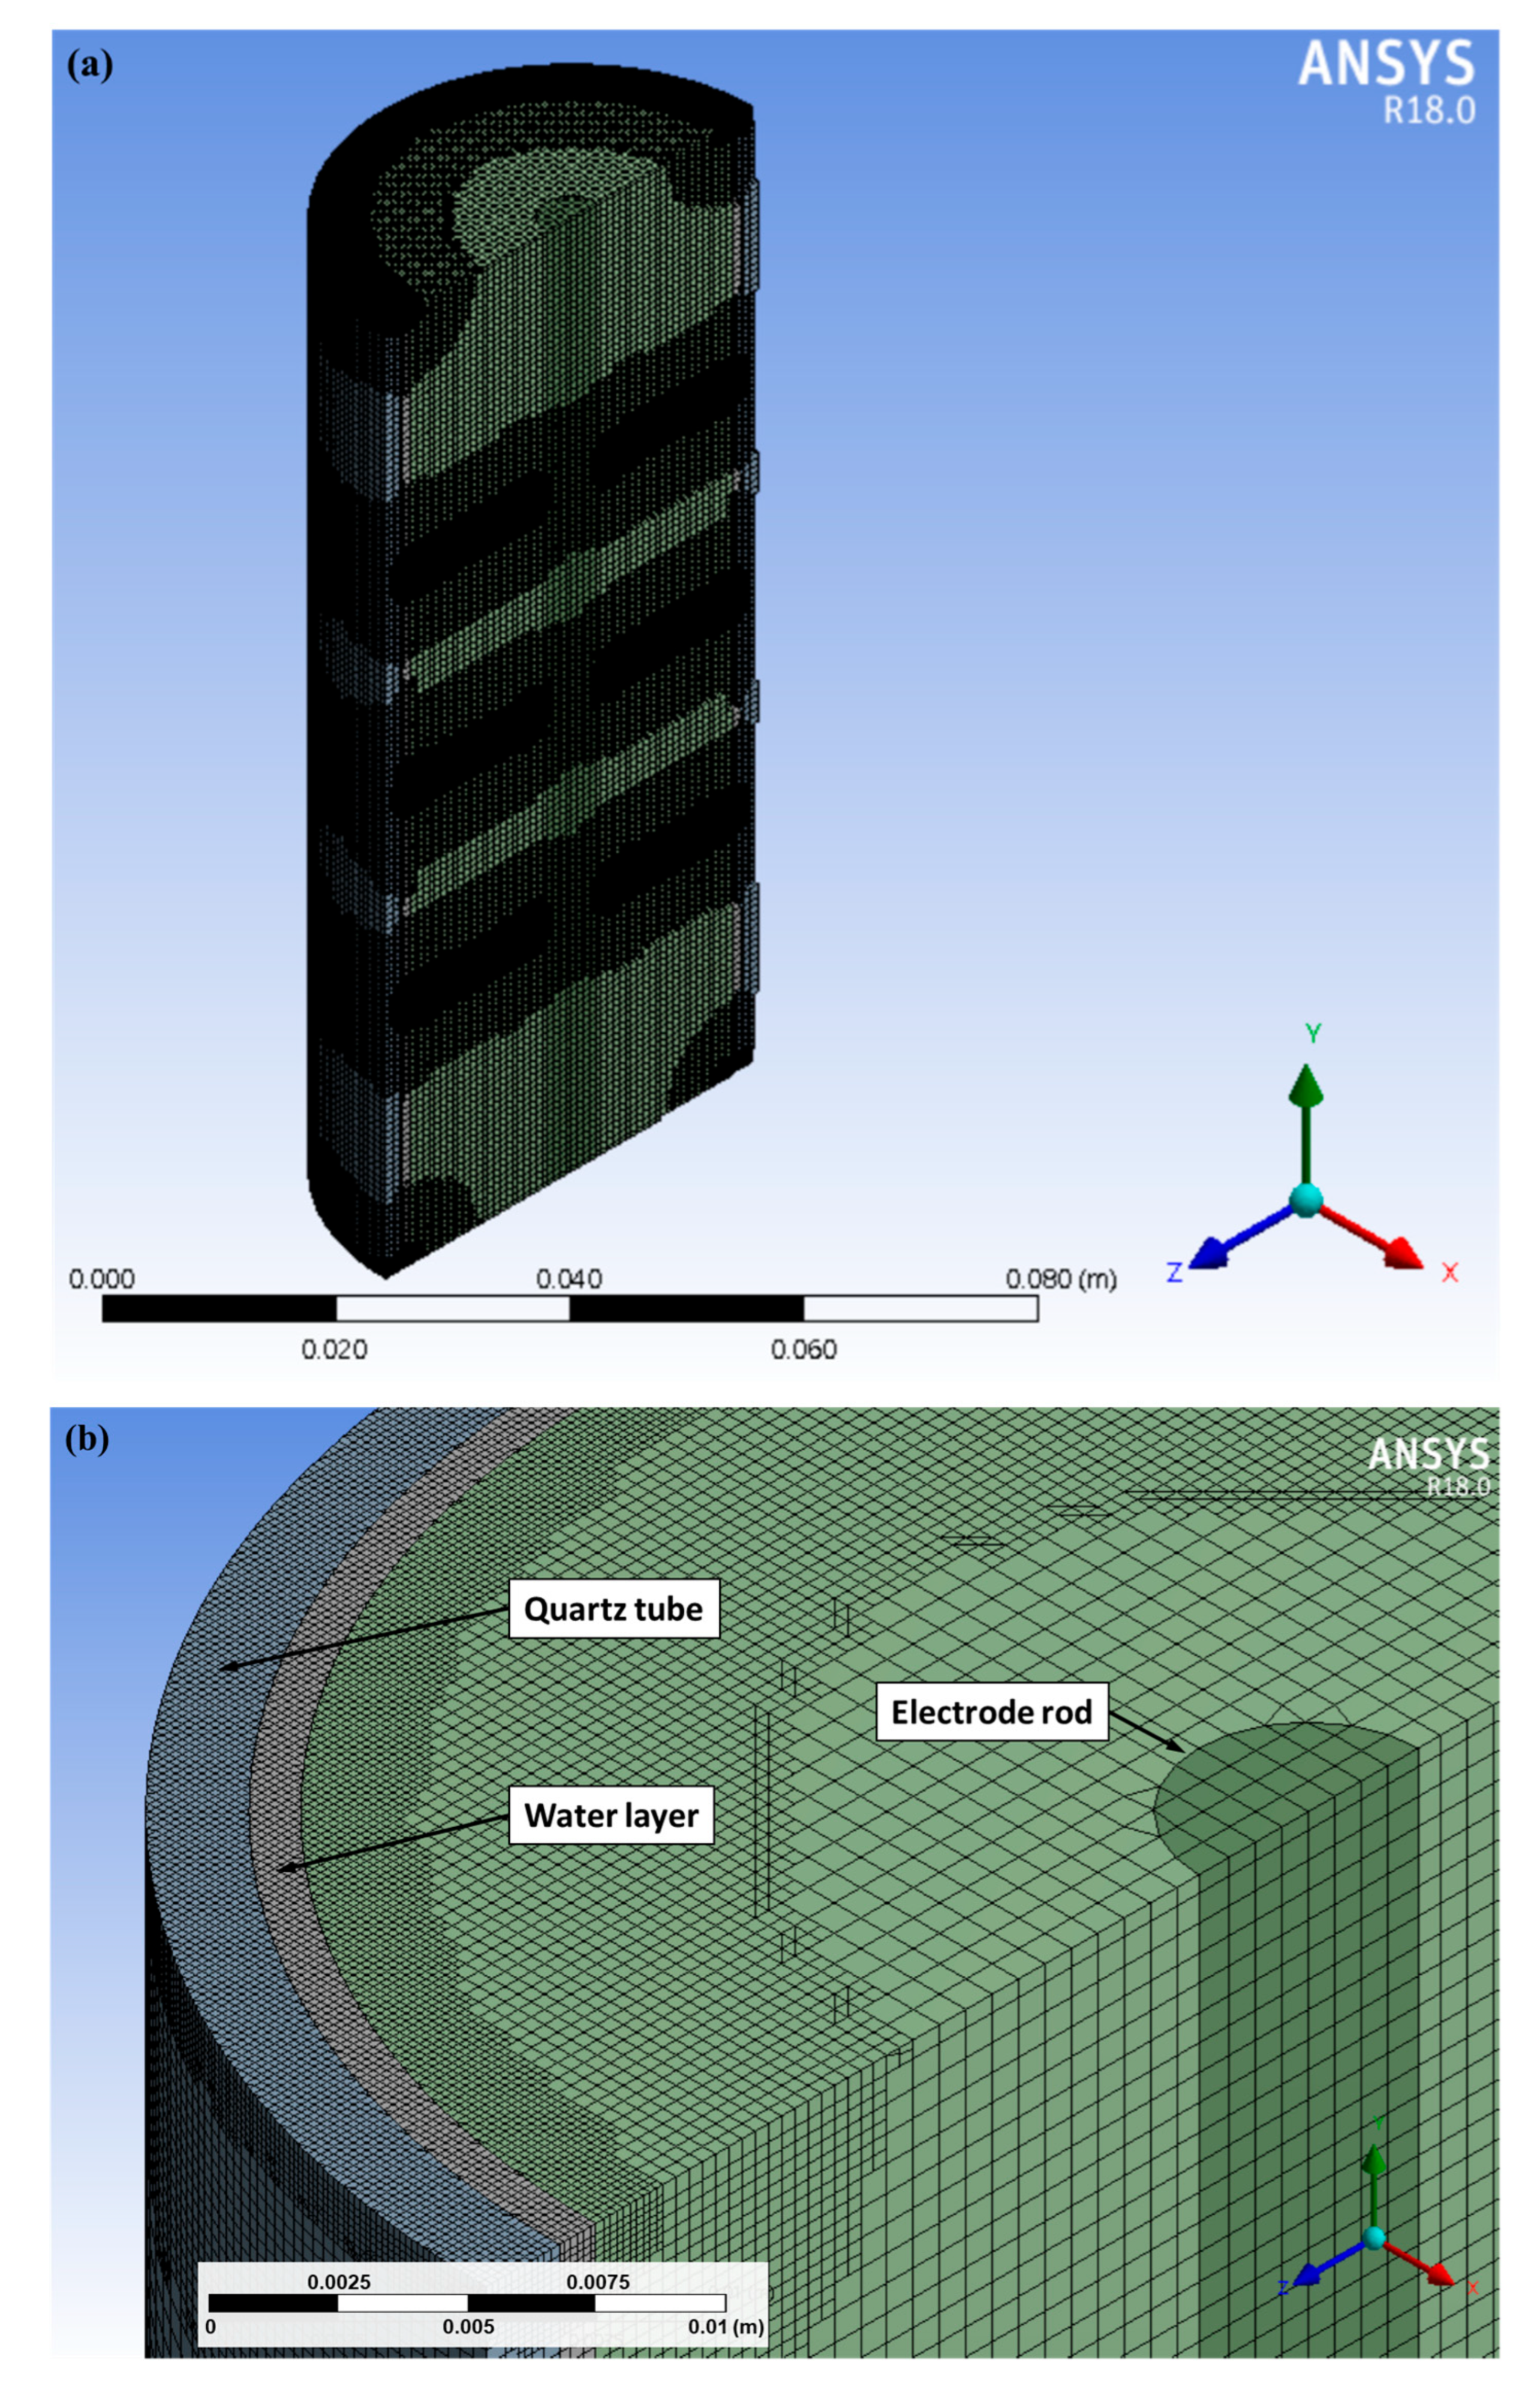
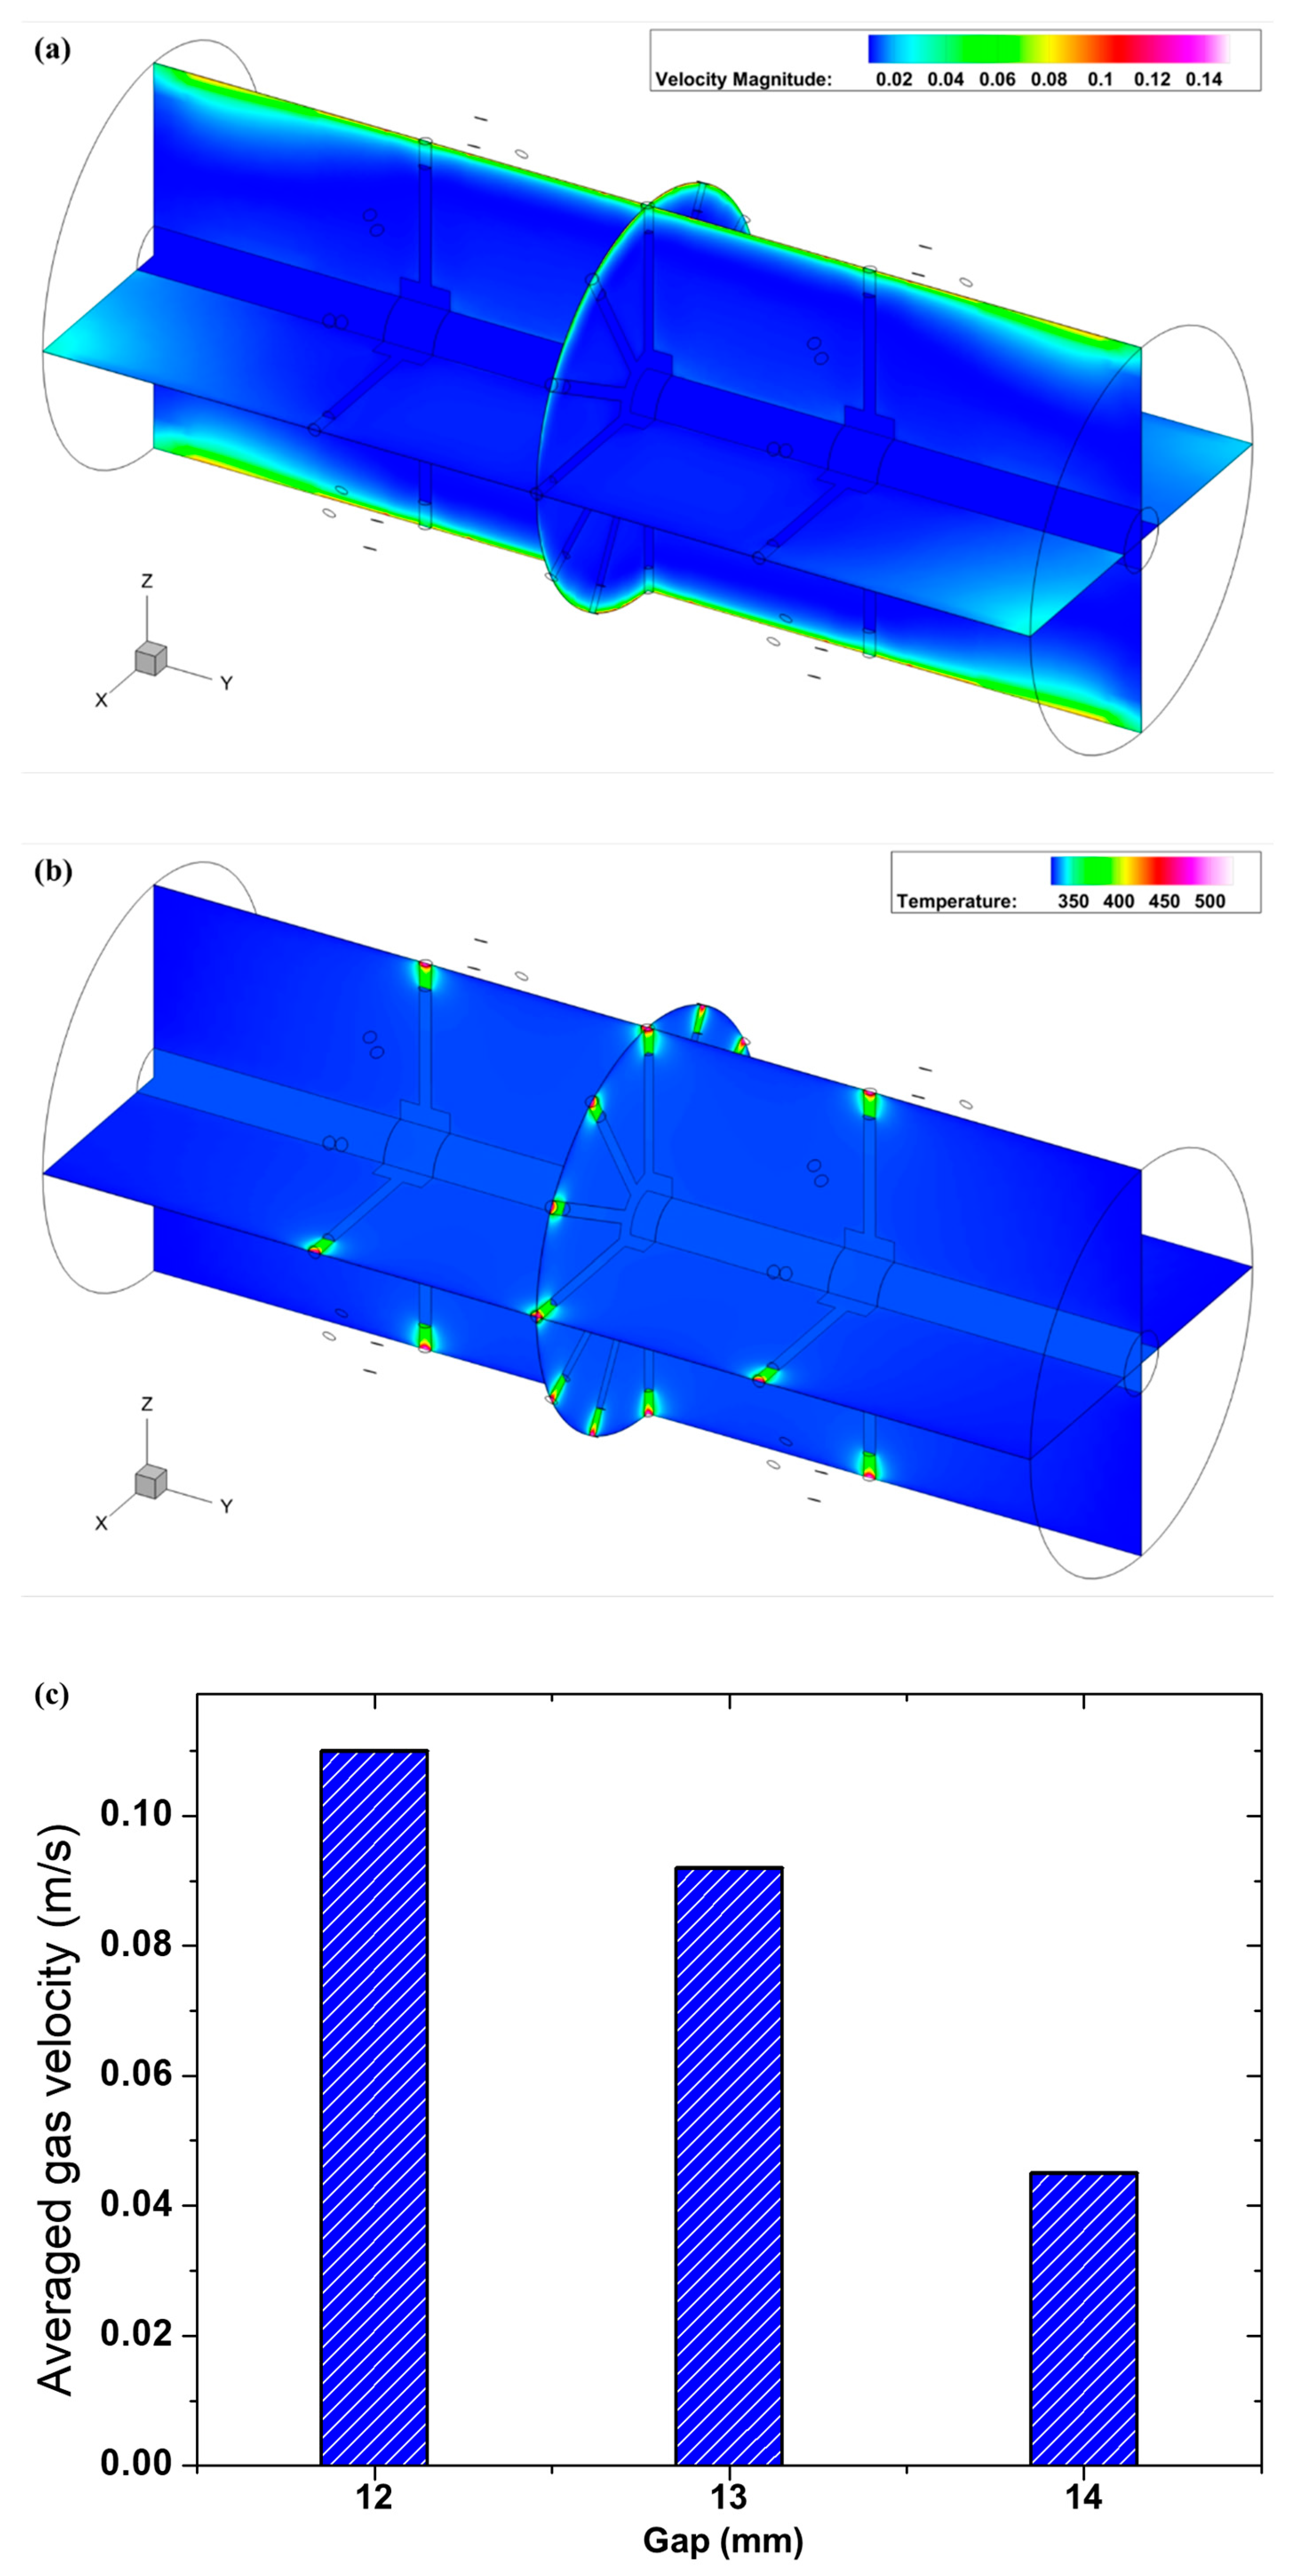
During 1 h of plasma discharge from the global model, among the various chemical species, H2O2 and relevant major species for generation and loss are presented. The power density was assumed to be the value obtained by dividing the measured plasma power by plasma volume. In this work, we deduce the power density by dividing the input power by plasma volume. The plasma volume was deduced from the electrode radius and the distance between the electrode end and the water surface. The thickness of the water layer is assumed to be 1 mm. The gas temperature was not saturated but kept increasing. The gas temperature in the model indicates the value inside the plasma column. As the power density increased from 1.5 × 10⁸ to 7.1 × 10⁸ W/m3, the maximum gas temperature increased from 525 K to 710 K. The calculated results clearly show the non-linear trends of H2O2 density. The H2O2 density increased after the beginning of discharge but gradually decreased without saturating at the maximum value. Note that the excited N2(A) density decreases with the gas temperature. Because the N2(A) consumes the ROS, which is needed to generate the O3 and H2O2, the NO and NO2 densities increased. The global model needs gas velocity to calculate the species densities that drift into and out of the plasma zone. We used complementary Fluent® simulations to deduce the gas velocity from the water flow at the wall. Figure 7 shows the domain of the simulation, and Figure 8 shows the result. Fluent simulations were conducted in three dimensions, and Figure 7 illustrates the computational domain and a representative cross-sectional mesh. The shaded regions indicate the positions of the three thin electrode layers, around which a finer mesh was applied to capture thermal gradients. Panel (a) shows the overall cross-sectional view, while panels (b) and (c) provide magnified views of the inlet region and the electrode/plasma zone, respectively. In the model, the plasma zone is represented as a localized heat source. The liquid layer was implemented as a tangentially injected water film flowing along the inner quartz wall, consistent with the experimental configuration, thereby approximating the observed stable water dynamics. In this calculation, we used the plasma zone as a heat source to consider the temperature effects on the gas flow. Figure 8a,b are velocity magnitude and temperature distribution in the tube, respectively. The averaged gas velocity in the plasma zone is presented in Figure 8c. It reveals strong localized heating and convective patterns around the pin: regions of reduced convection near the liquid surface enhance local residence of reactive species and heat, while orthogonal flows remove ROS from the interface. The combined model results thus show how vibrational kinetics (captured by Tvib) and transport (flow and convective removal) jointly determine the time window over which H2O2 is favorably produced.
The mechanistic link between vibrational excitation and H2O2 production can be clarified by considering the role of hydroxyl radicals. It has been well established that H2O2 in humid plasmas is primarily formed through the recombination of OH radicals (OH + OH → H2O2), which originate from electron impact dissociation of water molecules [21]. In this context, Tvib does not directly form H2O2 but acts as an indicator of enhanced electron–molecule vibrational excitation that promotes OH radical generation. Meanwhile, Trot provides complementary information on the thermal environment, which influences the lifetime and recombination probability of OH [21]. Similar interpretations have been reported in plasma–liquid interaction studies, where correlations between vibrational excitation, OH radical density, and H2O2 yield have been observed [22]. Accordingly, the observed coincidence of Tvib ~ 4900 K with the onset of H2O2 suppression should be understood as an operational marker of a plasma-state transition where OH pathways are diverted or consumed in competing reactions, rather than as a direct causal mechanism.

3.4. H2O2 Generation Control Knob

Taken together, the experimental and modeling evidence support the following mechanistic picture. In the initial regime (low Tvib), plasma processes produce abundant O, OH, and HO2 that lead to net H2O2 formation in the gas phase and subsequent transfer to the liquid. As the operation proceeds, accumulated ions and changing surface conditions (increasing conductivity, surface deformation toward the pin) increase local current density and heating; Tvib rises accordingly. When Tvib approaches 4900 K, channels favoring NO formation (via vibrationally assisted N2 + O pathways and related chemistry) become kinetically competitive [13,23,24]. The enhanced NO/NO2 chemistry produces soluble RNS that scavenge H2O2 (directly or via secondary aqueous reactions), acidify the liquid, and thereby suppress net H2O2 concentration despite continued plasma energy input. This Tvib-mediated ROS to RNS shift explains why simply increasing treatment time or power does not monotonically increase H2O2 yield and why geometry and flow control are essential levers.
These mechanistic conclusions directly inform device-level design rules for on-demand H2O2 generation. Figure 9 summarizes the practical guidelines that emerge from our data and simulations. First, the electrode gap functions as an effective power-density control: selecting a longer gap reduces the rate of Tvib rise, thereby extending the H2O2-productive window. Second, real-time monitoring of Tvib by OES provides a practical process endpoint: terminate the discharge when Tvib approaches ~4900 K to harvest maximal H2O2 and avoid NOx domination. Third, flow geometry should be designed to minimize convective loss of ROS-orthogonal gas flows that sweep reactive oxygen away from the liquid interface, shorten the useful window, and reduce yield. Fourth, thermal management (chiller control) stabilizes bulk temperature but does not, by itself, prevent the vibrationally driven transition; therefore, chiller design is a secondary but necessary element of an integrated system. Finally, water quality (low conductivity DI water) and corrosion-resistant wetted materials are prerequisites for any practical implementation, particularly when downstream purity is required for industrial use. Although discharge current was not directly measured in the present work, the current characteristics of this PTW configuration were investigated in our previous study [13]. It was shown that ions generated by the plasma increase the conductivity of the liquid, which provides positive feedback to the discharge and induces a transition from glow to abnormal glow mode. This mode transition is accompanied by changes in both plasma density and gas temperature, which are known to strongly influence H2O2 generation. The present results should therefore be interpreted in the context of these earlier findings, as the mode-dependent discharge behavior represents an additional factor that can modulate reactive species production.
We acknowledge the limitations of the present study that frame near-term work. First, the Tvib threshold reported here is an operationally useful marker within our experimental gas composition and geometry; cross-validation with alternative spectroscopic diagnostics and with varying gas mixtures (e.g., controlled O2 enrichment or reduced N2 fraction) would better constrain its universality. Second, although the global model captures the qualitative trends and parameter sensitivities, fully spatially resolved plasma-kinetic simulations that couple vibrational population dynamics with detailed surface chemistry are a logical next step for improved quantitative design. Third, for semiconductor applications in particular, additional qualification (TOC, ICP-MS for trace metal leaching, and energy efficiency metrics in mg H2O2 kW/h) is required before claiming process integration; the present work establishes the mechanistic and operational basis that such qualification should build upon.
Under our tested condition (0.2 kW, 60 min treatment of 600 mL, final H2O2 ≈ 1 mg·L−1), the total H2O2 produced was ~0.6 mg, corresponding to an energy yield of ≈0.003 g·kWh−1. This is substantially lower than values reported in parametric studies, which provide useful context for interpreting our fixed-condition results. For example, pulsed discharges in oxygen bubbles demonstrated that increasing pulse frequency enhances H2O2 generation while energy yield remains nearly constant; under optimized low-voltage long-pulse conditions, the maximum efficiency reached 61.8 mg·h−1 and 2.1 g·kWh−1 at 2.5 kV, 1 μs, 4 kHz [25]. Power-scan studies with noble gas pin-to-water discharges showed that higher discharge power increases H2O2 concentration but decreases energy yield, with helium performing slightly better than argon [26]. Atmospheric pressure plasma jets further revealed that feed gas humidity and power strongly affect H2O2 delivery, and that low-frequency pulsing can improve efficiency from ~0.2 g·kWh−1 in continuous mode up to ~0.75 g·kWh−1 [27]. Compared to these reports, our results are modest because the operating frequency (14.3 kHz) and generator power (0.2 kW) were kept constant in this study. Nevertheless, the present findings establish a baseline for linking vibrational temperature to H2O2 production and can inform future optimization of frequency, power, and gas composition.
In summary, our combined experimental and modeling study shows that H2O2 generation in air PTW discharges is bounded by an operational window defined by N2 vibrational excitation. By using Tvib as an in-process diagnostic and by controlling geometry and flow to moderate its rise, PTW devices can be operated to maximize H2O2 yield while avoiding NOx-dominated suppression. These findings provide a pathway to rationally design compact, on-demand H2O2 generators for applications ranging from sterilization and agriculture to potential integration with downstream purification for high-purity industrial processes.
4. Conclusions

This study establishes a direct, actionable link between plasma state and aqueous H2O2 yield in pin-to-water atmospheric discharges. Experimentally, H2O2 production is maximized within a finite operational window (peak typically at ~15–25 min under our settings) and is reproducibly suppressed once the N2 vibrational temperature rises to approximately 4900 K. The suppression is accompanied by NOX formation, conductivity increase, and pH drop in the liquid—signatures of an ROS to RNS chemistry shift. Coupled global chemistry and fluid simulations demonstrate that this behavior emerges from the interplay of vibrational kinetics (which governs radical production pathways) and transport/thermal feedback (which controls species residence times and local heating).
From an engineering perspective, these findings translate into concrete device-level rules: (1) select electrode gap and geometry to set power density so Tvib rises slowly enough to keep operation inside the productive window; (2) regulate discharge current (or operate in a current-limited regime) to avoid prematurely crossing the Tvib threshold; (3) design flow and thermal control to minimize convective loss of ROS and to extract excess heat; (4) maintain high water quality and corrosion-resistant wetted materials to avoid contamination of produced H2O2; and (5) implement real-time OES-based Tvib monitoring and an automated stop criterion (terminate treatment as Tvib reaches up to ~4900 K) to ensure consistent high yields.
These prescriptions make PTW devices a viable approach for reagent-free, point-of-use H2O2 generation for sterilization, environmental treatment, and low-to-moderate concentration applications. For high-purity industrial uses (e.g., semiconductor processing), the presented design framework indicates a clear pathway: couple the PTW generator to downstream purification or concentration modules and add trace-contaminant qualification (TOC, ICP-MS), energy-efficiency optimization, and closed-loop gas management. Future work should quantify system energy efficiency (mg H2O2 per kWh), validate long-term material stability, and implement closed-loop Tvib control to translate these design rules into commercially robust modules. Ultimately, it is expected that the present findings will be directly utilized in the development of plasma devices capable of generating H2O2 in situ and in real time, thereby accelerating the translation of laboratory concepts into practical industrial technology.

Author Contributions

Conceptualization, S.-Y.Y. and S.R.; Methodology, S.-Y.Y.; Software, S.-Y.Y. and S.E.; Validation, S.P.; Formal analysis, E.J.H., J.L. and S.R.; Data curation, S.-Y.Y., J.L. and S.R.; Writing—original draft, S.-Y.Y.; Supervision, S.B.K. and S.P.; Funding acquisition, S.B.K. All authors have read and agreed to the published version of the manuscript.

Funding

This research was funded by the Ministry of Science and ICT, grant number EN25425-12.

Institutional Review Board Statement

Not applicable.

Informed Consent Statement

Not applicable.

Data Availability Statement

The original contributions presented in this study are included in the article. Further inquiries can be directed to the corresponding author.

Acknowledgments

This work was partly supported by the R&D Program of “Plasma Bio Convergence Technology Research Project (Plasma Farming, EN2525-12)” through the Korea Institute of Fusion Energy (KFE), funded by the Government.

Conflicts of Interest

Author Sung-Young Yoon is employed by Samsung Electronics. The authors declare no conflicts of interest.

References

  1. Chung, S.; Chung, J.; Chung, C. Enhanced electrochemical oxidation process with hydrogen peroxide pretreatment for removal of high strength ammonia from semiconductor wastewater. J. Water Process Eng. 2020, 37, 101425. [Google Scholar] [CrossRef]
  2. Abejón, R.; Garea, A.; Irabien, A. Ultrapurification of hydrogen peroxide solution from ionic metals impurities to semiconductor grade by reverse osmosis. Sep. Purif. Technol. 2010, 76, 44–51. [Google Scholar] [CrossRef]
  3. Lukes, P.; Dolezalova, E.; Sisrova, I.; Clupek, M. Aqueous-phase chemistry and bactericidal effects from an air discharge plasma in contact with water: Evidence for the formation of peroxynitrite through a pseudo-second-order post-discharge reaction of H2O2 and HNO2. Plasma Sources Sci. Technol. 2014, 23, 015019. [Google Scholar] [CrossRef]
  4. Yun, S.; Yoon, S.-Y.; Hong, E.J.; Giri, S.S.; Kim, S.G.; Kim, S.W.; Han, S.J.; Kwon, J.; Oh, W.T.; Lee, S.; et al. Effect of plasma-activated water, used as a disinfectant, on the hatch rate of dormant cysts of the Artemia salina. Aquaculture 2020, 523, 735232. [Google Scholar] [CrossRef]
  5. Obiuto, N.C.; Olu-Lawal, K.A.; Ani, E.C.; Gwuanyi, E.D.; Ninduwezuor-Ehiobu, N. Chemical management in electronics manufacturing: Protecting worker health and the environment. World J. Adv. Res. Rev. 2024, 21, 10–18. [Google Scholar] [CrossRef]
  6. Chen, Z.; Chen, S.; Siahrostami, S.; Chakthranont, P.; Hahn, C.; Nordlund, D.; Dimosthenis, S.; Nørskov, J.K.; Bao, Z.; Jaramillo, T.F. Development of a reactor with carbon catalysts for modular-scale, low-cost electrochemical generation of H2O2. React. Chem. Eng. 2017, 2, 239–245. [Google Scholar] [CrossRef]
  7. Hübner, U.; Spahr, S.; Lutze, H.; Wieland, A.; Rüting, S.; Gernjak, W.; Wenk, J. Advanced oxidation processes for water and wastewater treatment – Guidance for systematic future research. Heliyon 2024, 10, e30402. [Google Scholar] [CrossRef]
  8. Gričar, E.; Kalcher, K.; Genorio, B.; Kolar, M. Highly Sensitive Amperometric Detection of Hydrogen Peroxide in Saliva Based on N-Doped Graphene Nanoribbons and MnO2 Modified Carbon Paste Electrodes. Sensors 2021, 21, 8301. [Google Scholar] [CrossRef] [PubMed]
  9. Wong, K.S.; Chew, N.S.L.; Low, M.; Tan, M.K. Plasma-Activated Water: Physicochemical Properties, Generation Techniques, and Applications. Processes 2023, 11, 2213. [Google Scholar] [CrossRef]
  10. Liu, J.; He, B.; Chen, Q.; Li, J.; Xiong, Q.; Yue, G.; Zhang, X.; Yang, S.; Liu, H.; Liu, Q.H. Direct synthesis of hydrogen peroxide from plasma-water interactions. Sci. Rep. 2016, 6, 38454. [Google Scholar] [CrossRef]
  11. Nguyen, T.S.; Rond, C.; Vega, A.; Duten, X.; Forget, S. Investigation of Hydrogen Peroxide Formation After Underwater Plasma Discharge. Plasma Chem. Plasma Process. 2020, 40, 955–969. [Google Scholar] [CrossRef]
  12. Bruggeman, P.; Schram, D.C.; González, M.Á.; Rego, R.; Kong, M.G.; Leys, C. Characterization of a direct dc-excited discharge in water by optical emission spectroscopy. Plasma Sources Sci. Technol. 2009, 18, 025017. [Google Scholar] [CrossRef]
  13. Yoon, S.-Y.; Byeon, Y.-S.; Yoo, S.; Hong, E.J.; Kim, S.B.; Yoo, S.J.; Ryu, S. Time-delayed transition of normal-to-abnormal glow in pin-to-water discharge. Phys. Plasmas 2016, 23, 083501. [Google Scholar] [CrossRef]
  14. Shimizu, T.; Sakiyama, Y.; Graves, D.B.; Zimmermann, J.L.; Morfill, G.E. The dynamics of ozone generation and mode transition in air surface micro-discharge plasma at atmospheric pressure. New J. Phys. 2012, 14, 103028. [Google Scholar] [CrossRef]
  15. Golkowski, C.; Shea, R.; Greene, J.W.; Golkowski, M.; Golkowski, A.; Steffie, T. Sterilization, Disinfection, Sanitization, Decontamination, and Therapeutic Devices, Systems, and Methods. U.S. Patent Application 17/569,392, 15 June 2023. [Google Scholar]
  16. Yi, C.; Yoon, S.-Y.; Eom, S.; Park, S.; Kim, S.B.; Ryu, S.; Yoo, S.J. Self-consistent plasma chemistry model for surface microdischarge in humid air including effects of ohmic heating and gas flow. Plasma Sources Sci. Technol. 2017, 26, 105007. [Google Scholar] [CrossRef]
  17. Giguère, P.A. The infra-red spectrum of hydrogen peroxide. J. Chem. Phys. 1950, 18, 88–92. [Google Scholar] [CrossRef]
  18. Zhao, T.-L.; Xu, Y.; Song, Y.-H.; Li, X.-S.; Liu, J.-L.; Liu, J.-B.; Zhu, A.-M. Determination of vibrational and rotational temperatures in a gliding arc discharge by using overlapped molecular emission spectra. J. Phys. D Appl. Phys. 2013, 46, 345201. [Google Scholar] [CrossRef]
  19. Baldrian, P.; Merhautova, V.; Gabriel, J.J.; Nerud, F.F.; Stopka, P.; Hruby, M.; Benes, M.J.; Beneš, M.J.; Hrubý, M.; Nerud, F.F.; et al. Decolorization of synthetic dyes by hydrogen peroxide with heterogeneous catalysis by mixed iron oxides. Appl. Catal. B Environ. 2006, 66, 258–264. [Google Scholar] [CrossRef]
  20. Richards, C.; Jans, E.; Gulko, I.; Orr, K.; Adamovich, I.V. N2 vibrational excitation in atmospheric pressure ns pulse and RF plasma jets. Plasma Sources Sci. Technol. 2022, 31, 034001. [Google Scholar] [CrossRef]
  21. Winter, J.; Tresp, H.; Hammer, M.U.; Iseni, S.; Kupsch, S.; Schmidt-Bleker, A.; Wende, K.; Dünnbier, M.; Masur, K.; Weltmann, K.D.; et al. Tracking plasma generated H2O2 from gas into liquid phase and revealing its dominant impact on human skin cells. J. Phys. D Appl. Phys. 2014, 47, 285401. [Google Scholar] [CrossRef]
  22. Tang, S.; Yuan, D.; Li, N.; Qi, J.; Gu, J.; Huang, H. Hydrogen peroxide generation during regeneration of granular activated carbon by bipolar pulse dielectric barrier discharge plasma. J. Taiwan Inst. Chem. Eng. 2017, 78, 178–184. [Google Scholar] [CrossRef]
  23. Huang, M.; Warner, K.; Lehn, S.; Hieftje, G.M. A simple approach to deriving an electron energy distribution from an incoherent Thomson scattering spectrum. Spectrochim. Acta Part B At. Spectrosc. 2000, 55, 1397–1410. [Google Scholar] [CrossRef]
  24. Laroussi, M.; Member, S.; Alexeff, I.; Richardson, J.P.; Dyer, F.F. The Resistive Barrier Discharge. IEEE Trans. Plasma Sci. 2002, 30, 158–159. [Google Scholar] [CrossRef]
  25. Wang, H.; Wandell, R.J.; Locke, B.R. The influence of carrier gas on plasma properties and hydrogen peroxide production in a nanosecond pulsed plasma discharge generated in a water-film plasma reactor. J. Phys. D Appl. Phys. 2018, 51, 094002. [Google Scholar] [CrossRef]
  26. Saeki, R.; Yasuoka, K. Generation of Hydrogen Peroxide in Gas Bubbles Using Pulsed Plasma for Advanced Oxidation Processes. IEEE Trans. Plasma Sci. 2015, 43, 3440–3444. [Google Scholar] [CrossRef]
  27. Schüttler, S.; Schöne, A.L.; Jeß, E.; Gibson, A.R.; Golda, J. Production and transport of plasma-generated hydrogen peroxide from gas to liquid. Phys. Chem. Chem. Phys. 2024, 26, 8255–8272. [Google Scholar] [CrossRef]
Figure 1. Schematic of the pin-to-water (PTW) discharge system. Optical emission spectroscopy (OES) and Fourier-transform infrared spectroscopy (FTIR) were employed to monitor gas-phase plasma species, while ion chromatography, pH, and conductivity probes characterized the treated water.
Plasma 08 00041 g001
Figure 2. Time evolution of hydrogen peroxide (H2O2) concentration in plasma-treated water. All cases exhibit a non-monotonic trend with a distinct maximum at 15–25 min, followed by a decline. Error bars represent standard deviation (n = 3).
Plasma 08 00041 g002
Figure 3. FTIR spectra of the discharge effluent showing the weak but extractable H2O2 absorption band near 3500 cm−1. (a) Representative IR spectrum in the range of 4000–500 cm−1. The H2O2 signal can be identified by comparing to the H2O signal. (b) The H2O2 signal band at ~3500 cm−1 can be extracted from the measured signal. (c) A time-wavenumber contour diagram of the measured spectrum. (d) A time-wavenumber contour diagram of the extracted H2O2 spectrum. The absorbance increases initially but shows an inflection after ~30 min, consistent with the liquid-phase H2O2 trend.
Plasma 08 00041 g003aPlasma 08 00041 g003b
Figure 4. Gas-phase diagnostics during plasma treatment: (a) estimated H2O2 optical absorbance from FT-IR, (b) Tvib of N2 from OES, and (c) Trot of N2 from OES.
Plasma 08 00041 g004aPlasma 08 00041 g004b
Figure 5. Liquid-phase diagnostics during plasma treatment: (a) electrical conductivity, (b) pH, (c) PTW temperature, (d) NO2 ion concentration, and (e) NO3 ion concentration. Electrical conductivity and NO2/NO3 concentrations increase while pH decreases, indicating the accumulation of reactive nitrogen species coinciding with H2O2 suppression.
Plasma 08 00041 g005aPlasma 08 00041 g005bPlasma 08 00041 g005c
Figure 6. Numerical modeling of the discharge with power density: (a) 1.53 × 10⁸ W/m3, (b) 3.56 × 10⁸ W/m3, and (c) 7.13 × 10⁸ W/m3. Global plasma-chemistry model results showing non-monotonic H2O2 density and concurrent NO growth as gas temperature rises.
Plasma 08 00041 g006
Figure 7. Domain of Fluent simulation for the PTW system. The temperature of the quartz tube outside is assumed as room temperature. The gas flow is formed by water flowing through the wall and is implemented through the flow rate of the slip wall condition and water layer: (a) overall cross-sectional view, (b) magnified view on the top part, and (c) magnified view of the electrode and plasma zone. The plasma zone acts as a heat source.
Plasma 08 00041 g007aPlasma 08 00041 g007b
Figure 8. Representative results of fluent simulation (a,b) and average gas velocities in plasma zone (c): (a) gas velocity magnitude by water flow, (b) gas temperature induced by plasma power, and (c) averaged gas velocities with gas distance.
Plasma 08 00041 g008
Figure 9. Summary of device-level design guidelines derived from this study. Efficient H2O2 generation is confined to a finite time window (t), determined by the onset of elevated Tvib. Electrode gap, discharge current, and flow/thermal management control the width of this window, providing practical levers for on-demand H2O2 generation.
Plasma 08 00041 g009
Table 1. Pearson correlation coefficients and p-values between H2O2 absorbance and spectroscopic temperatures (Tvib, Trot) for matched n = 12 times.
Conditionnr (Tvib, H2O2)p (Tvib, H2O2)r (Trot, H2O2)p (Trot, H2O2)
0 °C/13 mm120.6430.0240.7210.008
20 °C/13 mm−0.1340.6790.1890.555
40 °C/13 mm0.8210.0010.7630.004
20 °C/12 mm0.6320.0270.4530.139
20 °C/14 mm0.4620.1310.4520.140
Disclaimer/Publisher’s Note: The statements, opinions and data contained in all publications are solely those of the individual author(s) and contributor(s) and not of MDPI and/or the editor(s). MDPI and/or the editor(s) disclaim responsibility for any injury to people or property resulting from any ideas, methods, instructions or products referred to in the content.