Abstract
We present three dimensional particle-in-cell simulations of current-voltage characteristics of the hemispherical Langmuir probe (LAP), onboard the China Seismo-Electromagnetic Satellite (CSES). Using realistic plasma parameters and background magnetic fields obtained from the International Reference Ionosphere (IRI) and International Geomagnetic Reference Field (IGRF) models, we simulate probe–plasma interactions at three locations: the equatorial region and two magnetically conjugate mid-latitude sites: Millstone Hill (Northern Hemisphere) and Rothera (Southern Hemisphere). The simulations, performed using the PTetra PIC code, incorporate realistic LAP geometry and spacecraft motion in the ionospheric plasma. Simulated current voltage characteristics or I–V curves are compared against in-situ LAP measurements from CSES Orbit-026610, with Pearson’s correlation coefficients used to assess agreement. Our findings indicate how plasma temperature, density, and magnetization affect sheath structure and probe floating potential. The study highlights the significance of kinetic modeling in enhancing diagnostic accuracy, particularly in variable sheath regimes where classic analytical models such as the Orbital-Motion-Limited (OML) theory may be inadequate.
1. Introduction
Several measurement techniques have been used for the determination of ionosphere plasma parameters. These include remote sensing and in situ measurements. In many situations, direct or in situ measurements provide better data compared to other techniques that can be further used to improve model benchmarking and forecasting. Among in situ instrumentation, the Langmuir Probe (LP) is the simplest and most versatile sensor mounted on satellites and sounding rockets to measure plasma parameters, including electron temperature, ion temperature, electron density, and plasma potential [1,2]. In its simplest form, the LP is a conductor exposed to plasma. The measurement technique consists of varying the bias voltage with respect to the vacuum chamber (on ground application) or the spacecraft body (in space application) and measuring the collected current as a function of the applied voltage. The current-voltage (I-V) characteristic of the probe is then used to infer plasma parameters [3].
More than a century ago, since Irving Langmuir utilized electrostatic probes to study gas discharges, LP theory and technology have developed into fundamental probes for plasma diagnostics [4]. Since 1949, when LPs were initially used in a modified V-2 rocket, they have been widely used on sounding rockets and satellites in a variety of shapes, including cylindrical, spherical, and planar [5]. For example, in a series of Thermosphere probes experiments, cylindrical and hemispherical LPs were used to measure electron temperatures and densities [6]. Local plasma conditions around the probe might be significantly different from the actual ambient plasma because of the interaction between the space plasma and a spacecraft with an onboard probe. Traditional LPs, on the other hand, may produce significant errors in derived plasma parameters such as plasma density, temperature, and potential in inhomogeneous or anisotropic plasma. In this situation, directional probes have been created for monitoring anisotropic plasma parameters in space, although they have been limited to plasma flow measurements. A new generation of directional probes, including split planar and cylindrical probes as well as segmented LPs have been created and are primarily used to characterize plasma flow in the Earth’s ionosphere [7,8].
Many researchers have used particle-in-cell (PIC) simulations to demonstrate the effect of different plasma conditions on various LPs. Such simulations can provide a useful reference for data processing and the future design of the LP instrument onboard sounding rockets or low Earth orbit (LEO) satellite missions. For example, a simulation study of wake formation behind the LP thinner than the Debye length in the ionosphere’s F region has been presented by Jao et al. [9]. The study showed that the subsonic plasma flow can create wake in plasma density and electric potential behind the positively biased probe extending up to about 15 Debye lengths. The wake perturbations can be further enhanced with increasing electric bias and flow velocity. Moreover, the wake becomes more symmetric and more extended in space in the presence of an external magnetic field parallel to the object’s axis compared to the unmagnetized case. The subsonic flow results in wing-like structures of electron and ion densities when the magnetic field is parallel to the flow velocity [9]. Kinetic simulations have been used to demonstrate the effect of magnetic connectivity on in situ measurements of a planar probe on CHAMP and on a thin needle probe onboard 3U CubeSat [10,11]. The potential variation associated with the motional electric field varies significantly with the orientation of the probe with respect to the magnetic field. The resulting current characteristics of the probes can also be affected by the probe orientation with respect to the external magnetic field [10,11,12].
In a number of studies, PIC numerical models have been adapted to compute the current collection using a novel segmented LP design on DEMETER in different plasma conditions [13,14]. The model results are in good agreement with those obtained by Laframboise in a non-flowing thermal plasma [15]. In the case of flowing plasma, their numerical results are in good agreement with the observations made by the Segmented LP on DEMETER. Another study based on PIC simulations of dual segmented LPs on PROBA2 mission has been presented to illustrate the directional sensitivity of these instruments. It is demonstrated that the currents collected by each segment of the probes show directional sensitivity due to their orientation at different angles with respect to the plasma flow and magnetic field. This in turn leads to an apparent anisotropy in the floating potential and electron temperature inferred from the segment characteristics [16,17].
Early studies on current collected by LPs in Maxwellian plasmas are based on the Orbital-Motion-Limited (OML) theory. This theory determines the electron and ion currents collected by spherical and cylindrical probes using the conservation of energy and angular momentum along the particle trajectories. Subsequently, the OML theory was extended to account for collisions, relativistic conditions, and secondary electron emission. In space, charged-particle velocity distributions are often described by non-Maxwellian distributions such as Kappa and Cairns distribution functions [18]. Based on theory and PIC simulations, predictive models have been constructed for cylindrical and spherical LPs. For instance, Darian et al. [19] presented a theoretical and simulation based study of spherical and cylindrical Langmuir probes in non-Maxwellian plasmas. The authors derived the analytical expressions for the current collected by spherical and cylindrical probes immersed in an unmagnetized and collisionless non-Maxwellian plasma containing Kappa, Cairns and the generalized Kappa–Cairns velocity distributions. PIC simulations have been carried out to compute the current collected by the spherical and cylindrical probes in different velocity fields plasma. The results of PIC simulations of Langmuir probes in non-Maxwellian plasmas show good agreement with the corresponding analytical expressions. It is inferred that the OML theory is a good approximation for radii less than 0.2 Debye lengths for spherical probes and 1.0 Debye length for cylindrical probes [19].
A combination of analytic and multivariate regression techniques has been used to infer a satellite floating potential, from currents collected by a fixed-bias spherical Langmuir probes. The technique can also estimate the ratio of the plasma density and the square root of the electron temperature. This ratio, in turn, can provide a useful constraint to improve accuracy when density and temperature are measured independently. In the literature, an innovative method for derived plasma parameters from Swarm Langmuir probe measurements was introduced by Lira and Marchand [20]. This approach involves creating an empirical relationship that accurately reproduces plasma density, with an error margin of just , based on probe voltages, collected currents, and known values for temperatures, effective masses, plasma flow speeds, and the floating potential of satellites. Recently, kinetic simulations and machine learning approaches have been employed to develop models with the capability to deduce space plasma parameters from both emissive and non-emissive cylindrical Langmuir probes. This is especially valuable in situations where traditional analytical theories prove inadequate [21]. Brask et al. [22] investigated the effects of electron–neutral collisions on a cylindrical Langmuir probe in the lower E-region ionosphere by using PIC simulations including Monte Carlo collisions between charged and neutral particles. The simulation results showed enhancement in the electron currents as the collision frequency of electrons increases. These simulation results have been applied to the Investigation of Cusp Irregularities-4 sounding rocket to improve the accuracy in the measured currents due to collisions in the E-region [22]. Olowookere and Marchand [17] used multivariate regression and machine learning techniques to interpret measurements made by a spherical segmented Langmuir probe for which no analytic expressions are available. The evaluation of the two approaches considered using synthetic data showed high inference skills across all parameters examined. Moreover, the density model applied to actual in situ data demonstrates strong qualitative agreement with previously published PROBA-2 results [17]. In this study, we apply the kinetic simulation approach, previously validated in earlier works, to the Langmuir probe (LAP) onboard the China Seismo-Electromagnetic Satellite (CSES) to examine the influence of geomagnetic field geometry on ionospheric plasma behavior at three representative locations: the Equator, mid-latitudes (Millstone Hill), and near the auroral zone (Rothera). Our simulations indicate that plasma behavior is strongly influenced by latitude-dependent geomagnetic topology. At the Equator, where the magnetic field is weakest, electrons are largely unmagnetized with nearly isotropic mobility. At Millstone Hill, the strong, closed geomagnetic field results in higher electron magnetization and a relatively asymmetric charge distribution, while at Rothera the partially open field geometry produces intermediate plasma behavior. These findings underscore the critical role of geomagnetic topology in shaping ionospheric plasma dynamics, consistent with previous studies [23,24].
For reference, the LAP-CSES marks China’s first use of in situ measurement technology in space exploration. The CSES was launched on February 2018 in sun-synchronous orbit. The scientific objective of this mission is to monitor the ionospheric variations related to the seismic and space weather phenomena. The LAP on board CSES can measure the electron density () in the range of (), and the electron temperature () ranging from 500 to 10,000 K with a relative measurement accuracy of . It can also measure the potential of the spacecraft and its variations across a range of plasma densities and temperatures [25]. In Section 2, we describe the numerical technique, the plasma conditions, and the geometry that we used to simulate the interaction between the LAP and the ionosphere plasma. Examples of the LAP simulation results and relevant discussion are given in Section 3. Concluding remarks based on our analysis are given in Section 4.
2. LAP-CSES Geometry
The LAP onboard the CSES is made of three parts consisting of two sensors (Sensor 1 and Sensor 2), two extension bars and one electronic box as shown in Figure 1a.
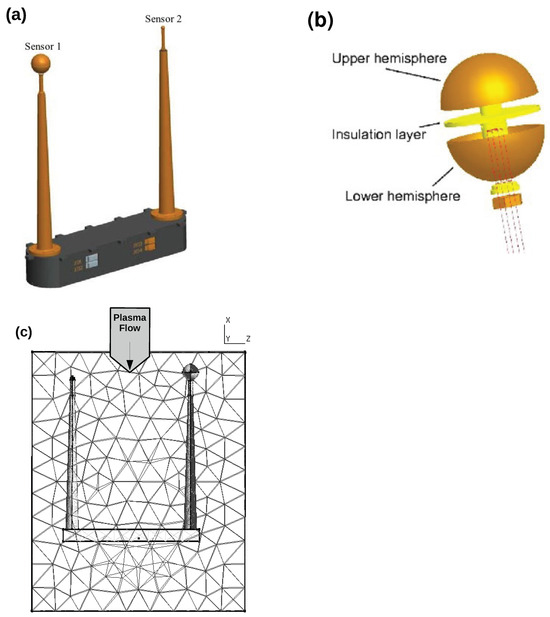
Figure 1.
Geometry of the LAP instrument (a) and the structure of the sensor (b) [26]. The simulation domain constructed with GMSH is shown in (c).
The two sensors held in the ram direction at the end of extension bars in order to minimize perturbation effects associated with the satellite. The size of the two sensors and the extension bars are given in Table 1.

Table 1.
Information about the LAP used on CSES system [25].
These sensors adopt a common configuration with an upper and a lower hemisphere such that the upper hemisphere is the collector and the lower hemisphere is the protective sensor, as shown in Figure 1b. Both collector and protector sensors are biased to the same sweep voltage. The protector is designed to eliminate the terminal effects of the traditional spherical structure to use the collector as an ideal structural model. Due to its high conductivity and low magnetic susceptibility, Titanium is used in the construction of LAP sensors. The TiN coating applied to the sensor’s surface ensures a consistent operating surface with strong resistance against atomic Oxygen corrosion. Details about the design of the LAP on the CSES is described in [25,26,27,28]. The LAP operates in survey mode with a sweeping period of 3 s to measure global electron density and temperature. The sweep voltage for Sensor 1 is −3 V to +3 V, while Sensor 2 is −6 V to +6 V relative to the spacecraft bus. The LAP current–voltage curve can be used to reliably derive the primary plasma parameters, including the electron temperature and density, as well as the plasma potential [25].
3. Methodology
Kinetic simulations of the interaction between CSES-LAP and plasma are performed using PTetra, a 3-D particle-in-cell (PIC) code by Marchand [29]. A brief description of PTetra is given here. PTetra is a computational framework for investigating satellite–plasma interactions in low Earth orbit using a fully kinetic PIC approach. Electrons and ions are advanced with their physical masses and charges, while Poisson’s equation is solved on an unstructured tetrahedral mesh to obtain self-consistent electrostatic fields. This approach allows accurate treatment of complex spacecraft geometries and adaptive refinement in regions with strong plasma gradients. Spacecraft components are modeled as distinct surfaces, enabling the evaluation of charge deposition, floating potentials, and mutual capacitances. The code includes photoelectron and secondary electron emission processes and supports a constant, uniform background magnetic field, though dynamic fields and collisions are not yet implemented. Its modular structure—relying on external tools for geometry, meshing, and postprocessing—keeps the PIC engine streamlined and adaptable. Parallelization via MPI ensures efficient scaling to millions of particles and mesh elements. These features establish PTetra as a robust tool for studying spacecraft charging, sheath formation, diagnostic perturbations, and instrument performance [29]. For each species of plasma, the code employs a completely kinetic model that includes each species’ unique physical charges and masses. It uses an unstructured tetrahedral mesh spatial discretization of space to accurately represent complex boundaries and realistic spacecraft geometry.
In the simulations, the geometry consists of a rectangular prism representing the electronics box, with two sensors mounted on posts extending approximately 50 cm in the ram direction. Each sensor is divided into an upper and lower hemisphere, separated by an insulating layer: the upper hemisphere acts as the collector, while the lower hemisphere serves as the protective sensor. The extension bars and electronics box are modeled as perfect conductors, represented by triangular surface meshes at the boundary as shown in Figure 1c. The mesh is adaptive, and the large triangles seen in Figure 1c are faces of tetrahedra at the boundary. The floating potential of bars and box, together with that of the spacecraft body, is computed self-consistently from the balance of collected electron and ion currents. To avoid boundary effects, the computational domain is chosen large enough to fully enclose the sheath and wake regions, typically extending 10–50 times the probe size or several Debye lengths in each direction. The mesh, created with Gmsh, an open-source finite element mesh generator by Geuzaine and Remacle [30], is shown in Figure 1c. PTetra uses non uniform tetrahedral mesh with finer mesh (about 4–5 mm) in the region of interest that is around the LAP and a coarser mesh (about 8 mm) farther away. The mesh resolution varies from approximately 4 mm on the Langmuir probes, to 1 mm on the extension bars, and 6 mm on the supporting electronics box. The outer boundary stretches outward in all directions from the satellite components for many Debye lengths. It consists of 317,871 vertices and approximately 1.32 million tetrahedral cells. A total of macro particles are used in the simulation domain to simulate the interactions between plasma and the LAP. The statistical weight of each macro-particle is automatically determined by PTetra from the physical plasma density and the domain volume, which in the present simulations corresponds to approximately 25. Initial distribution of the charged particles at time t = 0 is spatially uniform. At steady state, to improve statistical accuracy near the probe, the effective particle density is increased in its vicinity to ensure sufficient sheath statistics while maintaining computational efficiency. The code is designed to determine self-consistent electric fields by considering calculated volume charges and the deposition of charges on different components of satellites.
We conduct a parametric analysis to demonstrate the LAP sensitivity to the surrounding plasma environment in the equatorial zone, and at two mid-latitude locations that are magnetic conjugate of each other. These are Millstone Hill and Rothera , respectively. The simulations were made with different densities, temperatures, and ion compositions obtained from the International Reference Ionosphere (IRI) model, corresponding to ionospheric plasma at two different locations in northern/southern hemispheres that are magnetic conjugate of each other. Information about the background magnetic field at these sites is obtained from the IGRF model. The plasma parameters and geomagnetic field used in different simulations are given in Table 2. Simulations were run using certain plasma conditions to determine the current-voltage characteristics of the LAP. The floating potential was kept constant around −1 V while the voltages swept between –3 V to +3 V for Sensor 1, and –6 V to +6 V for Sensor 2 relative to the spacecraft bus. PTetra simulations were carried out to steady state for every bias voltage considered. These steady state currents were then used to compute the current-voltage characteristics of the LAP.
Table 2.
Simulation parameters and background magnetic fields used in the three cases.
4. Results and Discussion
In this section, PTetra simulation results of the LAP interaction with ionospheric plasma are discussed. These results correspond to the three sets of plasma conditions that the CSES encountered at the Equator, and two magnetic conjugate locations in the northern and southern hemispheres, as listed in Table 2.
4.1. Electrostatic Sheaths and Probes Wakes
Figure 2 and Figure 3 show the variations in the volume charge density and corresponding electrostatic potential profiles around the LAP obtained from PTetra simulations for floating, negatively and positively bias probes at Millstone Hill, the the Equator, and Rothera. The volume charge density distribution depends on the probe bias, plasma density, temperature, and the ambient magnetic field. In this context, the PIC simulation results in Figure 2a–i illustrate how the charge density around the LAP is modified under different bias conditions and plasma environments. In the floating potential case Figure 2a–c, which corresponds to the equilibrium state where electron and ion currents balance, the resulting charge distribution is relatively weak and symmetric. For a negatively biased probe as shown in Figure 2d–f, electrons are repelled from the surface, leading to a depletion of electron density and the accumulation of excess positive ions in the near-probe region. This produces a sheath dominated by positive space charge. In contrast, for a positively biased probe as shown in Figure 2g–i, electrons are strongly attracted, creating an electron-rich sheath with negative space charge surrounding the probe. The magnitude and spatial extent of these charge density perturbations depend on the local plasma conditions at Millstone Hill, the Equator, and Rothera. At low latitudes, where plasma density and temperature are higher, the sheaths are thinner and more confined. At high latitudes, where the plasma is less dense and colder, the charge distributions are more extended. As mentioned above, the floating potential is the surface potential at equilibrium when electron and ion currents balance and the net current to the surface of the probe is zero [31]. The ambient electrons have a higher thermal speed than the plasma flow speed as given in Table 3. In Table 3, the drift velocity denotes the bulk plasma motion arising from the ambient electric and magnetic fields. It is identical for electrons and ions and distinct from their thermal velocities. The high mobility of electrons compared to ions causes the probes to have a negative floating potential as shown in Figure 2a–c.
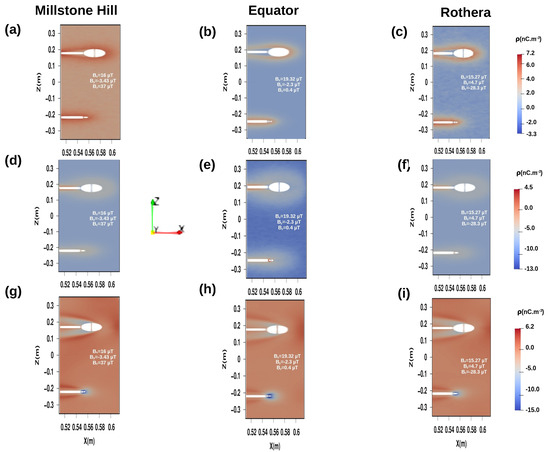
Figure 2.
Volume charge density variations around floating, strongly negative and positive bias LAP obtained from PTetra simulations for Millstone Hill (a,d,g), the Equator (b,e,h), and Rothera (c,f,i). In each panel, the background plasma density is uniform and quasi-neutral, and the differences in background shading are an artifact of color scaling rather than a physical effect.
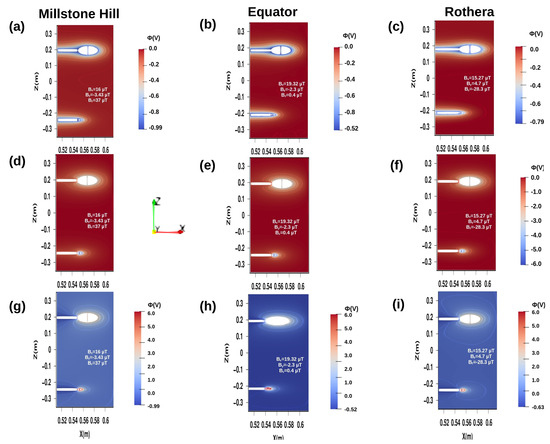
Figure 3.
Electrostatic sheath around floating, strongly negative and positive bias LAP obtained from PTetra simulations for Millstone Hill (a,d,g), the Equator (b,e,h), and Rothera (c,f,i). The apparent variations in the background are caused by the individual scaling of each panel, which was chosen to emphasize the sheath structures.
Table 3.
Physical quantities used to explain the simulation results.
When a probe is charged or biased, particles with the same charge are repelled, while those with the opposite charge are attracted. Outside the sheath, a presheath sustains the quasi-neutrality. Particles in the presheath will accelerate toward the probe due to pressure gradients. The sheath edge refers to the point where charge neutrality breaks down. Charged particles penetrate the sheath edge with a velocity greater than the Bohm velocity which is given as [32]:
where k is the Boltzmann constant, is the ion mass, and is the plasma temperature The sheath thickness can be determined by the Debye length , where is the permittivity of vacuum, e is the elementary charge, and is the background plasma density. Aside from direct collection of electrons and ions from the ambient plasma, several other phenomena, such as photo-emission, field-emission, thermionic-emission, and secondary electron emission due to electron, ion, or neutral bombardment, influence current balance and hence determine the floating potential. For simplicity, we ignore these factors and only consider the direct accumulation of electrons and positive ions by the probe [33].
Numerous numerical studies on a spherical object examined the effect of a magnetic field on the floating potential. For example, Darian et al. [19] show that the magnetic field parallel to the payload axis reduces the overall electron influx and significantly decreases the negative floating potential of the rocket. Marchand [29] also presented PIC simulations of a spherical object in the presence of a magnetic field perpendicular to the plasma flow, to show that the floating potential becomes less negative. As can be seen in Figure 3, our analysis reveals that the floating potential of the probes at Millstone Hill is more negative than Rothera’s and the Equator. The geographical location of the satellite within the ionosphere can affect the floating potential due to differences in the ionospheric plasma conditions and the geomagnetic field. Figure 3 shows that the interaction between differentially biased probes and the surrounding plasma also leads to the formation of negative electron and positive ion sheaths around the probes. In this context, Figure 3d–i shows the electrostatic sheath profiles surrounding the strong negatively and positively bias probes at the three locations. A positive ion sheath is more likely to form with a negatively biased probe due to lower mass and much higher mobility of the electrons. On the other hand, a negative electron sheath can be seen around positively biased probe. The ratio of probe radius-to-electron Debye length () is a crucial parameter that determines the sheath limit around the probe. For instance, a thick sheath is formed when , and a thin sheath is formed when . In the thick sheath limit, not all particles entering the sheath are collected by the probe. Instead, the collection of individual particles depends on their impact parameter which determines the orbital motion of particles intersecting the surface of the probe. Because of this, the thick sheath limit is also known as the Orbit Motion Limit (OML) theory [32]. A sheath of varying thickness forms around Sensor 1 in all three cases. However, a thick sheath always forms around Sensor 2. Table 4 shows values derived for Sensor 1 in three different scenarios. Several studies have been conducted to study the effect of the external magnetic field on the sheath formation around the probe. In the absence of a magnetic field, the charged particles are isotropically attracted or repelled by the probe’s potential. A uniform distribution of the sheath results from the particle orbits being equally distributed around the probe in all dimensions. In the presence of a magnetic field, the magnetized particles are forced to orbit the probe while also gyrating along the magnetic field lines. This leads to an asymmetric sheath around the probe [29,34]. The magnetic field at Millstone Hill is stronger than at its conjugate location, Rothera. A higher magnetic field increases the electron gyro-frequency, leading to stronger electron magnetization. In this case, the motion of electrons perpendicular to the magnetic field lines is constrained, while the heavier ions remain largely unconfined. This difference between electron and ion mobility produces an asymmetric charge density distribution around the probe, as the sheath and the wake structures become more strongly aligned with the magnetic field direction. In contrast, the weaker magnetic field at Rothera reduces electron magnetization, allowing electrons to move more freely across field lines and resulting in a comparatively more symmetric charge distribution. The resulting negative electron sheath around the probe is non uniform. However, at the Equator, electrons are highly unmagnetized and can flow freely in all directions. Isotropic electron mobility causes smooth and uniform charge density gradients in the vicinity of the probe. This results in a symmetric electrostatic sheath around the probe.
Table 4.
Debye Length (), the Sheath type (), the slope (m), the Pearson’s correlation coefficient (r) between PTetra simulation current and in situ measurements of Sensor 1 along CSES Orbit-026610.
Figure 4 shows the variations in the ion density around the LAP in three scenarios: floating, negative, and positive bias probes. In the ionosphere, the LAP moves at approximately the spacecraft’s orbital speed relative to the stationary ambient plasma, creating an ion void behind the probe. The accepted Langmuir probe theories in isotropic, non-flowing plasma do not apply to these conditions. Physical parameters such as probe size, biasing, and Mach number () where is the ion acoustic speed. Darian et al. [19] determine the extent of the wake behind the probe. The self-the wake or ion depletion behind the probes is caused by supersonic relative speeds () between the spacecraft and the surrounding plasma ions. In addition to M, the probe potential influences the probe’s self-the wake. Panels in Figure 4 show the different types of wakes that occur for different bias voltages. When the probes are positively biased to +6 V, the probe strongly repels the incoming ions with a kinetic energy of 0.11 eV. This increases its effective cross section, which, in turn, causes the large density depletion shown in panels g, h, and i. With the slightly negative floating potential as shown in Figure 4a–c, ions are attracted by the probe, which results in a shorter wake with a much reduced density depletion. However, with a strong negative bias voltage of −6 V, ions are strongly attracted by the probe, which results in a much reduced density depletion region behind the probe. Another point worth noting is the ion density increase when downstream of the small density depletion. This results from the attractive force on incoming ions, which focuses them downstream. Figure 4a–c shows that the floating probes have small ion void zones behind them.
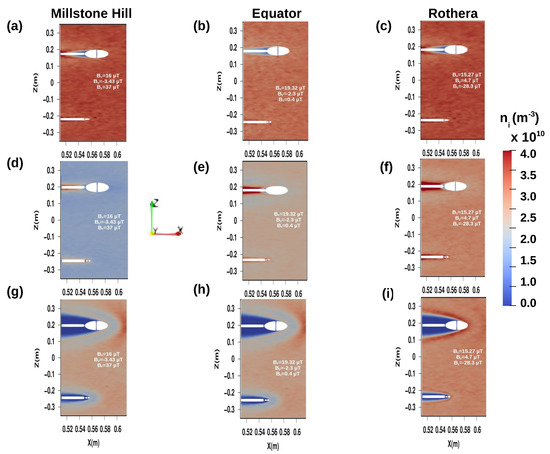
Figure 4.
Ion density variations around floating, strongly negative and positive bias LAP obtained from PTetra simulations for Millstone Hill (a,d,g), the Equator (b,e,h), and Rothera (c,f,i). The apparent variations in the background are caused by the individual scaling of each panel, which was chosen to emphasize the wake structures.
However, greater self-wakes are observed for probes with stronger positive biases at Millstone Hill, the Equator, and Rothera, as illustrated in Figure 4g–i. Lafleur [33] provides examples of ion trajectories for positively and negatively charged objects, demonstrating distinct behavior. In the positively charged instance, ions are repelled off the sphere, and if the potential is high enough, they never reach the surface. Ions with a low initial impact parameter experience a significant momentum change, while those with a larger impact parameter deflect at shallower angles. The sphere does not experience high-angle deflections or partial orbiting, resulting in ’shadow wake’ that is, without ions. In the negative-charged situation, ions at higher impact parameters are redirected inward and experience large-angle scattering due to partial orbiting, resulting in a complicated wake pattern. In addition to the Mach number, the dependence of wake formation on the electron-to-ion temperature ratio is also observed in unmagnetized wakes [35,36]. Moreover, the orientation of an external magnetic field is expected to restrict the plasma dynamics, leading to modifications in currents to the object’s surface and altering wake formation in flowing plasmas due to magnetized electrons and/or ions [19]. However, in our scenario, the impact of magnetic field orientation on the ions’ wake is negligible because of the highly unmagnetized ions conditions at the three locations.
4.2. I-V Characteristics
The current-voltage characteristics of Sensor 1 and Sensor 2 of LAP are shown in Figure 5a,d.
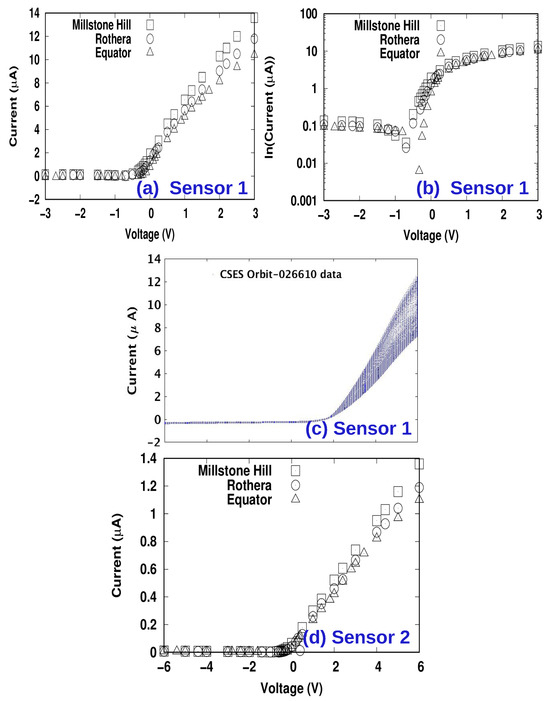
Figure 5.
The PTetra simulation current for Sensor 1 is displayed in (a), along with the same on a logarithmic scale in (b), the in situ data from CSES Orbit-026610 in (c), and the PTetra simulation current for Sensor 2 at the three locations—Millstone Hill (), Rothera (), and the Equator() is shown in (d).
A typical I-V curve consists of three main regions: the ion saturation, the electron retardation, and the electron saturation regions. The probes’ collected current can be approximated by a thin or thick sheath. As mentioned above, the sheath limit or thin sheath approximation is used when the sheath size is small compared to the probe size (), and the thick sheath when the sheath size is much larger than the probe size () [32]. In our study, is 1.56, 1.09, and 0.96 which correspond to the thin, intermediate, and thick sheath regimes, respectively, for Sensor 1. In thin sheath limit, for spherical probe, all particles passing through the sheath are collected by the probe, and the electron saturation current becomes:
where is the radius of the spherical probe, and is the electron velocity. In thick sheath regime, the particles follow hyperbolic trajectories around the probe. According to OML theory, the electron saturation current is given by [32]:
where is the probe potential relative to the background plasma and is the electron temperature. For spherical probe, , and in reality, it should be empirically fitted, and this is only true for a collisionless, non-drifting, Maxwellian distributed, and non-magnetized plasma [37]. Brask et al. [34] reported that the Orbit Motion Limit (OML) is an accurate approximation with for spherical probes.
The current in the electron retardation region corresponding to the exponential part of the I-V curve for the electrons following a Maxwellian distribution is obtained from equation [25]:
where is the electron current at the inflection point of the electron retardation region and electron saturation region. Because of the larger collection area, the current collected by Sensor 1 would be much larger than the current collected by Sensor 2 as shown in Figure 5a,d. On CSES, Sensor 1 is employed to measure plasma density and temperature, and Sensor 2 is used as backup. The semi-logarithmic plot shows a linear relationship between the probe current and bias voltage that is:
The slope () of this line is proportional to , and gives a good estimate of the electron temperature that is [25]:
The electron temperature is an important parameter that may affect the Langmuir probe’s ability to collect electron current, which alters the shape of the I-V curve. For instance, a lower electron temperature results in a steeper slope (or higher electron current), whereas a higher electron temperature results in a shallower slope (smaller electron current). The current’s semi-logarithmic plot shown in Figure 5b reveals a greater slope for Millstone Hill and Rothera, but a smaller slope for the Equator. The slopes obtained for the three cases are given in Table 4.
This is consistent with the OML theory. In OML, for a positively bias probe if , the electron current scales as ; that is, the current decreases as increases (see Equation (4)). The electron density is given by [25]:
Also, a simplified expression for ion saturation current is given by [20]:
where is the drift velocity and is the effective mass of the ion species.
In addition, the ratio of gyro-radii () of the charged species to probe radius () becomes more significant in the presence of magnetic field [8]. The electrons’ gyro-radius is smaller than the probe radius and the magnetic field significantly affects the electron current towards the surface of the probe. In this context, the comparison of the I-V curves of the individual sensor at Millstone Hill, the Equator, and Rothera is shown in Figure 5a. The two sensors collect a larger electron current at Millstone Hill compared to the Equator and Rothera. However, the ions’ gyro-radius is several orders of magnitude greater than the probe radius, and their dynamics is least affected by the magnetic field. This effect can be seen in the ion saturation current of the two sensors at the three geographical locations. Figure 5b shows the current measurements of Sensor 1 along the CSES Orbit-026610. PIC simulations and in situ measurements were compared using Pearson’s correlation coefficient (r). Table 4 illustrates values of r found for each example. The findings indicate a moderate-to-strong positive correlation () between simulated current and in situ measurements at the Equator and Rothera. Millstone Hill has a lower positive correlation () between model and observed currents. The correlation is expected to be smaller for longer Debye lengths.
5. Summary/Conclusions
This study presents PTetra-based Particle-in-Cell (PIC) simulations of hemispherical Langmuir probes under realistic plasma conditions at three geophysical locations: Millstone Hill, the Equator, and Rothera. Our findings shed light on how plasma parameters and magnetic fields influence probe behavior, charge distribution, and plasma measurement accuracy. A higher temperature increases electron and ion thermal velocities, causing particles to move faster around the probe. This results in changes in the sheath structure and the shape of the current-voltage characteristics by influencing the current collected by the probe. The sheath around the probe expands as the temperature of the particles increases, potentially leading to more uncertainity by introducing a spatially wider interaction region with the surrounding plasma. Also, a high plasma temperature makes the floating potential become more negative as shown by Millstone Hill and Rothera. The presence of a magnetic field can add further complexity in the sheath structure by modifying the dynamics of charged particles. Strong magnetic fields can change the symmetry of the sheath around a hemispherical probe, depending on whether the magnetic field is parallel or perpendicular to the probe’s surface. Perpendicular magnetic fields compress the sheath in the field direction, but parallel fields elongate the sheath by altering particle trajectories. Millstone Hill and Rothera exhibit strong sheath compression, whereas an elongated sheath appears at the Equator. The electrons are more affected by the magnetic field than ions, causing a gyro motion that alters the effective current collected by the probe, influencing the probe’s inference of electron density and temperature. Furthermore, the sheath structure influences the Pearson’s correlation coefficient (r) between simulated probe currents and in situ measurements. A thinner and more symmetric sheath typically produces better matching patterns between PIC and in situ data, increasing the reliability of plasma diagnostics. The study provides insight into the LAP response to temperature- and magnetic field-dependent variations that affect sheath structures and current collection and, consequently, the inferred plasma parameters in different parts of the ionosphere. Our findings reveal the limitations of simplified analytic models in space plasma diagnostics and support the use of kinetic simulations in interpreting Langmuir probe data, especially for spacecraft missions operating in magnetized, flowing plasmas. These results may be helpful in improving data inversion techniques and optimizing future probe designs for space-based ionospheric diagnostics.
Author Contributions
Conceptualization, N.I. and R.M.; methodology, N.I., S.U.R. and L.C.; software, R.M.; validation, N.I., S.U.R. and R.Y.; formal analysis, N.I.; investigation, N.I.; resources, R.M.; data curation, L.C. and R.Y.; writing—original draft preparation, N.I.; writing—review and editing, N.I., S.U.R. and R.M.; visualization, N.I., L.C. and R.Y. All authors have read and agreed to the published version of the manuscript.
Funding
This research received no external funding.
Institutional Review Board Statement
Not applicable.
Informed Consent Statement
Not applicable.
Data Availability Statement
Not applicable.
Acknowledgments
We wish to acknowledge the support of the Digital Research Alliance of Canada in using computational resources to carry out parallel computations to study CSES-LAP simulations. The authors acknowledge the use of OpenAI assistance to improve the clarity and grammar of the manuscript.
Conflicts of Interest
The authors declare no conflicts of interest.
References
- Schunk, R.W.; Nagy, A.F. Ionospheres: Physics, Plasma Physics, and Chemistry; Cambridge Atmospheric and Space Science Series; Cambridge University Press: Cambridge, UK, 2000; pp. 464–488. [Google Scholar]
- Velásquez-García, L.F.; Izquierdo-Reyes, J.; Kim, H. Review of in-space plasma diagnostics for studying the Earth’s ionosphere. J. Phys. D Appl. Phys. 2022, 55, 263001. [Google Scholar] [CrossRef]
- Chen, F. Introduction to Plasma Physics, 2nd ed.; Plenum Press: New York, NY, USA, 1984. [Google Scholar]
- Langmuir, I. Positive ion currents from the positive column of mercury arcs. Science 1923, 58, 290. [Google Scholar] [CrossRef]
- Reifman, A.; Dow, W.G. Dynamic probe measurements in the ionosphere. Phys. Rev. 1949, 76, 987. [Google Scholar] [CrossRef]
- Spencer, N.W.; Brace, L.H.; Carignan, G.R.; Taeusch, D.R.; Niemann, H.B. Electron and molecular nitrogen temperature and density in the thermosphere. J. Geophys. Res. 1965, 70, 2665–2698. [Google Scholar] [CrossRef]
- Lebreton, J.P.; Stverak, S.; Travnicek, P.; Maksimovic, M.; Klinge, D.; Merikallio, S.; Lagoutte, D.; Poirier, B.; Blelly, P.L.; Kozacek, Z.; et al. The ISL Langmuir probe experiment processing onboard DEMETER: Scientific objectives, description, and first results. Planet. Space Sci. 2006, 54, 472–486. [Google Scholar] [CrossRef]
- Samaniego, J.I.; Yeo, L.H.; Wang, X. A double hemispherical probe for characterizing and minimizing the self-the wake effects on probe measurements. J. Geophys. Res. Space Phys. 2020, 125. [Google Scholar] [CrossRef]
- Jao, C.S.; Marholm, S.; Spicher, A.; Miloch, W.J. The wake formation behind Langmuir probes in ionospheric plasmas. Adv. Space Res. 2022, 69, 856–868. [Google Scholar] [CrossRef]
- Marchand, R. Ionospheric Langmuir Probe Electron Temperature Asymmetry and Magnetic Field Connectivity. IEEE Trans. Plasma Sci. 2017, 45, 1923–1926. [Google Scholar] [CrossRef]
- Imtiaz, N.; Marchand, R.; Rizvi, H. Effect of magnetic connectivity on CubeSat needle probe measurement. Astrophys. Space Sci. 2022, 367, 49. [Google Scholar] [CrossRef]
- Olowookere, A.; Marchand, R. Density–temperature constraint from fixed-bias spherical Langmuir probes. IEEE Trans. Plasma Sci. 2021, 49, 1997. [Google Scholar] [CrossRef]
- Séran, S.; Berthelier, J.J.; Saouri, F.Z.; Lebreton, J.P. The spherical segmented Langmuir probe in a flowing thermal plasma: Numerical model of the current collection. Ann. Geophys. 2005, 23, 1723–1733. [Google Scholar] [CrossRef][Green Version]
- Imtiaz, N.; Marchand, R.; Lebreton, J.P. Modeling of current characteristics of segmented Langmuir probe on DEMETER. Phys. Plasmas 2013, 20, 052903. [Google Scholar] [CrossRef]
- Laframboise, J.G. Theory of Spherical and Cylindrical Langmuir Probes in a Collisionless, Maxwellian Plasma at Rest. Ph.D. Thesis, University of Toronto, Toronto, ON, Canada, 1966. [Google Scholar]
- Imtiaz, N.; Marchand, R. Particle-in-cell modeling of dual segmented Langmuir probe on Proba2. Astrophys. Space Sci. 2015, 360, 15. [Google Scholar] [CrossRef]
- Olowookere, A.; Marchand, R. A new technique to infer plasma density, flow velocity, and satellite potential from ion currents collected by a segmented Langmuir probe. IEEE Trans. Plasma Sci. 2022, 50, 3774. [Google Scholar] [CrossRef]
- Hoegy, W.R.; Brace, L.H. Use of Langmuir probes in non-Maxwellian space plasmas. Rev. Sci. Instrum. 1999, 70, 3015. [Google Scholar] [CrossRef]
- Darian, D.; Marholm, S.; Mortensen, M.; Miloch, W.J. Theory and simulations of spherical and cylindrical Langmuir probes in non-Maxwellian plasmas. Plasma Phys. Control. Fusion 2019, 61, 085025. [Google Scholar] [CrossRef]
- Resendiz Lira, P.A.; Marchand, R. Simulation inference of plasma parameters from Langmuir probe measurements. Earth Space Sci. 2021, 8, 795. [Google Scholar] [CrossRef]
- Marchand, R.; Shahsavani, S.; Sanchez-Arriaga, G. Beyond analytic approximations with machine learning inference of plasma parameters and confidence intervals. J. Plasma Phys. 2023, 89, 905890111. [Google Scholar] [CrossRef]
- Brask, S.M.; Marholm, S.; Di Mare, F.; Adhikari, S.; Spicher, A.; Takahashi, T.; Miloch, W.J. Electron–neutral collisions effects on Langmuir probe in the lower E-region ionosphere. Phys. Plasmas 2022, 29, 033511. [Google Scholar] [CrossRef]
- Akasofu, S.I.; Kang, S. Physics of Auroral Arc Formation; Geophysical Monograph Series; American Geophysical Union: Washington, DC, USA, 1981; Volume 25. [Google Scholar]
- Wagner, J.S.; Sydora, R.D.; Tajima, T.; Hallinan, T.; Lee, L.C.; Akasofu, S.I. Small-scale Auroral Arc Deformations. J. Geophys. Res. 2021, 126, e2021JA029999. [Google Scholar] [CrossRef]
- Yan, R.; Guan, Y.; Shen, X.; Huang, J.; Zhang, X.; Liu, C.; Liu, D. The Langmuir probe onboard CSES: Data inversion analysis method and first results. Earth Planet. Phys. 2018, 2, 479. [Google Scholar] [CrossRef]
- Liu, Y.; Guan, C.; Zhang, A.; Piero, D.; Sun, Y. The Technology of Space Plasma In-Situ Measurement on the China Seismo-Electromagnetic Satellite. Sci. China Technol. Sci. 2019, 62, 829–838. [Google Scholar] [CrossRef]
- Guan, Y.b.; Wang, S.j.; Liu, C.; Feng, Y.b. The design of the Langmuir probe onboard a seismo-electromagnetic satellite. In Proceedings of the International Symposium on Photoelectronic Detection and Imaging 2011: Space Exploration Technologies and Applications, Beijing, China, 24–26 May 2011; Volume 8196, p. 819624. [Google Scholar] [CrossRef]
- Liu, Y.; Guan, C.; Zhang, A.; Zheng, X.; Sun, Y. The Ionosphere Measurement Technology of Langmuir Probe on China Seismo-Electromagnetic Satellite. Acta Phys. Sin. 2016, 65, 189401. (In Chinese) [Google Scholar] [CrossRef]
- Marchand, R. PTetra, a tool to simulate low orbit satellite–plasma interaction. IEEE Trans. Plasma Sci. 2012, 40, 217–229. [Google Scholar] [CrossRef]
- Geuzaine, C.; Remacle, J.F. GMSH: A 3-D finite element mesh generator with built-in pre- and post-processing facilities. Int. J. Numer. Methods Eng. 2009, 79, 1309. [Google Scholar] [CrossRef]
- Whipple, E.C. Potentials of surfaces in space. Rep. Prog. Phys. 1981, 44, 1197–1250. [Google Scholar] [CrossRef]
- Kjølerbakken, K.M.; Miloch, W.J.; Røed, K. Sheath formation time for spherical Langmuir probes. J. Plasma Phys. 2023, 89, 905890102. [Google Scholar] [CrossRef]
- Lafleur, T. Charged aerodynamics: Ionospheric plasma drag on objects in low-earth orbit. Acta Astronaut. 2023, 212, 370. [Google Scholar] [CrossRef]
- Brask, S.M.; Mishra, R.; Holen, G.; Miyake, Y.; Usui, H.; Miloch, W.J. Spherical Langmuir probes in magnetized plasma. A model based on particle-in-cell simulations. Phys. Plasmas 2024, 31, 023506. [Google Scholar] [CrossRef]
- Okada, Y.O.; Matsumoto, M. Computer experiments of spacecraft-plasma interactions in a dilute and high-βe plasma with a fast plasma flow. J. Geophys. Res. 1995, 100, 21549–21559. [Google Scholar] [CrossRef]
- Miloch, W.J. Numerical simulations of dust charging and the wakefield effects. J. Plasma Phys. 2014, 80, 795. [Google Scholar] [CrossRef]
- Marholm, S.; Marchand, R. Finite-length effects on cylindrical Langmuir probes. Phys. Rev. Res. 2020, 2, 023016. [Google Scholar] [CrossRef]


Disclaimer/Publisher’s Note: The statements, opinions and data contained in all publications are solely those of the individual author(s) and contributor(s) and not of MDPI and/or the editor(s). MDPI and/or the editor(s) disclaim responsibility for any injury to people or property resulting from any ideas, methods, instructions or products referred to in the content. |
© 2025 by the authors. Licensee MDPI, Basel, Switzerland. This article is an open access article distributed under the terms and conditions of the Creative Commons Attribution (CC BY) license (https://creativecommons.org/licenses/by/4.0/).