Abstract
The blood–brain barrier (BBB) limits drug delivery to the brain, particularly for large or hydrophilic molecules. Brain microvascular endothelial cells (bEND.3), which form part of the BBB, play a critical role in regulating drug uptake. This study investigates the use of cold atmospheric microplasma (CAM) to enhance membrane permeability and facilitate drug delivery in bEND.3 cells. CAM generates reactive oxygen species (ROS) that modulate membrane properties. We exposed bEND.3 cells to CAM at varying voltages (3, 3.5, 4, and 4.5 kV) and measured drug uptake using the fluorescent drug FD-150, fluorescence intensity, ROS levels, membrane lipid order, and membrane potential. The results showed a significant increase in fluorescence intensity and drug concentration in the plasma-treated cells compared to controls. ROS production, measured by DCFH-DA staining, was higher in the plasma-treated cells, supporting the hypothesis that CAM enhances membrane permeability through ROS-induced changes. Membrane lipid order, assessed using the LipiORDER probe, shifted from the liquid-ordered (Lo) to liquid-disordered (Ld) phase, indicating increased membrane fluidity. Membrane depolarization was detected with DisBAC2(3) dye, showing increased fluorescence in the plasma-treated cells. Cell viability, assessed by trypan blue and LIVE/DEAD™ assays, revealed transient damage at higher voltages (≥4 kV), with recovery after 24 h. These results suggest that CAM enhances drug delivery in bEND.3 cells by modulating membrane properties via ROS production and changes in membrane potential. CAM offers a promising strategy for improving drug delivery to the brain, with potential applications in brain-targeted therapies.
1. Introduction
The blood–brain barrier (BBB) is a highly selective physiological barrier that protects the brain from harmful substances while regulating the transport of essential nutrients and molecules [1]. While it effectively shields the brain from harmful agents, its selective permeability presents a significant challenge for delivering therapeutic compounds to treat neurological disorders [2,3].
Various strategies have been explored to enhance drug transport across the BBB, with recent research shifting focus toward the endothelial cells that form this barrier—specifically, brain microvascular endothelial cells (bEND.3) [3,4,5,6].
These cells are not only a pivotal part of the BBB but also offer an ideal in vitro model to study membrane permeability and the mechanisms of drug uptake into the brain. The bEND.3 cell line, derived from brain microvascular endothelial cells, is widely used to model the physiological properties of the BBB in vitro [7,8,9].
However, due to the restrictive nature of these cells’ membrane properties, traditional methods of drug delivery face significant challenges. The tightness of cell membranes in bEND.3 cells limits the diffusion of drugs, making it difficult for therapeutic agents to enter the cells effectively. This poses an obstacle to delivering brain-targeted drugs that are intended to treat conditions such as neurodegenerative diseases, brain cancers, and other central nervous system disorders [9,10,11,12].
Therefore, finding methods to enhance the permeability of the bEND.3 cell membrane, allowing for more effective drug uptake, is essential for advancing drug delivery strategies to the brain.
One promising approach is the use of cold atmospheric microplasma (CAM), a novel technology capable of temporarily altering membrane properties. CAM is a non-thermal ionized gas that generates reactive oxygen and nitrogen species (ROS and RNS) when exposed to atmospheric pressure. These reactive species interact with cellular structures, inducing reversible changes in membrane permeability. Research suggests that CAM increases cell membrane fluidity, facilitating the uptake of various molecules, including drugs. This property makes CAM a valuable tool for overcoming drug delivery barriers at the cellular level [13,14,15,16].
In recent years, researchers have explored CAM’s ability to induce reversible membrane alterations. ROS can disrupt the lipid organization of the cell membrane [17], leading to increased fluidity and the formation of transient pores through which drugs can enter the cells more easily [18]. This effect is particularly important for enhancing the delivery of large or hydrophilic drugs that would otherwise struggle to pass through the restrictive membranes of bEND.3 cells.
To address the challenges of drug delivery in brain microvascular endothelial cells (bEND.3), this study explores the potential of cold atmospheric microplasma (CAM) to transiently modulate cell membrane properties, enhancing intracellular drug uptake. We hypothesize that CAM exposure increases membrane permeability in bEND.3 cells by generating reactive oxygen species (ROS), altering membrane lipid order, and inducing membrane depolarization. To test this, we evaluated drug uptake, ROS production, membrane potential changes, and lipid order modifications following CAM treatment at different voltages. This study aims to establish CAM as a non-invasive strategy to facilitate drug delivery into brain endothelial cells, potentially broadening its applications in brain-targeted therapies.
2. Materials and Methods
2.1. Materials
Immortalized brain endothelial cells (bEnd.3 [BEND3] (ATCC®CRL-2299™, Manassas, VA, USA) were purchased from American Type Culture Collection, Manassas, VA, USA.
Dulbecco’s Modified Eagle Medium (DMEM) and phosphate-buffered saline (PBS) were purchased from Shimadzu Diagnostics Corporation (Tokyo, Japan).
L-glutamine, penicillin/streptomycin, 0.25 w/v% Trypsin-1 mM EDTA.4Na solution (with phenol red), NaHCO3, and insulin (human recombinant) were purchased from FUJIFILM Wako Pure Chemical Corporation (Osaka, Japan).
Fetal bovine serum (FBS) of Australian origin (triple 0.1 µm sterile filtered) was acquired from Serana Europe GmbH (Pessin, Germany).
Some 60 × 15 mm tissue culture dishes were obtained (Violamo, Osaka, Japan).
A humidified cell culture incubator was acquired (E-22, As One).
Dojindo’s ROS Assay Kit-Highly Sensitive DCFH-DA was purchased from DOJINDO LABORATORIES (dojindo.co.jp), Kumamoto, Japan.
Fluorescein isothiocyanate dextran (FD-150) was purchased from TdB Labs, Upsala, Sweden. A microplate reader was also acquired (Spectra Fluor Plus, Tecan, Mennedorf, Switzerland).
Keyence Florescence Microscope All-in-one BZ-x800 was purchased from Keyence Corporation, Osaka, Japan.
Trypan blue was purchased from Sigma Aldrich, Darmstadt, Germany.
Cell counter (Countess) was purchased from ThermoFisher Scientific, Waltham, MA, USA.
LIVE/DEAD™ Fixable Red Dead Cell Stain Kit was purchased from ThermoFisher Scientific, USA.
LipiORDER dye was obtained from Funakoshi Co., Ltd., Tokyo, Japan.
2.2. Cell Culture
The immortalized brain endothelial cells (bEnd.3 [BEND3], ATCC® CRL-2299™) were cultured in Dulbecco’s Modified Eagle Medium (DMEM) supplemented with 10% fetal bovine serum (FBS), 1% penicillin/streptomycin, 1% 200 mM L-glutamine, 1.6 g/L sodium bicarbonate (NaHCO3), and 4 µg/mL insulin. The cells were maintained in T75 culture flasks under controlled conditions, including a humidified incubator set at 37 °C with 5% carbon dioxide (CO2) and 90% humidity. To support optimal cell proliferation, the culture medium was refreshed every two days.
For experiments requiring a confluent monolayer, the bEnd.3 cells were seeded onto 60 × 15 mm tissue culture dishes (Violamo) containing 3 mL of DMEM. The cultures were incubated at 37 °C in a 5% CO2 environment within a humidified cell culture incubator (E-22, As One). After 24 h, the cells adhered to the surface of the culture plates, at which point the DMEM was carefully replaced with a fresh medium. To sustain cell growth and viability, the culture medium was renewed every two days until confluence was reached, after which it was changed twice a week for maintenance.
2.3. Plasma Set-Up
Dielectric Barrier Discharge (DBD) as a plasma-generating method was utilized in this study.
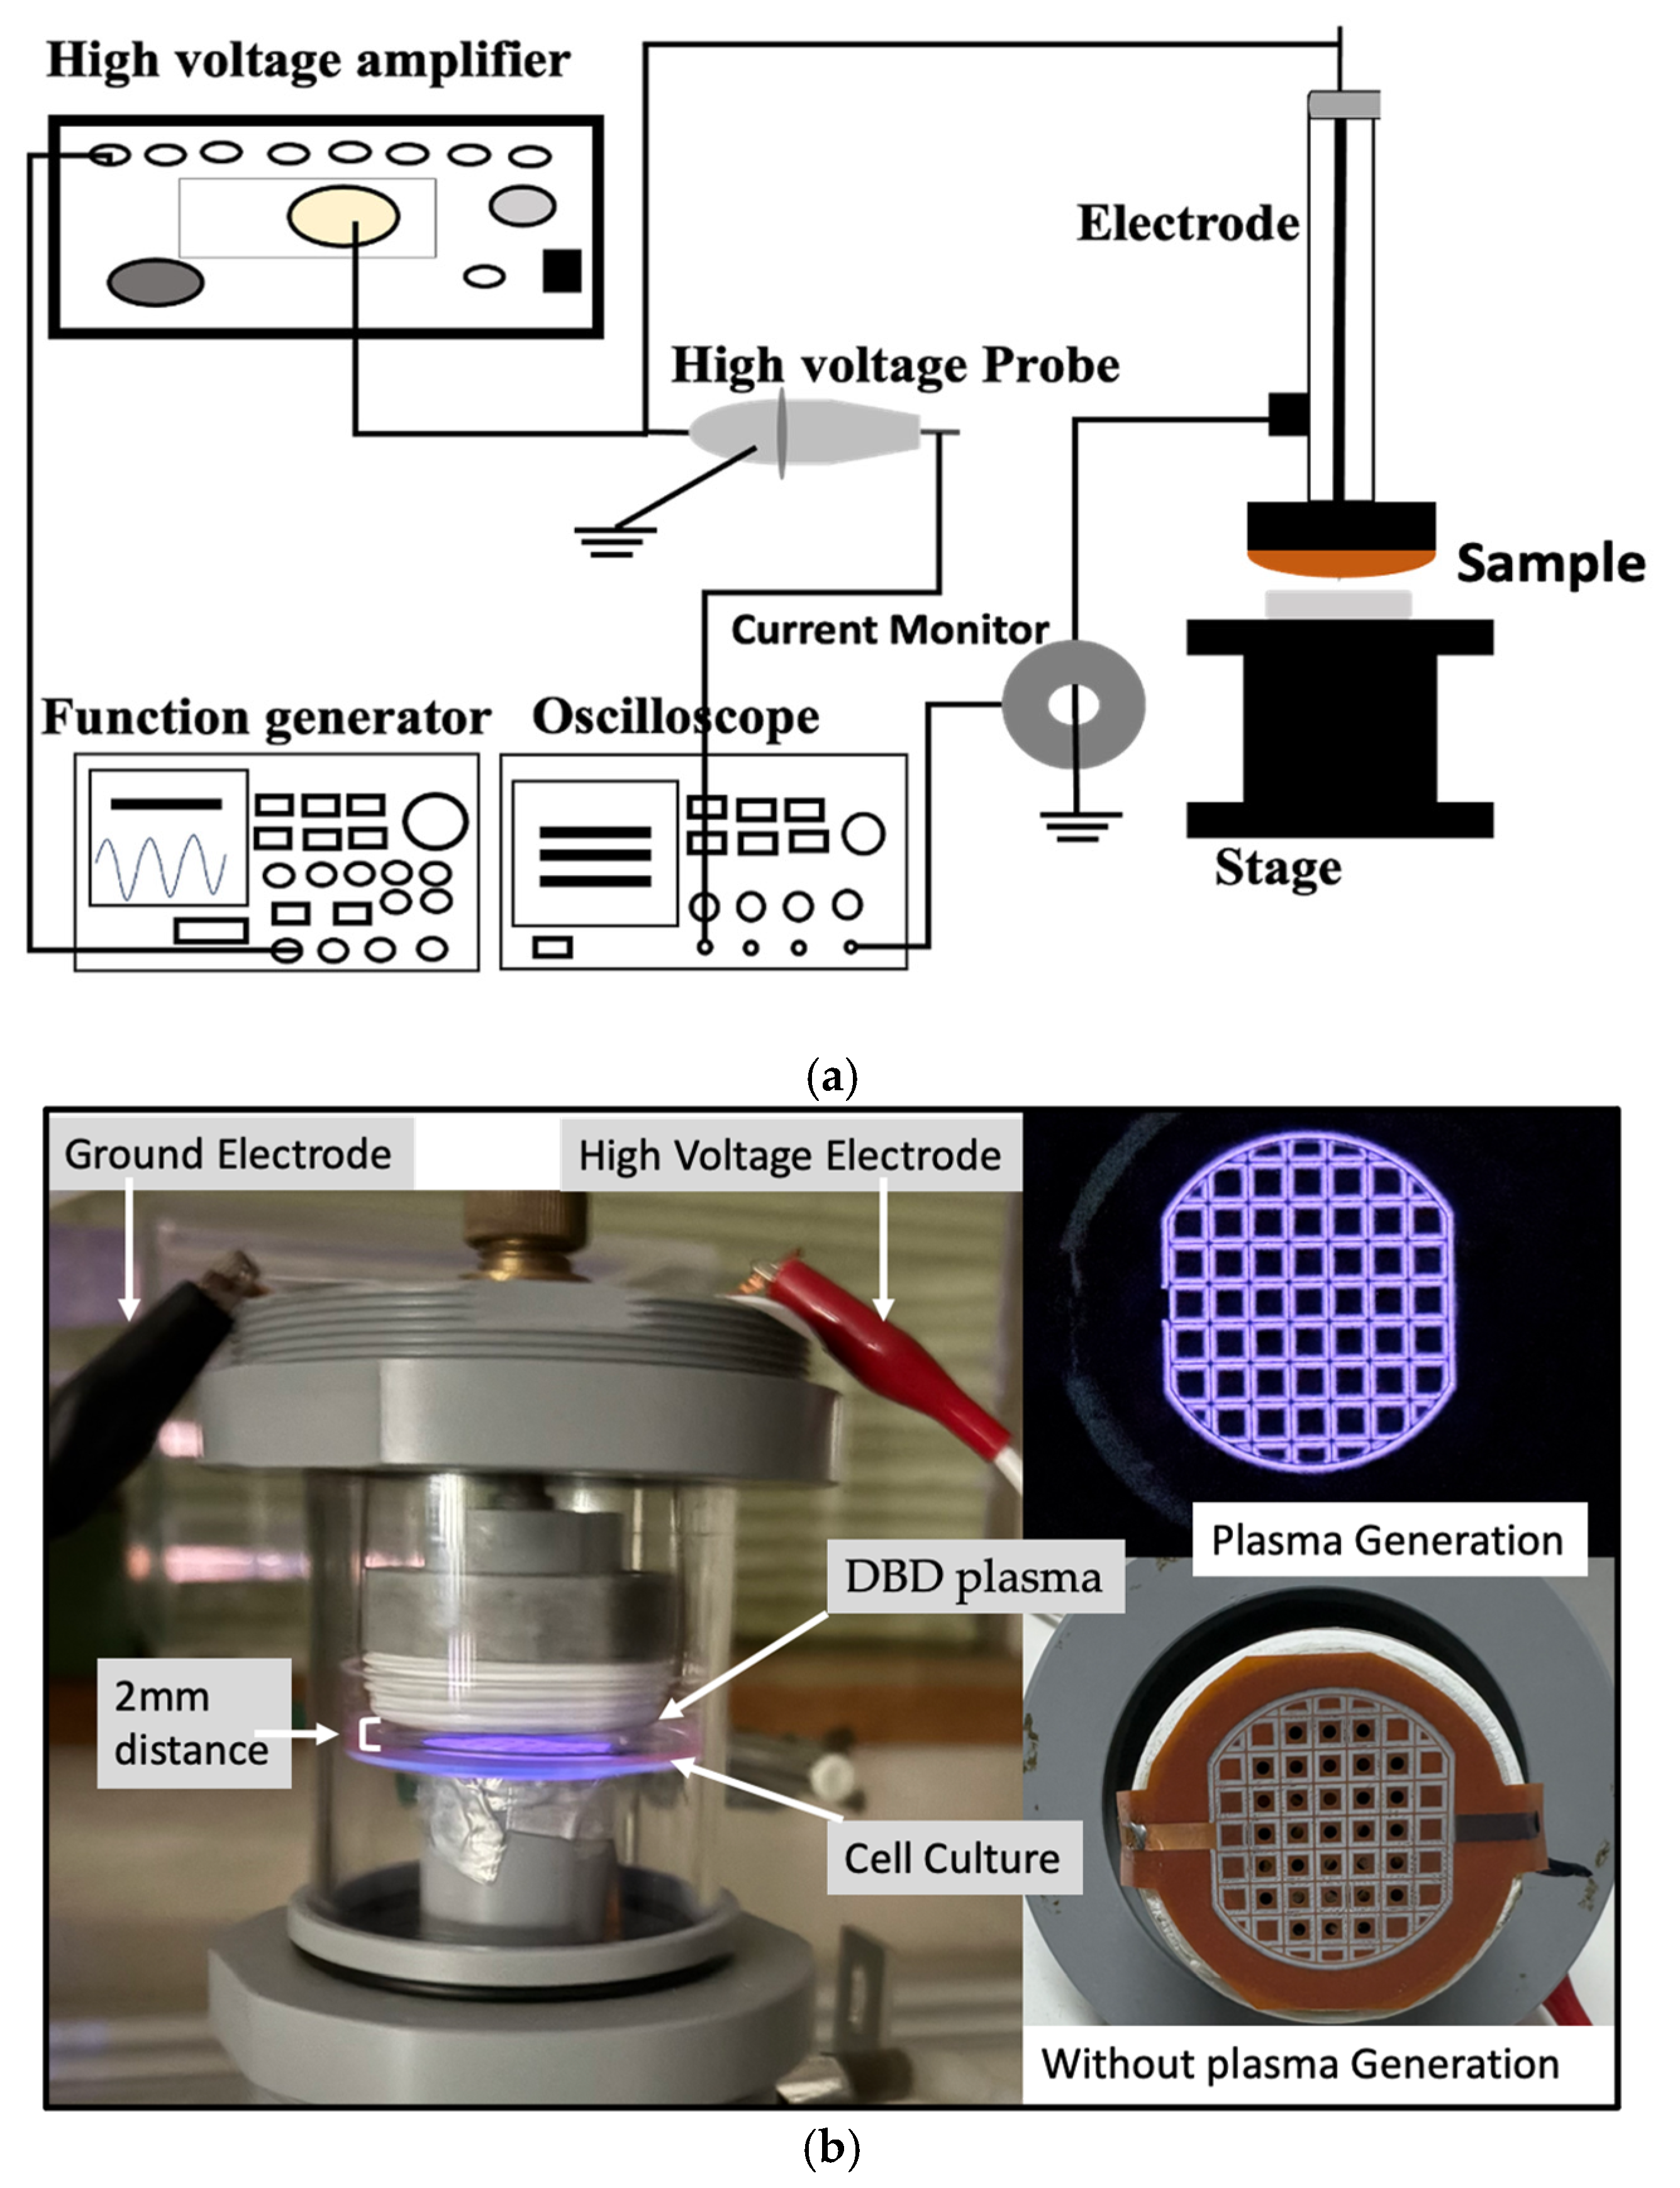
The plasma discharge was generated from a function generator (model AFG3102, Tektronix). This discharge was amplified using a high-voltage amplifier (model 5/80, Trek). A high-voltage probe (model P6105A, Tektronix) connected to an oscilloscope (model TDS 2014B, Tektronix) was used to measure the discharge voltage. Pearson current monitor, also connected to the oscilloscope, was used to measure the discharge current (Figure 1).
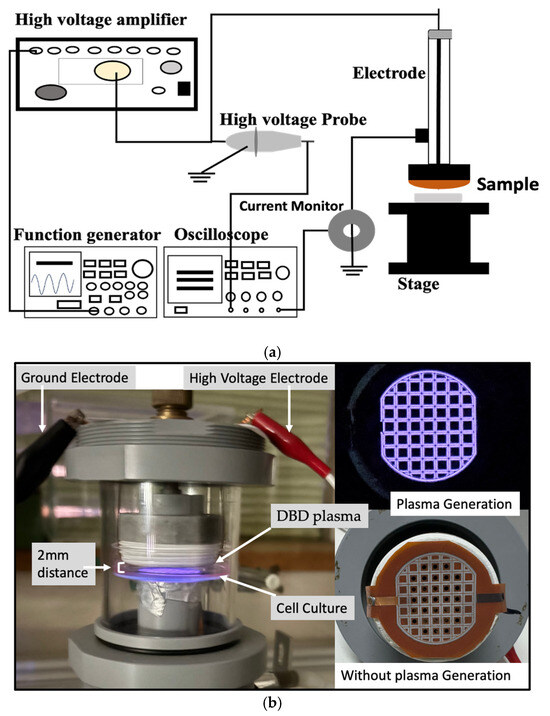
Figure 1.
(a) Schematic diagram of CAM set-up for plasma generation. (b) The treatment of CAM on the b.END.3 cell culture while maintaining ~2 mm distance between the plasma source and cell culture (left), and the thin film electrode during plasma generation (right-top) and without plasma generation (right-bottom).
2.4. Plasma Conditions and Treatment Method
A dielectric barrier discharge (DBD) microplasma system featuring a thin-film electrode was employed for the plasma treatment. The system functioned at a frequency of 5 kHz with a sine wave input, generating plasma at voltage levels of 3 kVp-p, 3.5 kVp-p, 4 kVp-p, and 4.5 kVp-p. The plasma discharge was administered at a fixed distance of 2 mm from the cell culture for a duration of 2 min. The plasma generation occurred in room air under atmospheric conditions without the use of an external gas flow.
These plasma conditions were selected based on the previous research [18,19]. However, plasma was also generated at 2 kVp-p and 2.5 kVp-p voltage levels where no drug absorption was observed. On the other hand, at more than 4.5 kVp-p voltage levels and more than 3 min plasma treatment, more cell death was observed. Therefore, the 2 kVp-p and 2.5 kVp-p voltage levels and plasma duration for 3 min were not considered in this study.
2.5. Fluorescence Intensity Measurement
To evaluate drug uptake in the bEND.3 cells, the cultures were rinsed twice with PBS before adding the DMEM medium containing 0.1 μM FD-150. Plasma irradiation was then applied immediately under the above-mentioned plasma conditions.
Following the plasma exposure, the cells were incubated at 37 °C in a 5% CO2 atmosphere for 1 h to allow cellular response. After incubation, the cultures were washed twice with PBS and examined under a fluorescence microscope. Fluorescence intensity was assessed using a microscope equipped with a green channel, with the excitation and emission wavelengths of 488 nm and 518 nm, respectively.
Additionally, the fluorescence intensity was quantified using a microplate reader. Similarly, following the plasma exposure, the cells were incubated at 37 °C in a 5% CO2 atmosphere for 1 h to allow cellular response. To measure drug uptake, the cells were detached using a 0.25% (w/v) Trypsin-1 mM EDTA·4Na solution (with phenol red), collected in a 96-well plate, and analyzed via the microplate reader. The fluorescent drug exhibited an excitation peak at 493 nm and an emission peak at 518 nm.
For experimental consistency, untreated control cells were maintained under identical environmental conditions, including temperature and humidity, as the plasma-treated cells. However, no chemical permeabilization agents were used as additional controls to compare plasma’s effects.
To ensure the reliability of the results, each experiment was conducted independently on three separate occasions, with all the samples tested in triplicate during each experimental run to confirm reproducibility.
2.6. Cell Viability
2.6.1. Trypan Blue
Cell viability was evaluated using both the trypan blue exclusion assay and fluorescence-based viability staining. Confluent bEND.3 cells cultured in Petri dishes were rinsed twice with PBS before refreshing the medium. The cells were then exposed to DBD microplasma at varying voltage levels (3 kV, 3.5 kV, 4 kV, and 4.5 kV) and incubated for 1 h. After incubation, the cells were washed twice with PBS, detached using trypsin, and neutralized with an FBS-containing medium to generate a single-cell suspension.
For trypan blue staining, 10 μL of the cell suspension was mixed with an equal volume of trypan blue solution and immediately analyzed using an automated cell counter. The proportion of viable (unstained) and non-viable (stained) cells was then determined.
2.6.2. LIVE/DEAD™ Fixable Red Dead Cell Stain Kit
Additionally, fluorescence-based viability assays using LIVE/DEAD™ Fixable Red Dead Cell Stain Kit were performed following the manufacturer’s protocol, and the fluorescence intensity was measured under a microscope.
The LIVE/DEAD™ Fixable Red Dead Cell Stain Kit was selected for its fluorescent properties, allowing for bright fluorescence when excited at 488 nm. The red-fluorescent reactive dye (excitation at ~595 nm, emission at ~615 nm) differentiates viable and non-viable cells by reacting with free amines. In compromised cells, the dye reacts with both intracellular and surface amines, yielding intense fluorescence, whereas in viable cells, the reaction is limited to the cell surface, producing a lower fluorescence intensity.
Triplicate experiments were conducted to ensure reproducibility.
2.7. ROS Measurement
To evaluate intracellular reactive oxygen species (ROS) levels, a highly sensitive DCFH-DA ROS Assay Kit was utilized. This assay is based on the uptake of DCFH-DA by cells, where intracellular esterases hydrolyze it to form DCFH. Upon interaction with ROS, DCFH is oxidized into the fluorescent compound DCF. Fluorescence intensity was measured at an excitation wavelength of 480 nm and an emission wavelength of 530 nm. The working solution was prepared by diluting the DCFH-DA dye (1:1000) in a 1× Loading Buffer, which was obtained by diluting the 10× Loading Buffer with double-deionized water at a 1:10 ratio.
The bEND.3 cells were cultured in Petri dishes under controlled conditions at 37 °C in a humidified incubator with 5% CO2. Once confluency was achieved, the cells were rinsed twice with phosphate-buffered saline (PBS), and the culture medium was replaced. The DCFH-DA dye was added prior to the plasma exposure. After the plasma treatment, the cells were incubated for 10 min and subsequently washed twice with PBS. Fluorescence images were acquired using a Keyence All-in-One Fluorescence Microscope (BZ-x800), Keyence Corporation, Osaka, Japan, and ROS levels were quantified using the ImageJ software (version 1.54g). Each experiment was conducted in triplicate to ensure result consistency.
2.8. Cell Membrane Alteration
2.8.1. LipiORDER
A LipiORDER working solution was prepared according to the manufacturer’s manual. The dye LipiORDER was dissolved in 100% dimethyl sulfoxide to prepare a 1 mM working solution. LipiORDER dye was added to all the dishes at a final concentration of 1 µM. The cells then underwent microplasma treatment at different voltages (3 kV, 3.5 kV, 4 kV, and 4.5 kV) for 2 min and incubated at 37 °C with 5% CO2 for 1 h in an E-22 incubator. Non-irradiated cells served as controls and were maintained under the same conditions.
After incubation, the cells were analyzed using a microscope (Keyence BZ-X800, Keyence Corporation, Osaka, Japan) equipped with a green filter (Ex: 450–459 nm, Em: 500–550 nm) and a LipiORDER red filter (Ex: 405 nm, Em: 595–635 nm). The fluorescence intensities were measured using ImageJ for quantitative and ratiometric analysis.
2.8.2. DisBAC2(3)
To investigate the effect of plasma treatment on membrane potential, we utilized the anionic dye Bis-(1,3-Diethylthiobarbituric Acid) Trimethine Oxonol (DisBAC2(3)). A 5 mM stock solution of DisBAC2(3) and a 0.5% solution of Pluronic F-127 were prepared in DMSO. This mixture was then added as the final concentration of 5 µM stock solution of DisBAC2(3) to 2 mL of the cell culture suspension before the plasma treatment.
Cold atmospheric microplasma was applied directly to the cells, followed by an incubation period of 1 h as previously mentioned. Fluorescence microscopy was performed with an excitation wavelength of 530 nm and an emission wavelength of 560 nm to evaluate changes in membrane potential. Untreated cells served as controls. All the experiments were performed in triplicate to ensure reproducibility.
2.9. Statistical Analysis
Group data are reported as mean ± SD, and comparisons between two groups were made using the ANOVA test (single factor). A p-value of <0.05 was considered statistically significant, with analyses performed in Microsoft Excel.
3. Results
3.1. Fluorescence Intensity Measurement
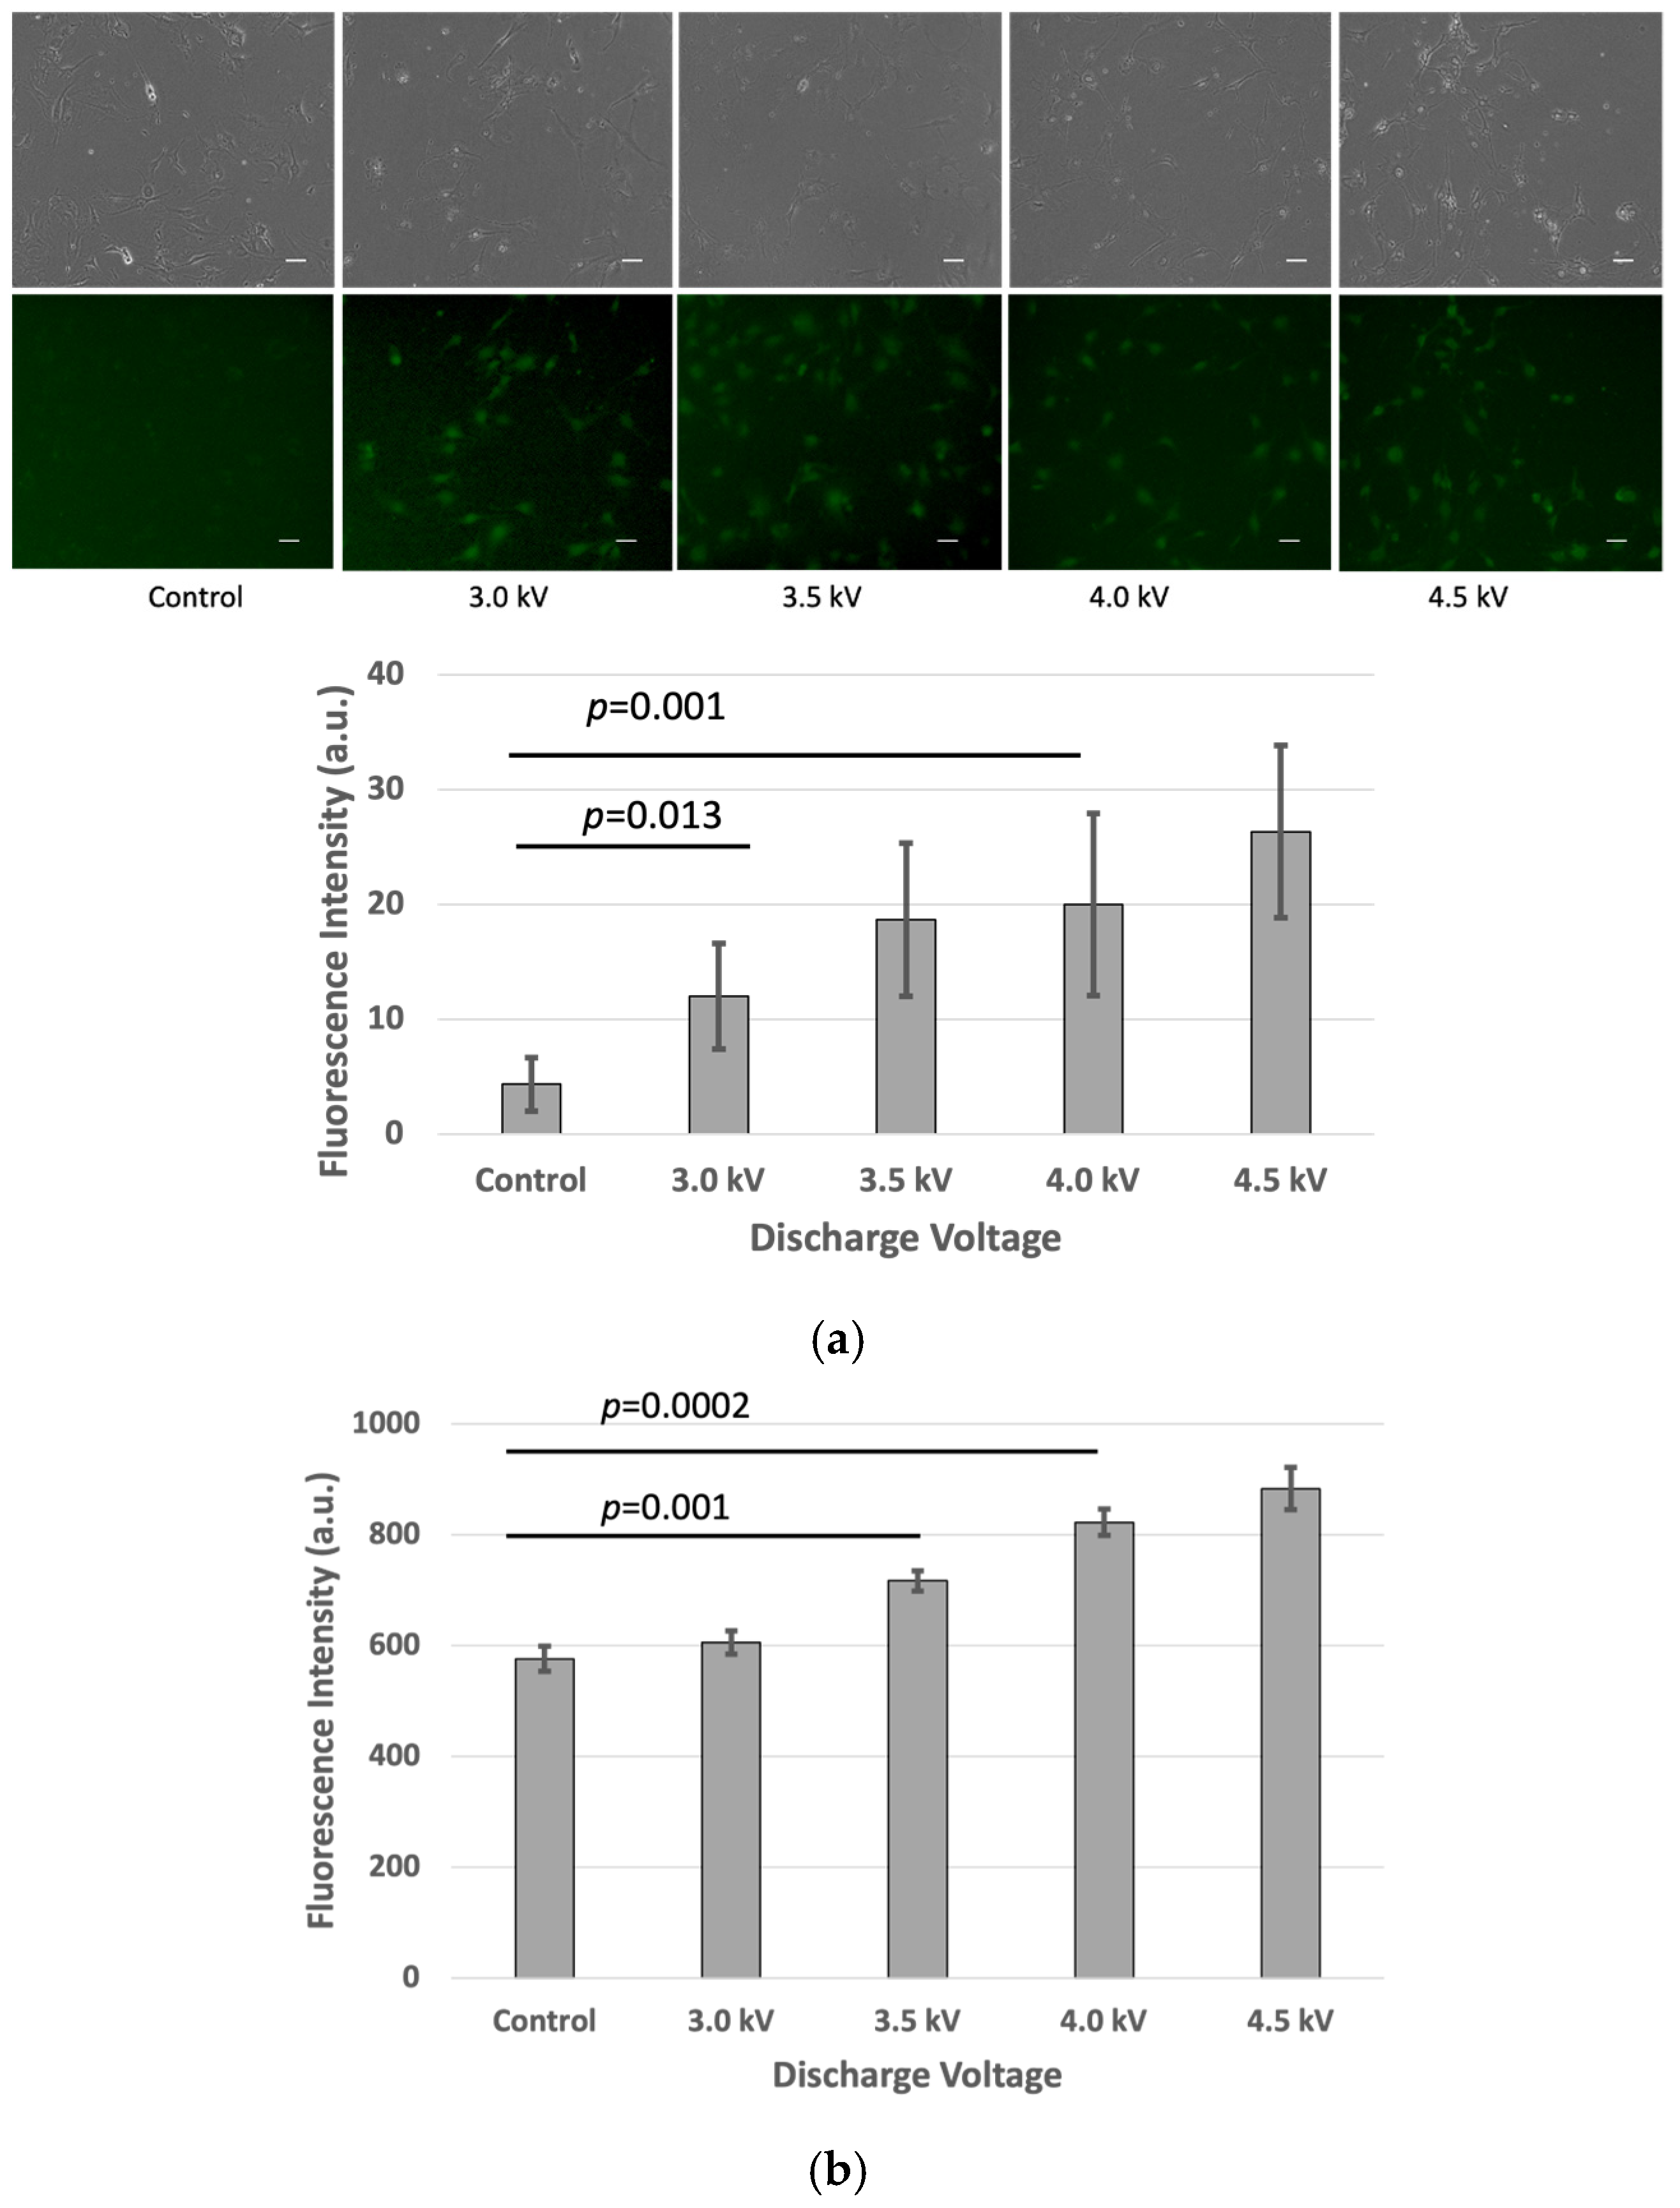
After the plasma treatment, the cells were incubated for an additional hour, and fluorescence intensity measurements were performed using the fluorescence microscope and microplate reader. The results indicated a significant increase (p < 0.05) in fluorescence intensity in the plasma-treated cells compared to the untreated control group in the bEND.3 cell cultures (Figure 2a,b).
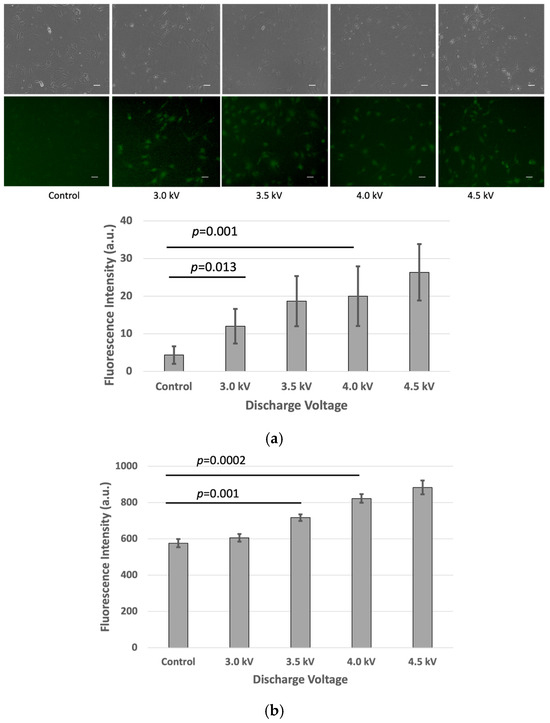
Figure 2.
Fluorescence intensity of FD-150 uptaken by bEND.3 cells after plasma irradiations: (a) Microscopic image (Scale bar 50 µm) and quantitative fluorescence intensity extracted from microscopic image, and (b) fluorescence intensity from microplate reader (p < 0.05).
This corresponds with the observed rise in intracellular fluorescence following the plasma exposure, suggesting that more of the fluorescent drug successfully crossed the bEND.3 cell membrane. The increased fluorescence signal inside the cells indicates enhanced permeability, likely due to temporary plasma-induced membrane alterations.
3.2. Cell Viability
3.2.1. Trypan Blue
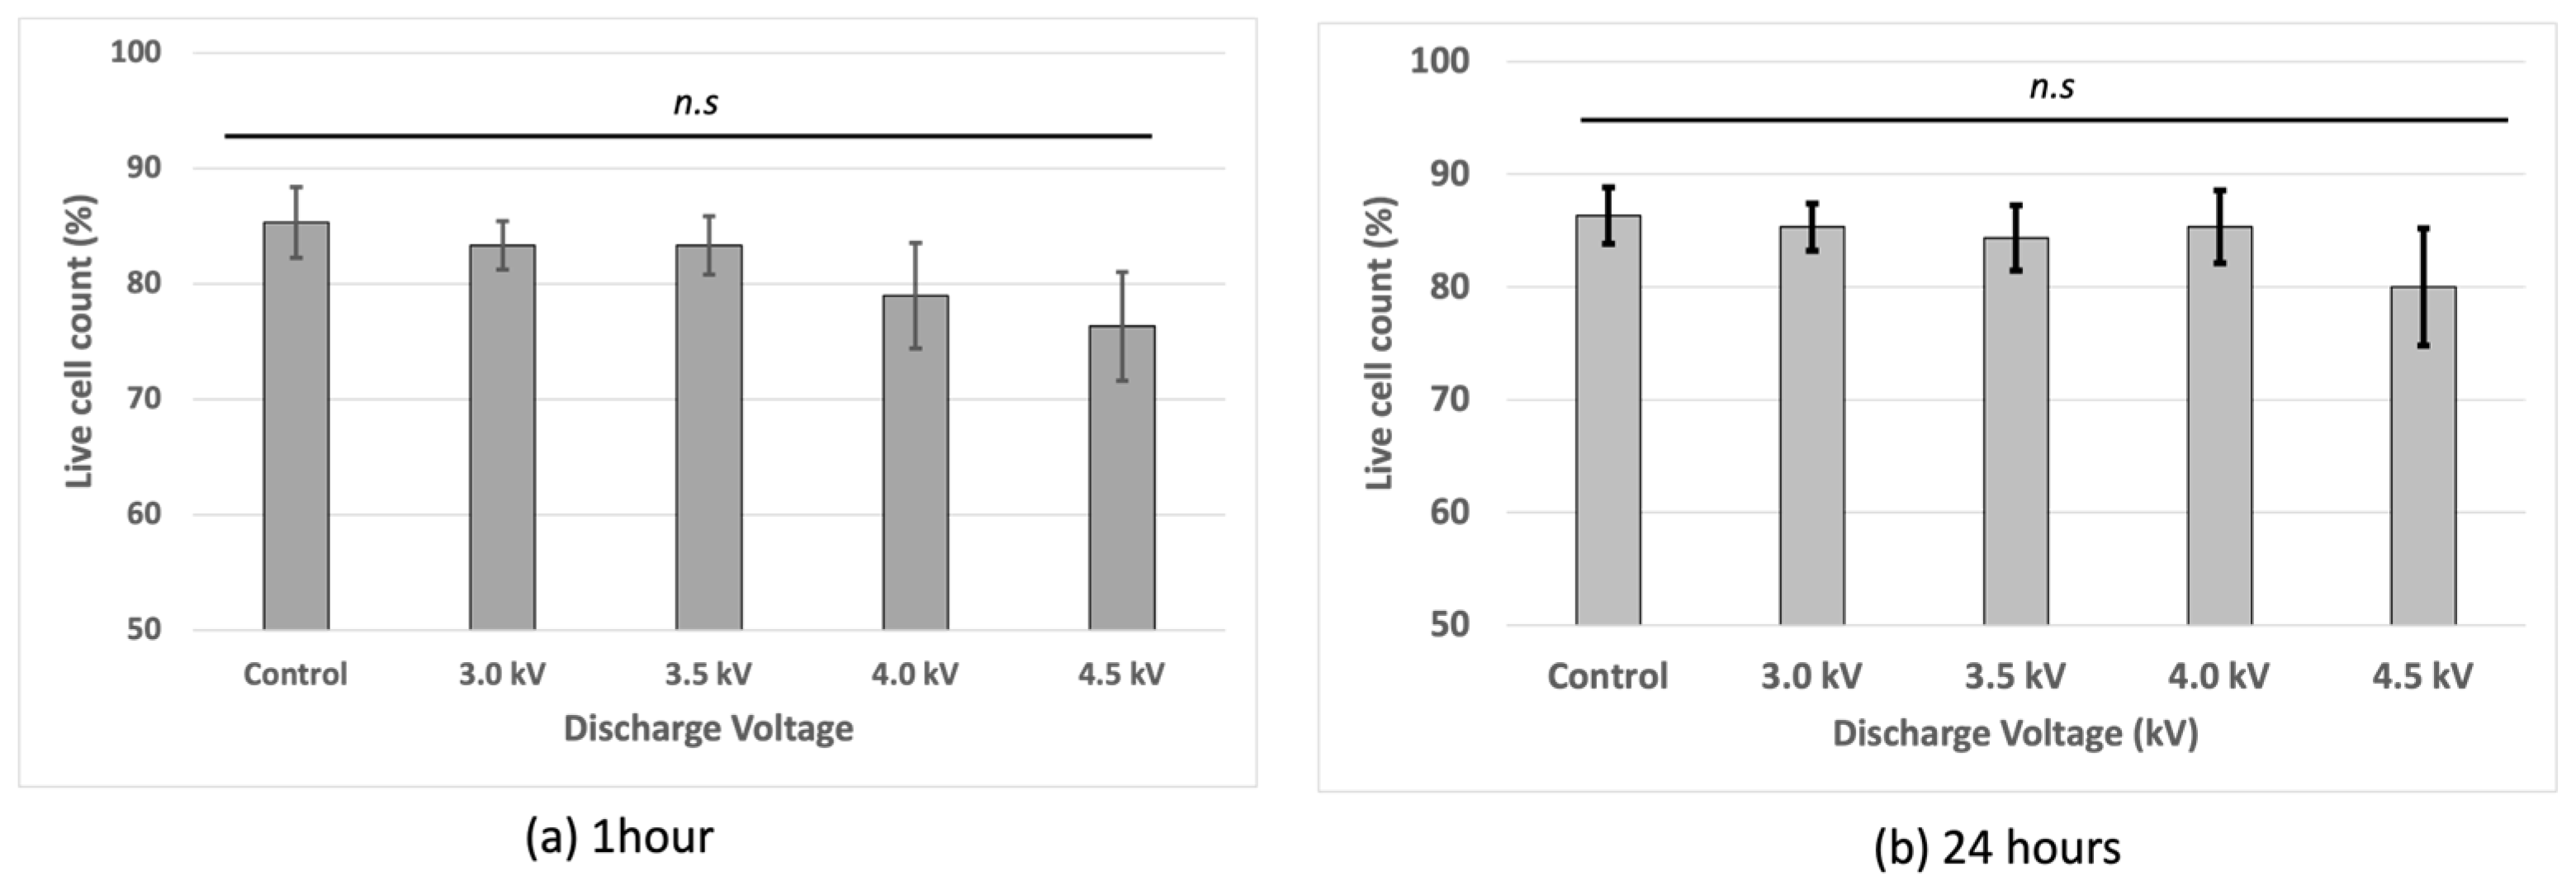
Cell viability assessment showed that the non-treated cells had the highest viability, while the plasma-irradiated samples exhibited reduced viability at voltages of 3 kV, 3.5 kV, and 4 kV with the lowest viability observed at 4.5 kV after 1 h of incubation. At 4.5 kV, fluorescence-based viability staining indicated a higher intensity, suggesting increased membrane compromise (Figure 3). However, at 4 kV, the cells recovered after 24 h incubation following the plasma treatment.
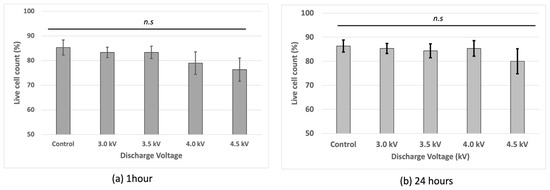
Figure 3.
Cell viability of bEND.3 cells after (a) 1 h incubation and (b) 24 h incubation following plasma irradiations using trypan blue with hemocytometer (n.s = non-significant).
3.2.2. LIVE/DEAD™ Fixable Red Dead Cell Stain Kit
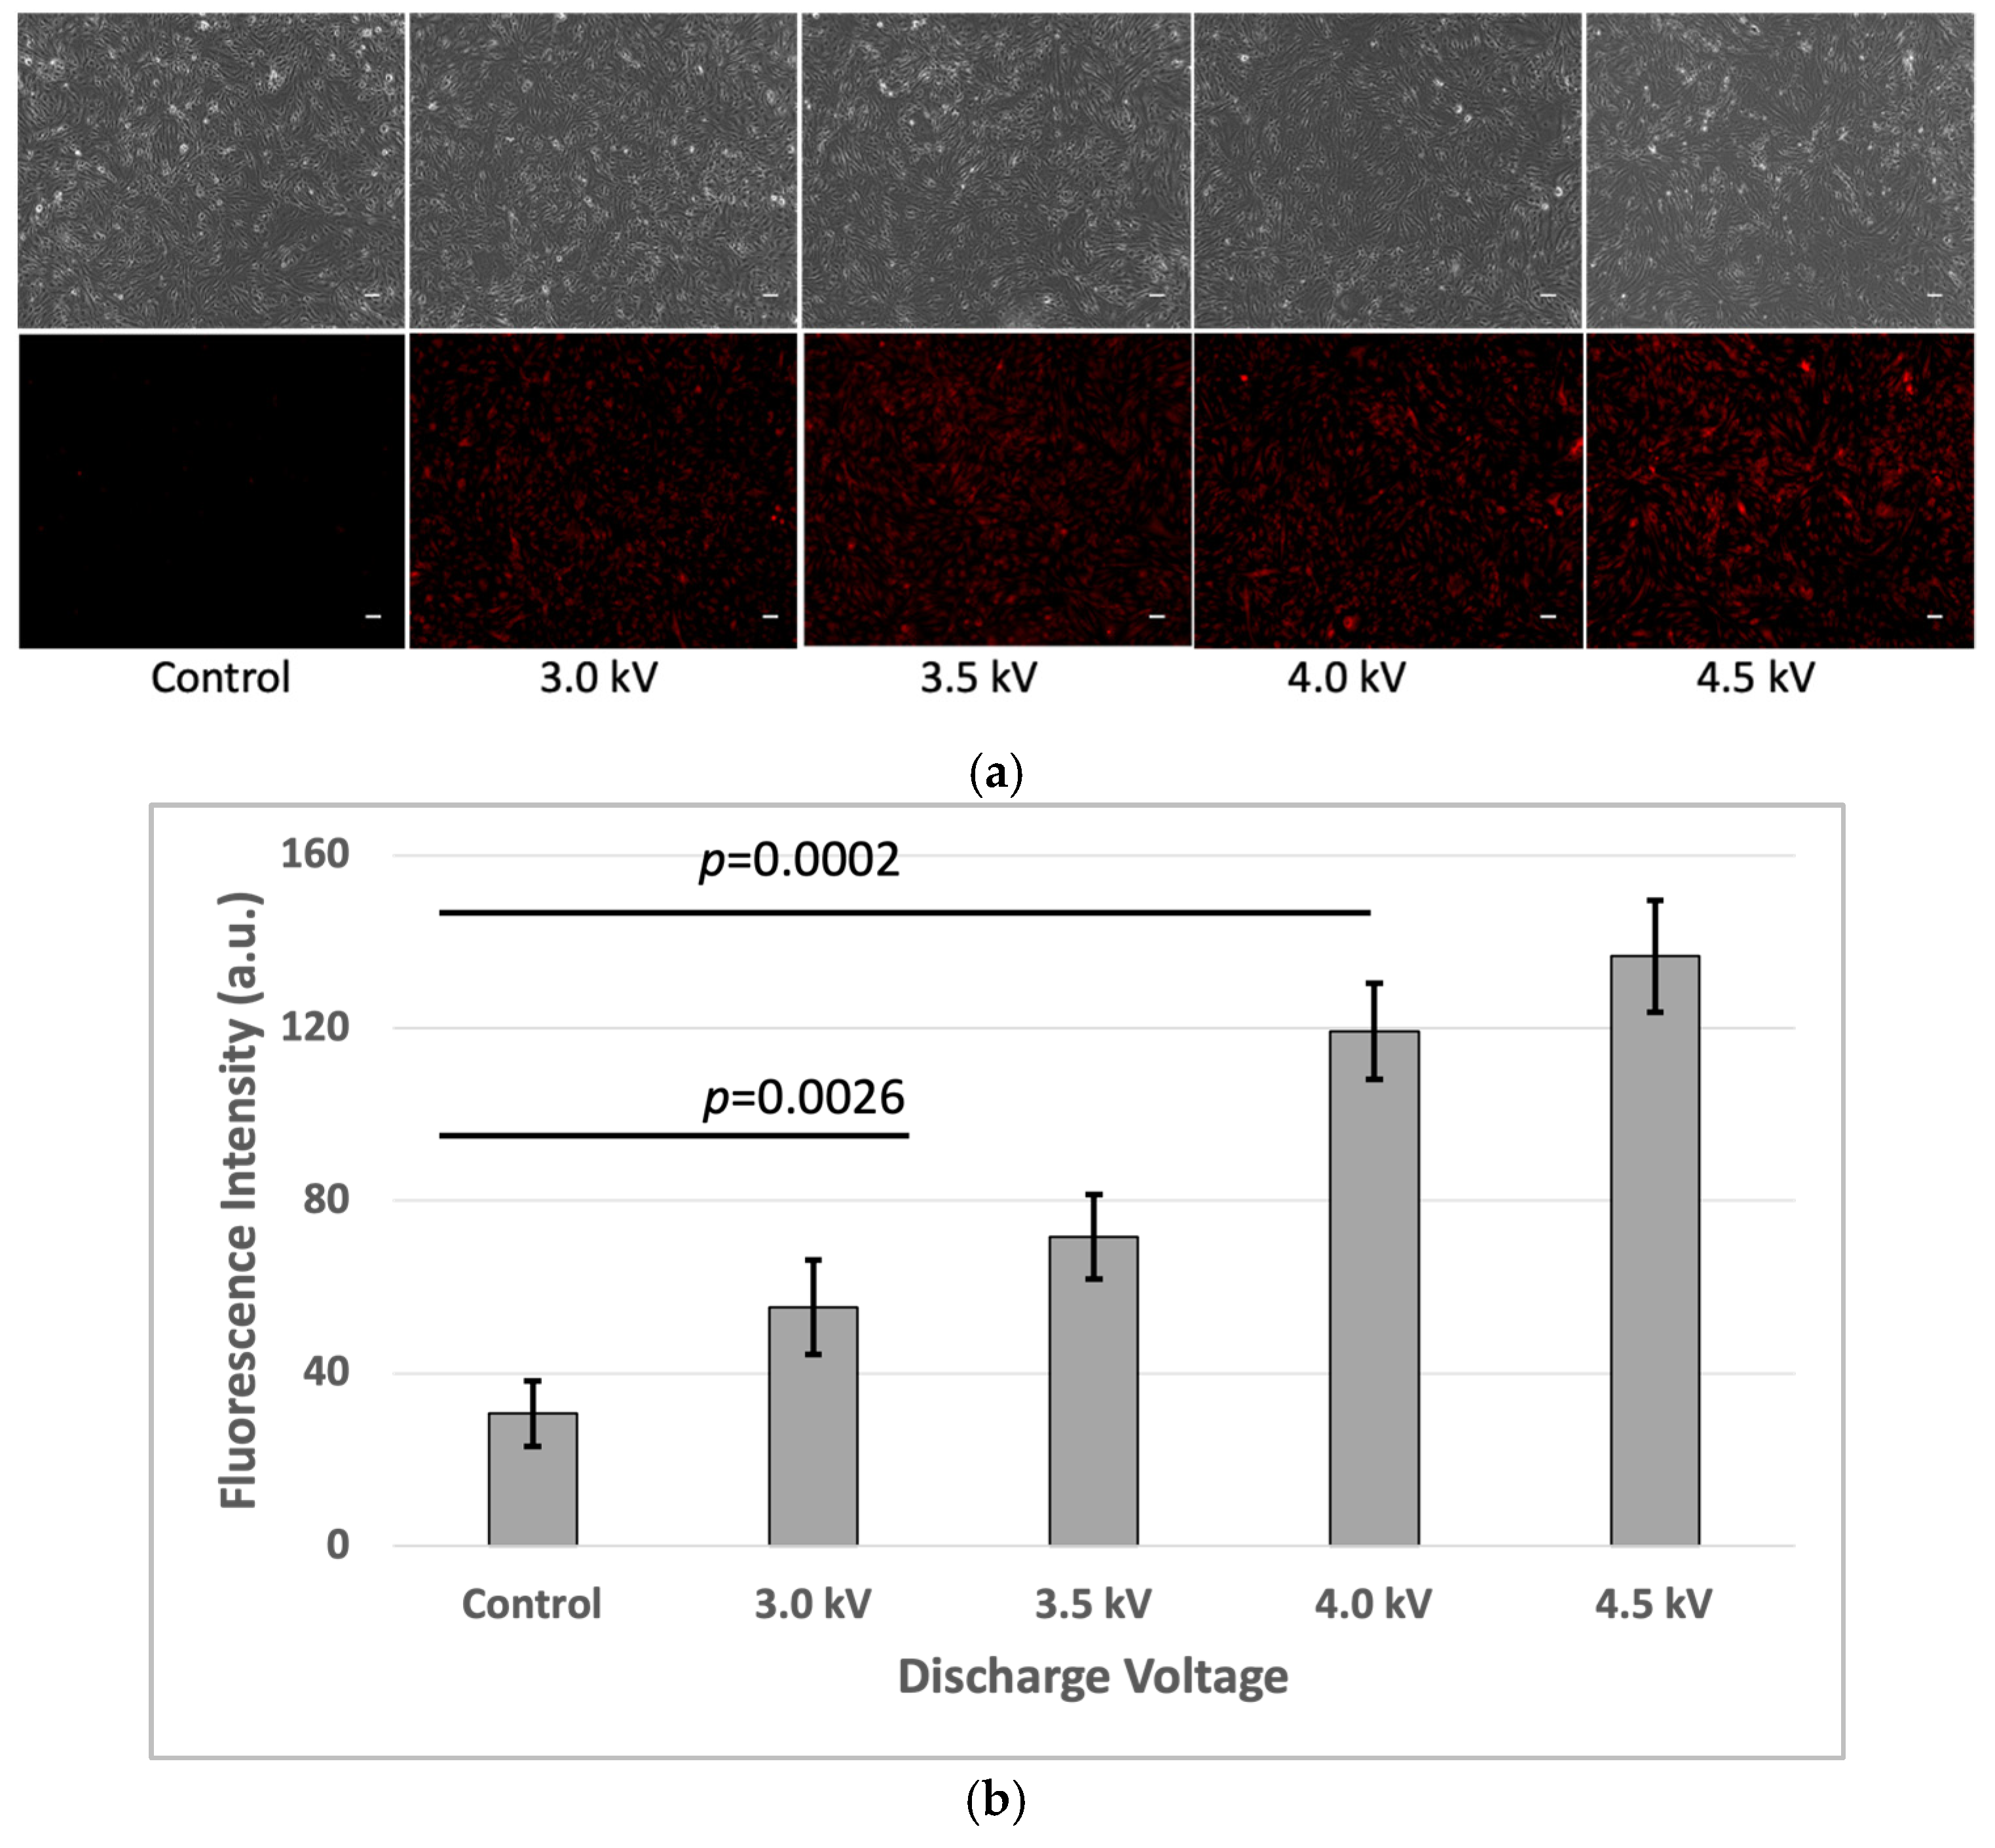
The LIVE/DEAD™ Fixable Red Dead Cell Stain Kit results showed similar fluorescence intensities at 3 kV, 3.5 kV, and 4 kV, comparable to the non-treated control cells. However, at 4.5 kV, higher fluorescence intensity indicated more compromised cell membranes, suggesting increased cell death at this voltage (Figure 4).
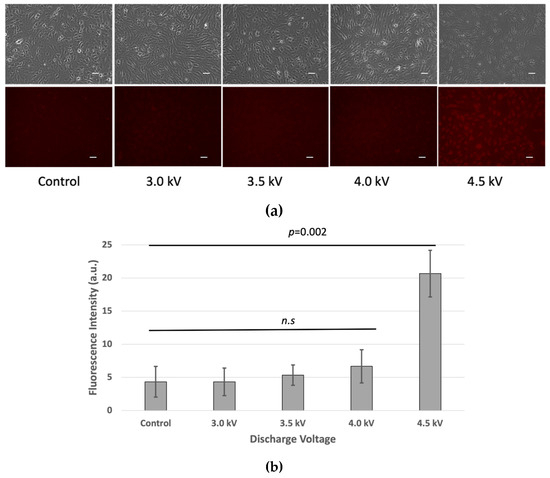
Figure 4.
(a) Cell viability of bEND.3 cells after 1 h incubation following plasma irradiations. Fluorescence intensity was increased as plasma discharge was increased at 4.5 kV respectively (n.s = non-significant). (Scale bar 50 µm). (b) Quantitative value of fluorescence intensity (p < 0.05).
3.3. ROS Measurement
To investigate oxidative stress-induced changes in tight junction proteins, intracellular ROS levels were measured in the bEND.3 cells following the plasma exposure. As depicted in Figure 5, the fluorescence intensity of DCF, a ROS indicator, increased after the plasma treatment, confirming an elevated ROS presence inside the cells. The ROS levels were directly proportional to the plasma exposure voltage, with the highest fluorescence observed at 4.5 kV and the lowest in the untreated control cells. After 10 min of incubation post-treatment, the fluorescence intensity reached its peak (p < 0.05) at 4.5 kV, indicating maximal ROS accumulation. This suggests that increasing plasma discharge voltage leads to greater ROS production within cells, which may influence cellular components such as cell membranes and other cell organelles.
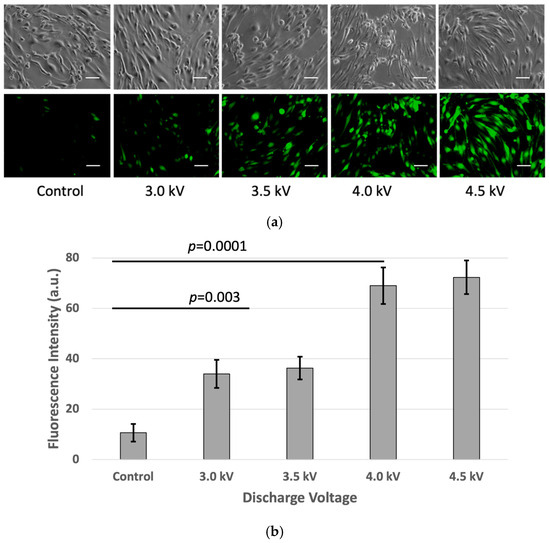
Figure 5.
(a) ROS measurement using DCFH-DA kit: (from left to right) fluorescence intensity was increased as plasma discharge was increased from no-plasma (control) to 3 kV, 3.5 kV, 4 kV, and 4.5 kV, respectively. Images were taken using Keyence Florescence Microscope All-in-one BZ-x800, scale bar 50 μm. (b) Quantitative value of fluorescence. Intensity was calculated using ImageJ software (p < 0.05).
3.4. Cell Membrane Alteration
3.4.1. LipiORDER
The microscopic image analysis revealed an increase in the fluorescence red (Fred) to fluorescence green (Fgreen) ratio in the plasma-treated cells one hour after irradiation. The Fred/Fgreen ratios for the plasma-treated cells were higher than the control. Microscopic imaging demonstrated a gradual increase in both red fluorescence in the plasma-treated cells. The quantitative fluorescence intensity analysis using ImageJ indicated higher Fred/Fgreen ratios at 3 kV, 3.5 kV, 4 kV, and 4.5 kV, respectively, compared to that in the control (Figure 6).
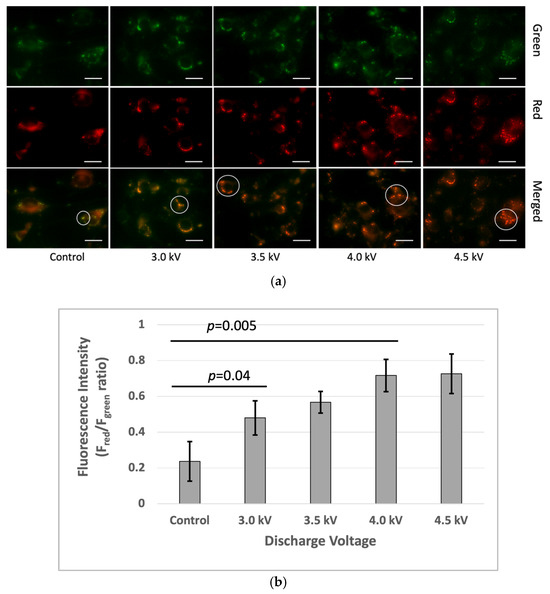
Figure 6.
Membrane lipid order changes in the bEnd3 cells following microplasma irradiation: (a) The top row represents the green channel, the middle row corresponds to the red channel, and the bottom row shows the merged images. The green and red fluorescence indicate the liquid-ordered and liquid-disordered membrane phases, respectively. The white circle indicated a green color in the control sample and gradually increased from green to yellow to red with the plasma condition increasing. The images were captured at 40× magnification, with a scale bar of 50 µm. (b) Ratio-metric fluorescence intensity (Fgreen/Fred) was analyzed using the ImageJ software (p < 0.05).
3.4.2. DisBAC2(3)
Fluorescence microscopy revealed a significant increase in fluorescence intensity in the plasma-treated cells after 1 h of incubation, indicating depolarized cells with an increase in membrane potential. In contrast, the untreated control group exhibited minimal fluorescence intensity. It suggests there are no significant changes in membrane potential in the control sample (Figure 7).
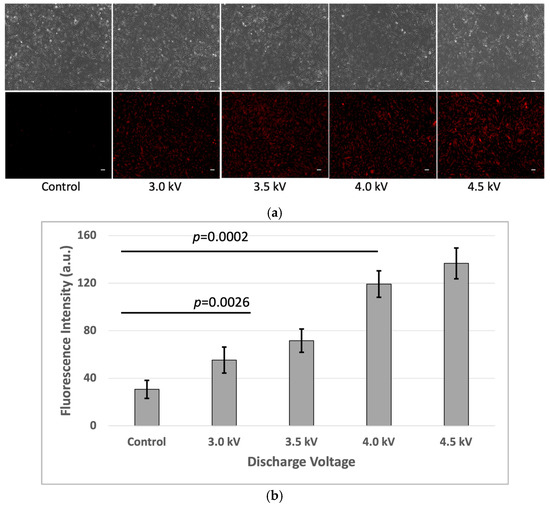
Figure 7.
(a) Increased fluorescence of depolarized cells with higher doses of plasma discharge (Scale bar 50 µm). (b) Quantitative value of fluorescence. Intensity was calculated using ImageJ software (p < 0.05).
4. Discussion
This study demonstrates that cold atmospheric microplasma (CAM) enhances intracellular drug uptake in bEND.3 cells by inducing membrane permeability changes through reactive oxygen species (ROS) generation, lipid membrane modifications, and depolarization effects. The molecular mechanisms underlying these interactions provide insights into how plasma treatment can temporarily alter membrane integrity to facilitate drug transport [20,21,22].
Cell viability assays provided further insight into the effects of plasma exposure. The trypan blue exclusion and LIVE/DEAD™ Red staining revealed a temporary decline in cell viability at higher plasma voltages (4 kV and above), suggesting initial cytotoxicity. At lower voltages (3 kV and 3.5 kV), minimal effects on viability were observed [23], suggesting that controlled plasma exposure can enhance permeability without significantly compromising cell survival.
The plasma treatment significantly increased ROS production in a voltage-dependent manner, with higher ROS levels correlating with increased drug uptake. ROS, particularly superoxide (O2−), hydrogen peroxide (H2O2), and hydroxyl radicals (OH−), are known to initiate lipid peroxidation, leading to structural modifications in the phospholipid bilayer [22,24]. Lipid peroxidation disrupts membrane packing, creating transient defects that enhance membrane permeability [25]. This effect was confirmed through LipiORDER analysis, which revealed a shift from a liquid-ordered (Lo) to a liquid-disordered (Ld) phase in the plasma-treated cells. The increased presence of the Ld phase suggests that ROS-induced oxidation disrupts lipid packing, thereby increasing membrane fluidity and facilitating the diffusion of hydrophilic drugs like FD-150.
The impact of lipid oxidation extends beyond permeability, as oxidized phospholipids can influence cell signaling pathways. Peroxidized lipids may activate stress response pathways, such as the NF-κB or MAPK pathways, which regulate cellular adaptation to oxidative stress. These signaling cascades could play a role in membrane recovery following plasma exposure, suggesting that cells attempt to restore their membrane integrity after transient permeability changes.
In addition, the plasma treatment altered membrane electrochemical properties. The DisBAC2(3) fluorescence analysis revealed that the plasma exposure induced membrane depolarization, which was observed after 1 h incubation of plasma irradiation. This suggests that plasma-generated reactive species interact with membrane components, modulating its electrochemical balance. A depolarized membrane can alter lipid organization, making the cell more permeable to certain drugs, especially large or charged molecules [26,27].
A significant observation in this study was plasma-induced membrane depolarization, as indicated by increased DisBAC2(3) fluorescence. Depolarization occurs when the plasma membrane’s resting potential becomes less negative, which can influence the transport of charged molecules across the membrane [28]. This phenomenon is particularly relevant for drug delivery because changes in electrochemical potential can drive passive diffusion and transporter-mediated uptake.
The depolarization effect observed in this study likely results from ROS interactions with ion channels and membrane lipids [29]. ROS can modulate ion channel activity by oxidizing cysteine residues in channel proteins, leading to altered ion conductance. For example, oxidative modification of potassium channels can cause channel inhibition, reducing potassium efflux and contributing to membrane depolarization [30,31]. Additionally, peroxidized lipids can alter membrane capacitance, indirectly affecting membrane potential. The combination of these effects results in a sustained depolarization state, which may further enhance membrane permeability by destabilizing the lipid bilayer and increasing drug passage through transient aqueous pores.
The combined effects of ROS-induced lipid peroxidation, membrane depolarization, and fluidity changes suggest a coordinated mechanism by which plasma facilitates drug uptake [20,21,22,32,33]. The increased FD-150 fluorescence in the plasma-treated cells indicates that these molecular alterations enable intracellular drug accumulation. Importantly, our findings show that lower plasma voltages (3–3.5 kV) can enhance permeability while maintaining cell viability, whereas higher voltages (≥4 kV) induce excessive oxidative stress, leading to cytotoxicity.
The ability of plasma to transiently modify membrane biophysics without permanently damaging the cell provides a promising avenue for non-invasive drug delivery. Future studies should explore how different plasma treatment parameters affect ion channel regulation and lipid–protein interactions to optimize therapeutic applications. Additionally, investigating the long-term recovery dynamics of plasma-treated cells will be critical in understanding how cells repair oxidative damage and restore membrane homeostasis.
Optimizing plasma parameters is crucial to achieving a balance between improved drug delivery and minimal cytotoxicity, making this approach promising for biomedical applications such as targeted drug delivery and controlled molecular transport across cellular barriers.
5. Conclusions
This study introduces a novel approach to enhancing drug delivery in bEND.3 cells using cold atmospheric microplasma (CAM), focusing on direct intracellular uptake rather than trans-BBB transport [8,34,35]. Unlike previous research emphasizing plasma’s effect on tight junctions [36,37], our work highlights how CAM modulates membrane permeability through ROS generation, membrane depolarization, and lipid order changes. By integrating LipiORDER fluorescence for lipid phase analysis and DisBAC2(3) for membrane potential assessment, we provide deeper insights into plasma-induced biophysical alterations that facilitate drug uptake.
Our findings confirm that plasma treatment significantly enhances intracellular FD-150 accumulation, temporarily disrupting membrane integrity for molecular transport. However, increased oxidative stress at higher voltages (≥4 kV) reduces cell viability, underscoring the need for plasma parameter optimization. The use of multiparametric analysis—including ROS detection, membrane potential shifts, and lipid phase transitions—distinguishes this study by offering a mechanistic perspective on plasma–cell interactions. Importantly, this study highlights the potential of non-lethal, low-dose microplasma-generated reactive oxygen and nitrogen species (RONS) as a physical tool to transiently and safely modulate cell membrane permeability, thereby supporting targeted drug delivery without compromising cellular viability [38].
Future research should optimize CAM conditions for safe and efficient intracellular drug delivery while investigating its long-term effects and potential in in vivo models for clinical application. Plasma-activated liquids (PALs), enriched with reactive oxygen and nitrogen species (RONS), can be delivered intravenously, indirectly modulating endothelial tight junctions and increasing membrane fluidity. This allows systemic, non-invasive BBB modulation. In neurosurgical settings, localized cold atmospheric plasma (CAP) can be applied intraoperatively to exposed brain tissue, offering spatial and temporal precision without thermal damage. Additionally, miniaturized plasma probes (e.g., catheter- or fiber-based systems) may enable endovascular CAP delivery directly at the BBB interface via cerebral arteries, mirroring interventional radiology methods. This minimally invasive, image-guided strategy holds promise for targeted drug delivery to the brain, combining safety, precision, and clinical adaptability across various treatment scenarios.
Author Contributions
All the authors contributed to the study in the following ways: conceptualization, K.S. and M.J.A.; methodology, K.S. and M.J.A.; software M.J.A. and J.K.; validation, K.S.; formal analysis, M.J.A.; investigation, M.J.A., A.H.S., F.B., K.S., M.H., Y.T. and J.K.; resources, K.S.; data curation, M.J.A.; writing—original draft preparation, M.J.A.; writing—review and editing, M.J.A., A.H.S., F.B., K.S., M.H., Y.T. and K.J; visualization, M.J.A.; supervision, K.S.; project administration, M.J.A., A.H.S. and K.S.; funding acquisition, K.S. All authors have read and agreed to the published version of the manuscript.
Funding
This research was funded by JSPS KAKENHI Grant Numbers JP23K17473 and JP24H00794, and by JST SPRING, Japan Grant Number JPMJSP2167.
Institutional Review Board Statement
Not applicable.
Informed Consent Statement
Not applicable.
Data Availability Statement
The original contributions presented in this study are included in the article. Further inquiries can be directed to the corresponding authors.
Conflicts of Interest
The authors declare no conflicts of interest.
References
- Wu, D.; Chen, Q.; Chen, X.; Han, F.; Chen, Z.; Wang, Y. The Blood–Brain Barrier: Structure, Regulation and Drug Delivery. Signal Transduct. Target. Ther. 2023, 8, 217. [Google Scholar] [CrossRef] [PubMed]
- Upadhyay, R.K. Drug Delivery Systems, CNS Protection, and the Blood Brain Barrier. BioMed. Res. Int. 2014, 2014, 869269. [Google Scholar] [CrossRef] [PubMed]
- Niazi, S.K. Non-Invasive Drug Delivery across the Blood–Brain Barrier: A Prospective Analysis. Pharmaceutics 2023, 15, 2599. [Google Scholar] [CrossRef] [PubMed]
- Kadry, H.; Noorani, B.; Cucullo, L. A Blood–Brain Barrier Overview on Structure, Function, Impairment, and Biomarkers of Integrity. Fluids Barriers CNS 2020, 17, 69. [Google Scholar] [CrossRef]
- Sun, B.; Li, R.; Ji, N.; Liu, H.; Wang, H.; Chen, C.; Bai, L.; Su, J.; Chen, J. Brain-Targeting Drug Delivery Systems: The State of the Art in Treatment of Glioblastoma. Mater. Today Bio 2025, 30, 101443. [Google Scholar] [CrossRef]
- Fong, H.; Zhou, B.; Feng, H.; Luo, C.; Bai, B.; Zhang, J.; Wang, Y. Recapitulation of Structure–Function–Regulation of Blood–Brain Barrier under (Patho)Physiological Conditions. Cells 2024, 13, 260. [Google Scholar] [CrossRef]
- Conway, G.E.; Paranjape, A.N.; Chen, X.; Villanueva, F.S. Development of an In Vitro Model to Study Mechanisms of Ultrasound-Targeted Microbubble Cavitation–Mediated Blood–Brain Barrier Opening. Ultrasound Med. Biol. 2024, 50, 425–433. [Google Scholar] [CrossRef]
- Alam, M.J.; Sadiq, A.H.; Kristof, J.; Rimi, S.A.; Hasan, M.; Tomoki, Y.; Shimizu, K. In Vitro Drug Delivery through the Blood–Brain Barrier Using Cold Atmospheric Plasma. Macromol 2024, 4, 597–609. [Google Scholar] [CrossRef]
- Chaulagain, B.; Gothwal, A.; Lamptey, R.N.L.; Trivedi, R.; Mahanta, A.K.; Layek, B.; Singh, J. Experimental Models of In Vitro Blood–Brain Barrier for CNS Drug Delivery: An Evolutionary Perspective. Int. J. Mol. Sci. 2023, 24, 2710. [Google Scholar] [CrossRef]
- Wang, F.; Qi, L.; Zhang, Z.; Duan, H.; Wang, Y.; Zhang, K.; Li, J. The Mechanism and Latest Research Progress of Blood–Brain Barrier Breakthrough. Biomedicines 2024, 12, 2302. [Google Scholar] [CrossRef]
- Mulvihill, J.J.; Cunnane, E.M.; Ross, A.M.; Duskey, J.T.; Tosi, G.; Grabrucker, A.M. Drug Delivery across the Blood-Brain Barrier: Recent Advances in the Use of Nanocarriers. Nanomedicine 2020, 15, 205–214. [Google Scholar] [CrossRef] [PubMed]
- Grzegorzewski, J.; Michalak, M.; Wołoszczuk, M.; Bulicz, M.; Majchrzak-Celińska, A. Nanotherapy of Glioblastoma—Where Hope Grows. Int. J. Mol. Sci. 2025, 26, 1814. [Google Scholar] [CrossRef] [PubMed]
- Stoffels, E.; Sakiyama, Y.; Graves, D.B. Cold Atmospheric Plasma: Charged Species and Their Interactions with Cells and Tissues. IEEE Trans. Plasma Sci. 2008, 36, 1441–1457. [Google Scholar] [CrossRef]
- Khalaf, A.T.; Abdalla, A.N.; Ren, K.; Liu, X. Cold Atmospheric Plasma (CAP): A Revolutionary Approach in Dermatology and Skincare. Eur. J. Med. Res. 2024, 29, 487. [Google Scholar] [CrossRef]
- Sreedevi, P.R.; Suresh, K. Cold Atmospheric Plasma Mediated Cell Membrane Permeation and Gene Delivery-Empirical Interventions and Pertinence. Adv. Colloid Interface Sci. 2023, 320, 102989. [Google Scholar] [CrossRef]
- Živanić, M.; Espona-Noguera, A.; Lin, A.; Canal, C. Current State of Cold Atmospheric Plasma and Cancer-Immunity Cycle: Therapeutic Relevance and Overcoming Clinical Limitations Using Hydrogels. Adv. Sci. 2023, 10, e2205803. [Google Scholar] [CrossRef]
- Rimi, S.A.; Alam, M.J.; Kristof, J.; Sadiq, A.H.; Hasan, M.; Mamun, M.A.; Setou, M.; Shimizu, K. Lipidomics of Microplasma-Irradiated Cells at Optimized Discharge Conditions for the Absorption of High-Molecule Drug. Appl. Sci. 2024, 14, 3978. [Google Scholar] [CrossRef]
- Rimi, S.A.; Kristof, J.; Alam, M.J.; Oishi, K.; Okada, T.; Sadiq, A.H.; Shimizu, K. Changes in Membrane Lipid Order of Cells by Optimized Microplasma Irradiation for High-Molecule Drug Absorption. Plasma Med. 2023, 13, 15–32. [Google Scholar] [CrossRef]
- Sadiq, A.H.; Kristof, J.; Alam, M.J.; Rimi, S.A.; Mizuno, Y.; Okada, T.; Shimizu, K. The Influence of Barrier Discharge by Microplasma Drug Delivery System Probe on Cell Viability and Intracellular Drug Absorption. J. Electrost. 2025, 134, 104040. [Google Scholar] [CrossRef]
- Houthaeve, G.; De Smedt, S.C.; Braeckmans, K.; De Vos, W.H. The Cellular Response to Plasma Membrane Disruption for Nanomaterial Delivery. Nano Converg. 2022, 9, 6. [Google Scholar] [CrossRef]
- Checa, J.; Aran, J.M. Reactive Oxygen Species: Drivers of Physiological and Pathological Processes. J. Inflamm. Res. 2020, 13, 1057–1073. [Google Scholar] [CrossRef] [PubMed]
- Su, L.-J.; Zhang, J.-H.; Gomez, H.; Murugan, R.; Hong, X.; Xu, D.; Jiang, F.; Peng, Z.-Y. Reactive Oxygen Species-Induced Lipid Peroxidation in Apoptosis, Autophagy, and Ferroptosis. Oxidative Med. Cell. Longev. 2019, 2019, 5080843. [Google Scholar] [CrossRef] [PubMed]
- Kurita, H.; Haruta, N.; Uchihashi, Y.; Seto, T.; Takashima, K. Strand Breaks and Chemical Modification of Intracellular DNA Induced by Cold Atmospheric Pressure Plasma Irradiation. PLoS ONE 2020, 15, e0232724. [Google Scholar] [CrossRef]
- Auten, R.L.; Davis, J.M. Oxygen Toxicity and Reactive Oxygen Species: The Devil Is in the Details. Pediatr. Res. 2009, 66, 121–127. [Google Scholar] [CrossRef]
- Balakrishnan, M.; Kenworthy, A.K. Lipid Peroxidation Drives Liquid-Liquid Phase Separation and Disrupts Raft Protein Partitioning in Biological Membranes. J. Am. Chem. Soc. 2024, 146, 1374–1387. [Google Scholar] [CrossRef]
- Min, T.; Xie, X.; Ren, K.; Sun, T.; Wang, H.; Dang, C.; Zhang, H. Therapeutic Effects of Cold Atmospheric Plasma on Solid Tumor. Front. Med. 2022, 9, 884887. [Google Scholar] [CrossRef]
- Schneider, C.; Gebhardt, L.; Arndt, S.; Karrer, S.; Zimmermann, J.L.; Fischer, M.J.M.; Bosserhoff, A.-K. Cold Atmospheric Plasma Causes a Calcium Influx in Melanoma Cells Triggering CAP-Induced Senescence. Sci. Rep. 2018, 8, 10048. [Google Scholar] [CrossRef]
- Pollard, T.D.; Earnshaw, W.C.; Lippincott-Schwartz, J.; Johnson, G.T. (Eds.) Chapter 17—Membrane Physiology. In Cell Biology, 3rd ed.; Elsevier: Amsterdam, The Netherlands, 2017; pp. 285–297. ISBN 978-0-323-34126-4. [Google Scholar]
- Villalpando-Rodriguez, G.E.; Gibson, S.B. Reactive Oxygen Species (ROS) Regulates Different Types of Cell Death by Acting as a Rheostat. Oxidative Med. Cell. Longev. 2021, 2021, 9912436. [Google Scholar] [CrossRef]
- Ramírez, A.; Vázquez-Sánchez, A.Y.; Carrión-Robalino, N.; Camacho, J. Ion Channels and Oxidative Stress as a Potential Link for the Diagnosis or Treatment of Liver Diseases. Oxidative Med. Cell. Longev. 2016, 2016, 3928714. [Google Scholar] [CrossRef]
- Mahapatra, C.; Thakkar, R.; Kumar, R. Modulatory Impact of Oxidative Stress on Action Potentials in Pathophysiological States: A Comprehensive Review. Antioxidants 2024, 13, 1172. [Google Scholar] [CrossRef]
- Xu, D.; Cui, Q.; Xu, Y.; Chen, Z.; Xia, W.; Yang, Y.; Liu, D. Plasma Enhance Drug Sensitivity to Bortezomib by Inhibition of Cyp1a1 in Myeloma Cells. Transl. Cancer Res. 2019, 8, 2841–2847. [Google Scholar] [CrossRef] [PubMed]
- Graves, D.B. The Emerging Role of Reactive Oxygen and Nitrogen Species in Redox Biology and Some Implications for Plasma Applications to Medicine and Biology. J. Phys. D Appl. Phys. 2012, 45, 263001. [Google Scholar] [CrossRef]
- Hersh, D.S.; Wadajkar, A.S.; Roberts, N.B.; Perez, J.G.; Connolly, N.P.; Frenkel, V.; Winkles, J.A.; Woodworth, G.F.; Kim, A.J. Evolving Drug Delivery Strategies to Overcome the Blood Brain Barrier. Curr. Pharm. Des. 2016, 22, 1177–1193. [Google Scholar] [CrossRef] [PubMed]
- Mokarram, N.; Case, A.; Hossainy, N.N.; Lyon, J.G.; MacDonald, T.J.; Bellamkonda, R. Device-Assisted Strategies for Drug Delivery across the Blood-Brain Barrier to Treat Glioblastoma. Commun. Mater. 2025, 6, 5. [Google Scholar] [CrossRef]
- Schmidt, A.; Liebelt, G.; Striesow, J.; Freund, E.; Von Woedtke, T.; Wende, K.; Bekeschus, S. The Molecular and Physiological Consequences of Cold Plasma Treatment in Murine Skin and Its Barrier Function. Free Radic. Biol. Med. 2020, 161, 32–49. [Google Scholar] [CrossRef]
- Kim, N.; Lee, S.; Lee, S.; Kang, J.; Choi, Y.; Park, J.; Park, C.; Khang, D.; Kim, S. Portable Cold Atmospheric Plasma Patch-Mediated Skin Anti-Inflammatory Therapy. Adv. Sci. 2022, 9, 2202800. [Google Scholar] [CrossRef]
- Begum, F.; Kristof, J.; Alam, M.J.; Sadiq, A.H.; Hasan, M.; Soichiro, K.; Shimizu, K. Exploring the Role of Microplasma for Controlling Cellular Senescence in Saccharomyces Cerevisiae. Molecules 2025, 30, 1970. [Google Scholar] [CrossRef]


Disclaimer/Publisher’s Note: The statements, opinions and data contained in all publications are solely those of the individual author(s) and contributor(s) and not of MDPI and/or the editor(s). MDPI and/or the editor(s) disclaim responsibility for any injury to people or property resulting from any ideas, methods, instructions or products referred to in the content. |
© 2025 by the authors. Licensee MDPI, Basel, Switzerland. This article is an open access article distributed under the terms and conditions of the Creative Commons Attribution (CC BY) license (https://creativecommons.org/licenses/by/4.0/).