Abstract
This paper describes the design and operation of a low-cost plasma applicator based on a patented, swirled-type dielectric barrier discharge configuration with a treatment width up to 300 mm. Differences from earlier plasma applicators include: blown cylindrical dielectric barrier discharge, combining the functional properties of the plasma jet systems, arc and corona discharge blown in a single type of universal applicator, and the possibility of treating large areas of samples with cold plasma generated in a certain type of specific process gas mixture chosen according to the type of desired effect. We tested the effect of the plasma on a few materials such as cotton and linen fabrics, glass wafers and printing cardboard, proving that the generated plasma can easily make hydrophilic or hydrophobic surfaces. We also tried the plasma’s sterilizing effect on Escherichia coli (E. coli) bacteria. The results suggest that our plasma system can be successfully applied to medical and biological fields as well, where the removal of bacteria and their fragments is required.
1. Introduction
The world wide applications of atmospheric pressure plasmas present a growth boom in many domains, especially in the present times when there is an increasing need to obtain new materials which serve mankind and also to sterilize surfaces to offer bio-protection against new viruses and other contagious diseases [1,2,3,4].
There are already a series of plasma treatment systems commercially available and well known in the field; for example the plasma jet [5,6] and the corona treaters [7] both have advantages and disadvantages. The plasma jet has the great advantage of being able to work with almost any type of gas to produce the plasma discharge, the disadvantage being its small treated area of just about 1 cm2 at most [8]. A line of plasma jets can be arranged to cover a relatively wide surface [9], which is great for treating large samples in a single pass, but the homogeneity of the “continuous” plasma line is not very good as each plasma jet covers basically only a pin point, and also the entire system which feeds the line of plasma jets is very complex and expensive as one power supply for each plasma jet is needed, as are separate gas feed lines, flow regulators, pressure reducers, etc. The other option—the corona treater—is really great for the treatment of wide surfaces, as much as 3000 mm in some cases [10]. These systems have one disadvantage: usually they are designed for the industrial treatment of continuous rolls of textiles or other similar materials [7]. The corona treaters used in industry are usually fed by a low frequency drive signal (AC about on the order of a few tens of kHz) [11].
Many years of progress in this domain have resulted in a large number of well-established applicator designs [12]. For practical use of a large-area cold plasma applicator, a number of engineering considerations must be taken into account, including the rate of inert carrier gas consumption and the rate of coverage for decontamination/surface activation [13].
In this paper we describe the design and plasma parameters of a very low-cost plasma treatment system based on a new type of plasma applicator head, about which, to the best of our knowledge, there is no report until now. The effect of the plasma on a few materials such as cotton and linen fabrics, glass wafers, and printing cardboard was tested proving that the plasma can easily make hydrophilic or hydrophobic surfaces. We also tried the plasma’s sterilizing effect (E. coli) bacteria with excellent results. The purpose of this work was not directly to test our plasma model but to provide the possibility to build a high performance atmospheric pressure plasma treatment system with inexpensive and readily available components. Regarding the high voltage power supply which powers the plasma system, we share the full schematics and the printed circuit boards for anyone who wishes to build the exact circuit.
2. Materials and Methods
2.1. Configuration of the Plasma Applicator Head
Our plasma applicator contains an inner metallic electrode (1) covered by a quartz tube (or other insulating material) mounted coaxially in an outer shell (2) made from a good dielectric material (Figure 1a). This outer shell has the job to swirl the feed gas flow around the inner electrode (1) on its longitudinal axis. As the gas moves from the input ports (3) towards the end of the applicator’s outer shell, a part of it escapes through the linear nozzle (4), which is milled on the lower side of the outer shell (2). This escaping and sweeping gas curtain (or pellicle) forms the plasma column (5) which acts on the treated material’s surface [14].
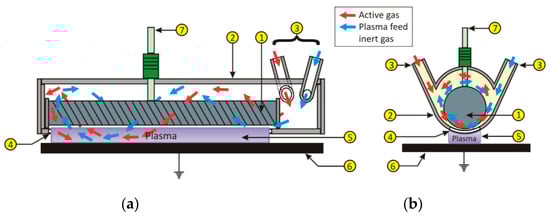
Figure 1.
The schematic diagram of our plasma applicator design, (a) (left) transversal view and (b) (right) axial view.
The inner electrode (1) is connected to the high voltage power supply through the connector (7) and the signal closes towards the ground plane (6) through the generated plasma column (5). Figures S1 and S2 present three laboratory made plasma applicator heads built and tested by the authors.
If we look at the axial view (Figure 1b), the gas inlet ports (3) are mounted on the body of the outer shell (2) in a position which helps the rushing feed gas to enter the chamber in a tangential pattern. The two inlet gas ports are mounted at an angle towards each other, with the idea to obtain an opposite rotation direction of the two inlet gasses which greatly helps in the mixing of the two in the plasma chamber.
2.2. Plasma Characterization
For the plasma optical emission studies, we used an Ocean Optics HR4000 fiber optics type USB spectrometer (200–1100 nm spectral region) and its dedicated software, Spectra Suite. The fiber optics capture lens-end was directed towards the area where the plasma volume touches the ground plane (where the material to be plasma treated is placed). The distance from the lens to the plasma column was set to 30 mm.
For the identification of the emitting atomic and molecular species and also for their labeling and relative intensity measurements, we used the software application “Spectrum Analyzer” version 1.6. The same software was used to find the excitation temperature of the vibrational states of the nitrogen molecules (Tvibr) using the molecular nitrogen bands from the second positive system with the band ends at 371.05 nm, 375.54 nm, and 380.41 nm. We estimated the rotational temperature (Trot) of the N2+ radical (at 391.44 nm, ) by comparing the experimentally recorded spectra with a synthetic (theoretical) spectra generated by the LIFBASE (ver. 2.0.6) spectral simulation application.
The plasma’s kinetic temperature (also called “gas” temperature) was measured with a Pyrex glass covered thermocouple connected to a Fluke-179 digital multimeter, and we found it to be approx. 50 °C for a measured input power of 43 W (“full power” for our 50 mm wide applicator head) and a gas flow rate of 5 L/min (this being the normal functioning regime of our 50 mm wide plasma applicator). We measured the plasma input power using a commercially available AC wattmeter with the following equation:
where:
—the plasma absorbed power.
—the total absorbed power of the entire circuit from Figure S3 when the plasma discharge is on (full power, normal gas flow rate).
—the total absorbed power of the entire circuit from Figure S3 when the plasma is off (full power, gas flow rate = 0).
—the power lost in the variable transformer (variac) (1) on Figure S3 (this power is consumed by the magnetization losses in the variac’s iron core).
—the power lost in the isolation transformer (2) on Figure S3 (this power is consumed by the magnetization losses in the isolation transformer’s iron core).
The voltage measurements were performed using a Phillips PM9100 1000:1 probe and for the current waveform measurements we used a Tektronix P6022-type inductive pickup. Both were connected to a Rigol DS1054-type digital oscilloscope, set to a 1:10 attenuation.
2.3. Water Contact Angle Analysis
We tried out our newly designed plasma applicators on cotton and linen, industrial high-density fabric samples, sourced from the National Institute for Development Research for Textiles and Leather Bucharest, with the idea of obtaining hydrophilic/hydrophobic properties (Figure S4). The plasma parameters were: 50 W input powerat5/min He flow.
The next materials on which we tested our plasma were glass and cardboard (1 mm thick printing cardboard). Tested surfaces were degreased and cleaned by consequent washing with alcohol and distilled water, then dried; 3μLof deionized water droplets as test liquid were deposited on the surfaces using a micropipette. The photos of each droplet deposited on the untreated and treated surfaces were taken using a commercial digital camera (Nikon P80, Nikon, Tokyo, Japan).
2.4. Preparation of the E. coli Samples
The E. coli cultures were grown in standard conditions (agar gel, 24 h at 37 °C) before the experiment. Afterwards, the E. coli cultures were transferred, under sterile conditions, to a buffer solution with pH = 7.0 and diluted to the correct concentration range. From this solution we deposited 100 µL droplets on microscope glass plates and let them dry. After drying, the test glass plates were exposed to the plasma discharge. After the plasma treatment, the exposed biofilms were washed with 5 mL of double-distilled water. Then, a volume of 100 µL from the obtained solution was again transferred to Petri dishes with nutrient agar gel. These dishes were kept at 37 °C for 24 h before counting the surviving number of CFU’s. As a reference lot, a series of Petri dishes with E. coli cultures were treated in the exact same way as described above, except for the plasma treatment. The inactivation of E. coli cells was assessed via CFU (colony forming units) counts on Petri dishes.
3. Results and Discussion
3.1. The Plasma Generating Circuit
The design rules for our plasma generating circuit were the following ones:
- (1)
- To generate a variable high voltage output signal which initiates the plasma.
- (2)
- To be built using only easily available and inexpensive electronic components.
- (3)
- To be very reliable and easy to service in case of any faults.
Based on the aforementioned initial design rules, we came up with a very basic capacitive discharge high voltage circuit, which works very well for plasma generation (Figure 2):
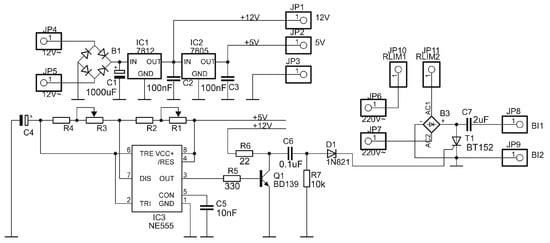
Figure 2.
The electronic schematic of our plasma generator circuit.
The circuit has three parts: a low voltage power supply module, a drive signal generating module, and a high voltage generating module (for more complex plasma generator circuits please see our other models [15,16]). The complete description of the circuit from Figure 2 is given in the Supporting Information (SI) file (the entire setup—Figure S3; the printed circuit boards (PCB)—Figures S5 and S6). For our experiments, we built the plasma system described above in two variants: a light and portable version (demonstration unit) which has only a single plasma applicator head with an activation width of 50 mm (Figure S7) and a larger version which is intended for laboratory use for the plasma treatment of larger surfaces, with an activation width of 300 mm (Figure S8).
3.2. Plasma Operational Stability Diagram
Figure 3 presents the stability diagram for the plasma discharge generated with our 50 mm width cold plasma applicator. For drawing this plasma stability diagram, we used pure heliumas plasma gas because of its low ionization potential.
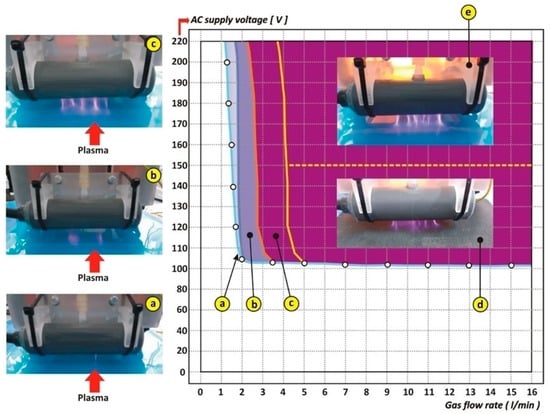
Figure 3.
Plasma operational stability diagram for the plasma generated with our 50 mm wide cold plasma applicator head. This diagram shows four regions corresponding to the parameters which describe the different evolution stages of our plasma discharge: (a) No plasma; (b) Filamentary initial discharge; (c) Developing stage plasma; (d) Fully developed plasma.
Detailed information about what a plasma stability diagram is and how it is drawn are given in the SI file.
The region on the diagram defined by gas flow rates lower than 1 L/min and for any supply voltages is called a no plasma zone because under these operational parameters we cannot initiate the plasma discharge. For the supply voltage levels over approximately 100 V and gas flow rates higher than 1–1.3 L/min, the plasma starts to initiate and has the appearance of thin breakdown of unstable filaments (Figure 3a). This initial plasma regime is marked on the stability diagram with the hollow white circles.
For the voltage level a bit higher than the breakdown value (~100 V), if we slightly increase the gas flow rate, we get a filamentary, thin curtain-type appearance of the plasma discharge, which is somewhat unstable, but it covers almost the entire exit nozzle of the applicator (Figure 3b). Further increase in the gas flow rate makes the plasma discharge expand in volume and also become much more stable (Figure 3c). This effect happens at flowrates between 2–3 L/min, and we call this the developing stage of the plasma.
The big area on the stability diagram colored in dark purple represents the fully developed stage of our plasma discharge. This is the domain of the gas flow rates higher than 3.7–4 L/min and supply voltages higher than 110 V. In this evolution stage the plasma discharge fills up the entire space of the applicator’s exit nozzle and has the appearance of a nice, thick and homogeneous plasma column (Figure 3d). For high supply voltages, above 160–170 V and high gas flow rates (above 10 L/min), strong, thick, well defined and bright filaments appear in the volume of the discharge (Figure 3e).
We believe that this effect happens due to the fact that at higher voltage levels (and implicitly higher power levels which in turn means higher plasma density) the ionization of the plasma particles during each impulse cycle happens more easily and higher current paths form in the plasma volume, which look very much like the initial filaments, but they are much brighter and thicker in this case.
3.3. Optical Emission Spectroscopy (OES) and Plasma Temperature
The recorded emission spectrum of the generated plasma, using helium as feed gas, is presented in Figure 4.
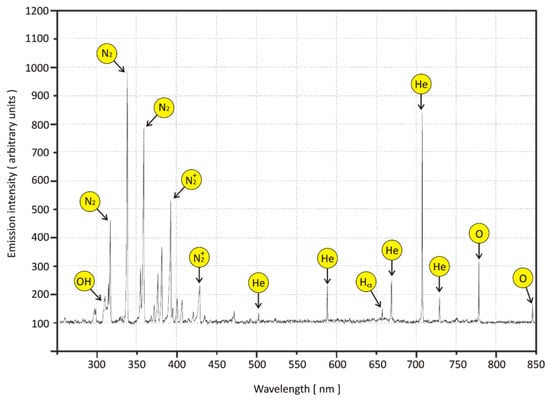
Figure 4.
Plasma emission spectrum for our 50 mm wide cold plasma applicator, working in pure helium, for an input power of 50 W.
The following emission lines were observed:
- (i)
- Atomic He from the plasma feed gas at the wavelengths 587.56 nm, 667.81 nm, 706.51 nm, and also 728.23 nm;
- (ii)
- Atomic emission lines of oxygen at 615.82 nm, 777.41 nm, and 844.52 nm;
- (iii)
- (Atomic emission line of hydrogen at 656.27 nm;
- (iv)
- (Molecular band of OH, N2, and N2+.
With the exception of the helium, the presence in the plasma discharge of the other atomic and/or molecular species is explained by the back diffusion of the ambient air in the plasma volume, which is inevitable when working in open air. This is especially true in the case of our plasma applicator head design, because as the feed gas is swirled from the input ports towards the other end of the applicator, at the exit nozzle we get a “carburetor” type effect when the surrounding air interacts with the exiting plasma gas—it actually produces a mixing of the air with the plasma gas. This is the reason why in the emission spectrum you can see so many strong nitrogen lines.
While performing the OES spectrum capturing, we moved the fiber optics lens horizontally in the width of the plasma column and we noticed that the recorded spectra are very similar and uniform. This proves once again the nice homogeneity of the generated plasma and also the fact that the distribution of the most energetic electrons is quite uniform. This conclusion is also based on the fact that the ratio of the nitrogen ionic molecule (391.44 nm) and neutral nitrogen molecule (337.13 nm) emissions [17] is a measure of the electron temperature, as the nitrogen ionic molecules are generated and excited to high energy states by the Penning type collisions with helium meta-stable molecules, which requires electrons with higher energy than those which produce the excitation of the neutral nitrogen molecules. In our discharge, and for the considered working parameters, the aforementioned ratio is about 1.35.
Figure S9 presents the variation of the nitrogen ionic vibrational temperature as a function of the input voltage, for a constant gas flow rate of 5 L/min. The conclusion from Figure S9 is that the vibrational temperature of the nitrogen molecules decreases with the increase of the supply voltage because as we go up in power level, more and more nitrogen molecules become dissociated, and thus their emission decreases. Starting from this conclusion, we further investigated the effect of the decrease of the vibrational temperature with the increase of the input power, and we studied the evolution of the emission of the molecular and atomic species generated in the plasma discharge as a function of the input voltage/power (Figure 5a) and also the dependence of the emission intensities as a function of the feed gas flow rate (Figure 5b). Figure S10 presents the variation of the plasma absorbed power as a function of the input supply voltage for two feed gas flow rates (2 L/min and 5 L/min).
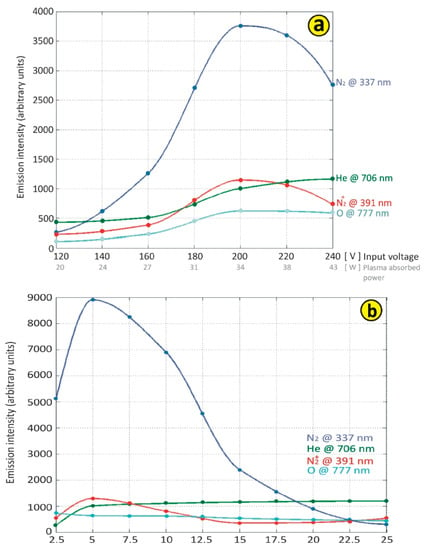
Figure 5.
(a) The evolution of the emission of the molecular and atomic species generated in the plasma discharge as a function of the input voltage/power. (b) The dependence of the emission intensities as a function of the feed gas flow rate.
The data obtained here were also useful for finding the optimum working parameters of the plasma from the point of view of its practical applications.
The emission intensities from the atomic and molecular species with the same origin have almost the same evolution as a function of the input supply voltage. The helium’s emission (the main plasma gas) increases with the supply voltage due to the increase of the energy which is transferred to the plasma discharge.
The oxygen and the hydrogen atoms which are the direct result of the dissociation of the H2O vapors from the humid air present a saturation tendency in their emission when increasing the input voltage above around 200 V (Figure 5a).
The nitrogen active molecular species which have their origin in the back diffused air show emission peaks in the supply voltage region of approx. 220 V. This is just perfect as it is exactly the line voltage, so that we do not need to use any voltage multiplying in the plasma generation circuit (Figure 2).
The plasma discharge generated with this supply input voltage (220 V) makes its optimum number of active species necessary for the maximum efficiency in the surface treatment applications.
The data obtained from Figure 5b helped us to find the optimum feed gas flow rate so that the emission intensities of the active species generated in the plasma was at its maximum. For this study we kept a constant supply voltage of 220 V and we varied the gas flow rate, noting down the emission intensities. For helium flow rates lower than 2–2.5 L/min the electron number density is low, and even though the volume of the back diffused air into the plasma column is quite high, the dissociation degree of the molecules and the excitation degree of the atoms and molecules which originate from the surrounding air (N, O, H, N2+) is low. This is what happens in the regions noted with a and b on the plasma stability diagram from Figure 3. When we bring the plasma into its “developing stage” (Figure 3c) and then further into its “fully developed stage” (Figure 3d,e), the electron density increases. As we increase the gas flow rates to about 5 L/min, due to the “swirling effect” of the plasma applicator’s exit nozzle, the plasma column “scoops” up more surrounding air (Figure 1a), and in the graph we see a peak in the emission of the molecular species which originate from the air. This means that the dissociation and excitation degree is at its maximum, for the given conditions. If we further increase the gas flow rate (5–10 L/min), the emission of the excited helium atoms increases ever so slightly (Figure 5b), because we keep the input voltage (and the power) fixed at 220 V (38 W). As we go even higher with the flow rates (>15 L/min), the emission intensities start to decrease because the input power to the plasma remained fixed, meaning that for this regime we do not give the plasma enough power (or electrons) to keep increasing the dissociation of the molecules which arrive with higher gas flow rates. Knowing that the nitrogen and oxygen active species generated in the plasma have a major importance in many treatment processes we concluded that the optimum gas flow rate (helium) for our 50 mm wide plasma applicator head is right around 5 L/min (Figure 5b).
Now, if we refer to the plasma’s kinetic temperature, for its filamentary stage (Figure 3b) we measured a temperature of about 25–26 °C (this was a very low power < 15 W) and then this temperature increases somewhat linearly to the upper limit (~50–51 °C) with the increase in supply voltage/input power. We deliberately used a 50 W current limiting power resistor in the circuit (connected to JP10 and JP11 on Figure 2) to avoid the excess heat input in the plasma applicator head itself. We noticed that the temperature values measured with the thermocouple were a bit higher than those estimated from the molecular emission spectra; for example, the rotational temperatures obtained by the simulation and comparison technique with the LIFBASE software application are about 20 °C lower.
3.4. Plasma Electron Concentration and Plasma Current Density
The next step in our plasma diagnostics phase was to find the plasma electron concentration and the plasma current density for the discharge generated by our applicator. In order to do this, we used a very simple numerical model of the plasma, combined with a few electrical measurements.
From the electrical point of view, in its developed stage (Figure 3d,e) the plasma column with the applicator head can be modeled as an equivalent series circuit which contains the following elements (Figure 6): two capacitors (Cd1, Cd2) introduced by the dielectric layer of the plasma applicator’s inner electrode and the dielectric layer which covers the ground plane, a series resistor (Rplasma) which corresponds to the electrical resistance of the plasma column generated by the applicator, and two more capacitors (Csh1, Csh2) which represent the two plasma sheaths (Debye sheaths) from the proximity of the plasma applicator’s inner electrode and the ground plane.
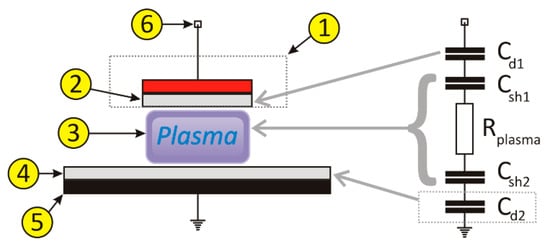
Figure 6.
The plasma electrical model we used in our calculations; (1)—the cold plasma applicator head assembly, (2)—the dielectric covering of the plasma applicator’s inner electrode, (3)—plasma discharge, (4)—the dielectric sheet which covers the ground plane (this element may be nonexistent in some application examples), (5)—ground plane, (6)—high voltage connector of the plasma applicator.
Using this electrical model and knowing the voltage on the plasma applicator’s high voltage connector and also the phase angle between the current and the voltage, we computed the plasma electron concentration and plasma current density using the method described in references [18,19] (Table 1).

Table 1.
The obtained measured and computed parameters.
For the calculation of the electron density of the generated plasma discharge, first we measured the phase angle between the voltage wave form and the current wave form for two conditions: without the ignited plasma (the generator working without a load) and with the plasma ignited (load regime).
Figure 7a presents the voltage and the current waveforms for no load regime and Figure 7b presents the voltage and the current waveforms for the ignited plasma regime.
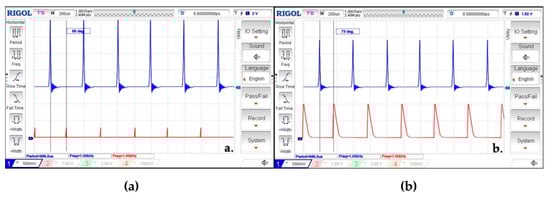
Figure 7.
The voltage and the current waveforms for no load regime (a) and the voltage and the current waveforms for the ignited plasma regime (b).
The initial phase angle (88 deg.) (Figure 7a) between the voltage and the current waveforms shows that the plasma applicator head has a capacitive behavior when the plasma is not ignited. The phase angle shifts down to 73 deg. (Figure 7b) when the plasma ignition is produced by the power drop in the plasma column (as a resistive load) and also by the plasma’s own capacitive behavior.
The first step in the calculation of the electron concentration was to calculate the capacitive reactance of each of the capacitive elements in the equivalent circuit from Figure 6, using Equations (2) and (3):
where: is the relative permittivity of vacuum; is the dielectric constant of the dielectric material used in the construction of the plasma applicator head; is the common surface between the active electrode and the plasma column; is the frequency of the drive signal. The thickness of the plasma sheaths (d = 0.08 mm) and the dielectric constant () values were taken from reference [20].
Knowing the output voltage of the generator ( = 15 kV) under load (Figure 7b) and the phase angle ( = 73 deg.) we then calculated the resistance of the plasma column and the current intensity through the plasma, using Equations (4) and (5):
where: and are the capacitive reactances of the equivalent capacitors and from Figure 6. and are the capacitive reactances of the plasma sheaths equivalent capacitances and from Figure 6.
Then using the numerical values obtained from Equations (4) and (5), we computed the plasma current density and the electron concentration, from Equations (6) and (7):
where: is the electron’s charge and is the mobility value of the electrons (for helium, = 1128 cm2/Vs)
3.5. Water Contact Angle Study
We measured the contact angles using the methodology presented in [21] (Figure 8a). While cotton fabric is well known for its good hydrophilic properties, as a second test we also tried to make it hydrophobic. For this, we used a more aggressive plasma gas—a mixture of He and extra O2 (70:30%,) and after the plasma treatment we sprayed (using a pneumatic spray gun) commercial siloxane nanoparticles on the cotton fabric (Figure S4).
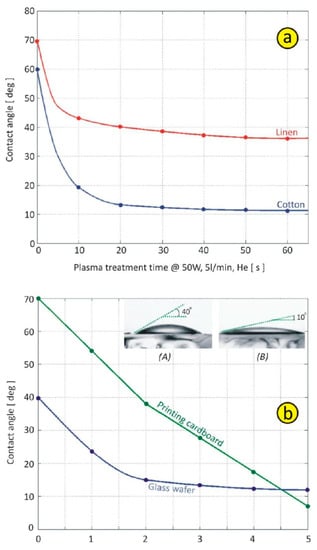
Figure 8.
(a) Contact angle variation on plasma-treated cotton and linen samples. (b) Plasma-treated glass wafers and cardboardat50 W input power, as a function of treatment time.
The next materials on which we tested our plasma were glass and cardboard (1 mm thick printing cardboard). In case of the glass we were also looking to obtain perfectly hydrophilic surfaces in order to clean laboratory glass wafers. For the cardboard surface we wanted to increase the hydrophilicity (Figure 8b). The conclusion of this test was that in a very short duration of just 4–5 s we can successfully clean the glass surfaces with our cold plasma applicator.
On Figure S11 we present a few AFM glass surface morphology pictures, before and after our plasma treatment. Picture (A) is the glass surface before the plasma treatment, picture (B) is the glass surface after 5 s of plasma treatment, and in picture (C) you can see how the surface of the glass wafer becomes perfectly flat with literally no irregularities after only 5 min of plasma treatment (the input power was set to 50 W in all the cases, Heat 5 L/min).
3.6. Microbiological Analysis
On the graph from Figure 9 we represent the survival CFUs as a function of the plasma treatment time. According to our literature study, the cold plasma’s sterilization performance ranks top notch, and there are just a few aggressive chemicals which can destroy the E. coli bacteria biofilms in such a short time [22,23].To compute the killing rates (CFU reduction speeds), the time necessary for complete sterilization, and the decimal reduction time (the treatment time required to destroy 90% of the original microorganism population) of the E. coli cultures, we used a linear fitting method on the data. The first observation was that there is no significant difference between the sterilization performances of the two sets of data (for two different plasma regimes). The E. coli inactivation process occurs with different rates, and thus the curves in Figure 9 show four slopes for the entire duration of the plasma treatment (60 s in this case). As you can see from the graph, in the first 10 s under the plasma discharge, the killing of the bacteria works very rapidly for both of the plasma operating conditions; the initial number of CFUs drops brutally from 5500 to approximately 300, giving an initial killing rate on the order of 500 CFU/s. For the rest of the treatment, the sterilization process becomes gradually slower as the killing rate is one order of magnitude lower after 20 s (20 CFU/s), and then, for the last part of the plasma treatment, the killing rate drops to only 1 CFU/s before the complete sterilization occurs after 60 s.
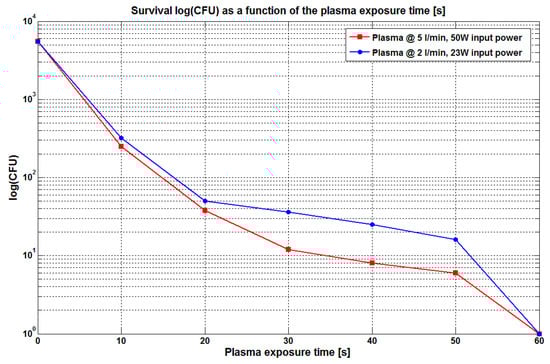
Figure 9.
Inactivation of E. coli bacteria as a function of plasma treatment time.
From the data plotted on the graph we can notice that the decimal reduction time is around 10 s in this case. It reveals that our plasma system is very effective for reducing CFU of bacteria if the exposure time is set in the proper way. The results are similar to those obtained by other authors with different plasma systems [24,25,26,27]. The performance of our plasma system towards the inactivation of E. coli bacteria was compared with those of other types of plasma systems found in the literature (see Table 2). One can see that the inactivation time as well as the power settings are comparable to those of other types of plasma systems previously reported.
Table 2.
The performance of several plasma systems towards E. coli bacteria inactivation.
4. Conclusions
This work reports on the design, construction, and operation of a low-cost plasma applicator based on a patented, swirled-type dielectric barrier discharge configuration with a treatment width up to 300 mm. We evidenced how the design of the plasma applicator head can lead to significant improvement of overall system performance. We shared all the electrical schematics of the high voltage generator, the printed circuit boards (PCBs), and also the construction details of our newly designed cold plasma applicator head. The design allows operation in simple air or in any other type of gas or gas mixtures. The important differences from the other existing designs include: blown cylindrical dielectric barrier discharge, combination of the functional properties of the plasma jet systems, arc and corona discharge blown in a single type of universal applicator, and the possibility of treating large areas of samples with cold plasma generated in a certain type of specific process gas mixture chosen according to the type of desired effect.
In the applications section we have proven that this plasma is very useful for treating and disinfecting material surfaces. For example, plasma can successfully sterilize surfaces which contain E. coli, with a decimal time of 10 s and a complete sterilization in around 60 s. For surface activation application, it was found that for very short plasma treatment times (below 5 s) glass surfaces were successfully cleaned and the hydrophilicity/hydrophobicity of cotton, linen, and cardboard paper was enhanced.
Supplementary Materials
The following supporting information can be downloaded at: https://www.mdpi.com/article/10.3390/plasma5040032/s1, Figure S1:Laboratory made plasma applicators (50 mm and 120 mm versions); Figure S2: Laboratory made plasma applicator, 300 mm width version; Figure S3: The connection setup of our entire plasma generation system used in this article; Figure S4: Hydrophobic cotton fabric after plasma treatment, 50 W at 5 L/min, He:O2 mixture (70:30), 30 s treatment time; Figure S5: The bottom layer of the PCB of the plasma generator circuit (1:1 scale); Figure S6: The top layer of the PCB of the plasma generator circuit (1:1 scale); Figure S7: Our portable/demonstration unit with a single plasma applicator, (50 mm treatment width); Figure S8: Our larger, laboratory-level plasma generator with a treatment width of 300 mm; Figure S9: The variation of the N2 ionic vibrational temperature as a function of the input voltage (for our 50 mm wide cold plasma applicator);Figure S10: The variation of the plasma absorbed power as a function of the input supply voltage (for our 50 mm wide cold plasma applicator); Figure S11: AFM glass surface morphology pictures of untreated glass (A), after 5 s of plasma treatment (B), and after 5 min of plasma treatment (C) at 50 W input power.
Author Contributions
C.D.T. designed, built, and tested the plasma generator. He also wrote the original draft. M.C. wrote and revised the final manuscript. All authors have read and agreed to the published version of the manuscript.
Funding
This work was supported by grants of the Ministry of Research, Innovation and Digitization, CNCS—UEFISCDI, project number PN-III-P1-1.1-TE-2021-0661, within PNCDI III, and program Nucleu, project code PN 19 35 01 01.
Data Availability Statement
The data presented in this study are available in the manuscript and supplementary material.
Conflicts of Interest
The authors declare no conflict of interest.
References
- Maho, T.; Binois, R.; Brulé-Morabito, F.; Demasure, M.; Douat, C.; Dozias, S.; Bocanegra, P.E.; Goard, I.; Hocqueloux, L.; Le Helloco, C.; et al. Anti-Bacterial Action of Plasma Multi-Jets in the Context of Chronic Wound Healing. Appl. Sci. 2021, 11, 9598. [Google Scholar] [CrossRef]
- Khanikar, R.R.; Kalita, M.; Kalita, P.; Kashyap, B.; Das, S.; Khan, M.R.; Bailung, H.; Sankaranarayanan, K. Cold Atmospheric Pressure Plasma for Attenuation of SARS-CoV-2 Spike Protein Binding to ACE2 Protein and the RNA Deactivation. RSC Adv. 2022, 12, 9466–9472. [Google Scholar] [CrossRef] [PubMed]
- Sakudo, A.; Yagyu, Y.; Onodera, T. Disinfection and Sterilization Using Plasma Technology: Fundamentals and Future Perspectives for Biological Applications. Int. J. Mol. Sci. 2019, 20, 5216. [Google Scholar] [CrossRef] [PubMed]
- Simon, S.; Salgado, B.; Hasan, M.I.; Sivertsvik, M.; Fernández, E.N.; Walsh, J.L. Influence of Potable Water Origin on the Physicochemical and Antimicrobial Properties of Plasma Activated Water. Plasma Chem. Plasma Process 2022, 42, 377–393. [Google Scholar] [CrossRef]
- Setiawan, U.H.; Nurcahyo, I.F.; Saraswati, T.E. Atmospheric Pressure Plasma Jet for Surface Material Modification: A Mini-Review. J. Phys. Conf. Ser. 2022, 2190, 012010. [Google Scholar] [CrossRef]
- Matsusaka, S. Control of Particle Charge by Atmospheric Pressure Plasma Jet (APPJ): A Review. Adv. Powder Technol. 2019, 30, 2851–2858. [Google Scholar] [CrossRef]
- Stegmaier, T.; Dinkelmann, A.; Von Arnim, V.; Rau, A. Corona and Dielectric Barrier Discharge Plasma Treatment of Textiles for Technical Applications; Woodhead Publishing Limited: Cambridge, UK, 2007; ISBN 9781845690731. [Google Scholar]
- Winter, J.; Brandenburg, R.; Weltmann, K.D. Atmospheric Pressure Plasma Jets: An Overview of Devices and New Directions. Plasma Sources Sci. Technol. 2015, 24, 64001. [Google Scholar] [CrossRef]
- Li, D.; Liu, D.; Chen, Z.; Rong, M.; Kong, M.G. A New Plasma Jet Array Source: Discharge Characteristics and Mechanism. IEEE Trans. Plasma Sci. 2016, 44, 2648–2652. [Google Scholar] [CrossRef]
- Available online: https://www.vetaphone.com/wp-content/uploads/2019/05/Vetaphone_Converting_ENG.pdf (accessed on 19 October 2022).
- Izdebska, J. Printing on Polymers: Fundamentals and Applications. Print. Polym. Fundam. Appl. 2015, 8, 123–143. [Google Scholar]
- Fiebrandt, M.; Lackmann, J.W.; Stapelmann, K. From Patent to Product? 50 Years of Low-Pressure Plasma Sterilization. Plasma Process Polym. 2018, 15, 1–17. [Google Scholar] [CrossRef]
- Konesky, G. Dwell Time Considerations for Large Area Cold Plasma Decontamination. Chem. Biol. Radiol. Nucl. Explos. Sens. X 2009, 7304, 73040N. [Google Scholar] [CrossRef]
- Tudoran, C. Universal Cold Plasma Applicator to Be Used in Surface Engineering, Romanian Patent Application RO133593A0,RO201800648A/2019-08-30. 2019. Available online: https://worldwide.espacenet.com/patent/search/family/067733552/publication/RO133593A0?q=pn%3DRO133593A0 (accessed on 19 August 2022).
- Tudoran, C.D. High Frequency Portable Plasma Generator Unit for Surface Treatment Experiments. Rom. Rep. Phys. 2011, 56, 103–108. [Google Scholar]
- Tudoran, C.D.; Surducan, V.; Anghel, S.D. High Frequency Atmospheric Cold Plasma Treatment System for Materials Surface Processing. AIP Conf. Proc. 2012, 1425, 106–109. [Google Scholar] [CrossRef]
- Qayyum, A.; Zeb, S.; Naveed, M.A.; Ghauri, S.A.; Zakaullah, M.; Waheed, A. Diagnostics of Nitrogen Plasma by Trace Rare-Gas-Optical Emission Spectroscopy. J. Appl. Phys. 2005, 98, 103303. [Google Scholar] [CrossRef]
- Park, J.; Henins, I.; Herrmann, H.W.; Selwyn, G.S.; Hicks, R.F. Discharge Phenomena of an Atmospheric Pressure Radio-Frequency Capacitive Plasma Source. J. Appl. Phys. 2001, 89, 20–28. [Google Scholar] [CrossRef]
- Laimer, J.; Haslinger, S.; Störi, H. Characterization of an Atmospheric Pressure Radio-Frequency Capacitive Plasma Jet. Plasma Process Polym. 2007, 4, 487–492. [Google Scholar] [CrossRef]
- Moon, S.Y. Study on Discharge Modes and Characteristics of Large -Area Plasma Produced at Atmospheric Pressure. Ph.D. Thesis, Korea Advanced Institute of Science and Technology, Daejeon, Korea, 2006. [Google Scholar]
- Lamour, G.; Hamraoui, A.; Buvailo, A.; Xing, Y.; Keuleyan, S.; Prakash, V.; Eftekhari-Bafrooei, A.; Borguet, E. Contact Angle Measurements Using a Simplified Experimental Setup. J. Chem. Educ. 2010, 87, 1403–1407. [Google Scholar] [CrossRef]
- Patange, A.D.; Simpson, J.C.; Curtin, J.F.; Burgess, C.M.; Cullen, P.J.; Tiwari, B.K. Inactivation Efficacy of Atmospheric Air Plasma and Airborne Acoustic Ultrasound against Bacterial Biofilms. Sci. Rep. 2021, 11, 1–14. [Google Scholar] [CrossRef]
- Wang, H.; Zhang, L.; Luo, H.; Wang, X.; Tie, J.; Ren, Z. Sterilizing Processes and Mechanisms for Treatment of Escherichia Coli with Dielectric-Barrier Discharge Plasma. Appl. Environ. Microbiol. 2020, 86, 1–10. [Google Scholar] [CrossRef]
- Chew, N.S.L.; Wong, K.S.; Chang, W.S.; Ooi, C.W.; Yeo, L.Y.; Tan, M.K. Nanoscale Plasma-Activated Aerosol Generation for in Situ Surface Pathogen Disinfection. Microsyst. Nanoeng. 2022, 8, 41. [Google Scholar] [CrossRef]
- Naeem, M.; Bashir, W.; Altaf, N.U.H.; Naz, M.Y.; Shukrullah, S.; Rehman, S.U.; Shahid, M. Effect of DC Micro-Plasma Treatment on Bacteria in Its Vegetative Bacteria. In Proceedings of the IOP Conference Series: Materials Science and Engineering, Kuantan, Malaysia, 1–2 October 2019; Volume863. [Google Scholar] [CrossRef]
- Katsigiannis, A.S.; Bayliss, D.L.; Walsh, J.L. Cold Plasma for the Disinfection of Industrial Food-Contact Surfaces: An Overview of Current Status and Opportunities. Compr. Rev. Food Sci. Food Saf. 2022, 21, 1086–1124. [Google Scholar] [CrossRef]
- Dezest, M.; Bulteau, A.L.; Quinton, D.; Chavatte, L.; Le Bechec, M.; Cambus, J.P.; Arbault, S.; Nègre-Salvayre, A.; Cleâment, F.; Cousty, S. Oxidative Modification and Electrochemical Inactivation of Escherichia Coli upon Cold Atmospheric Pressure Plasma Exposure. PLoS ONE 2017, 12, e173618. [Google Scholar] [CrossRef]
- Choi, M.S.; Jeon, E.B.; Kim, J.Y.; Choi, E.H.; Lim, J.S.; Choi, J.; Park, S.Y. Application of Dielectric Barrier Discharge Plasma for the Reduction of Non-Pathogenic Escherichia Coli and E. coli O157: H7 and the Quality Stability of Fresh Oysters (Crassostrea Gigas). Lwt 2022, 154, 112698. [Google Scholar] [CrossRef]
- Nicol, M.K.J.; Brubaker, T.R.; Honish, B.J.; Simmons, A.N.; Kazemi, A.; Geissel, M.A.; Whalen, C.T.; Siedlecki, C.A.; Bilén, S.G.; Knecht, S.D.; et al. Antibacterial Effects of Low-Temperature Plasma Generated by Atmospheric-Pressure Plasma Jet Are Mediated by Reactive Oxygen Species. Sci. Rep. 2020, 10, 3066. [Google Scholar] [CrossRef]
- Lim, J.; Hong, E.J.; Kim, S.B.; Ryu, S. The Effect of Gap Distance between a Pin and Water Surface on the Inactivation of Escherichia Coli Using a Pin-to-Water Plasma. Int. J. Mol. Sci. 2022, 23, 5423. [Google Scholar] [CrossRef]
- Niemira, B.A.; Boyd, G.; Sites, J. Cold Plasma Inactivation of Escherichia coli O157:H7 Biofilms. Front. Sustain. Food Syst. 2018, 2, 1–7. [Google Scholar] [CrossRef]
- Liu, X.; Wang, Z.; Li, J.; Wang, Y.; Sun, Y.; Dou, D.; Liang, X.; Wu, J.; Wang, L.; Xu, Y.; et al. Inactivation of E Coli, S Aureus, and Bacteriophages in Biofilms by Humidified Air Plasma. Int. J. Mol. Sci. 2022, 23, 4856. [Google Scholar] [CrossRef]
Publisher’s Note: MDPI stays neutral with regard to jurisdictional claims in published maps and institutional affiliations. |
© 2022 by the authors. Licensee MDPI, Basel, Switzerland. This article is an open access article distributed under the terms and conditions of the Creative Commons Attribution (CC BY) license (https://creativecommons.org/licenses/by/4.0/).