Article

Microsecond Discharge Produced in Aqueous Solution for Pollutant Cr(VI) Reduction

1
LSPM-CNRS UPR3407, Université Sorbonne Paris Nord, 93430 Villetaneuse, France
2
LPL-CNRS UMR7538, Université Sorbonne Paris Nord, 93430 Villetaneuse, France
3
Département GIIM, Université Sorbonne Paris Nord, 93430 Villetaneuse, France
4
GREMI-UMR 7344, CNRS–Université d’Orléans, CEDEX 2, 45067 Orléans, France
*
Authors to whom correspondence should be addressed.
Plasma 2022, 5(4), 408-422; https://doi.org/10.3390/plasma5040030
Submission received: 8 September 2022 / Revised: 22 September 2022 / Accepted: 26 September 2022 / Published: 29 September 2022
(This article belongs to the Special Issue Feature Papers in Plasma Sciences)

Abstract

:
This paper presents a detailed analysis of underwater electrical discharge parameters in the treatment of chromium (VI) used as a model pollutant to analyze the reduction process by plasma liquid interaction (PLI). Pin-to-pin microsecond discharges were performed in an aqueous Cr(VI) solution and the processes were characterized using electrical measurements, optical imaging and UV-Vis absorption measurements for [Cr(VI)] estimation. For the first time, the total reduction of Cr(VI) was successfully achieved by PLI process and a maximum energy yield of 4.7 × 10⁻⁴ g/kJ was obtained. Parametric studies on electrode geometry, applied voltage, electrodes gap and pulse duration are presented in detail. Finally, an analysis of the process is proposed by comparing our results of the energy yield calculation based on the injected energy with those of the literature and by providing an estimation of the global energy efficiency of the process.

1. Introduction

The presence of pollutants in aqueous solution is one of the main environmental problems that have to be addressed in the next century [1,2]. Due to extensive human industrial activities, heavy metals are among the most common pollutants found in wastewater. They are known to be highly toxic even at low concentration [3,4]. As a consequence, the removal of these contaminants requires improvements of the existing technologies in order to develop more efficient and greener processes. During the last decade, electrical discharge inside or in contact with liquid has acquired significant importance in water treatment. Several technologies of plasma liquid interaction (PLI) are reported in the treatment of wastewaters, for example, electrodes immersed in the solution or at least one electrode above the solution [5]. These systems generate reactive species that involve oxido-reduction mechanisms with the pollutants of the solution [6,7,8,9,10].
Among heavy metals, chromium (VI) is one of the most used in diverse industrial processes (tanning, energy production, steel industries, etc.) [11,12,13]. Moreover, it is considered as one of the most toxic chemicals and is classified as a CMR agent (Carcinogenic, Mutagenic, Reprotoxic) [4,14]. Previous studies have been already reported for the remediation of Cr(VI) in a liquid phase by plasma processes [15,16,17,18,19,20,21,22,23,24] (a comparison with these works is developed in Section 4). They highlighted that PLI can be considered as a promising remediation technology among the physico-chemical methods. Wang et al. reported that the energy efficiency of Cr(VI) reduction in glow discharge plasma is higher than those in semiconductor photocatalysis and comparable to that in electrolytic reduction [19]. However, as it will be presented in detail in this paper (Section 4), the results reported to date have not been entirely satisfactory since they involved either a high energy cost or only a partial Cr(VI) reduction. Recently, the authors have shown that the total reduction of Cr(VI) can be obtained by an underwater plasma process and the mechanisms of Cr(VI) reduction have been discussed [25]. In this paper, the analysis of the chemical activity of the process (pH, conductivities, kinetics) provides valuable additional information about the discharges’ consequences. To be competitive, processes based on PLI require additional studies that are necessary to better understand the reduction mechanisms and then to improve the water treatment. This paper presents a detailed study that uses Cr(VI) as a model pollutant to analyze the reduction in the PLI process. Various experimental parameters are varied, such as electrode geometry, applied voltage, electrode gap and pulse duration, in order to study their influence on the Cr(VI) reduction process. In addition, an innovative approach is proposed by discussing the energy yield estimation in order to perform a global analysis of the process. The estimation of the total energy efficiency of processes is of great interest to position PLI in relation to other removal technologies considering economic and sustainable criteria.

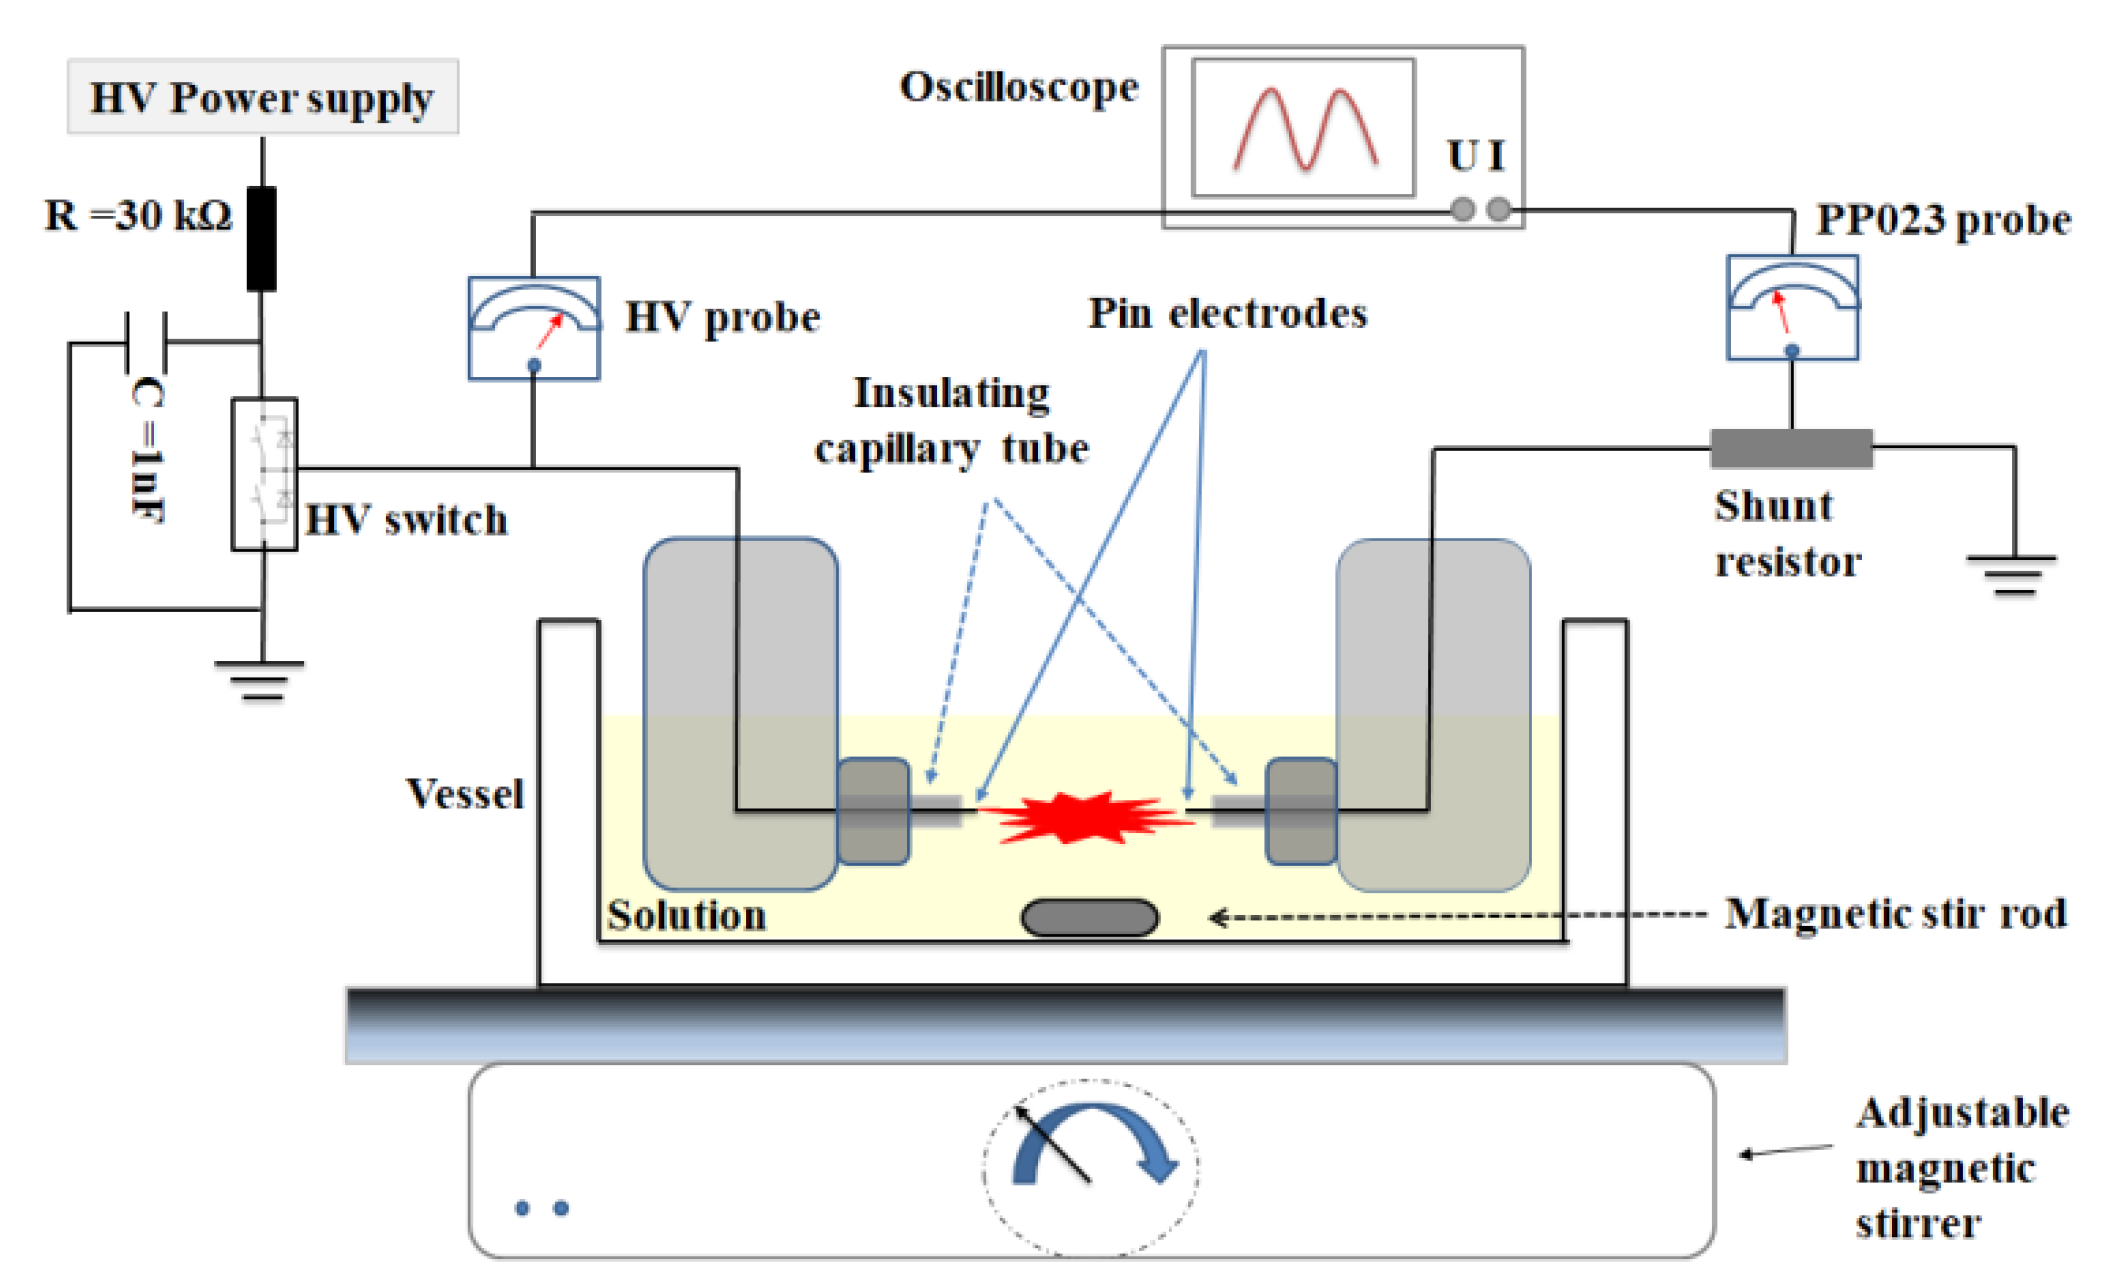
2. Materials and Methods

A general schematic of the experimental set-up is shown in Figure 1. It is dedicated to produce microsecond pulsed electrical discharges in liquid using a pin-to-pin configuration. To generate high voltage pulses, a low-inductance capacitor (C = 1 nF) is charged by a 30 kV DC high voltage power supply (Ultravolt 30A24-P30), passing through a 30 kΩ resistor, which discharges through a fast high-voltage solid-state switch (Behlke HTS 301-03-GSM). The electrode system consists of a symmetrical electrode pair of platinum (Pt) wires of 99.99% purity, with two possible diameters of 100 and 200 µm. The diameters have been chosen small enough for the configuration to be independent of the electrode tips’ shape. The main part of the electrodes is completely isolated from the surrounding liquid with plastic capillary tubes. The length of the pin electrode protruding from the insulator in the solution ranges from 0 to 500 µm. Both electrodes are connected to a micrometer control system (XYZ) to adjust their position and the inter-electrode distance is variable from 0.5 to 5 mm.
The positive high-voltage pulse has a rise time equal to 30 ns and a variety of electrical parameters are chosen: the voltage range is between U = 2 kV and 12 kV and the pulse duration varies from Δt = 10 µs to 1 ms. The repetition rate of the process is constant and equal to 50 Hz.
The two electrodes are immersed in the treated solution (V = 100 mL) contained in a rectangular quartz vessel (100 × 50 × 50 mm). In order to maintain a homogeneous aqueous solution, a magnetic stirring bar is used at the bottom of the reactor.
A Cr(VI) solution with a concentration equal to 50 mg/L (± 0.3 mg/L) is prepared by dissolving 0.1414 g of potassium dichromate (K2Cr2O7) in 1 L of distilled water. An amount of 94 mL of this solution is then mixed with 6 mL of acid H2SO4 (0.1 M). We choose to work in an acidic environment since it is known to provide better Cr(VI) removal due to the increase of the oxidation potential of Cr(VI) with the decrease of the pH and the higher reaction rate of Cr2O72− with H [17,18,19]. The resulting properties of the initial solution are: Cr(VI) concentration [Cr(VI)] = 47 ± 0.3 mg/L; conductivity σ = 4 mS/cm; and pH = 2.3–2.4.
In situ optical diagnostics are used to study the discharge properties in the Cr(VI) solution (Figure S1 in supplementary file). The source light is a 1.5 W CW Ventus laser (532 nm) and the collection is performed with a high-speed camera (Photron SAS) for time-resolved shadowgraphy measurements (exposure time of 0.37 μs; frame rate of 372 kfps). An Andor istar 734 camera is used for fast imaging (exposure time of 100 ns).
Electrical diagnostics are performed using a HV probe (LeCroy PMK 20 kV, 1000:1, 100 MHz) and a shunt current (R = 10 Ω connected to Lecroy PP023 probe) monitored using an oscilloscope (HDO9104-1GHz, Teledyne LeCroy) (Figure 1). The injected energy for one pulse E / p u l s e is determined by integrating the product of the measured current and voltage values over the pulse duration. E / p u l s e is calculated and monitored all along the experiment by an online program every 250 pulses.
The concentration of Cr(VI) is determined ex situ by UV-vis spectrophotometry (AvaSpec-2048 XL, Avantes). Direct measurements, based on the original absorption of Cr(VI) ions [26], are performed at 350 nm every 15 min during the treatment process. An amount of 2 mL of the treated solution is sampled directly in the vessel using a micropipette with disposable tips. It is noted that the DPC (1.5-diphenylcarbazide) method, which ensures selectivity and lower detection limit [26], is also performed punctually to confirm the results, especially for low concentrations. The process duration is defined to be equal to a maximum of 2 h.
Two parameters of great interest are used to perform analysis of the system: the removal efficiency of Cr(VI), η (%), which is calculated by (1), and the energy yield of the Cr(VI) degradation, Y (g/kJ), calculated by (2) [27]:
η = C 0 C t C 0 × 100 ,
Y = C 0 × V × 1 100 × η E t o t a l × 100 ,
where C 0 is the initial concentration of the reactant (g/L), C t is the concentration of the reactant after a given treatment time t (g/L), V is the volume of the solution (L) and E t o t a l is the total injected energy (kJ) estimated from E / p u l s e .

3. Results

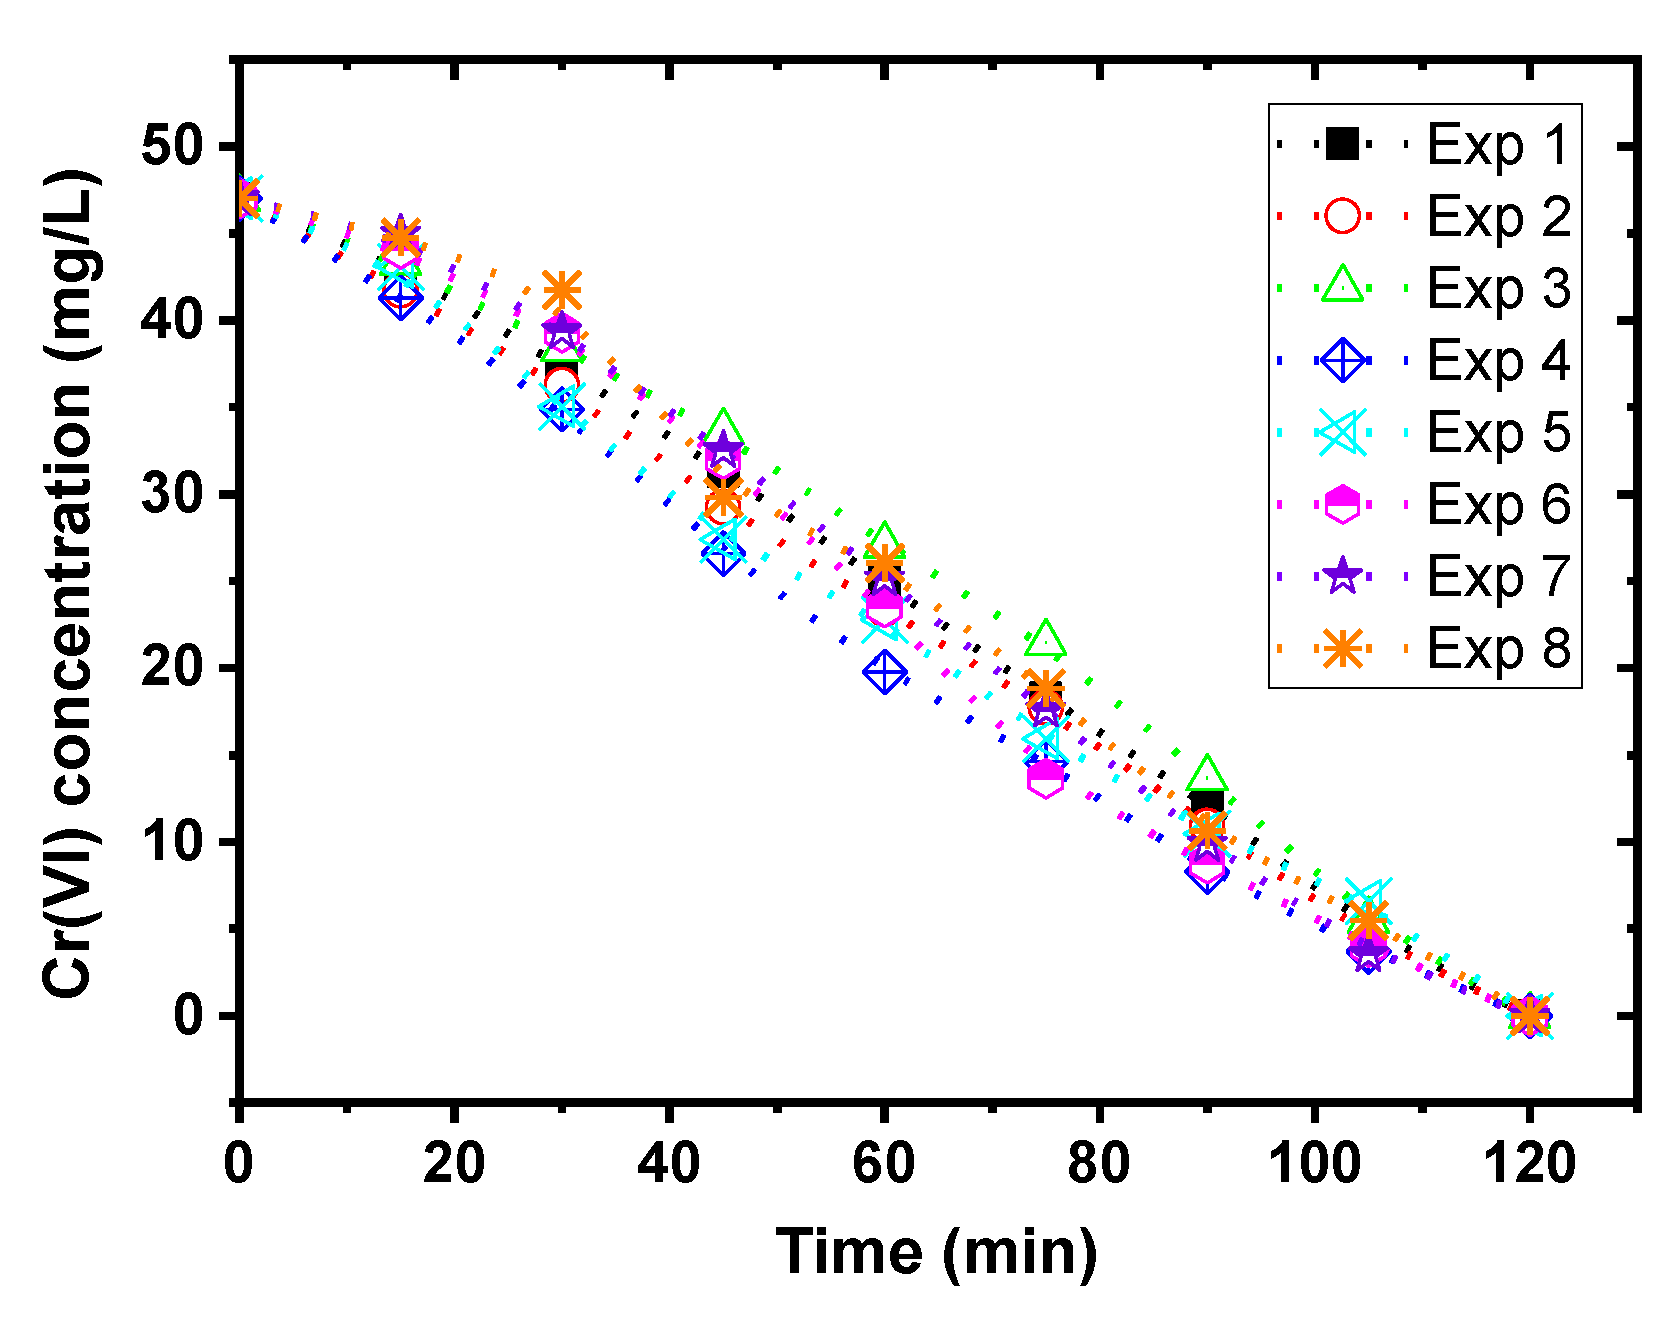
3.1. Achievement of Cr(VI) Reduction Process

Figure 2 illustrates the evolution of [Cr(VI)] during the plasma process with typical experimental conditions (9 kV, 2 mm gap, pulse duration Δt = 500 µs, f = 50 Hz). The first observation is that the total reduction of Cr(VI) is successfully obtained after two hours of process for those conditions.
Measurements of Cr(VI) concentration as a function of time have been repeated for the same experimental condition and the corresponding standard deviation is calculated. Indeed, even if the uncertainty regarding the concentration measurement is less than 1%, we showed in previous work that the discharge characteristics change during the process, leading to possible variations [28]. Due to this reason, it is necessary to verify the experiments’ reproducibility to estimate the global variation of the process. Figure 2 reports an example of [Cr(VI)] measured as a function of treatment time for eight repeated experiments obtained using the same initial conditions. The standard deviation ranges from 1 to 2.3 mg/L, being maximum for Cr(VI) concentrations between 15 and 40 mg/L. We note that for other experimental conditions the results are similar. As a consequence, a function is defined to estimate the standard deviation of [Cr(VI)] in relation to the concentration of Cr(VI) and the corresponding values are reported as error bars in the figures.

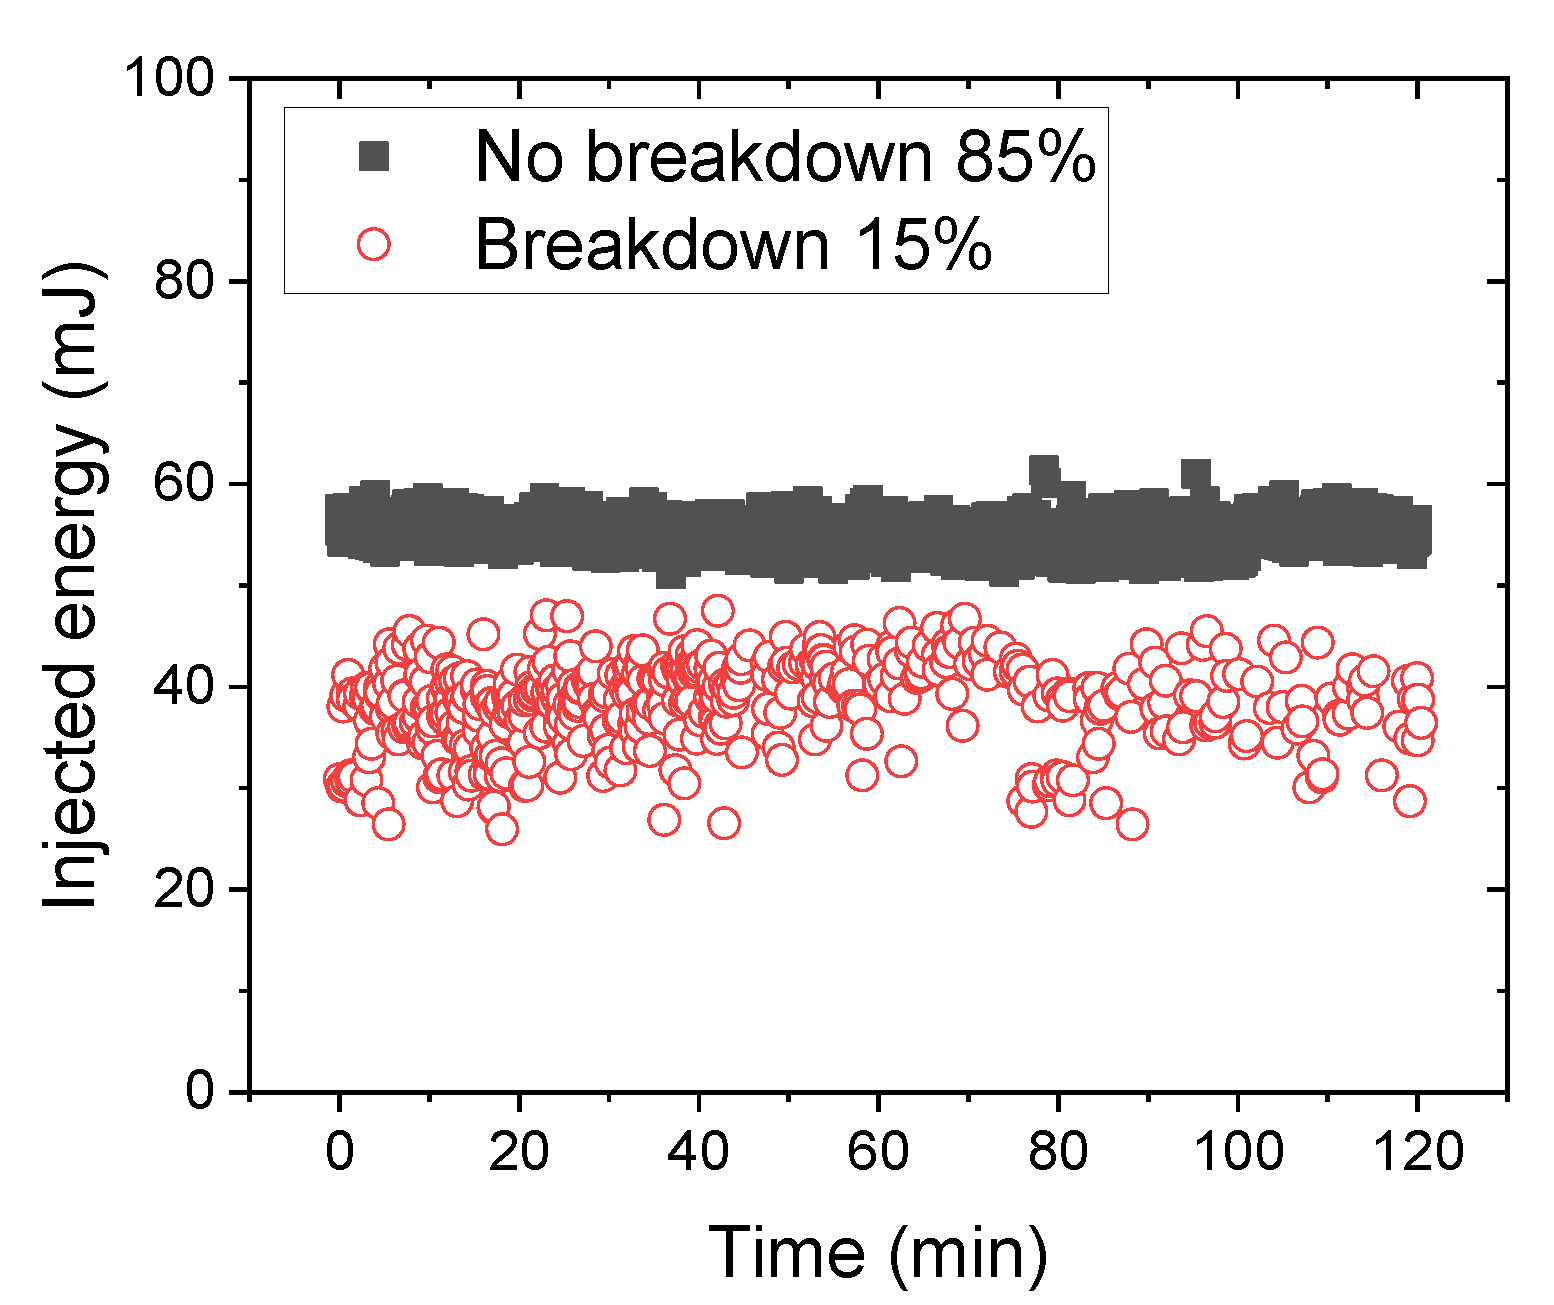
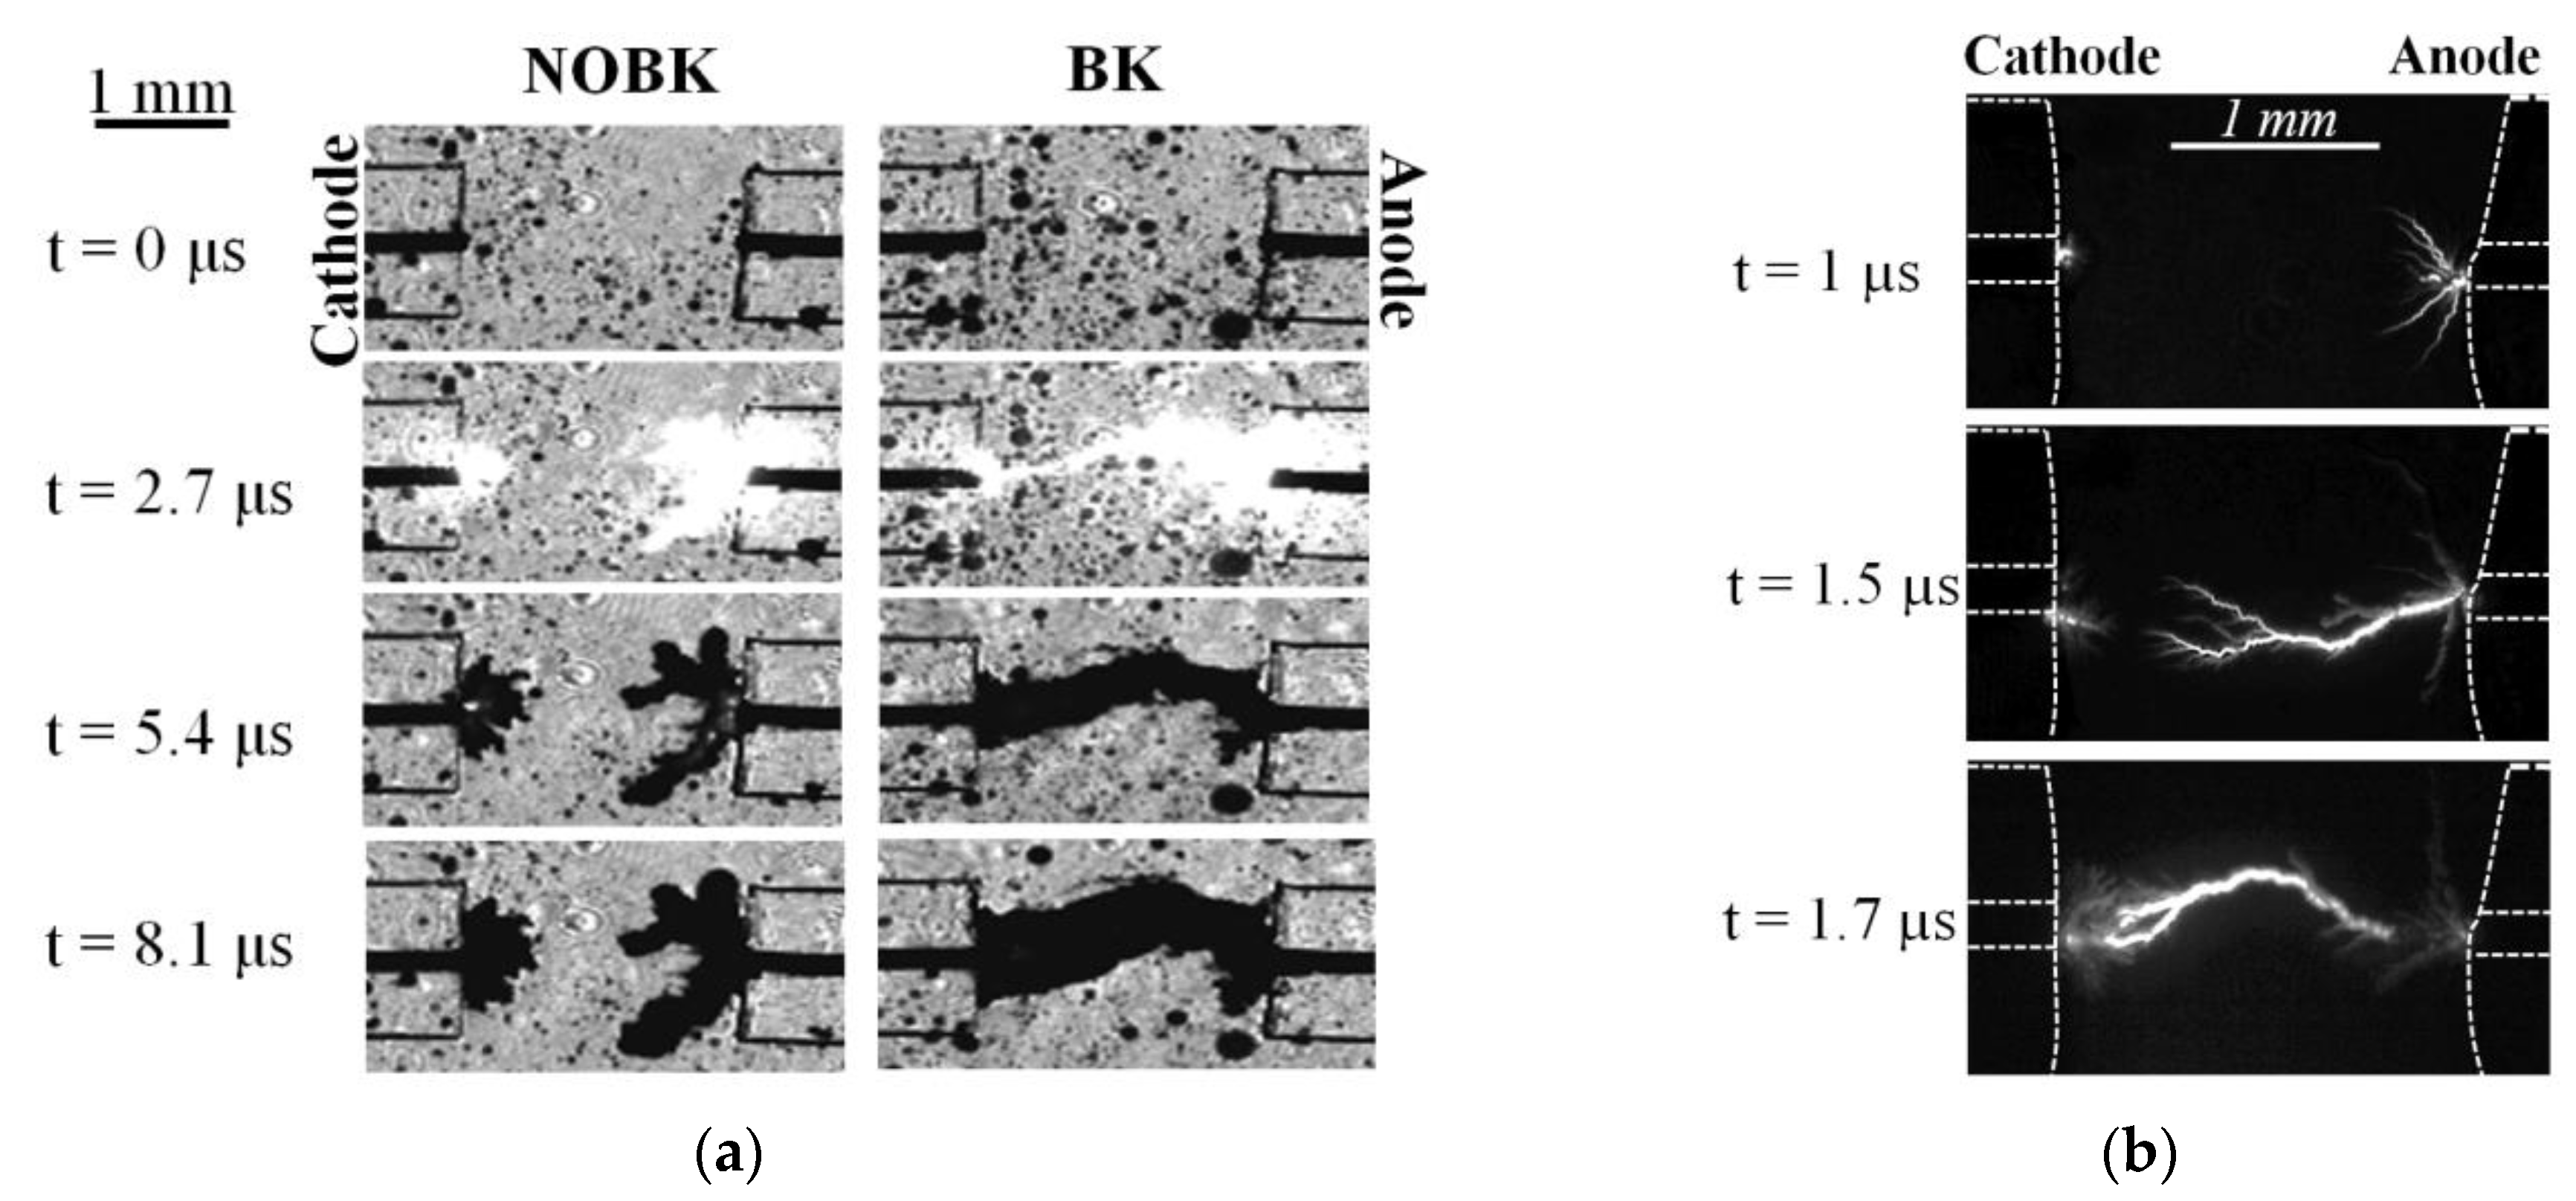
3.2. Discharge Characteristics Analysis

Considering the experimental results (electrical measurements and time-resolved shadowgraphy) of all the measurements performed in the frame of this work, two different kinds of discharge are identified. The main feature is the presence or not of breakdown, as a consequence, these discharges are referred as “NOBK” (for no breakdown) and “BK” (for breakdown).
Figure S2 (Supplementary File) shows typical voltage and current waveforms obtained in cases of BK and NOBK. The analysis of the electrical signals has been widely detailed in [29,30]. It is observed that the discharge occurs during the first 10 µs. More specifically, the current signals show that the charges are mainly injected during these first microseconds for NOBK discharge and even faster for BK discharge since the breakdown phenomenon is not measured after 4 µs.
From the analysis of the electrical signals, two important parameters can be obtained: the energy per pulse ( E / p u l s e discussed in Section 2) and the distribution between breakdown (%BK) and no breakdown (%NOBK) discharges. The injected energy changes according to the type of the discharge (BK or NOBK). The value is about 20% lower for breakdown than for no breakdown: as an example, in Figure S3 (Supplementary File), the injected energy per pulse is equal to 40 mJ for breakdown and 52.7 mJ for no breakdown. In both cases, the energy stored by the capacitor is the same for a given voltage (0.5 × C × U2), but the energy conversion is different. The initial energy is distributed between thermal and mechanical processes and the distribution strongly depends on the discharge regime [31]. For NOBK, most of the initial energy is used in thermal processes, whereas for BK a small part is converted into mechanical energy (shock wave). Moreover, for these experimental conditions, the statistical analysis shows 15% of BK discharge and 85% of NOBK discharge during the process (Figure 3). This distribution reports the average over the total process duration (120 min). It is noted that this distribution of BK/NOBK changes slightly with time, the number of BK decreasing during the process. As an example, in Figure 3, we have 21% of breakdown during the first 40 min of the experiments, whereas it decreases to 7% during the last 10 min. These variations can be attributed to the erosion of the electrodes over the process [32].
From these measurements, it is possible to estimate the total energy injected in the discharge during all the process (taking into account the distribution of BK and NOBK and their respective energy per pulse). This parameter is of great interest to characterize the performance of the process, in particular by estimating the energy yield (Equation (2)). As an example, for the experiment reported in Figure 3, the total energy injected during the two-hour process was equal to 18.8 kJ.
In addition to the electrical signals, the shadowgraphy technique provides further information about discharge features. As an example, Figure 4a shows shadowgraphy images of NOBK and BK discharges obtained under the same experimental conditions. It can be seen that at t = 2.7 μs for NOBK, only glowing plasma is observed at the two electrodes, whereas for BK the two electrodes are connected by a plasma channel. Due to repetitive pulses (f = 50 Hz), bubbles resulting from the previous discharge can be observed in the liquid from the first image (see dark dots in Figure 4a at t = 0µs). Images in Figure 4b, resulting from fast imaging, give more precise information on the evolution of the discharge propagation at first instants, due to better time resolution. It should be noted that the images are taken from different experiments. It is shown that the glow at both electrodes appears as soon as t = 1 μs and is more significant at the anode than the cathode. Then, the filamentary structure propagates mainly from the anode toward the cathode (t = 1.5 μs) before connecting the electrodes. These results show that the discharge characteristics in Cr(VI) solution (4 mS/cm) are very similar to those observed in water for 1.5 mS/cm, for which two different regimes have been also identified [30]. The conductivity of the aqueous solution has a major effect on the discharge characteristics, unlike the nature of the dissolved species.

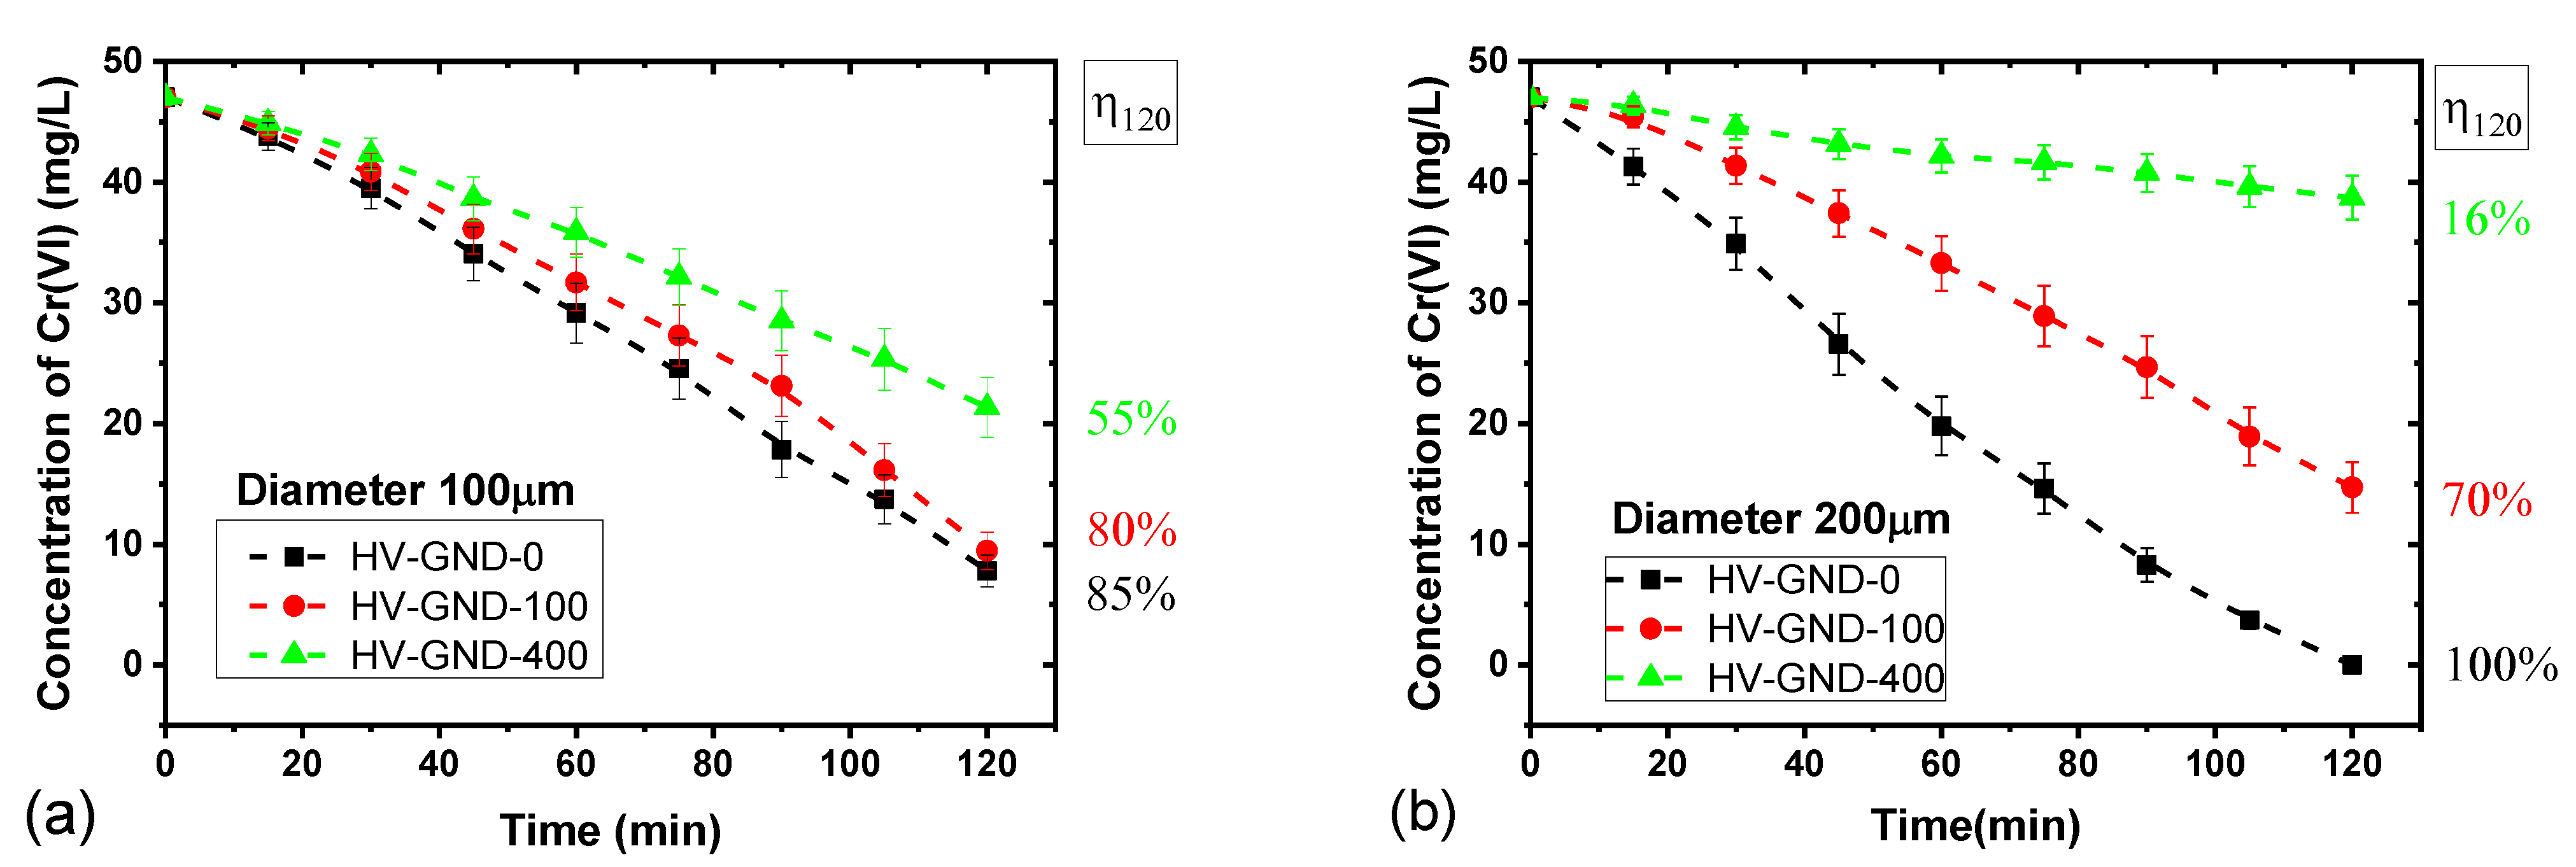
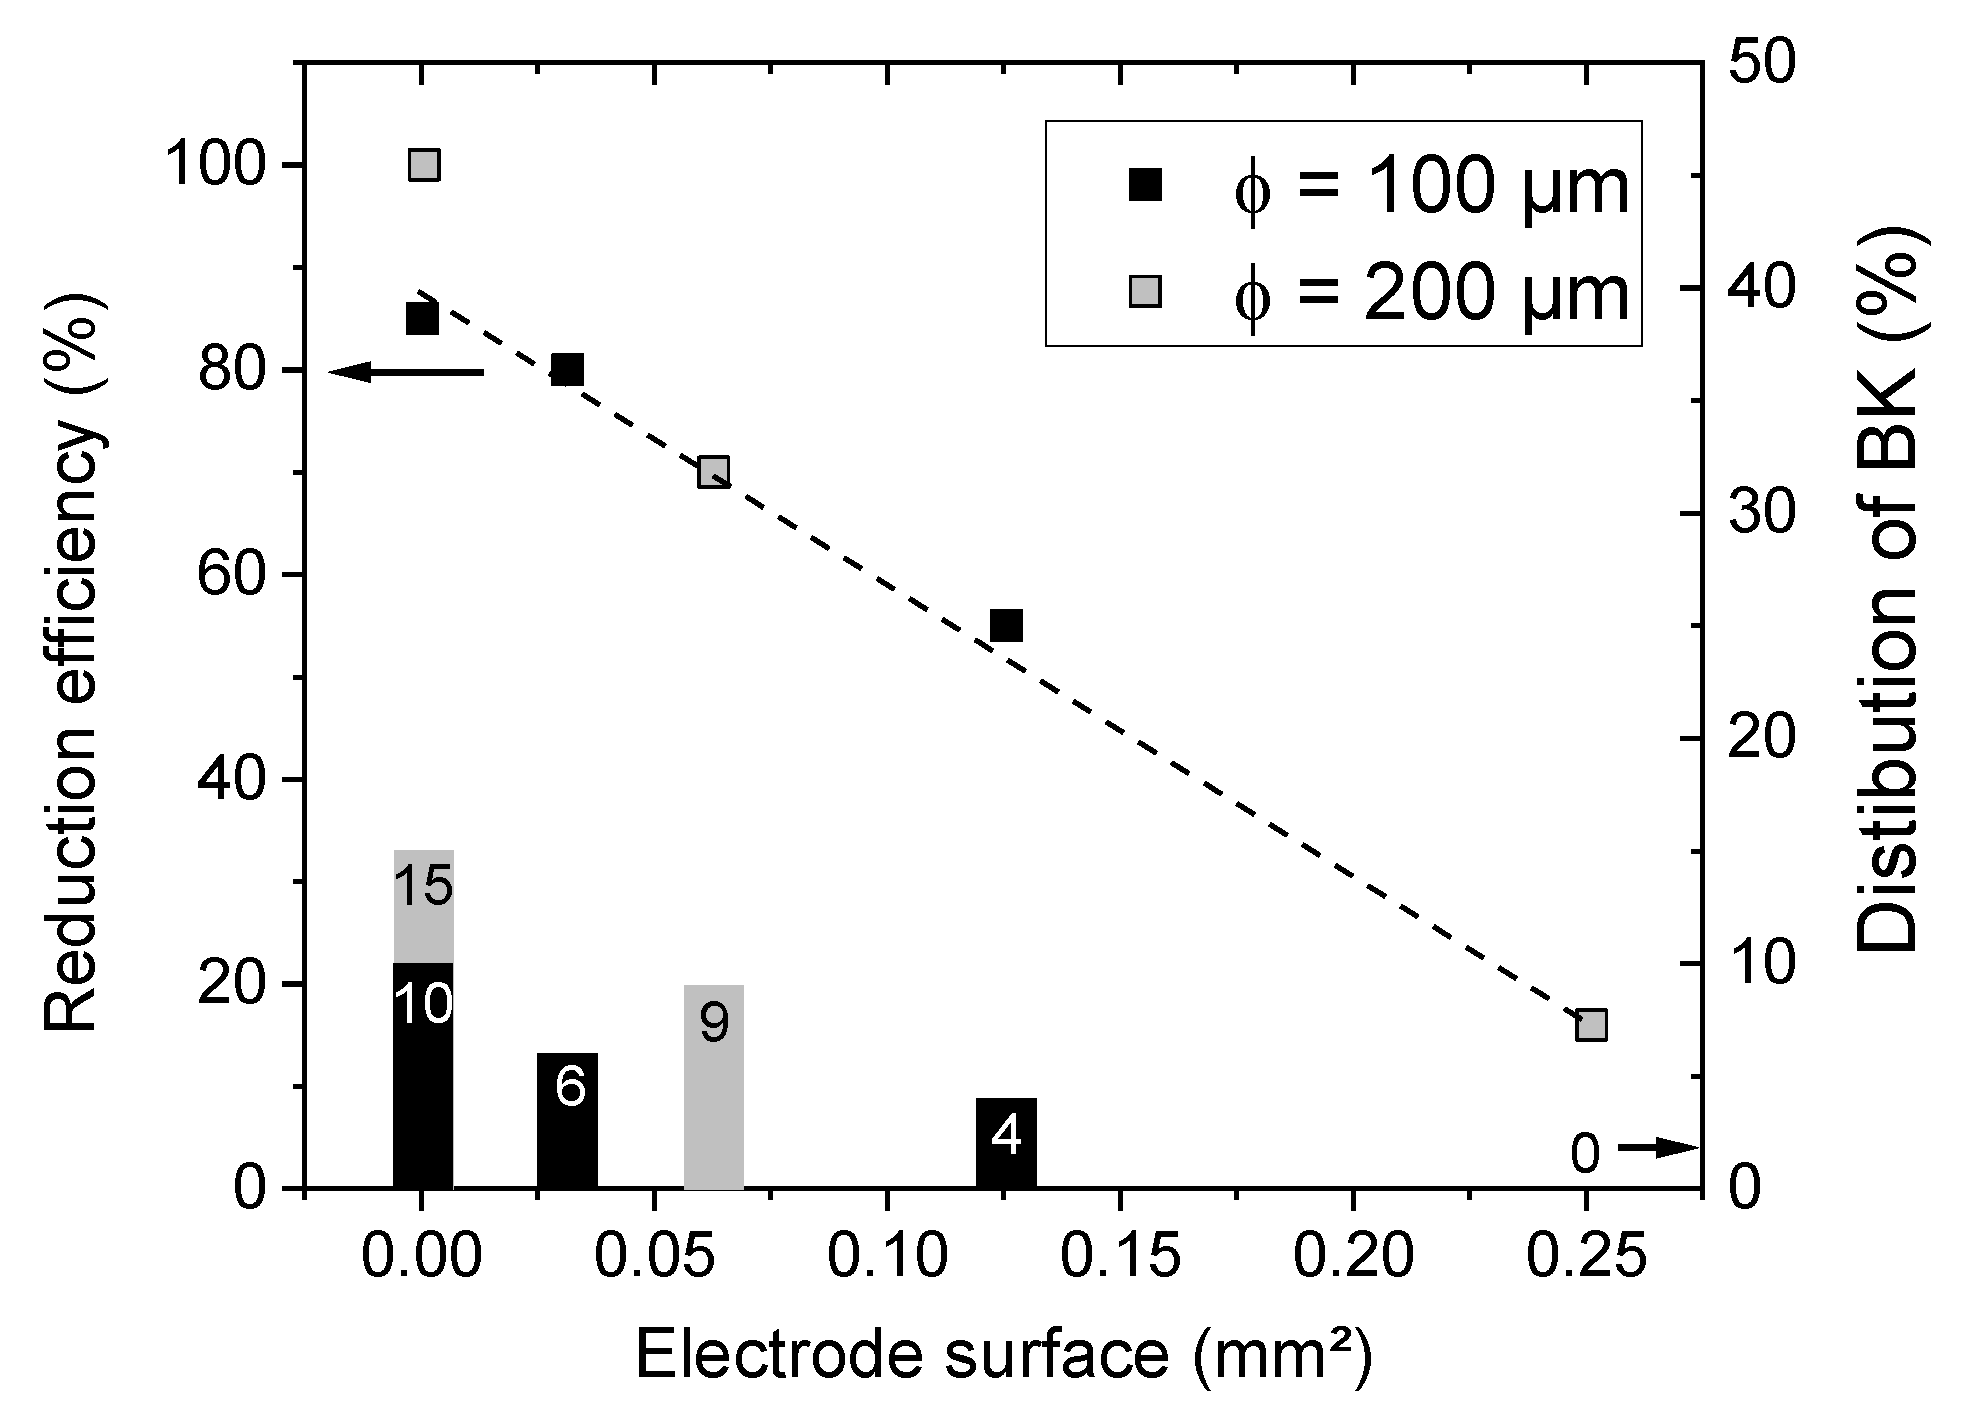
3.3. Influence of the Electrode Geometry

The lengths of the platinum electrodes that are used are 0 ± 10 µm (the electrodes do not show off the capillary), 100 ± 30 µm and 400 ± 30 µm, and noted HV-GND-0, HV-GND-100, and HV-GND-400, respectively (the gap between the two electrode tips is kept equal to 2 mm). The electrode length is measured ex situ by color 3D Laser Microscope (VK-9710K) before and after the PLI process [32]. The used diameters are Ø = 100 µm and 200 µm.
Representing the time evolution of [Cr(VI)] during PLI, Figure 5 shows the effect of the electrode length on Cr(VI) reduction for two electrode diameters, 100 µm (a) and 200 µm (b). First, we report that the time evolution of [Cr(VI)] is almost linear for all conditions. As a consequence, we can state that the reduction rate is quite constant. The slight variations of the BK/NOBK distribution and energy per pulse with time reported in Figure 3 have no measurable influence.
A significant effect of the length and the diameter of the electrodes is observed on the [Cr(VI)] evolution. When the electrode length decreases from 400 to 0 µm, the reduction efficiency for two hours of process increases from 55% to 85% for Ø = 100 µm and from 16% to 100% for Ø = 200 µm. We also note that, for the condition HV-GND-0, Cr(VI) reduction with Ø = 200 µm (100%) is higher than for Ø = 100 µm (85%), whereas for the condition HV-GND-400, it is only 16% with Ø = 200 µm and 55% with Ø = 100 µm.
Changing either the length or the diameter involves changing the electrodes’ surface in contact with the liquid. Figure 6 shows that the reduction efficiency decreases almost linearly when the electrode surface in contact with the liquid increases. It has been reported that the surface of the electrodes can be important for the discharge initiation [33]. Some oxide layers can be formed by the current heating that introduces defects modifying the initial conditions of the discharge. We also note that for HV-GND-0, no surface effect can explain the difference in the reduction efficiency between Ø = 100 µm and 200 µm.
We report that the variations according to the diameter and the length are not due to different injected energies, which are quite constant for all conditions ( E B K ¯ = 40   mJ and E N O B K ¯ = 52.7   mJ ). Figure 6 also shows that the variation of the electrodes’ geometry has an influence on the distribution between BK and NOBK. It is observed that the lower the length, the higher the number of BK, e.g., the percentage of BK decreases from 15% to 0% when the length increases from 0 to 400 µm (ø = 200 µm). However, Figure 6 reports that the electrodes’ surface has no straight influence on the percentage of breakdown. For the electrode surface equal to 0.0314 mm2, the reduction efficiency is 80% with 6% of BK, whereas for 0.0628 mm2 the reduction efficiency is equal to 70% with 9% of BK. Moreover, for HV-GND-0, the increase of the diameter leads to the increase of %BK (from 10 to 15%), whereas for HV-GND-400 it leads to the decrease of %BK (from 4 to 0%). The authors alert that no direct relation can be established between the number of breakdowns and the reduction efficiency of the process, as it will be shown later in this paper.
From these results, the parameters HV-GND-0 and Ø = 200 µm represent the best electrode configuration for Cr(VI) reduction that will be used for next studies since it provides total reduction of Cr(VI) after 2 h.

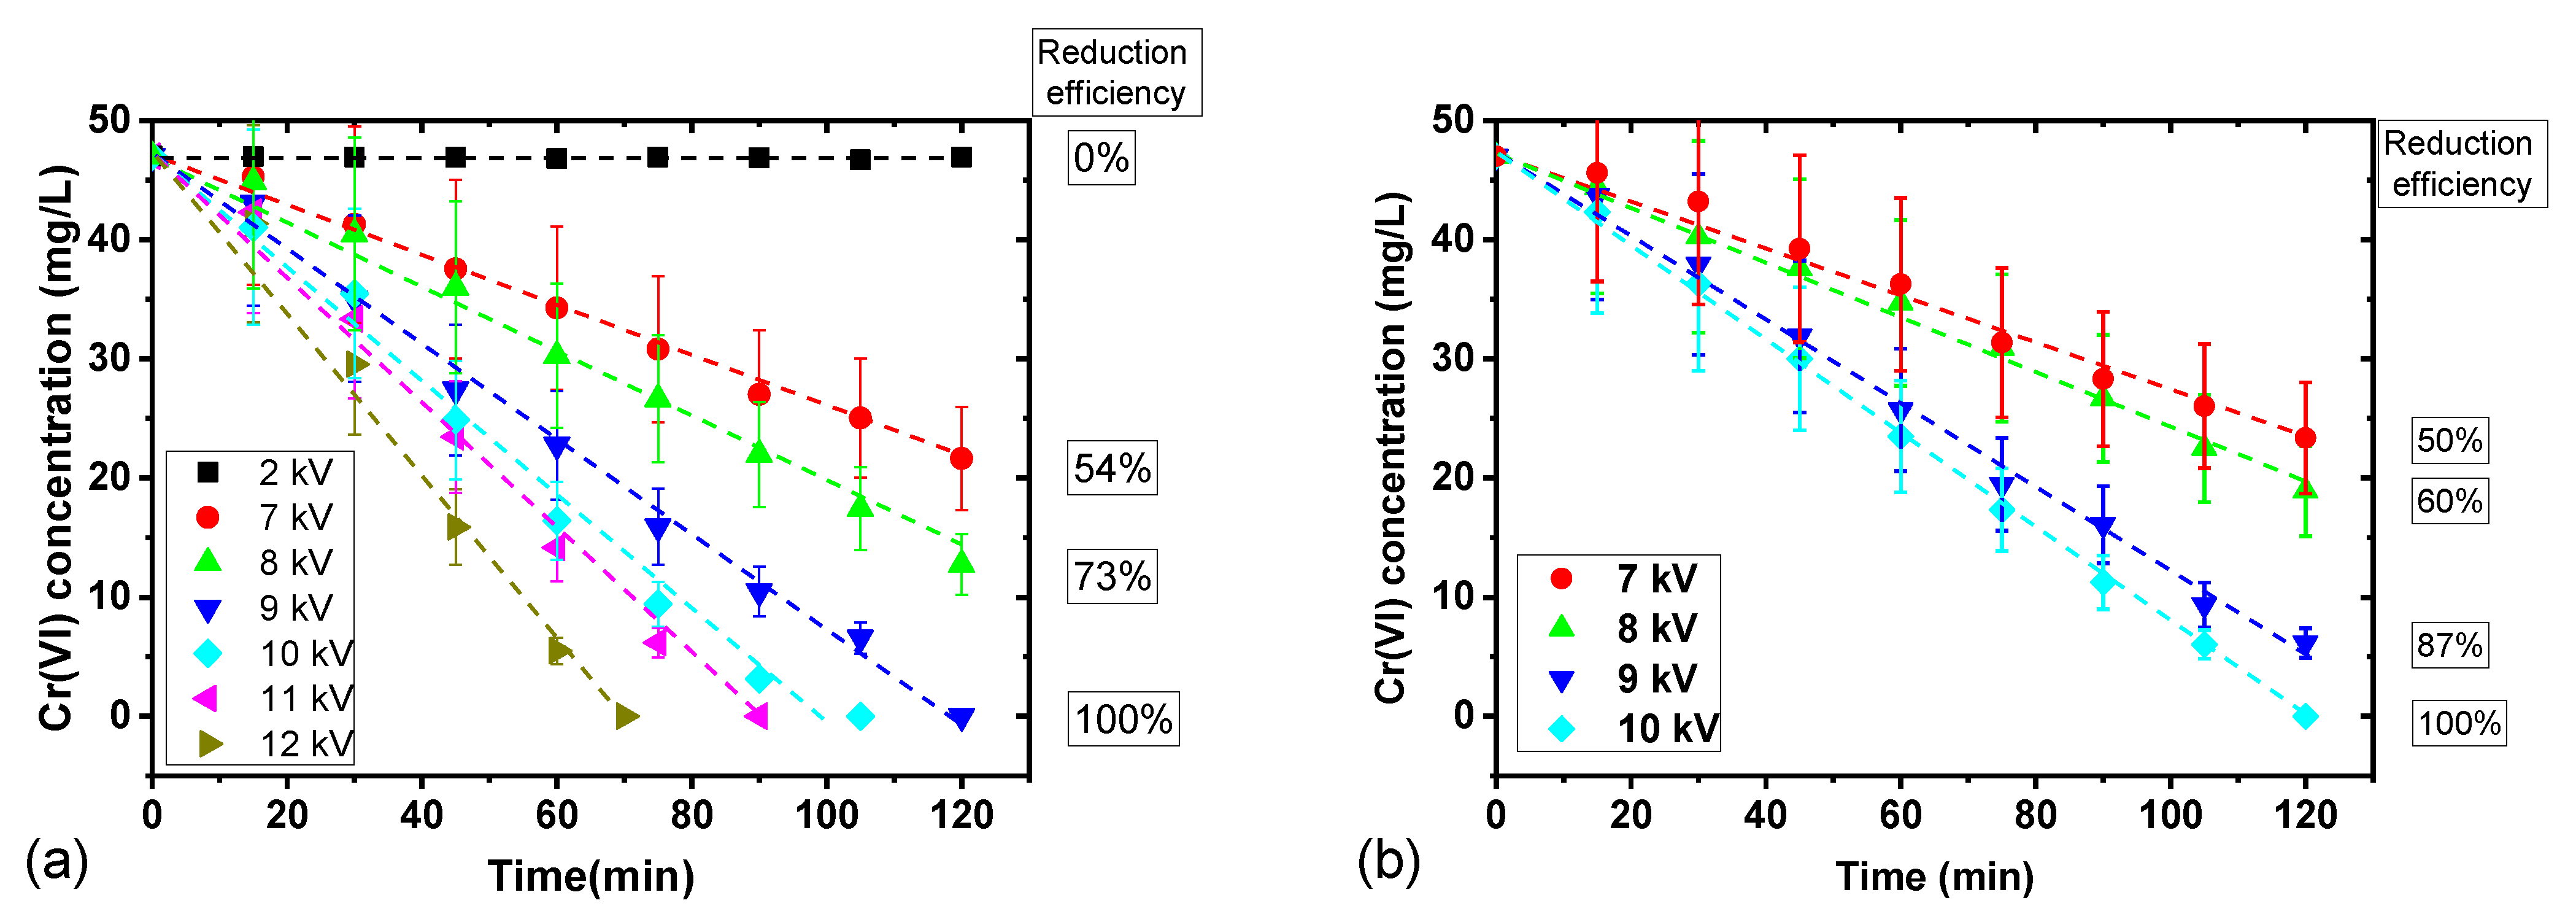
3.4. Influence of the Electric Field

The applied voltage value is one parameter that directly affects the injected energy and the electric field. Figure 7 shows the time evolution of Cr(VI) concentration for different applied voltages during two hours of process. The Cr(VI) reduction rate increases with the applied voltage. With the evolution of [Cr(VI)] being almost linear, the reduction rate is estimated (Table 1) by using a linear fit that systematically reports a coefficient of determination R2 > 0.98.
For a 2 mm gap (Figure 7a), the applied voltage varies from 2 to 12 kV. We note that for 2 kV no discharge is observed, the electrolysis effect alone cannot reduce Cr(VI) (also reported by [19]) and from 9 kV it is possible to totally reduce the Cr(VI) of the solution in two hours. We observe that increasing the applied voltage leads to an increase of the reduction rate from 0.21 mg.L−1/min at 7 kV to 0.67 mg.L−1/min at 12 kV (Table 1).
The increase of the applied voltage changes the number of breakdowns during the experiment: only 1% of BK is obtained for 7 kV, and it is increased to about 55% for 12 kV (Table 1). This result is expected because increasing the applied voltage leads to an increase in the electric field at the tip of the electrodes that favors the discharge ignition and propagation. Moreover, the injected energy per pulse increases with the applied voltage for both BK and NOBK discharges (Table 1). For example, it is equal to about 28/36 mJ (BK/ NOBK) at 7 kV, while these values are equal to 66/95 mJ for 12 kV.
The calculation of the energy yield shows that this parameter changes non-monotonously with the applied voltage, giving the lowest value (2.0 × 10⁻⁴ g/kJ) for 7 kV and the highest one (2.8 × 10⁻⁴ g/kJ) for 12 kV (Table 1). This variation shows that the change of the total injected energy is not the only parameter that has an influence on the reduction efficiency when changing the applied voltage. We have reported that increasing the applied voltage leads to increasing both injected energy per pulse and the number of BK. Then, we chose to work with a 5 mm gap where no breakdown is observed in order to discriminate the effect of each parameter on the reduction efficiency.
For a 5 mm gap (Figure 7b), we also observe that the reduction rate increases with the applied voltage, it ranges from 0.2 mg.L−1/min at 7 kV to 0.39 mg.L−1/min at 10 kV (Table 2). These experiments show that the higher the total injected energy, the better the Cr(VI) reduction, but, once more, the energy yield is not constant. These results confirm that the total injected energy is not the only parameter that has an influence on the reduction rate but also shows that the distribution of BK/NOBK cannot explain the variation since breakdowns are not produced in these conditions.
The increase of the applied voltage involves other physical and chemical mechanisms that play a role in Cr(VI) reduction. As presented in Figure 8, these effects are similar for both gaps. Indeed, the energy yield follows the same evolution according to the voltage, but the 2 mm gap presents higher values of about 0.5 g/kJ than the 5 mm gap.
Due to better efficiency with a shorter gap, additional measurements are performed at 9 kV for 1.5, 1 and 0.5 mm of gap and the corresponding energy yields obtained are reported in Figure 8. These results confirm that decreasing the gap leads to an increase in the energy yield of the process (and also the reduction efficiency) and the effect is not linear (inset in Figure 8). It is also noticed that the decrease of the gap increases the number of breakdowns, from 0% at 5 mm to 80% at 0.5 mm.
Changing the applied voltage and the gap leads to a modification of the electric field. As a first approximation, it is possible to estimate the maximum electric field at the tip of the electrode by using the analytical equation given by [34,35]. Since this equation has been developed for a different configuration (pin-to-plane) and medium (gas), only a relative electric field (normalized to the minimum value) is reported to study its influence on the Cr(VI) reduction. The accurate estimation of the electric field would require dedicated modeling work that is not in the scope of this work.
Figure 8 reports the reduction rate and the energy yield according to the normalized electric field for different applied voltages and gaps. The variation of the reduction rate is quite linear and a global tendency suggests that the highest electric field provides the best reduction rate and energy yield. However, no strict monotonous evolutions are obtained. These results can be attributed to either the uncertainties on the electric field estimation or additional phenomena acting on Cr(VI) reduction. It can be assumed that the reduction mechanism of Cr(VI) mainly depends on the electron properties (energy and density) but not only. These results prove that the reduction mechanisms are intertwined and driven by a combination between several different phenomena.

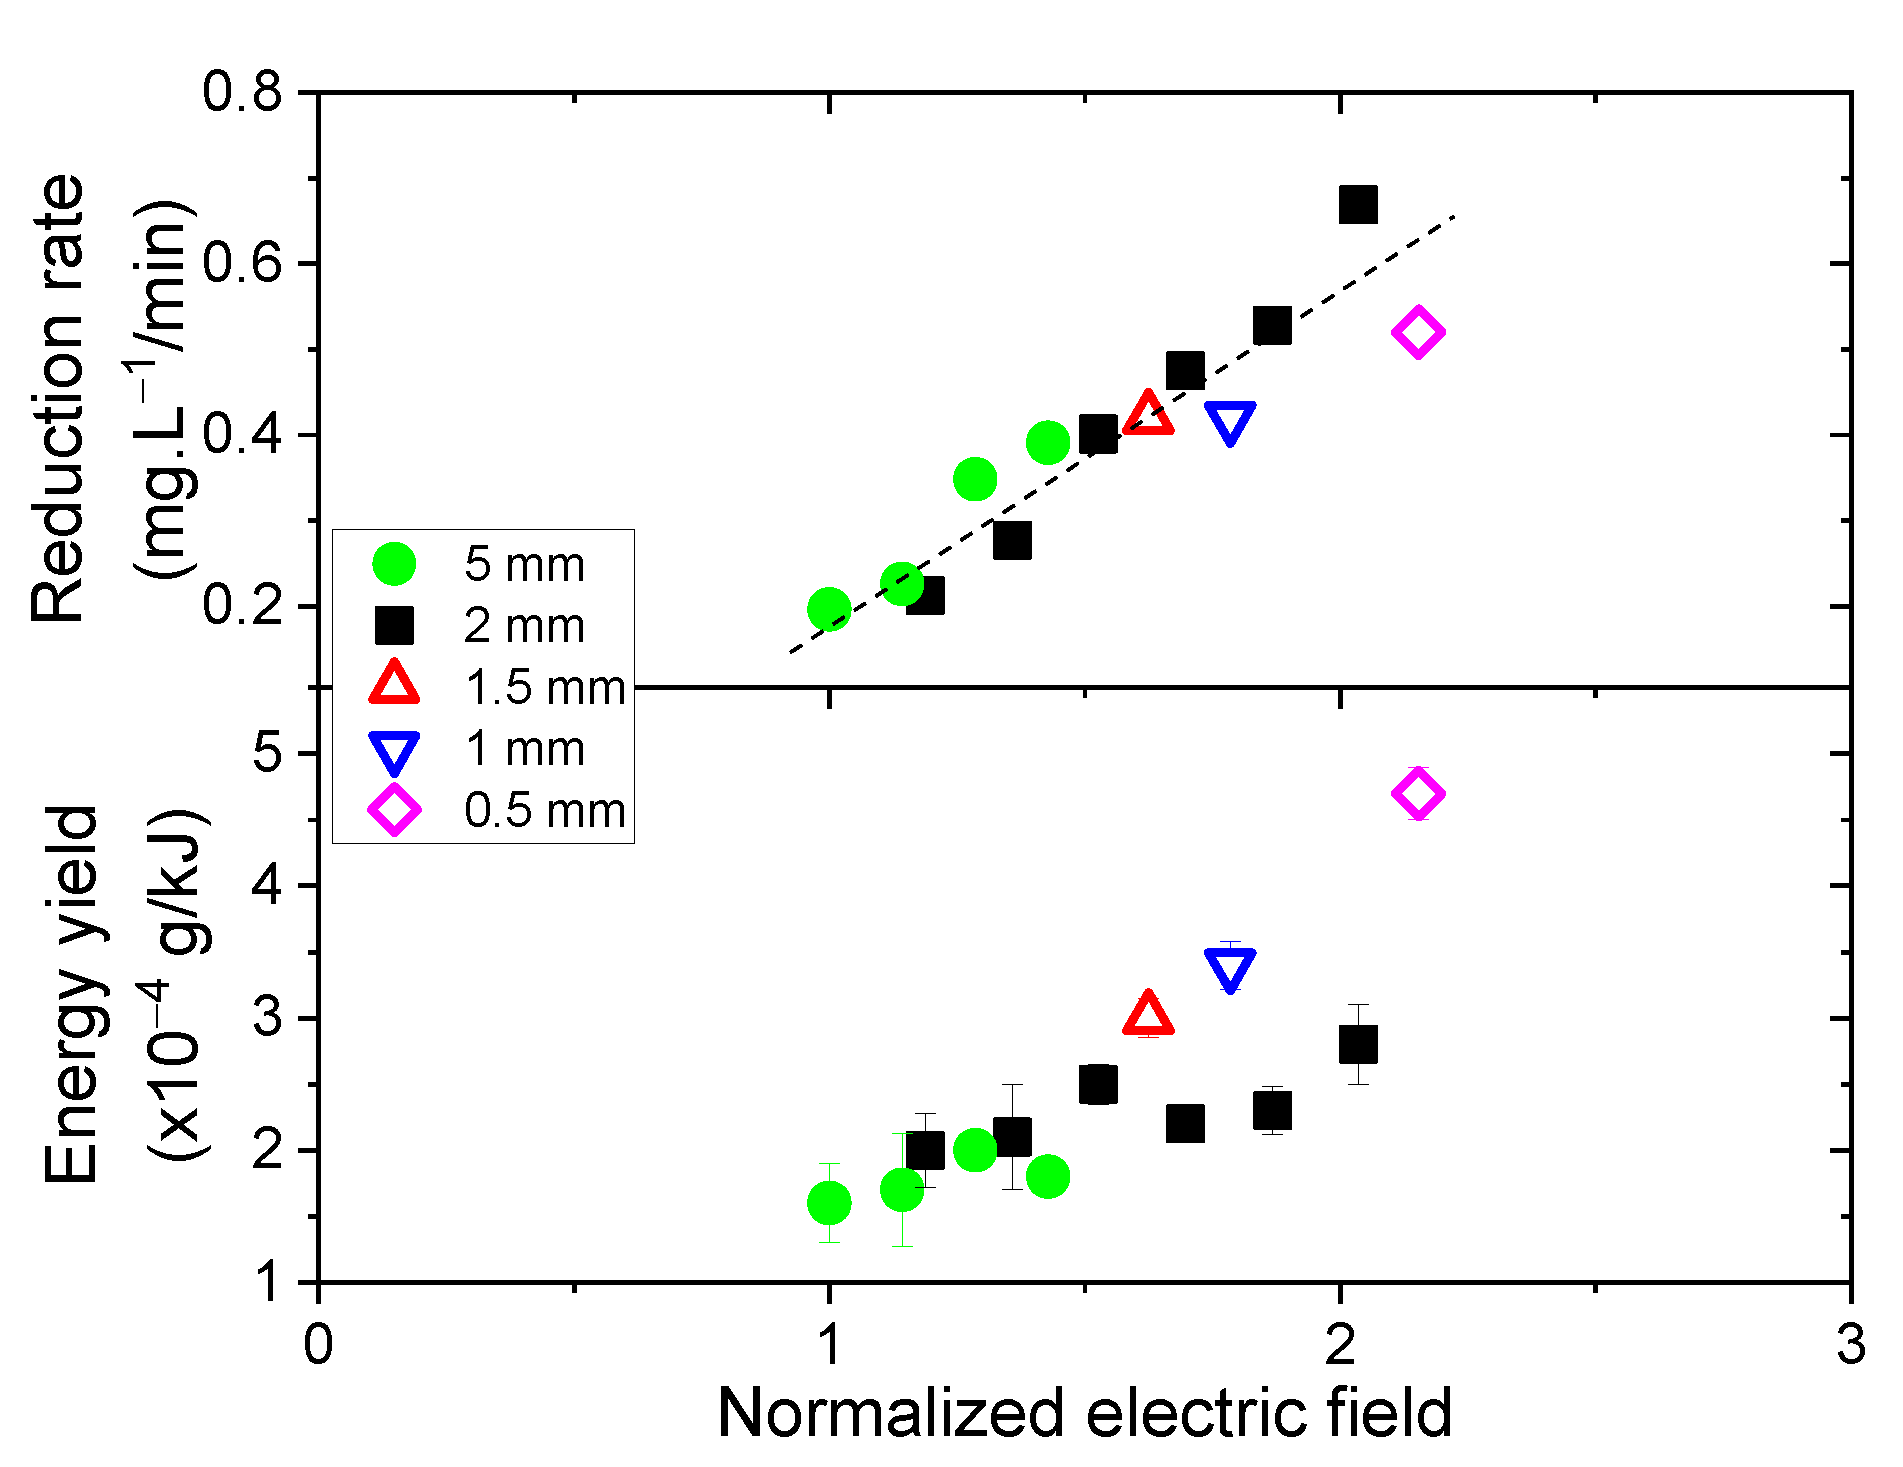
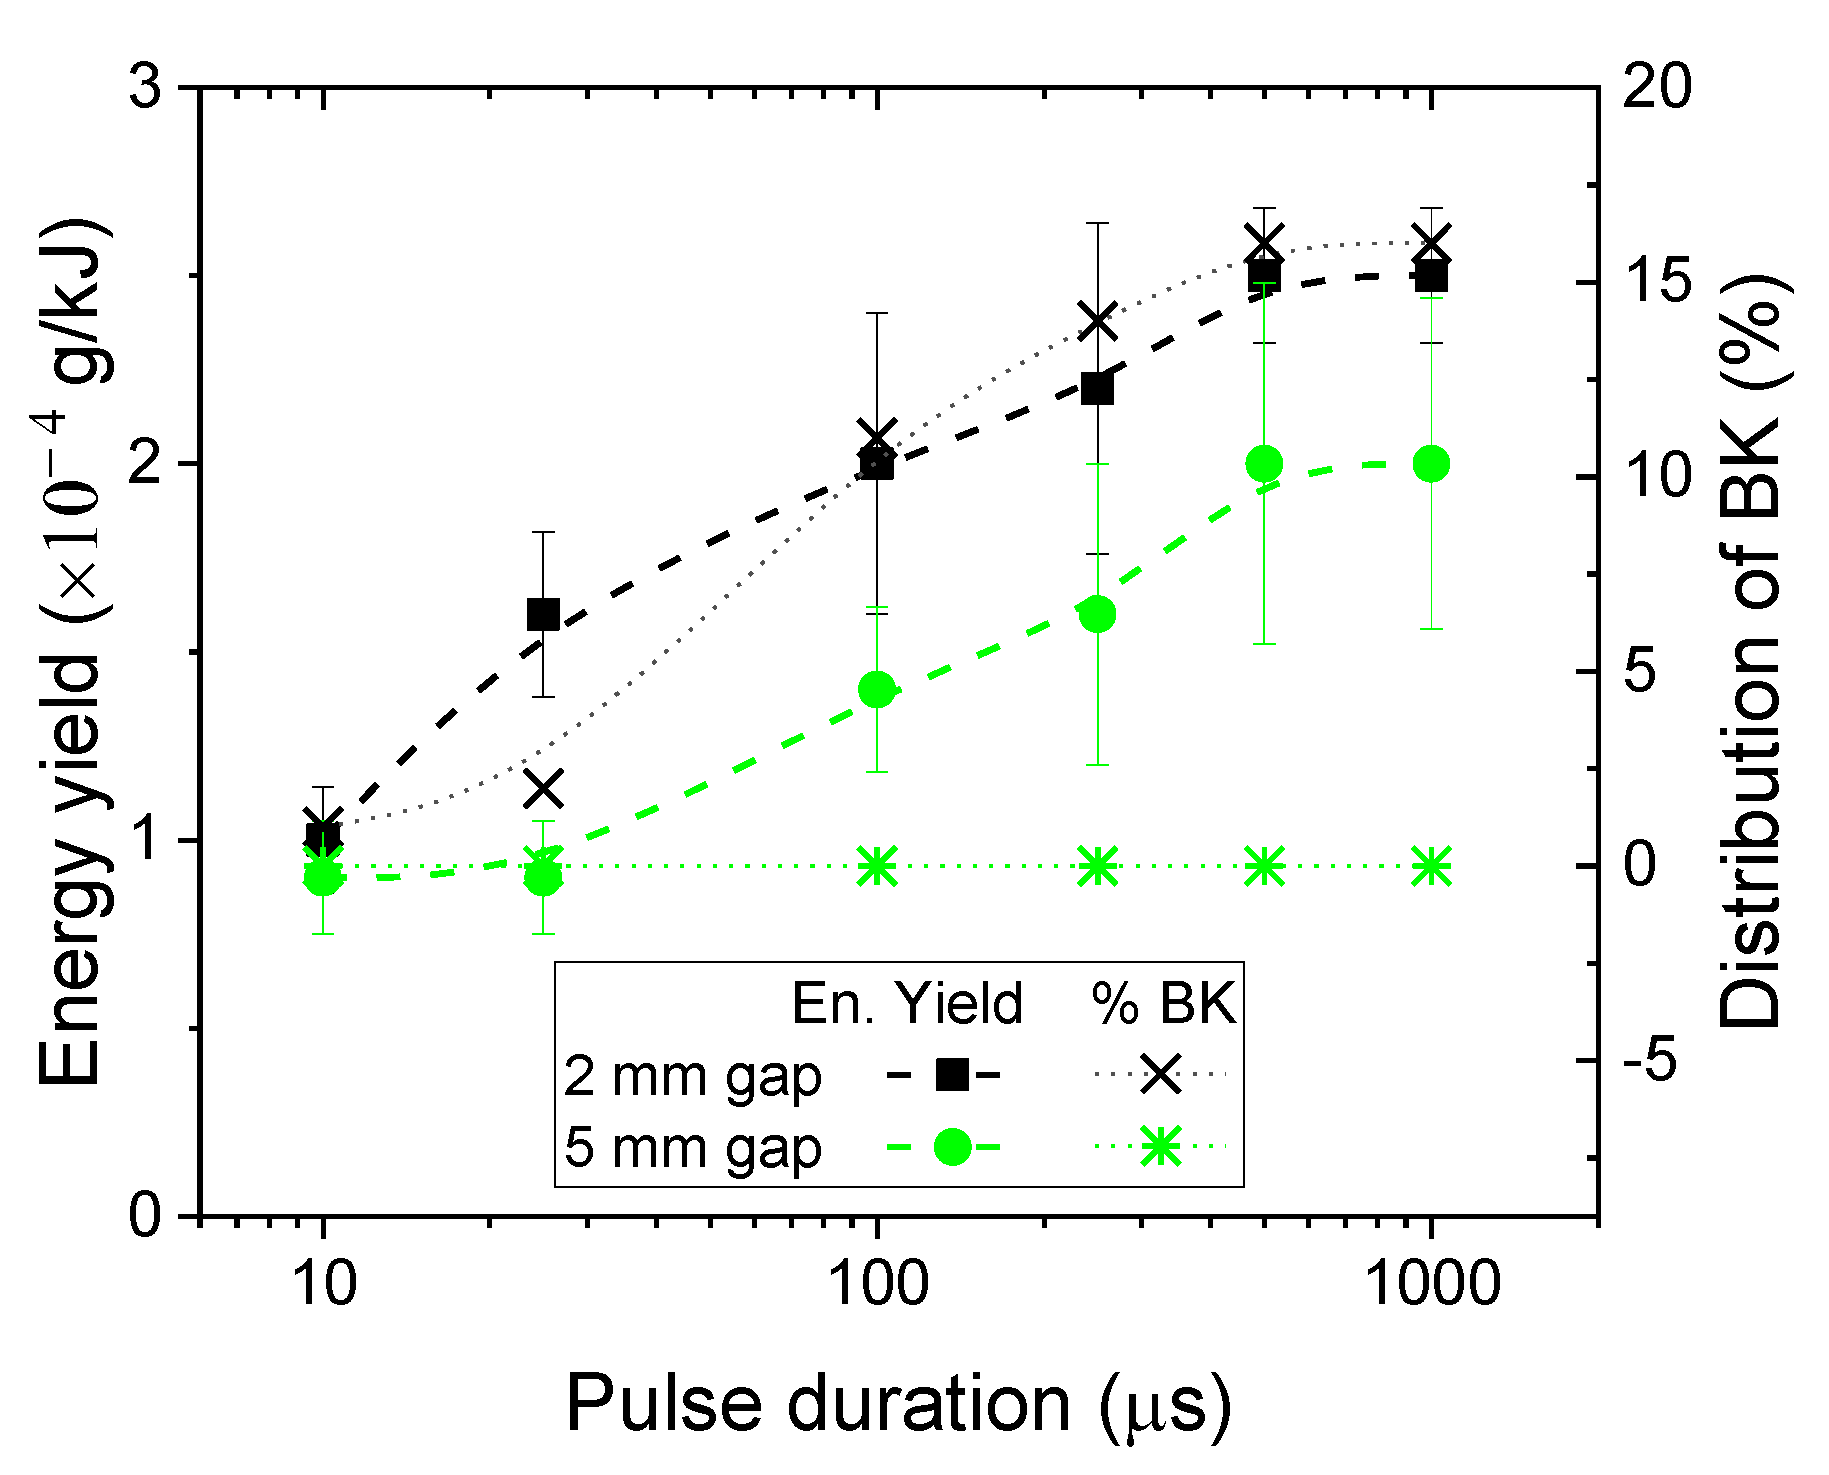
3.5. Influence of Pulse Duration

The dynamics of the discharge are also an important parameter directly related to the kinetics of the process. In order to better characterize the Cr(VI) reduction, the process performances are analyzed by changing the pulse duration from 10 µs to 1 ms for a given voltage value. Figure 9 shows that the energy yield increases significantly with the pulse duration for the two gaps (2 and 5 mm). The evolution is not linear, the energy yield increases significantly for low pulse durations (<250 µs) when it is more progressive for high pulse durations. As an example, for the 2 mm gap, the energy yield increases from 1 × 10⁻⁴ g/kJ for Δt = 10 µs to 1.6 × 10⁻⁴ g/kJ for Δt = 25 µs and then it is limited to 2.5 × 10⁻⁴ g/kJ from Δt = 500 µs.
In Figure 9, we observe that for Δt = 10 µs the energy yield is 10−4 g/kJ for the two gaps (the reduction efficiency is about 30%). Then, for pulse duration equal to 25 µs, the gap has an influence on the Cr(VI) reduction since the energy yield measured for the 2 mm gap is higher than for the 5 mm gap. An additional phenomenon is involved for only the 2 mm gap, leading to higher reduction between 10 and 25 µs. Then, from 25 µs, the energy yield continues to increase with the pulse duration with a similar trend for both gaps: the same difference of about 0.5 × 10⁻⁴ g/kJ is maintained between the 2 mm and 5 mm gaps.
This result can be related to the kinetics of the discharge. Indeed, as discussed in Section 3, the propagation of the discharge is fast (due to high conductivity): in about 5 µs, the voltage drops to 1 kV and the current reaches zero (Figure S2). In the case of breakdown discharge, these variations are even faster since breakdown used to occur at around 3 µs (Figure S2). The minimum duration of 10 µs ensures that the whole plasma phase is involved in the process despite the variability of the experiments [28]. It is noted that during the first 10 µs, the voltage and current signals show similar evolutions for all the pulse durations. Between pulse durations of 10 µs and 1 ms, the variation of the total energy is equal to 5% for the 2 mm gap (17.9 to 18.8 kJ) and 10% for the 5 mm gap (18.4 to 20.5 kJ), whereas the reduction efficiency more than doubles. This result confirms that the process does not mainly depend on the injected energy. Moreover, Figure 9 also reports the distribution of breakdown according to the pulse duration. This result confirms that the number of breakdowns does not influence the reduction efficiency of the process. Indeed, on the one hand, for the 2 mm gap, the increase of the energy yield between 10 and 25 µs is not related to a variation in number of breakdowns. On the other hand, for the 5 mm gap, there is no relationship between the evolution of the energy yield and those of the BK distribution.
The plasma exists during about the first 2–3 µs of the process for both BK and NOBK discharges (Figure 4). It generates reactive species, which can diffuse into solution and be responsible for Cr(VI) reduction. Despite the short duration of the discharge, its effect is significant on Cr(VI) reduction and does not depend on the gap. It can be concluded that for a short pulse duration, the main phenomena responsible for Cr(VI) reduction does not strongly depend on the gap and can be related to species produced at low energy. The discrepancy observed for Δt = 25 µs is related to the post-plasma phase, and then from 100 µs the kinetics of the Cr(VI) reduction are similar for both gaps since the evolution of the energy yield is comparable. From these results, it is observed that the reduction process does not only happen during the discharge. The plasma causes the direct reduction of Cr(VI) but also initiates multi-step mechanisms during the post-plasma phase. Despite the analysis of the electrical waveforms and time-resolved shadowgraphy measurements, no direct relationship between Cr(VI) reduction and pulse duration can be suggested to interpret these results. Additional measurements dedicated to the chemical analysis of the process are necessary. These new results confirm the complexity of the PLI system and the necessity to study the intricate subject of the plasma process as a removal technology for water treatment.

4. Discussion

We report in this work that microsecond pin-to-pin discharges in liquid are able to reduce 100% of Cr(VI) in an aqueous solution. This result is obtained for different experimental conditions (applied voltage, gap, pulse duration), providing energy yields from 1.8 to 4.7 × 10⁻⁴ g/kJ, the highest one being obtained for the 0.5 mm gap, pulse duration of 500 µs and applied voltage of 9 kV. In the first part, we aimed to compare these values with those reported in the literature for plasma liquid processes. Table 3 shows the best reduction efficiency and energy yield for Cr(VI) reduction achieved in this work and those obtained using PLI reported in the literature. The energy yields are calculated based on Equation (2) in order to ensure fair comparison despite different time evolutions of [Cr(VI)] between each experiment. It should be noted that the experimental conditions (such as the initial concentration or the pH) are similar for all the works (more details are given in Table S1 of the Supplementary File).
This work provides the best result coupling total Cr(VI) removal and energy efficiency. Indeed, plasma processes above the liquid are able to totally reduce Cr(VI) but they involve lower energy efficiency (at least three times lower), whereas some plasma processes inside liquid provide similar energy yield but no total reduction.
In order to be consistent with the literature, the energy yield (Equation (2)) is calculated using the total injected energy (involving the voltage and current related to the discharge). As an example, in Table 4, the total injected energy and the energy yield for a total reduction of Cr(VI) is reported for three different applied voltages. This approach is interesting from a process point of view either to study the relation between the charge injected in the liquid and the reduction process or to compare very similar processes. For example, Wang et al. [19] and Du et al. [7] have reported comparisons of Cr(VI) reduction by different electrochemical processes and they have shown that the energy efficiency of their gaseous glow discharge is better than photocatalysis and similar to electrolytic reduction. We note that the reported values of efficiency are calculated based on 50% conversion of Cr(VI) since they do not succeed in totally removing Cr(VI) during their treatment duration.
However, from an economic and sustainable approach, the whole consumed energy has to be considered to promote green technology. Indeed, to compare very different processes, it is of interest to take into account the total energy balance, which is generally not mentioned in the previous literature. In case of PLI treatment, the main energy requirement comes from the power supply and it is known that the injected energy is lower than the consumed energy due to the low conversion efficiency of the power supply.
To answer this point, we proposed in this work an original approach that has not been used in literature for plasma process, to our knowledge. The total energy consumption is determined by direct measurement of the voltage and the current delivered by the electrical network to the DC HV power supply using Lecroy PP023 and Chauvin Arnoux E3N probes, respectively. The measurements are monitored at 100 ms and extrapolated to estimate the energy consumed during the two hours of process. These values are given in Table 4 for three different voltages and we obtain that the total consumed energy ranges between 125 and 150 kJ. In order to validate these results, additional electrical measurements are performed at the outlet of the DC HV power supply. Considering the total efficiency of the DC HV power supply (ηDC = 0.56), similar values of total consumed energies are reported (variations < 8%). As a result, it is possible to estimate with confidence the global energy efficiency of Cr(VI) reduction, which is about 3 × 10⁻⁵ g/kJ (Table 4). This value is about one order of magnitude lower than the energy yield calculated by only considering the injected energy. Indeed, the global efficiency of the electrical circuit is about ηpower = 0.13, and the losses are mainly due to the DC power supply, as discussed previously.
This global approach is very important for the industrial scale-up of the process and the comparison with other removal technologies. It is necessary to define reliable indicators in order to promote the green approach that involves lower chemical additives and also lower energy cost.

5. Conclusions

This paper reports the analysis of the removal process of polluted water using plasma liquid interaction (PLI). Pin-to-pin microsecond discharges were performed in an aqueous solution of Cr(VI). Three different diagnostics were performed: electrical measurements (voltage and current), optical imaging (time-resolved shadowgraphy and fast imaging) and Cr(VI) concentration (by UV-Vis absorption measurements). For the first time, the total reduction of Cr(VI) was successfully obtained by PLI process in liquid and a maximum energy yield of 4.7 × 10⁻⁴ g/kJ was obtained. The variation of electrode length and diameter show that the surface in contact with the solution has an influence on the removal process. In our conditions, a diameter of 200 µm and short electrodes represent the best electrode configuration for Cr(VI) reduction. By changing the gap and the applied voltage, it can be assumed that the reduction mechanism of Cr(VI) mainly depends on the electron properties (energy and density) but not only. In particular, the role of the breakdown phenomena has not been clearly outlined. These results prove that the reduction mechanisms are intertwined and driven by a combination between several different phenomena. The results related to the variation of the pulse duration confirm the complexity of the reduction mechanism. It was observed that the efficiency increased with the pulse duration, showing that the reduction process does not only happen during the discharge. The plasma causes the direct reduction of Cr(VI) but also initiates multi-step chemical mechanisms during the post-plasma phase. Finally, the analysis of the process was proposed by providing a novel approach to estimate the global energy efficiency of the removal process. It is estimated with confidence that the global energy efficiency of Cr(VI) reduction by pin-to-pin discharge in liquid is about 3 × 10⁻⁵ g/kJ.

Supplementary Materials

The following supporting information can be downloaded at: https://www.mdpi.com/article/10.3390/plasma5040030/s1, Figure S1: Schematic diagram of the optical diagnostics in Cr(VI)-the camera is a high-speed (Photron SAS) model for time-resolved shadowgraphy measurements (exposure time of 0.37 μs; frame rate of 372 kfps) and Andor istar 734 model for fast imaging (exposure time of 100 ns). The laser is off during imaging; Figure S2: Voltage and current signals for (a) case NOBK (a zoom on the right), (b) case BK (a zoom on the right) of a pin-to-pin discharge obtained in Cr(VI) solution (47 mg/L, σ = 4 mS/cm, pH = 2.4) for 11 kV, V = 100 mL, ∆t = 500 μs, gap = 2 mm, electrodes length = 0 ± 10 μm, f = 50 Hz. The signals have been processed (Savitzky-Golay filter and cut off detection) and the resulting uncertainties are considered in energy calculation; Figure S3: Energy per pulse for BK and NOBK discharges for pin-to-pin discharges in Cr(VI) solution (47 mg/L, σ = 4 mS/cm, pH = 2.3), V = 100 mL, U = 9kV, ∆t = 500 μs, gap = 2 mm, electrodes length = 0 ± 10 μm, f = 50 Hz; Table S1: Comparison of reduction efficiency and energy yield for Cr(VI) reduction by plasma liquid interaction processes. * These values have been calculating using Equation (2) and data of the references.

Author Contributions

Conceptualization, S.T.N., A.V. and C.R.; Data curation, S.T.N., N.F., A.V. and C.R.; Formal analysis, S.T.N.; Funding acquisition, S.F. and C.R. Investigation, S.T.N., N.F., A.B., H.R. and C.R.; Methodology, S.T.N., N.F., A.V., S.F., A.B. and C.R.; Project administration, C.R.; Resources, N.F., A.V., A.B., H.R. and C.R.; Software, N.F.; Supervision, A.V., X.D., S.F. and C.R.; Validation, S.T.N., A.V., X.D., S.F., A.B. and C.R.; Visualization, C.R.; Writing–original draft, C.R.; Writing–review and editing, S.T.N., N.F., X.D. and S.F. All authors have read and agreed to the published version of the manuscript.

Funding

This work bearing the reference ANR-11-LABX-086 has benefited from State aid managed by the National Research Agency under the Future Investments program with the Reference Number ANR-18-IDEX-0001.

Institutional Review Board Statement

Not applicable.

Informed Consent Statement

Not applicable.

Data Availability Statement

Not applicable.

Acknowledgments

The authors would like to thank Yanis Nait-Bahloul for his valuable contribution leading to this research work.

Conflicts of Interest

The authors declare no conflict of interest.

References

  1. Zamora-Ledezma, C.; Negrete-Bolagay, D.; Figueroa, F.; Zamora-Ledezma, E.; Ni, M.; Alexis, F.; Guerrero, V.H. Heavy metal water pollution: A fresh look about hazards, novel and conventional remediation methods. Environ. Technol. Innov. 2021, 22, 101504. [Google Scholar] [CrossRef]
  2. Gautam, R.K.; Sharma, S.K.; Mahiya, S.; Chattopadhyaya, M.C. Contamination of Heavy Metals in Aquatic Media: Transport, Toxicity and Technologies for Remediation. Heavy Met. W. Presence Remov. Saf. 2015, 1, 1–24. [Google Scholar] [CrossRef]
  3. Järup, L. Hazards of heavy metal contamination. Br. Med. Bull. 2003, 68, 167–182. [Google Scholar] [CrossRef] [PubMed]
  4. Wilbur, S.; Abadin, H.; Fay, M.; Yu, D.; Tencza, B.; Ingerman, L.; Klotzbach, J.; James, S. Toxicological Profile for Chromium; Agency for Toxic Substances and Disease Registry: Atlanta, GA, USA, 2012. [Google Scholar]
  5. Horikoshi, S.; Serpone, N. In-liquid plasma: A novel tool in the fabrication of nanomaterials and in the treatment of wastewaters. RSC Adv. 2017, 7, 47196–47218. [Google Scholar] [CrossRef]
  6. Foster, J.E. Plasma-based water purification: Challenges and prospects for the future. Phys. Plasma 2017, 24, 055501. [Google Scholar] [CrossRef]
  7. Du, C.; Yan, J. Plasma Remediation Technology for Environmental Protection; Springer: Singapore, 2017. [Google Scholar]
  8. Joshi, R.P.; Thagard, S.M. Streamer-Like Electrical Discharges in Water: Part II. Environmental Applications. Plasma Chem. Plasma Process. 2013, 33, 17–49. [Google Scholar] [CrossRef]
  9. Locke, B.R.; Sato, M.; Sunka, P.; Hoffmann, M.R.; Chang, J.S. Electrohydraulic Discharge and Nonthermal Plasma for Water Treatment. Ind. Eng. Chem. Res. 2006, 45, 882–905. [Google Scholar] [CrossRef]
  10. Malik, M.A.; Ghaffar, A.; Malik, S.A. Water purification by electrical discharges. Plasma Sources Sci. Technol. 2001, 10, 82–91. [Google Scholar] [CrossRef]
  11. Vaiopoulou, E.; Gikas, P. Regulations for chromium emissions to the aquatic environment in Europe and elsewhere. Chemosphere 2020, 254, 126876. [Google Scholar] [CrossRef]
  12. Tumolo, M.; Ancona, V.; Paola, D.D.; Losacco, D.; Campanale, C.; Massarelli, C.; Uricchio, V.F. Chromium Pollution in European Water, Sources, Health Risk, and Remediation Strategies: An Overview. Int. J. Environ. Res. Public Health 2020, 17, 5438. [Google Scholar] [CrossRef]
  13. Barjasteh, A.; Dehghani, Z.; Lamichhane, P.; Kaushik, N.; Choi, E.H.; Kaushik, N.K. Recent Progress in Applications of Non-Thermal Plasma for Water Purification, Bio-Sterilization, and Decontamination. Appl. Sci. 2021, 11, 3372. [Google Scholar] [CrossRef]
  14. Yatera, K.; Morimoto, Y.; Ueno, S.; Noguchi, S.; Kawaguchi, T.; Tanaka, F.; Suzuki, H.; Higashi, T. Cancer risks of hexavalent chromium in the respiratory tract. J. UOEH 2018, 40, 157–172. [Google Scholar] [CrossRef] [PubMed]
  15. Bobkova, E.S.; Sungurova, A.V.; Rybkin, V.V. Reduction of chromium (VI) in aqueous solution by treatment with direct-current discharge at atmospheric-pressure in air. High Energy Chem. 2016, 50, 209–212. [Google Scholar] [CrossRef]
  16. Chen, Z.; Ponraj, S.B.; Dai, X.J. Reduction of aqueous chromium (VI) by plasma treatment of wastewater. In Proceedings of the 23rd International Symposium on Plasma Chemistry (ISPC), Montréal, QU, Canada, 30 July 2017. [Google Scholar]
  17. Jiang, B.; Guo, J.; Wang, Z.; Zheng, X.; Zheng, J.; Wu, W.; Wu, M.; Xue, Q. A green approach towards simultaneous remediations of chromium (VI) and arsenic (III) in aqueous solution. Chem. Eng. J. 2015, 262, 1144–1151. [Google Scholar] [CrossRef]
  18. Ke, Z.; Huang, Q.; Zhang, H.; Yu, Z. Reduction and Removal of Aqueous Cr (VI) by Glow Discharge Plasma at the Gas-Solution Interface. Environ. Sci. Technol. 2011, 45, 7841–7847. [Google Scholar] [CrossRef]
  19. Wang, L.; Jiang, X. Plasma-Induced Reduction of Chromium (VI) in an Aqueous Solution. Environ. Sci. Technol. 2008, 42, 8492–8497. [Google Scholar] [CrossRef] [PubMed]
  20. Wang, Z.; Bush, R.T.; Sullivan, L.A.; Liu, J. Simultaneous Redox Conversion of Chromium (VI) and Arsenic (III) under Acidic Conditions. Environ. Sci. Technol. 2013, 47, 6486–6492. [Google Scholar] [CrossRef] [PubMed]
  21. Zhang, C.; Sun, Y.; Yu, Z.; Zhang, G.; Feng, J. Simultaneous removal of Cr (VI) and acid orange 7 from water solution by dielectric barrier discharge plasma. Chemosphere 2018, 191, 527–536. [Google Scholar] [CrossRef] [PubMed]
  22. Harianti, A.R.; Saksono, N. Application of plasma electrolysis method for simultaneous phenol and Cr (VI) wastewater deg-radation using Na2SO4 electrolyte. AIP Conf. Proc. 2017, 1904, 020041. [Google Scholar] [CrossRef]
  23. Shutov, D.A.; Sungurova, A.V.; Choukourov, A.; Rybkin, V.V. Kinetics and Mechanism of Cr (VI) Reduction in a Water Cathode Induced by Atmospheric Pressure DC Discharge in Air. Plasma Chem. Plasma Process. 2016, 36, 1253–1269. [Google Scholar] [CrossRef]
  24. Jamróz, P.; Gręda, K.; Pohl, P.; Żyrnicki, W. Atmospheric Pressure Glow Discharges Generated in Contact with Flowing Liquid Cathode: Production of Active Species and Application in Wastewater Purification Processes. Plasma Chem. Plasma Process. 2014, 34, 25–37. [Google Scholar] [CrossRef]
  25. Nguyen, T.S.; Fagnon, N.; Vega, A.; Duten, X.; Forget, S.; Rond, C. Cr (VI) Reduction by Microsecond Pin-to-Pin Discharges Generated in an Aqueous Solution. Plasma Chem. Plasma Process. 2022. [Google Scholar] [CrossRef]
  26. Sanchez-Hachair, A.; Hofmann, A. Hexavalent chromium quantification in solution: Comparing direct UV–visible spec-trometry with 1,5-diphenylcarbazide colorimetry. Compte Rendus Chimi. 2018, 21, 890–896. [Google Scholar] [CrossRef]
  27. Chandana, L.; Lakshminarayana, B.; Subrahmanyam, C. Influence of hydrogen peroxide on the simultaneous removal of Cr(VI) and methylene blue from aqueous medium under atmospheric pressure plasma jet. J. Environ. Chem. Eng. 2015, 3, 2760–2767. [Google Scholar] [CrossRef]
  28. Rond, C.; Fagnon, N.; Vega, A.; Duten, X. Statistical analysis of a micro-pulsed electrical discharge in water. J. Phys. D Appl. Phys. 2020, 53, 335204. [Google Scholar] [CrossRef]
  29. Rond, C.; Desse, J.M.; Fagnon, N.; Aubert, X.; Er, M.; Vega, A.; Duten, X. Time-resolved diagnostics of a pin-to-pin pulsed discharge in water: Pre-breakdown and breakdown analysis. J. Phys. D Appl. Phys. 2018, 51, 335201. [Google Scholar] [CrossRef]
  30. Rond, C.; Desse, J.M.; Fagnon, N.; Aubert, X.; Vega, A.; Duten, X. Influence of applied voltage and electrical conductivity on underwater pin-to-pin pulsed discharge. J. Phys. D Appl. Phys. 2019, 52, 025202. [Google Scholar] [CrossRef]
  31. Dufour, B.; Fagnon, N.; Vega, A.; Duten, X.; Rond, C. Analysis of discharge regimes obtained by microsecond underwater electrical breakdown in regard to energy balance. J. Phys. D Appl. Phys. 2021, 54, 365202. [Google Scholar] [CrossRef]
  32. Nguyen, T.S.; Rond, C.; Vega, A.; Duten, X.; Forget, S. Investigation of Hydrogen Peroxide Formation After Underwater Plasma Discharge. Plasma Chem. Plasma Process. 2020, 40, 955–969. [Google Scholar] [CrossRef]
  33. Ceccato, P. Filamentary Plasma Discharge Inside Water: Initiation and Propagation of a Plasma in a Dense medium, PhD in Physique et Applications, Ecole Polytechnique. Ph.D. Thesis, LPP laboratory in Ecole Polytechnique Palaiseau, Paris, France, 2010. [Google Scholar]
  34. Georgescu, N. Gas Treatment with Repetitive Pulsed Corona Plasmas: Experiments with Various Geometries. IEEJ Trans. Fundam. Mater. 2004, 124, 921–926. [Google Scholar] [CrossRef] [Green Version]
  35. Creijghton, Y.L.M. Pulsed Positive Corona Discharges: Fundamental Study and Application to Flue Gas Treatment. Ph.D. Thesis, Technische Universiteit Eindhoven, Eindhoven, The Netherland, 1994. [Google Scholar] [CrossRef]
Figure 1. Experimental set-up (side view).
Plasma 05 00030 g001
Figure 2. Concentration of Cr(VI) as a function of time for eight experiments using the same conditions (U = 9 kV, Δt = 500 µs, f = 50 Hz, 2 mm gap, electrode length = 0 ± 10 µm, 47 mg/L, σ = 4 mS/cm, pH = 2.4). Uncertainty is equal to 1% (not shown).
Plasma 05 00030 g002
Figure 3. Time evolution of the injected energy per pulse for pin-to-pin discharges in Cr(VI) solution (47 mg/L, σ = 4 mS/cm, pH = 2.3), V = 100 mL, U = 9kV, ∆t = 500 μs, gap = 2 mm, electrode length = 0 ± 10 μm, f = 50 Hz.
Plasma 05 00030 g003
Figure 4. Optical diagnostics of pin-to-pin discharges in Cr(VI) solution (47 mg/L, σ = 4 mS/cm, pH = 2.4) Δt = 500 μs, gap = 2 mm, electrode length = 0 ± 10 μm. (a) Time-resolved shadowgraphy of case NOBK and case BK (U = 11 kV; exposure time = 0.37 μs); (b) Fast imaging for three successive BK experiments (U = 12.5 kV, exposure time = 100 ns).
Plasma 05 00030 g004
Figure 5. Concentration of Cr(VI) as a function of time for different electrode lengths (0, 100, 400 µm) and for two diameters: (a) Ø = 100 µm and (b) Ø = 200 µm obtained during for pin-to-pin discharges in Cr(VI) solution (47 mg/L, σ = 4 mS/cm, pH = 2.3), V = 100 mL, U = 9 kV, f = 50 Hz, ∆t = 500 µs, gap = 2 mm. η120 refers to the reduction efficiency after 120 min of PLI process.
Plasma 05 00030 g005
Figure 6. Reduction efficiency (dots) and Distribution of BK (columns) after 120 min according to the electrode surface in contact with liquid.
Plasma 05 00030 g006
Figure 7. Time evolution of Cr(VI) concentration according to the applied voltage for (a) 2 mm gap and (b) 5 mm gap obtained during pin-to-pin discharges in Cr(VI) solution (47 mg/L, σ = 4 mS/cm, pH = 2.3) V = 100 mL, ∆t = 500 μs, electrode length = 0 ± 10 μm, f = 50 Hz.
Plasma 05 00030 g007
Figure 8. Influence of the electric field on Cr(VI) reduction (reduction rate and energy yield after 2h of process) according to the normalized maximum electric field for pin-to-pin discharges in Cr(VI) solution (47 mg/L, σ = 4 mS/cm, pH = 2.3), V = 100 mL, ∆t = 500 μs, electrode length = 0 ± 10 μm, f = 50 Hz.
Plasma 05 00030 g008
Figure 9. Energy yield and breakdown distribution according to the pulse duration for pin-to-pin discharges in Cr(VI) solution (47 mg/L, σ = 4 mS/cm, pH = 2.3), U = 9kV, V = 100 mL, electrode length = 0 ± 10 μm, f = 50 Hz.
Plasma 05 00030 g009
Table 1. Influence of applied voltage on Cr(VI) reduction efficiency and the discharge characteristics. Cr(VI) solution (47 mg/L, σ = 4 mS/cm, pH = 2.3), V = 100 mL, ∆t = 500 μs, gap = 2 mm, electrode length = 0 ± 10 μm, f = 50 Hz.
Applied Voltage (kV)2 kV7 kV8 kV9 kV10 kV11 kV12 kV
Reduction rate (mg.L−1/min)00.210.280.400.480.530.67
Number of BK/NOBK (%)0/1001/9912/8815/8524/7625/7555/45
Average injected energy per pulse BK/NOBK (mJ)-/3.428/3636/4742/5451/7359/8366/95
Energy yield (g/kJ)02.0 × 10−42.1 × 10−42.5 × 10−42.2 × 10−42.3 × 10−42.8 × 10−4
Table 2. Influence of applied voltage on Cr(VI) reduction efficiency and the discharge characteristics. Cr(VI) solution (47 mg/L, σ = 4 mS/cm, pH = 2.3), V = 100 mL, ∆t = 500 μs, gap = 5 mm, electrode length = 0 ± 10 μm, f = 50 Hz.
Applied Voltage (kV)7 kV8 kV9 kV10 kV
Reduction rate (mg.L−1/min)0.200.230.350.39
Average energy per pulse (mJ)40465671
Energy yield (g/kJ)1.6 × 10−41.7 × 10−42 × 10−41.8 × 10−4
Table 3. Comparison of reduction efficiency and energy yield for Cr(VI) reduction by plasma liquid interaction processes. * These values have been calculated using Equation (2) and data of the references.
MethodReduction EfficiencyEnergy Yield (g/kJ)Ref
Above LiquidDC pin-to-plate100%0.64 × 10−4 *[18]
DC pin-to-plate100%1.4 × 10−4 *[7]
In LiquidDC pin-to-plate96%6 × 10−5 *[17]
DC pin-to-plate93%3.4 × 10⁻⁴[22]
DC pin-to-plate97%4.9 × 10−4 *[19]
Pulse pin-to-pin100%4.7 × 10⁻⁴This work
Table 4. Energy balance of the PLI process for Cr(VI) reduction by pin-to-pin discharges (47 mg/L, σ = 4 mS/cm, pH = 2.3), V = 100 mL, ∆t = 500 μs, electrode length = 0 ± 10 μm, gap = 2 mm, f = 50 Hz. The total reduction is obtained in 120 min for 8 and 9 kV and in 105 min for 10 kV.
Applied Voltage (kV)8 kV9 kV10 kV
Total injected Energy (kJ)16.718.821.3
Energy Yield (g/kJ)2.1 × 10−42.7 × 10−42.2 × 10⁻⁴
Total Consumed Energy (kJ)125146150
Global Energy Efficiency (g/kJ)2.7 × 10−53.2 × 10−53.1 × 10⁻⁵
Publisher’s Note: MDPI stays neutral with regard to jurisdictional claims in published maps and institutional affiliations.

