
Parametric Study of Proton Acceleration from Laser-Thin Foil Interaction

 ,
, 
Abstract
:1. Introduction
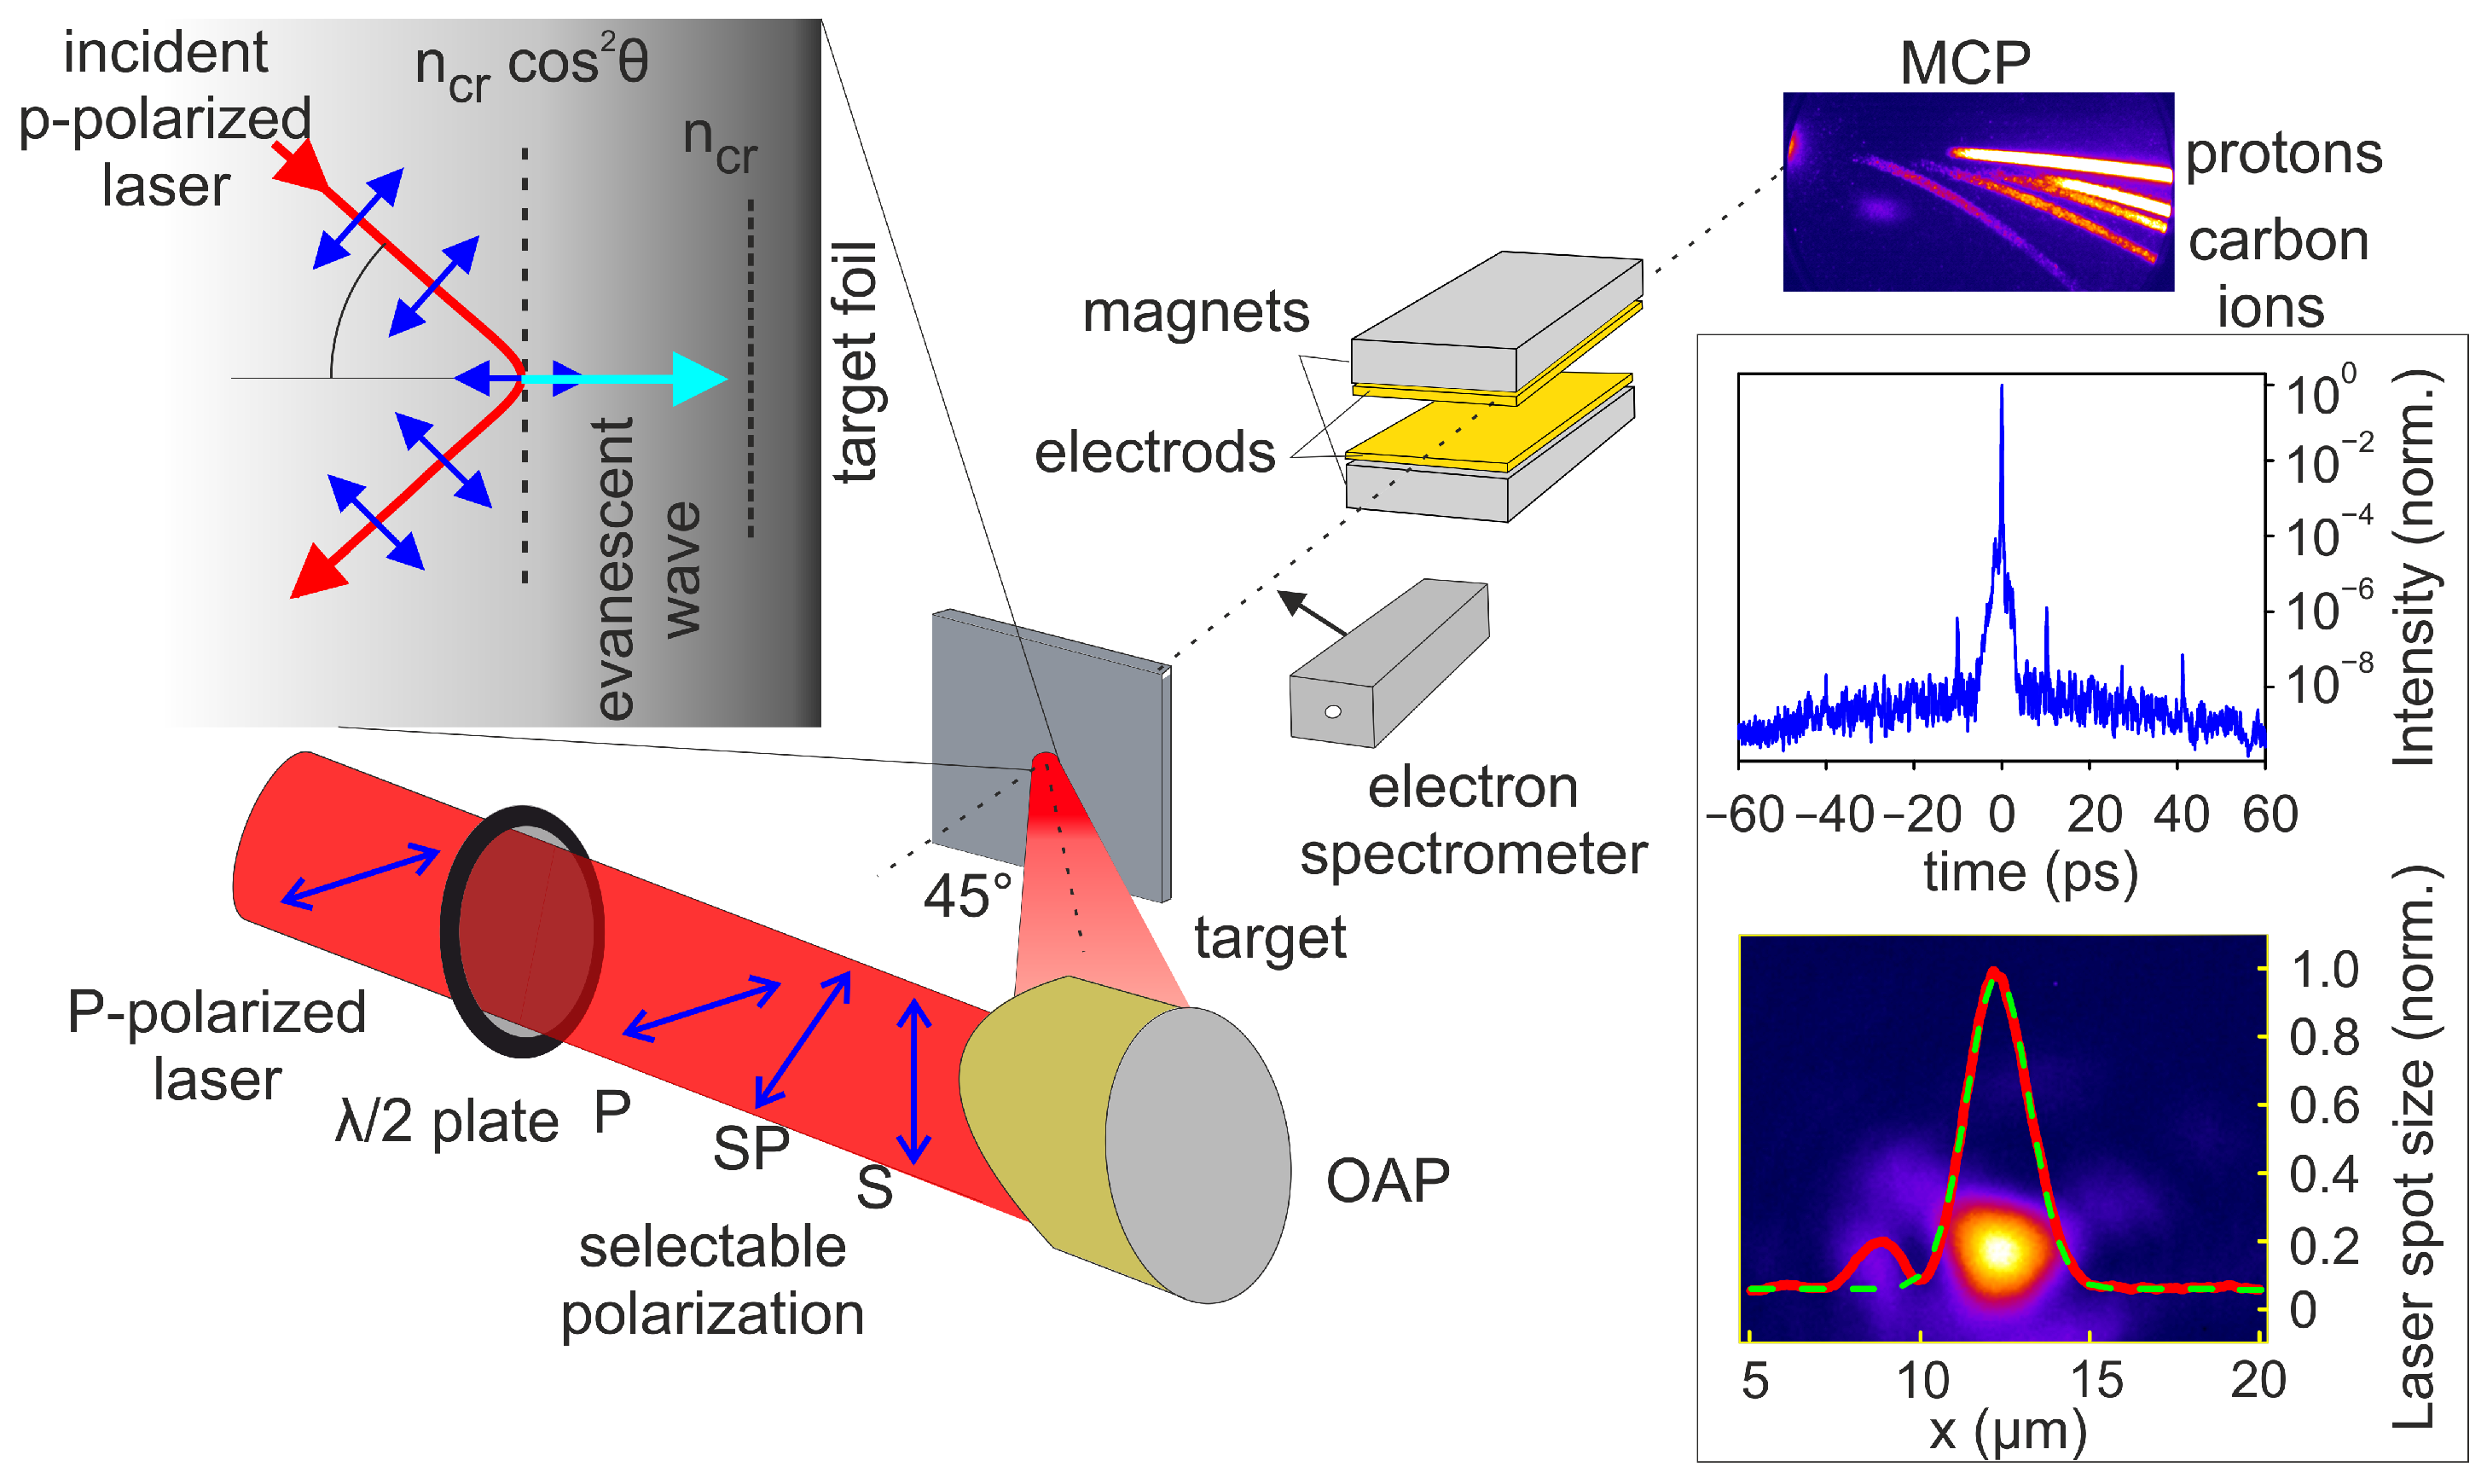
2. Experiment
3. Results and Discussion
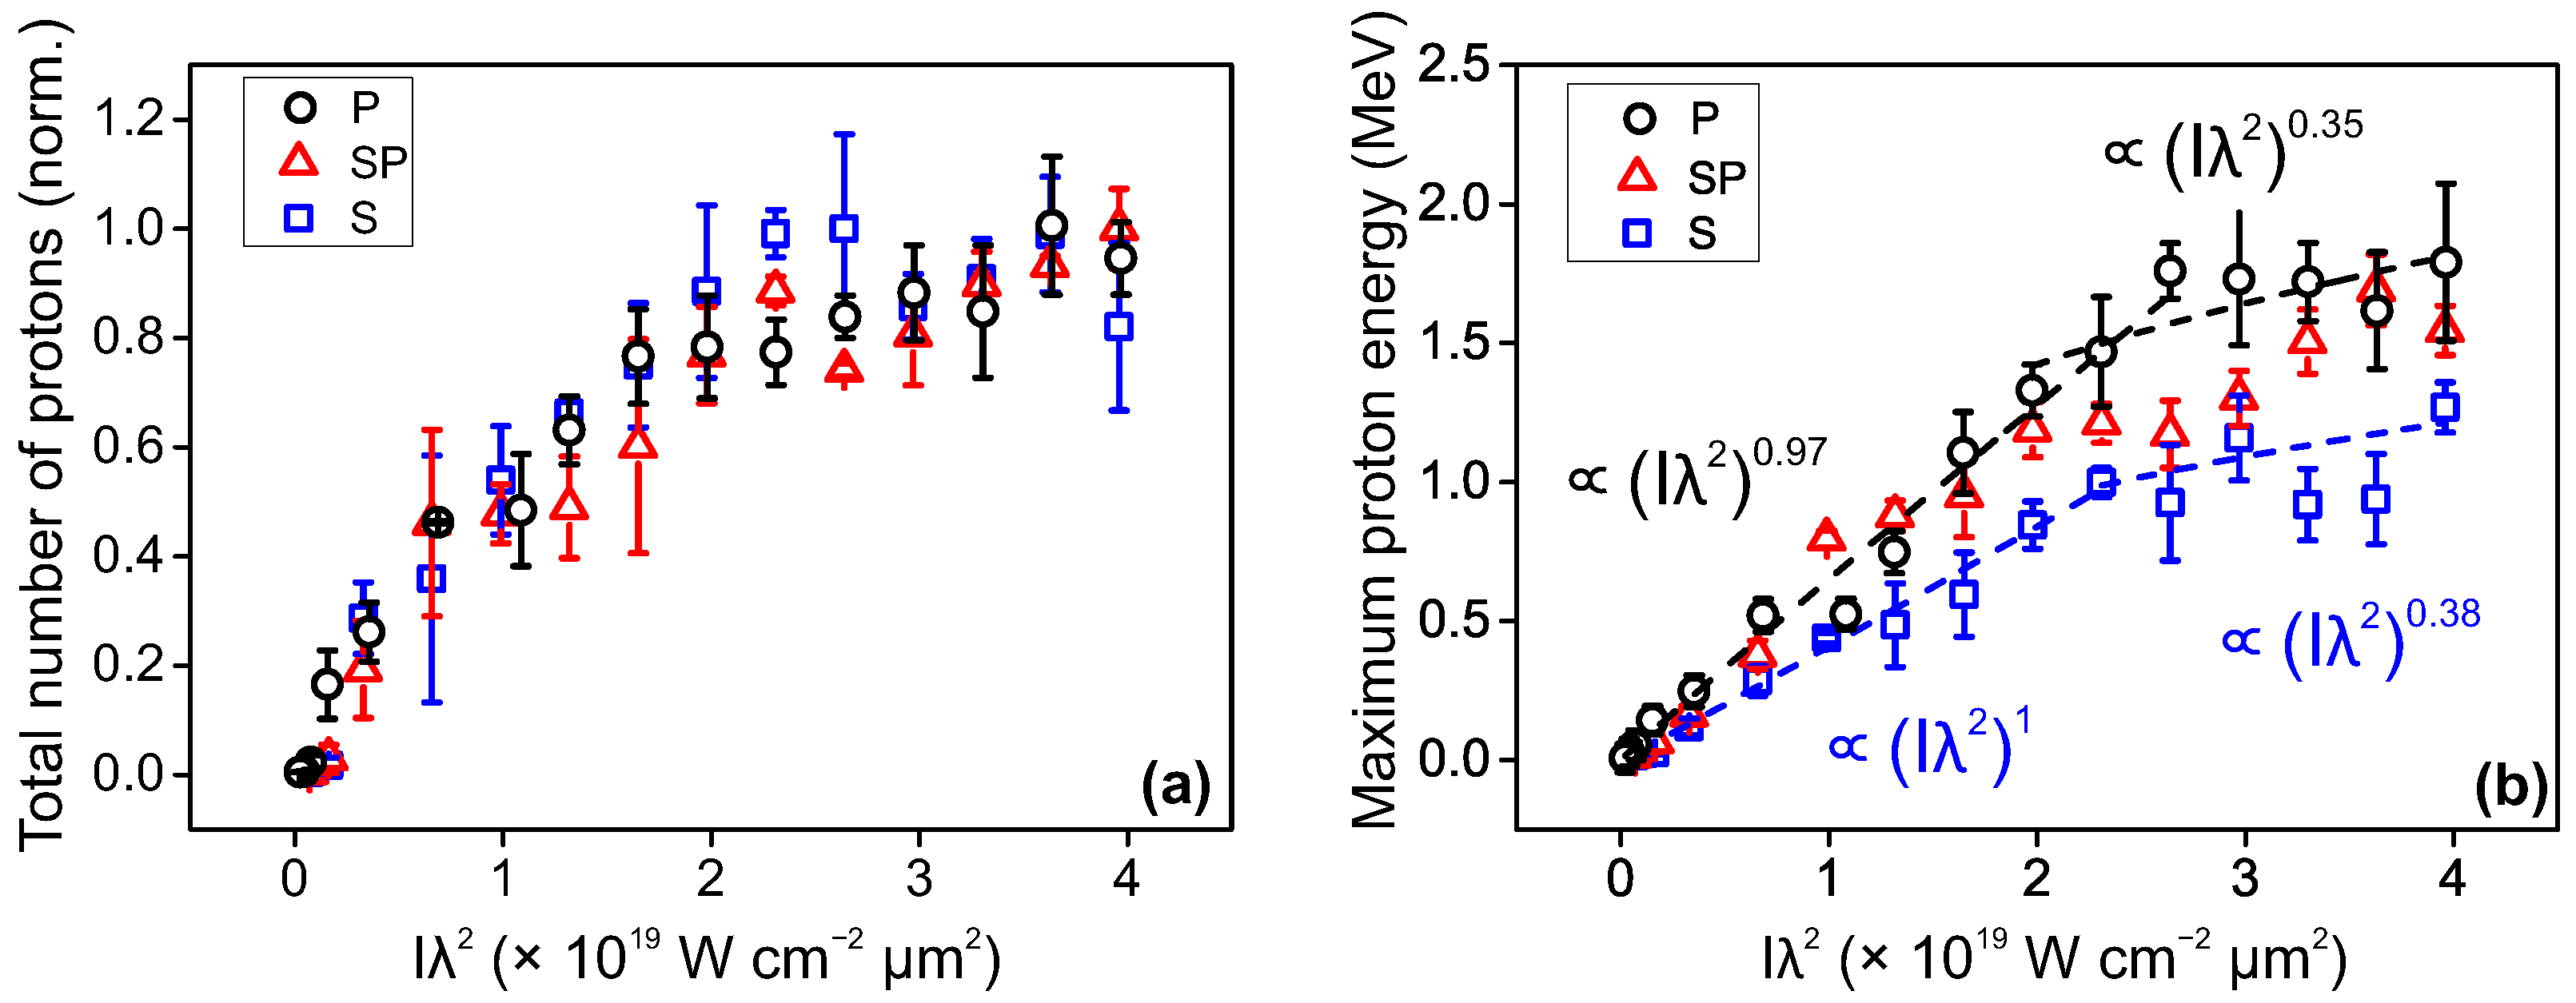
3.1. Intensity Scan
3.2. Laser Pulse Duration Scan
3.3. Laser Spot Size
4. Conclusions
Author Contributions
Funding
Institutional Review Board Statement
Informed Consent Statement
Data Availability Statement
Conflicts of Interest
Appendix A
Appendix A.1. Thomson Parabola Spectrometer
Appendix A.2. Proton Number Calibration

References
- Gitomer, S.J.; Jones, R.D.; Begay, F.; Ehler, A.W.; Kephart, J.F.; Kristal, R. Fast ions and hot electrons in the laser–plasma interaction. Phys. Fluids 1986, 29, 2679. [Google Scholar] [CrossRef]
- Wagner, F.; Bedacht, S.; Bagnoud, V.; Deppert, O.; Geschwind, S.; Jaeger, R.; Ortner, A.; Tebartz, A.; Zielbauer, B.; Hoffmann, D.H.H.; et al. Simultaneous observation of angularly separated laser-driven proton beams accelerated via two different mechanisms. Phys. Plasmas 2015, 22, 063110. [Google Scholar] [CrossRef]
- Cowan, T.E.; Fuchs, J.; Ruhl, H.; Kemp, A.; Audebert, P.; Roth, M.; Stephens, R.; Barton, I.; Blazevic, A.; Brambrink, E.; et al. Ultralow emittance, Multi-MeV proton beams from a laser virtual-cathode plasma accelerator. Phys. Rev. Lett. 2004, 92, 204801. [Google Scholar] [CrossRef]
- Macchi, A.; Borghesi, M.; Passoni, M. Ion acceleration by superintense laser-plasma interaction. Rev. Mod. Phys. 2013, 85, 751. [Google Scholar] [CrossRef] [Green Version]
- Roth, M.; Cowan, T.E.; Key, M.H.; Hatchett, S.P.; Brown, C.; Fountain, W.; Johnson, J.; Pennington, D.M.; Snavely, R.A.; Wilks, S.C.; et al. Fast Ignition by Intense Laser-Accelerated Proton Beams. Phys. Rev. Lett. 2001, 86, 436. [Google Scholar] [CrossRef] [PubMed]
- Belyaev, V.S.; Vinogradov, V.I.; Matafonov, A.P.; Rybakov, S.M.; Krainov, V.P.; Lisitsa, V.S.; Andrianov, V.P.; Ignatiev, G.N.; Bushuev, V.S.; Gromov, A.I.; et al. Excitation of promising nuclear fusion reactions in picosecond laser plasmas. Phys. At. Nucl. 2009, 72, 1077–1098. [Google Scholar] [CrossRef]
- Bulanov, S.S.; Brantov, A.; Bychenkov, V.; Chvykov, V.; Kalinchenko, G.; Matsuoka, T.; Rousseau, P.; Reed, S.; Yanovsky, V.; Krushelnick, K.; et al. Accelerating protons to therapeutic energies with ultraintense, ultraclean, and ultrashort laser pulses. Med. Phys. 2008, 35, 1770–1776. [Google Scholar] [CrossRef] [Green Version]
- Nemoto, K.; Maksimchuk, A.; Banerjee, S.; Flippo, K.; Mourou, G.; Umstadter, D.; Bychenkov, V. Laser-triggered ion acceleration and table top isotope production. Appl. Phys. Lett. 2001, 78, 595–597. [Google Scholar] [CrossRef] [Green Version]
- Belyaev, V.S.; Batishchev, P.A.; Bolshakov, V.V.; Elkin, K.S.; Karabadzhak, G.F.; Kovkov, D.V.; Matafonov, A.P.; Raykunov, G.G.; Yakhin, R.A.; Pikuz, S.A.; et al. Promising lines of investigations in the realms of laboratory astrophysics with the aid of powerful lasers. Phys. At. Nucl. 2013, 76, 404–422. [Google Scholar] [CrossRef]
- Remington, B.A.; Drake, R.P.; Takabe, H.; Arnett, D. A review of astrophysics experiments on intense lasers. Phys. Plasmas 2000, 7, 1641–1652. [Google Scholar] [CrossRef] [Green Version]
- Wilks, S.C.; Langdon, A.B.; Cowan, T.E.; Roth, M.; Singh, M.; Hatchett, S.; Key, M.H.; Pennington, D.; MacKinnon, A.; Snavely, R.A. Energetic proton generation in ultra-intense laser–solid interactions. Phys. Plasmas 2001, 8, 542–549. [Google Scholar] [CrossRef]
- Esirkepov, T.; Borghesi, M.; Bulanov, S.V.; Mourou, G.; Tajima, T. Highly Efficient Relativistic-Ion Generation in the Laser-Piston Regime. Phys. Rev. Lett. 2004, 92, 175003. [Google Scholar] [CrossRef] [Green Version]
- Higginson, A.; Gray, R.; King, M.; Dance, R.J.; Williamson, S.D.R.; Butler, N.M.H.; Wilson, R.; Capdessus, R.; Armstrong, C.D.; Green, J.S.; et al. Near-100 MeV protons via a laser-driven transparency-enhanced hybrid acceleration scheme. Nat. Commun. 2018, 9, 742. [Google Scholar] [CrossRef] [PubMed] [Green Version]
- Belyaev, V.S.; Krainov, V.P.; Lisitsa, V.S.; Matafonov, A.P. Generation of fast charged particles and superstrong magnetic fields in the interaction of ultrashort high-intensity laser pulses with solid targets. Phys.-Uspekh 2008, 51, 793–814. [Google Scholar] [CrossRef] [Green Version]
- Hiroyuki, D.; Nishiuchi, M.; Pirozhkov, A.S. Review of laser-driven ion sources and their applications. Rep. Prog. Phys. 2012, 75, 056401. [Google Scholar]
- Fews, A.P.; Norreys, P.A.; Beg, F.N.; Bell, A.R.; Dangor, A.E.; Danson, C.N.; Lee, P.; Rose, S. Plasma Ion Emission from High Intensity picosecond Laser Pulse Interactions with solid targets. Phys. Rev. Lett. 1994, 73, 1801–1804. [Google Scholar] [CrossRef] [PubMed]
- Pearlman, J.S.; Morse, R.L. Maximum expansion velocities of laser-produced plasmas. Phys. Rev. Lett. 1978, 40, 1652–1655. [Google Scholar] [CrossRef]
- Fuchs, J.; Antici, P.; D’Humières, E.; Lefebvre, E.; Borghesi, M.; Brambrink, E.; Cecchetti, C.A.; Kaluza, M.C.; Malka, V.; Manclossi, M.; et al. Laser-driven proton scaling laws and new paths towards energy increase. Nat. Phys. 2006, 2, 48–54. [Google Scholar] [CrossRef]
- Estabrook, K.; Kruer, W.L. Properties of resonantly heated electron distributions. Phys. Rev. Lett. 1978, 40, 42–45. [Google Scholar] [CrossRef]
- Brunel, F. Not-so-resonant, resonant absorption. Phys. Rev. Lett. 1987, 59, 52–55. [Google Scholar] [CrossRef]
- Wilks, S.C.; Kruer, W.L.; Tabak, M.; Langdon, A.B. Absorption of ultra-intense laser pulses. Phys. Rev. Lett. 1992, 69, 1383–1386. [Google Scholar] [CrossRef] [PubMed]
- Wilks, S.C.; Kruer, W.L. Absorption of ultrashort, ultra-intense laser light by solids and overdense plasmas. IEEE J. Quantum Electron. 1997, 33, 1954–1968. [Google Scholar] [CrossRef]
- Kruer, W.; Estabrook, K. J × B heating by very intense laser light. Phys. Fluids 1985, 28, 430–432. [Google Scholar] [CrossRef]
- Malka, G.; Miquel, J.L. Experimental confirmation of ponderomotive-force electrons produced by an ultrarelativistic laser pulse on a solid target. Phys. Rev. Lett. 1996, 77, 75–78. [Google Scholar] [CrossRef]
- Rosmej, O.N.; E Andreev, N.; Zaehter, S.; Zahn, N.; Christ, P.; Borm, B.; Radon, T.; Sokolov, A.; Pugachev, L.P.; Khaghani, D.; et al. Interaction of relativistically intense laser pulses with long-scale near critical plasmas for optimization of laser based sources of MeV electrons and Gamma-rays. N. J. Phys. 2019, 21, 043044. [Google Scholar] [CrossRef] [Green Version]
- Schnürer, M.; Kalashnikov, M.P.; Nickles, P.V.; Schlegel, T.; Sandner, W.; Demchenko, N.; Nolte, R.; Ambrosi, P. Hard X-ray emission from intense short pulse laser plasmas. Phys. Plasmas 1995, 2, 3106–3110. [Google Scholar] [CrossRef]
- Gopal, A.; Woldegeorgis, A.; Herzer, S.; Almassarani, M. Spatiotemporal visualization of the terahertz emission during high-power laser-matter interaction. Phys. Rev. E 2019, 100, 053203. [Google Scholar] [CrossRef]
- Cui, Y.Q.; Wang, W.; Sheng, Z.; Li, Y.; Zhang, J. Laser absorption and hot electron temperature scalings in laser–plasma interactions. Plasma Phys. Control. Fusion 2013, 55, 085008. [Google Scholar] [CrossRef]
- Sentoku, Y.; Bychenkov, V.; Flippo, K.; Maksimchuk, A.; Mima, K.; Mourou, G.A.; Sheng, Z.M.; Umstadter, D. High-energy ion generation in interaction of short laser pulse with high-density plasma. Appl. Phys. B 2002, 74, 207–215. [Google Scholar] [CrossRef]
- Verluise, F.; Laude, V. Huignard, J.; Tournois, P.; Migus, A. Arbitrary dispersion control of ultrashort optical pulses with acoustic waves. J. Opt. Soc. Am. B 2000, 17, 138–145. [Google Scholar] [CrossRef]
- Oksenhendler, T.; Coudreau, S.; Forget, N.; Crozatier, V.; Grabielle, S.; Herzog, R.; Gobert, O.; Kaplan, D. Self-referenced spectral interferometry. Appl. Phys. B 2010, 99, 7–12. [Google Scholar] [CrossRef]
- Boyd, R.W. Nonlinear Optics; Academic Press: Cambridge, MA, USA, 1992. [Google Scholar]
- Pirozhkov, A.S.; Mori, M.; Yogo, A.; Kiriyama, H.; Ogura, K.; Sagisaka, A.; Ma, J.-L.; Orimo, S.; Nishiuchi, M.; Sugiyama, H.; et al. Laser-driven proton acceleration and plasma diagnostics with J-KAREN laser. Proc. SPIE 2009, 7354, 223–232. [Google Scholar]
- Schreiber, J.; Bell, F.; Grüner, F.; Schramm, U.; Geissler, M.; Schnürer, M.; Ter-Avetisyan, S.; Hegelich, B.M.; Cobble, A.J.; Brambrink, E.; et al. Analytical model for ion acceleration by high-intensity laser pulses. Phys. Rev. Lett. 2006, 97, 045005. [Google Scholar] [CrossRef] [PubMed]
- Hatchett, S.P.; Brown, C.G.; Cowan, T.E.; Henry, E.A.; Johnson, J.S.; Key, M.H.; Koch, J.A.; Langdon, A.B.; Lasinski, B.F.; Lee, R.W.; et al. Electron, photon, and ion beams from the relativistic interaction of Petawatt laser pulses with solid targets. Phys. Plasmas 2000, 7, 2076–2082. [Google Scholar] [CrossRef] [Green Version]
- Yasuike, K.; Key, M.H.; Hatchett, S.P.; Snavely, R.A.; Wharton, K.B. Hot electron diagnostic in a solid laser target by K-shell lines measurement from ultraintense laser–plasma interactions (3 × 10²⁰ W/cm2, 400 J). Rev. Sci. Instrum. 2001, 72, 1236–1240. [Google Scholar] [CrossRef]
- Mora, P. Plasma expansion into a vacuum. Phys. Rev. Lett. 2003, 90, 185002. [Google Scholar] [CrossRef] [Green Version]
- Sheng, Z.-M.; Weng, S.; Yu, L.-L.; Wang, W.-M.; Cui, Y.-Q.; Chen, M.; Zhang, J. Absorption of ultrashort intense lasers in laser–solid interactions. Chin. Phys. B 2015, 24, 015201. [Google Scholar] [CrossRef]
- Roth, M.; Schollmeier, M. Ion Acceleration target normal sheath acceleration. CERN Yellow Rep. 2016, 1, 231. [Google Scholar]
- Augst, S.; Strickl, D.; Meyerhofer, D.D.; Chin, S.L.; Eberly, J.H. Tunneling ionization of noble gases in a high-intensity laser field. Phys. Rev. Lett. 1989, 63, 2212–2215. [Google Scholar] [CrossRef]
- Bethe, H.A. Zur Theorie des Durchgangs schneller Korpuskularstrahlen durch Materie. Ann. Phys. 1930, 397, 325–400. [Google Scholar] [CrossRef]


Publisher’s Note: MDPI stays neutral with regard to jurisdictional claims in published maps and institutional affiliations. |
© 2021 by the authors. Licensee MDPI, Basel, Switzerland. This article is an open access article distributed under the terms and conditions of the Creative Commons Attribution (CC BY) license (https://creativecommons.org/licenses/by/4.0/).
Share and Cite
Almassarani, M.; Meng, S.; Beleites, B.; Ronneberger, F.; Paulus, G.G.; Gopal, A. Parametric Study of Proton Acceleration from Laser-Thin Foil Interaction. Plasma 2021, 4, 670-680. https://doi.org/10.3390/plasma4040034
Almassarani M, Meng S, Beleites B, Ronneberger F, Paulus GG, Gopal A. Parametric Study of Proton Acceleration from Laser-Thin Foil Interaction. Plasma. 2021; 4(4):670-680. https://doi.org/10.3390/plasma4040034
Chicago/Turabian StyleAlmassarani, Mohammed, Sixu Meng, Burgard Beleites, Falk Ronneberger, Gerhard G. Paulus, and Amrutha Gopal. 2021. "Parametric Study of Proton Acceleration from Laser-Thin Foil Interaction" Plasma 4, no. 4: 670-680. https://doi.org/10.3390/plasma4040034
APA StyleAlmassarani, M., Meng, S., Beleites, B., Ronneberger, F., Paulus, G. G., & Gopal, A. (2021). Parametric Study of Proton Acceleration from Laser-Thin Foil Interaction. Plasma, 4(4), 670-680. https://doi.org/10.3390/plasma4040034