Article

Aerosol Charging with a Piezoelectric Plasma Generator

1
Institute of Electrical Measurement and Sensor Systems, Graz University of Technology, 8010 Graz, Austria
2
TDK Electronics GmbH & Co. OG, 8530 Deutschlandsberg, Austria
*
Author to whom correspondence should be addressed.
Plasma 2021, 4(3), 377-388; https://doi.org/10.3390/plasma4030027
Submission received: 14 May 2021 / Revised: 9 July 2021 / Accepted: 14 July 2021 / Published: 16 July 2021
(This article belongs to the Special Issue Piezoelectric Direct Discharge)

Abstract

:
A novel piezoelectric plasma generator developed by TDK Electronics GmbH & Co. OG, the CeraPlas®, was investigated for its feasibility as a charger for aerosol particles. The CeraPlas® charger was directly compared to a commercially available bipolar X-ray charger regarding its efficiency of charging atomized NaCl particles in a size range from 30 nm to 100 nm. First results show the ability of the CeraPlas® to perform bipolar aerosol charging with high reproducibility, and measurements of the charge distribution in the N i t product yielded about 1012 m−3 s for our experimental charging configuration. Unwanted generation of ozone was suppressed by a dedicated charging chamber and operation in N2 atmosphere.

1. Introduction

Aerosols have existed for all of human history. Besides the popular example of air pollution, aerosols have always existed in nature to a greater degree than than most people are aware. They are part of our everyday life, from cloud formation to the spread of pandemics by airborne infections, to smoke and dust. The characterization of aerosol particles and their properties is therefore of great importance. One major property of particles that must be determined is their size. This can give rise to its own challenges, especially when it comes to non-spherical particles in the nanometer range. Various equivalent diameters have been introduced to classify aerosol particles, each referring to the behavior that a sphere at a certain diameter would have in regard to a specific physical property. An especially common one is the electrical mobility diameter, which assigns electrical mobility of a sphere to the considered particle. It is utilized in the differential mobility analyzer (DMA), where aerosol particles are classified by balancing the electrical force and the aerodynamic drag force [1]. For a reliable operation of the DMA, a defined and reproducible electrical charge distribution of particles is crucial. Therefore, bipolar aerosol chargers are used upstream of the DMA. Common commercially available devices are include 85Kr (TSI 3077) and X-ray (TSI 3088) chargers. These chargers are well characterized and impart a known size-dependent equilibrium charge distribution on the particles, which can be approximated by analytical formulas [1,2]. Furthermore, the charging behavior of neutralizers is standardized in ISO 15900 [3].
The aforementioned neutralizers use ionizing radiation to generate bipolar ions and therefore have certain disadvantages in the areas of radiation safety, aging and mobile applications. Furthermore, the asset costs are in the range of a few thousand euros. Alternatively, bipolar ions can be produced within a non-thermal plasma, typically generated by a dielectric barrier discharge (DBD) or a piezoelectric direct discharge (PDD). A novel and cost-efficient piezoelectric plasma generator, the CeraPlas®, was developed by TDK Electronics GmbH & Co. OG. This technology provides a platform consisting of the CeraPlas® piezo ceramic component and a driving circuit, which allows to specific applications to be created for using cold atmospheric plasma. The device efficiently ionizes the gas at atmospheric pressure and temperatures, which allows for safe operating conditions. The dimensions and the low power consumption of the device enable its usage for mobile applications. Because of these favorable properties, the device has the potential to be used as a source for aerosol charging and is feasible for low-cost, high-volume applications, as described, e.g., by Nishida et. al. [4] and Schriefl et. al. [5].

Aim of This Work

In this study, we examine the aerosol charging properties of the CeraPlas® in an experimental setup, show its feasibility as an aerosol neutralizer, and provide initial data about the produced particle size depending charge distribution, ion density, and estimation of the N i t product.

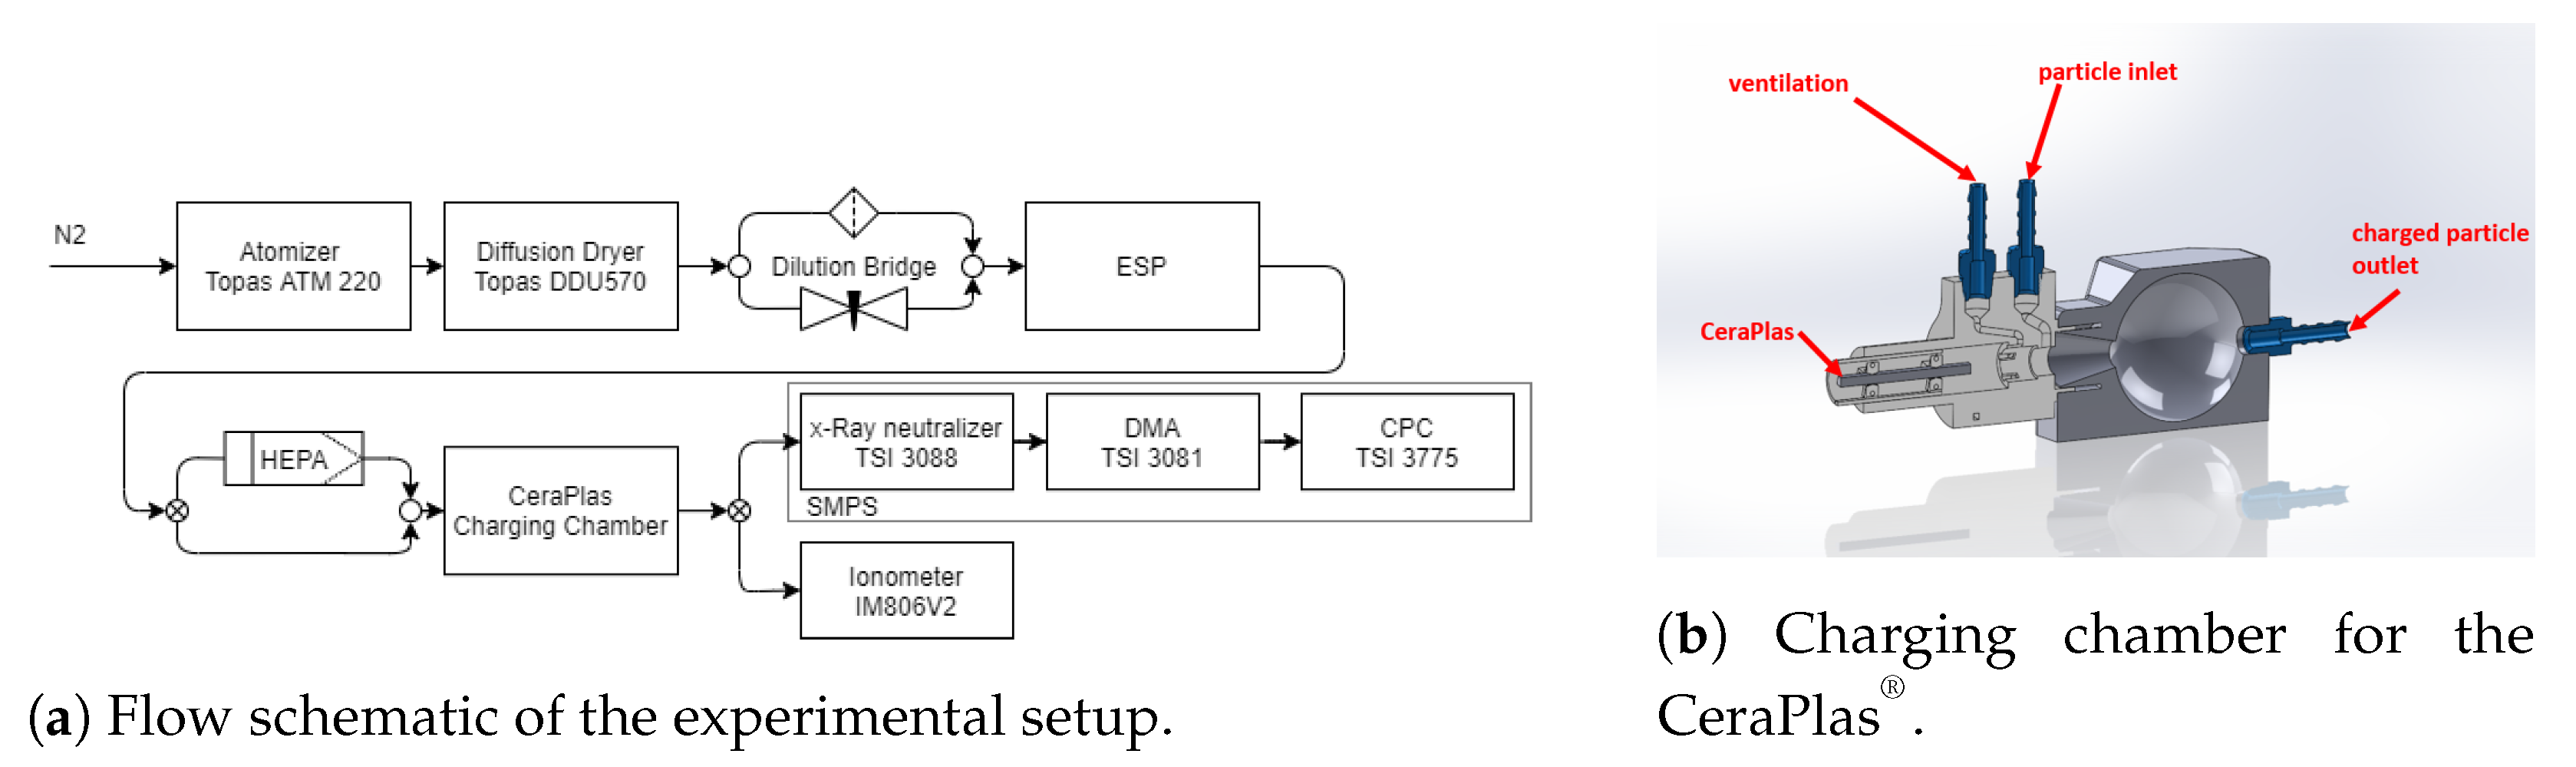
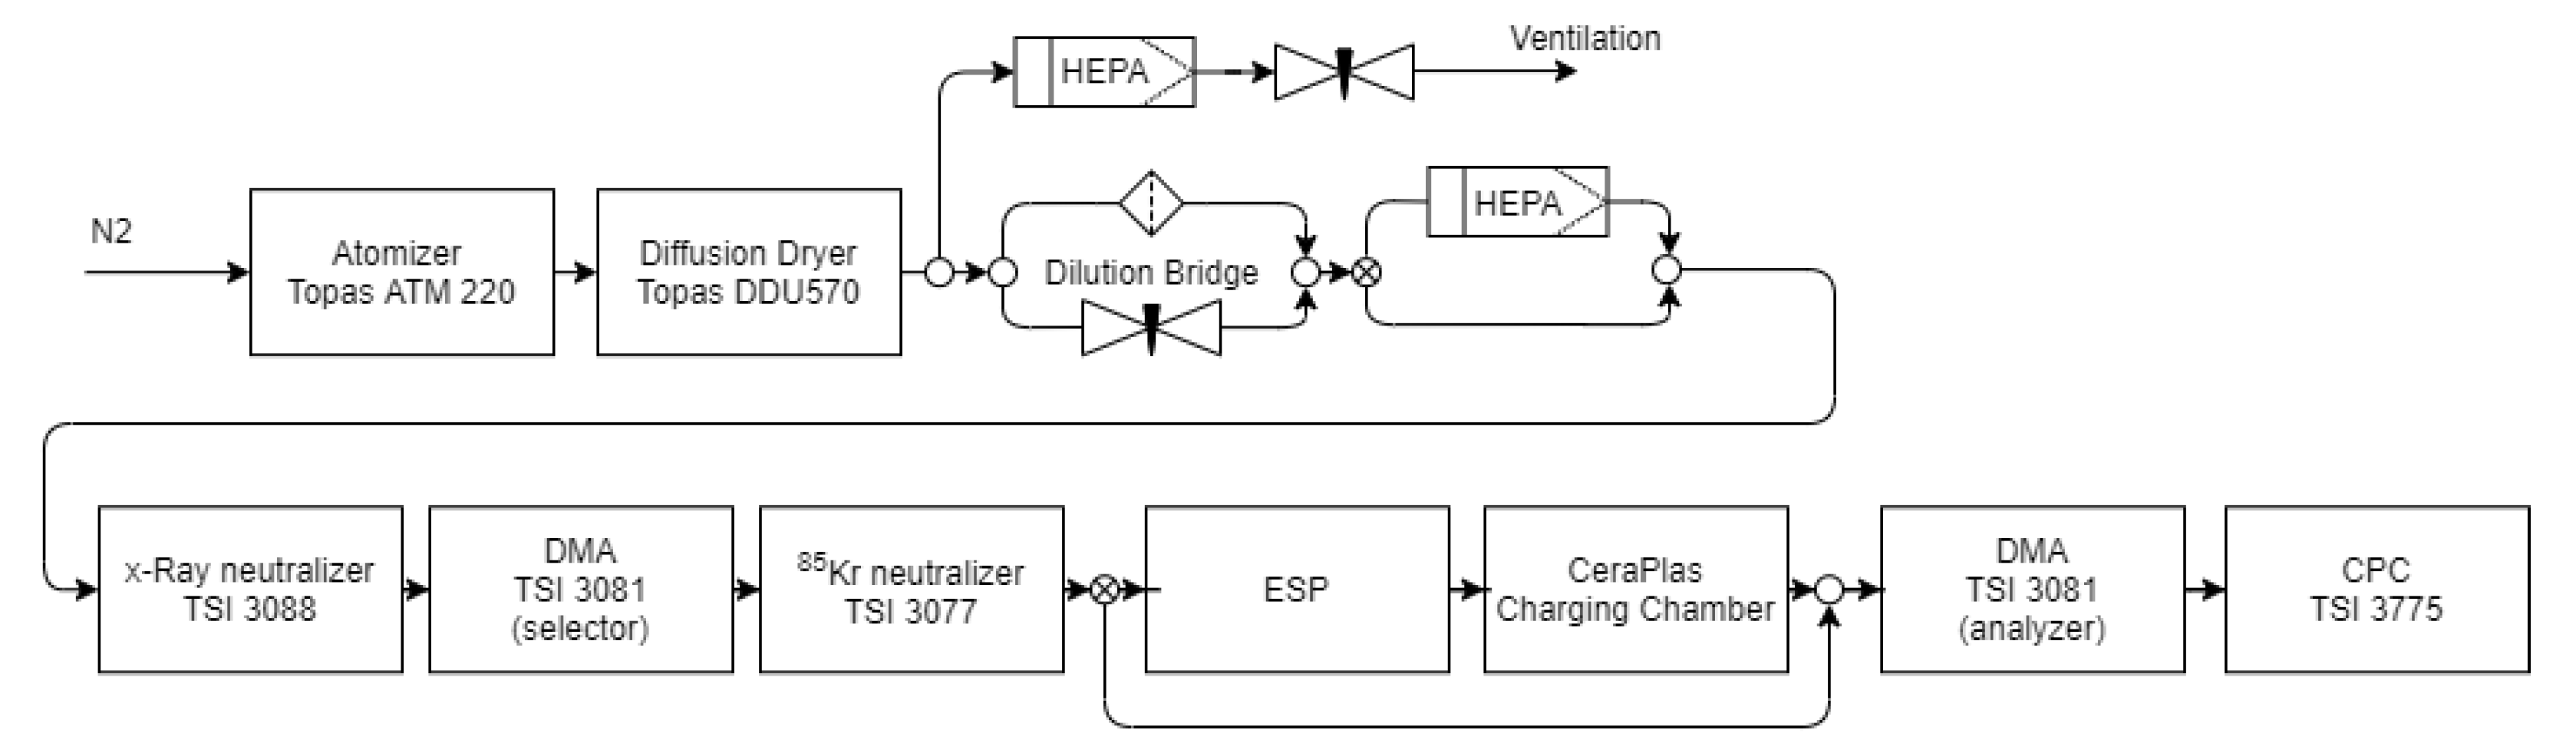
2. Materials and Methods

2.1. Diffusion Charging by Plasma Discharge

Diffusion charging describes the process of aerosol charging. Particles are exposed to an ion-rich atmosphere and ions attach to the particles by diffusion. The charging process can be unipolar or bipolar, depending on the present ion polarities. The resulting charge distribution depends on the shape and diameter of the particles [1]. In unipolar diffusion charging, the particles are exposed to ions of one polarity. In the case of bipolar diffusion charging, positive and negative ions are present, resulting in a bipolar charge distribution with a near-zero net charge [6]. The charging process is used to condition the aerosol for interaction with an instrument, such as an aerosol electrometer for particle number (PN) [5] measurement or a DMA for size selection. Diffusion-charging-based PN sensors are established devices and can be realized in different configurations [5,7,8].
The rate of ion attachment to particles is mainly determined by Brownian ion diffusion, the forces in the electric field of the ion and particle charges, if no external field is present [1]. The attachment of ion to particle can be calculated by a model developed by Fuchs [9], which is valid for ultrafine spherical particles in the transition regime [10]. For arbitrarily shaped particles, more advanced theories are available [11,12].
Based on the approach of Pui et. al. [10] and the birth-and-death approach of Boisdron and Brock [13], the charge distribution and the average charge per particle as a function of particle size d ( q ) can be calculated. For this model, the product of ion concentration and residence time of particles within the charging zone ( N i t product) is the most crucial input parameter, since deviations of the N i t product cause significant deviations in the mean charge of the aerosol.
For unipolar diffusion charging, the N i t product can be used to calculate the charge distribution for initially uncharged particles [14]. For bipolar diffusion charging, the N i t is a crucial parameter to indicate if a steady-state charge distribution can be achieved, which is crucial for aerosol neutralizers [15]. A value of 6 × 10¹² m−3 s is considered to be sufficient to achieve steady-state charging independent of pre-existing charge states [15]. Although it has been shown that this N i t product reaches its limits at high particle concentrations and small sizes [16], it indicates the basic ability of bipolar chargers to serve as neutralizers. To avoid depletion of ions, the ion concentration has to be much greater than the particle concentration in any case [1].
Ions can be generated in different ways: of most importance for aerosol measurement are ionizing radiation [13], corona discharge [5], UV radiation (photoelectric effect) [17], and non-thermal plasma discharge [18,19], which is the method this paper focuses on. A plasma is referred to as non-thermal if the atoms are at ambient temperature while the electron temperature is in the range of a plasma discharge (a few thousand degrees Kelvin). This condition can be established by transferring the required energy to the electrons by an external electric field. The collisions between electrons with neutral gas molecules do not suffice for a significant gas temperature increase [18]. Appropriate electric fields, which avoid spark discharges, can be provided, e.g., by a dielectric barrier in the discharge gap between the electrodes of a corona charger (DBD) [20] or by a piezoelectric transducer like the CeraPlas® (PDD), which is described in Section 2.2. DBD chargers provide a wide range of applications because of the adjustability of several parameters (e.g., frequency, voltage, flow rates, geometry). A plasma discharge in air usually produces considerable amounts of corrosive ozone (O3). By operating the plasma in N2 atmosphere, ozone generation from O2 can be suppressed [15].

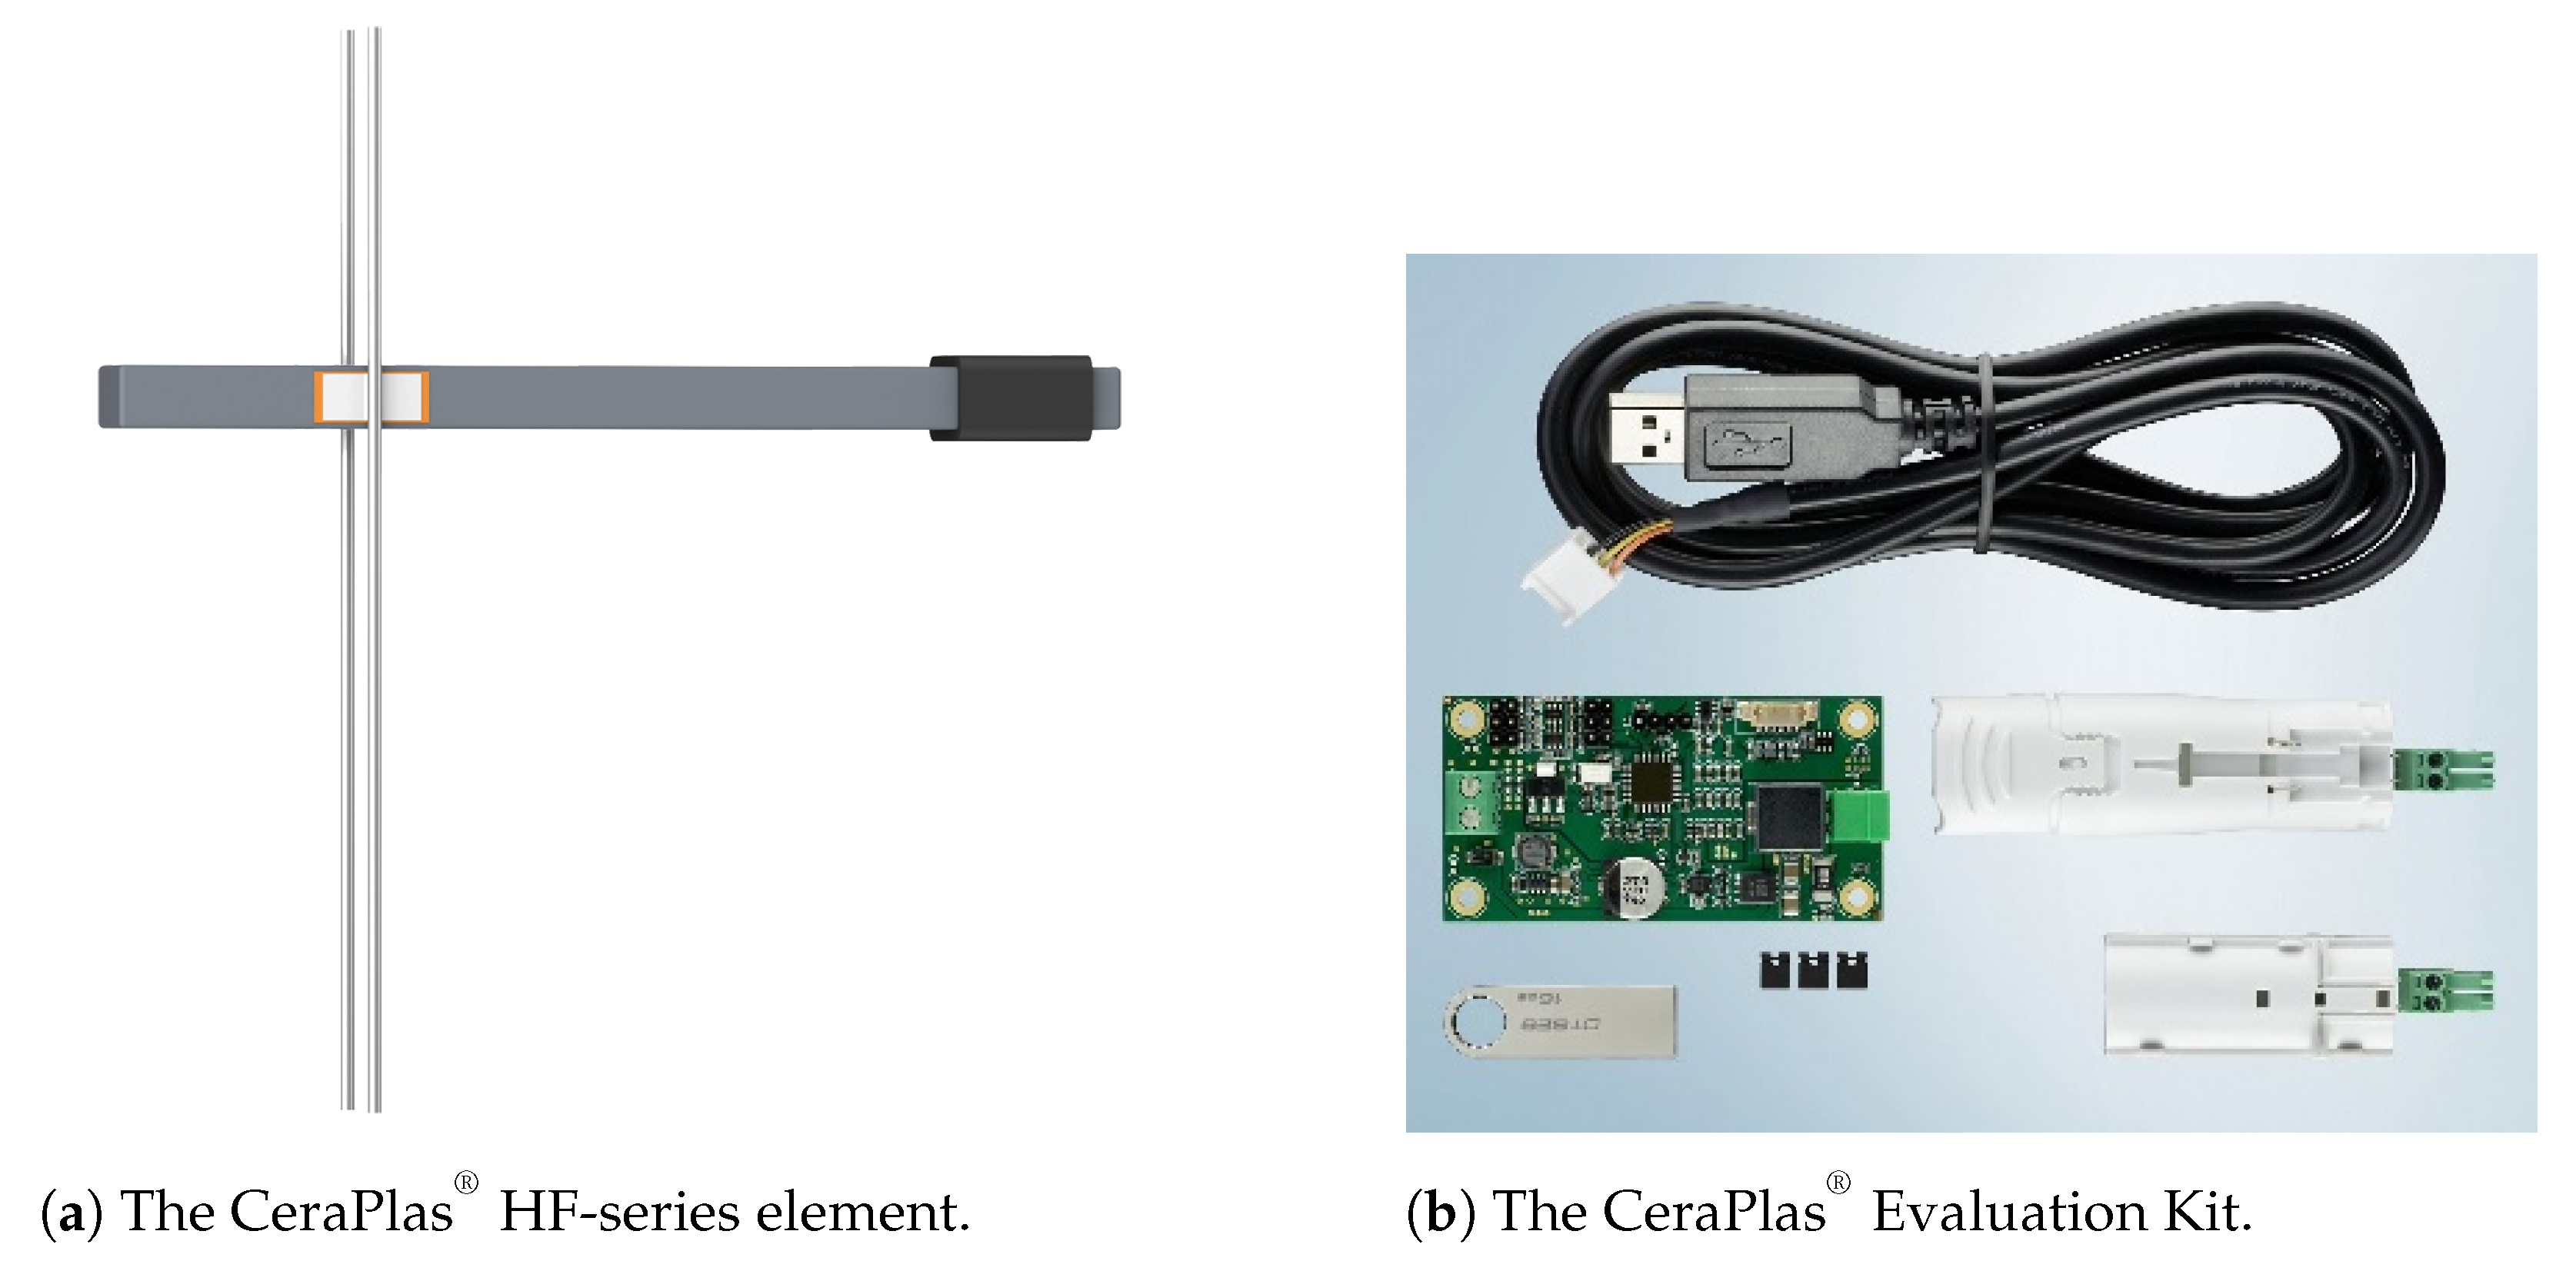
2.2. Description of the Plasma Source

The CeraPlas® element is a multilayered piezoelectric component with co-fired hard lead zirconate titanate (PZT) ceramics and copper inner electrodes. The ionization of the surrounding media (air or other gases) and the ignition of the plasma streamers requires a high voltage on the output side of the CeraPlas®. This high voltage is obtained by operating the CeraPlas® in resonance mode. Therefore, TDK offers an Evaluation Kit [21] including a driver and an electronic board, which was used in this study to ensure continuous resonance operation. The HF series of the CeraPlas® element [22], shown in Figure 1a, has dimensions of L × W × H = 45.2 mm × 6 mm × 2.8 mm and an operating resonance frequency of 83 kHz.
Cold atmospheric plasma sources are capable of generating high ion concentrations. The provided CeraPlas® technology ensures a safe and affordable study design with PDD [23,24,25]. Due to their size, piezoelectric cold plasma generators (PCPG) are ideal for mobile application.
The principle of a PCPG is based on a piezoelectric transformer, the so called Rosen-type design [26]. A low electric input voltage (12 V AC) can be transformed to a high electric output voltage (several kV). This is similar to a magnetic transformer but based on the electromechanical coupling effect of the piezoelectric material. The operating frequency is designed to the second harmonic vibration mode of the component, which has the advantage of two nodal points along the length of the PCPG. Wire contacts are possible at ¼ of the length and allow it to be driven as a highly efficient electrical component.

2.3. Feasibility Study Bipolar Charging

In order to test the particle charging capability of the CeraPlas®, the device was used as a neutralizer for particle size distribution measurements in a known setup, replacing the original X-ray charger (TSI 3088). The CeraPlas® was mounted in a specially designed package, where it was binned only at the nodal points on one side. The package was placed within a 3D-printed charging chamber shown in Figure 2b. Bipolar diffusion charging was achieved by mixing the emitted ions with aerosol particles. The charging chamber was designed to suppress possible particle contamination, which seemed to be caused by the CeraPlas® (It was found that the CeraPlas® initially emits particles for a few minutes if it was inactive for longer periods (e.g., several hours or days). This is unwanted for the target application and the reason for the above described design of the charging chamber. The charging chamber suppresses possible particle contamination.) The gas path upstream of the the charging chamber was operated under slight overpressure, while the emitted particles were actively sucked off via the ventilation.
The test setup shown in Figure 2a was used in order to investigate the basic feasibility of the CeraPlas® for bipolar particle charging. NaCl particles, generated with a Topas ATM 220 atomizer and a silica gel diffusion dryer, were used as test aerosol. A Cambustion electrostatic precipitator (ESP) was placed downstream of the dilution bridge to optionally remove pre-charged particles before the particles were led into the CeraPlas® charging chamber. Subsequently, the number-weighted particle mobility diameter distribution was measured using an X-ray charger (TSI 3088), a DMA (TSI 3081), and a CPC (TSI 3775) forming an SMPS (Scanning Mobility Particle Sizer). The CPC was operated at a sample flow rate of 0.3 L min−1 and the DMA with a sheath flow of 4 L min−1. To ensure stable and repeatable particle distribution measurements, the CeraPlas® was turned on for 60 s before conducting an lasting SMPS scan 120 s. To check for particle contamination in the system, a HEPA filter was inserted upstream of the charging chamber.
The experimental setup described above and shown in Figure 2a allowed the charging characteristics of the CeraPlas® charging chamber to be tested. As reference a commercial X-ray aerosol charger (TSI 3088) was used.
Unwanted O3 generation was suppressed by operating the CeraPlas® in N2 atmosphere, as suggested by Mathon et. al. [15].

2.4. Charge Distribution Measurements

The bipolar charging performance was evaluated by charge distribution measurements based on a tandem DMA setup, shown in Figure 3. NaCl particles were generated by a Topas ATM 220 atomizer and a silica gel diffusion dryer and passed through a dilution bridge to adjust the aerosol concentration. Downstream of the dilution bridge, the test aerosol was led through an X-ray charger (TSI 3088) and classified by a DMA (TSI 3081 - selector DMA). The transmitted monodisperse particle fraction was subsequently neutralized by a 85Kr source (TSI 3077) and further led through an ESP to remove the charged particle fraction. The remaining uncharged particles were then passed through the charging chamber with the CeraPlas®. Finally, the positive and negative mobility spectrum of the particles was measured by another DMA (TSI 3081 - analyzer DMA) and a CPC (TSI 3775). The mobility spectrum of positive particles was obtained by ramping the DMA voltage from 0 kV to 10 kV. In order to obtain the negative mobility spectrum, the analyzer DMA was operated with a positive voltage using a custom-built HV generator. To check for particle contamination from the charging device or elsewhere in the setup, a HEPA filter was inserted after the dilution bridge. The ESP – in this case, a custom-made ESP with a voltage of 3 kV—and the CeraPlas® charging chamber were bypassed for the characterization of the 85Kr neutralizer.
The bipolar charge distribution curves for monodisperse particles were derived following a method described in the Appendix A, based on the obtained mobility spectra.

2.5. Ion Density Measurement

In order to estimate the N i t product, the ion density downstream the CeraPlas® charging chamber was measured with an Ionometer IM806V2. In the setup shown in Figure 2a, the SMPS was replaced by the Ionometer.

3. Results

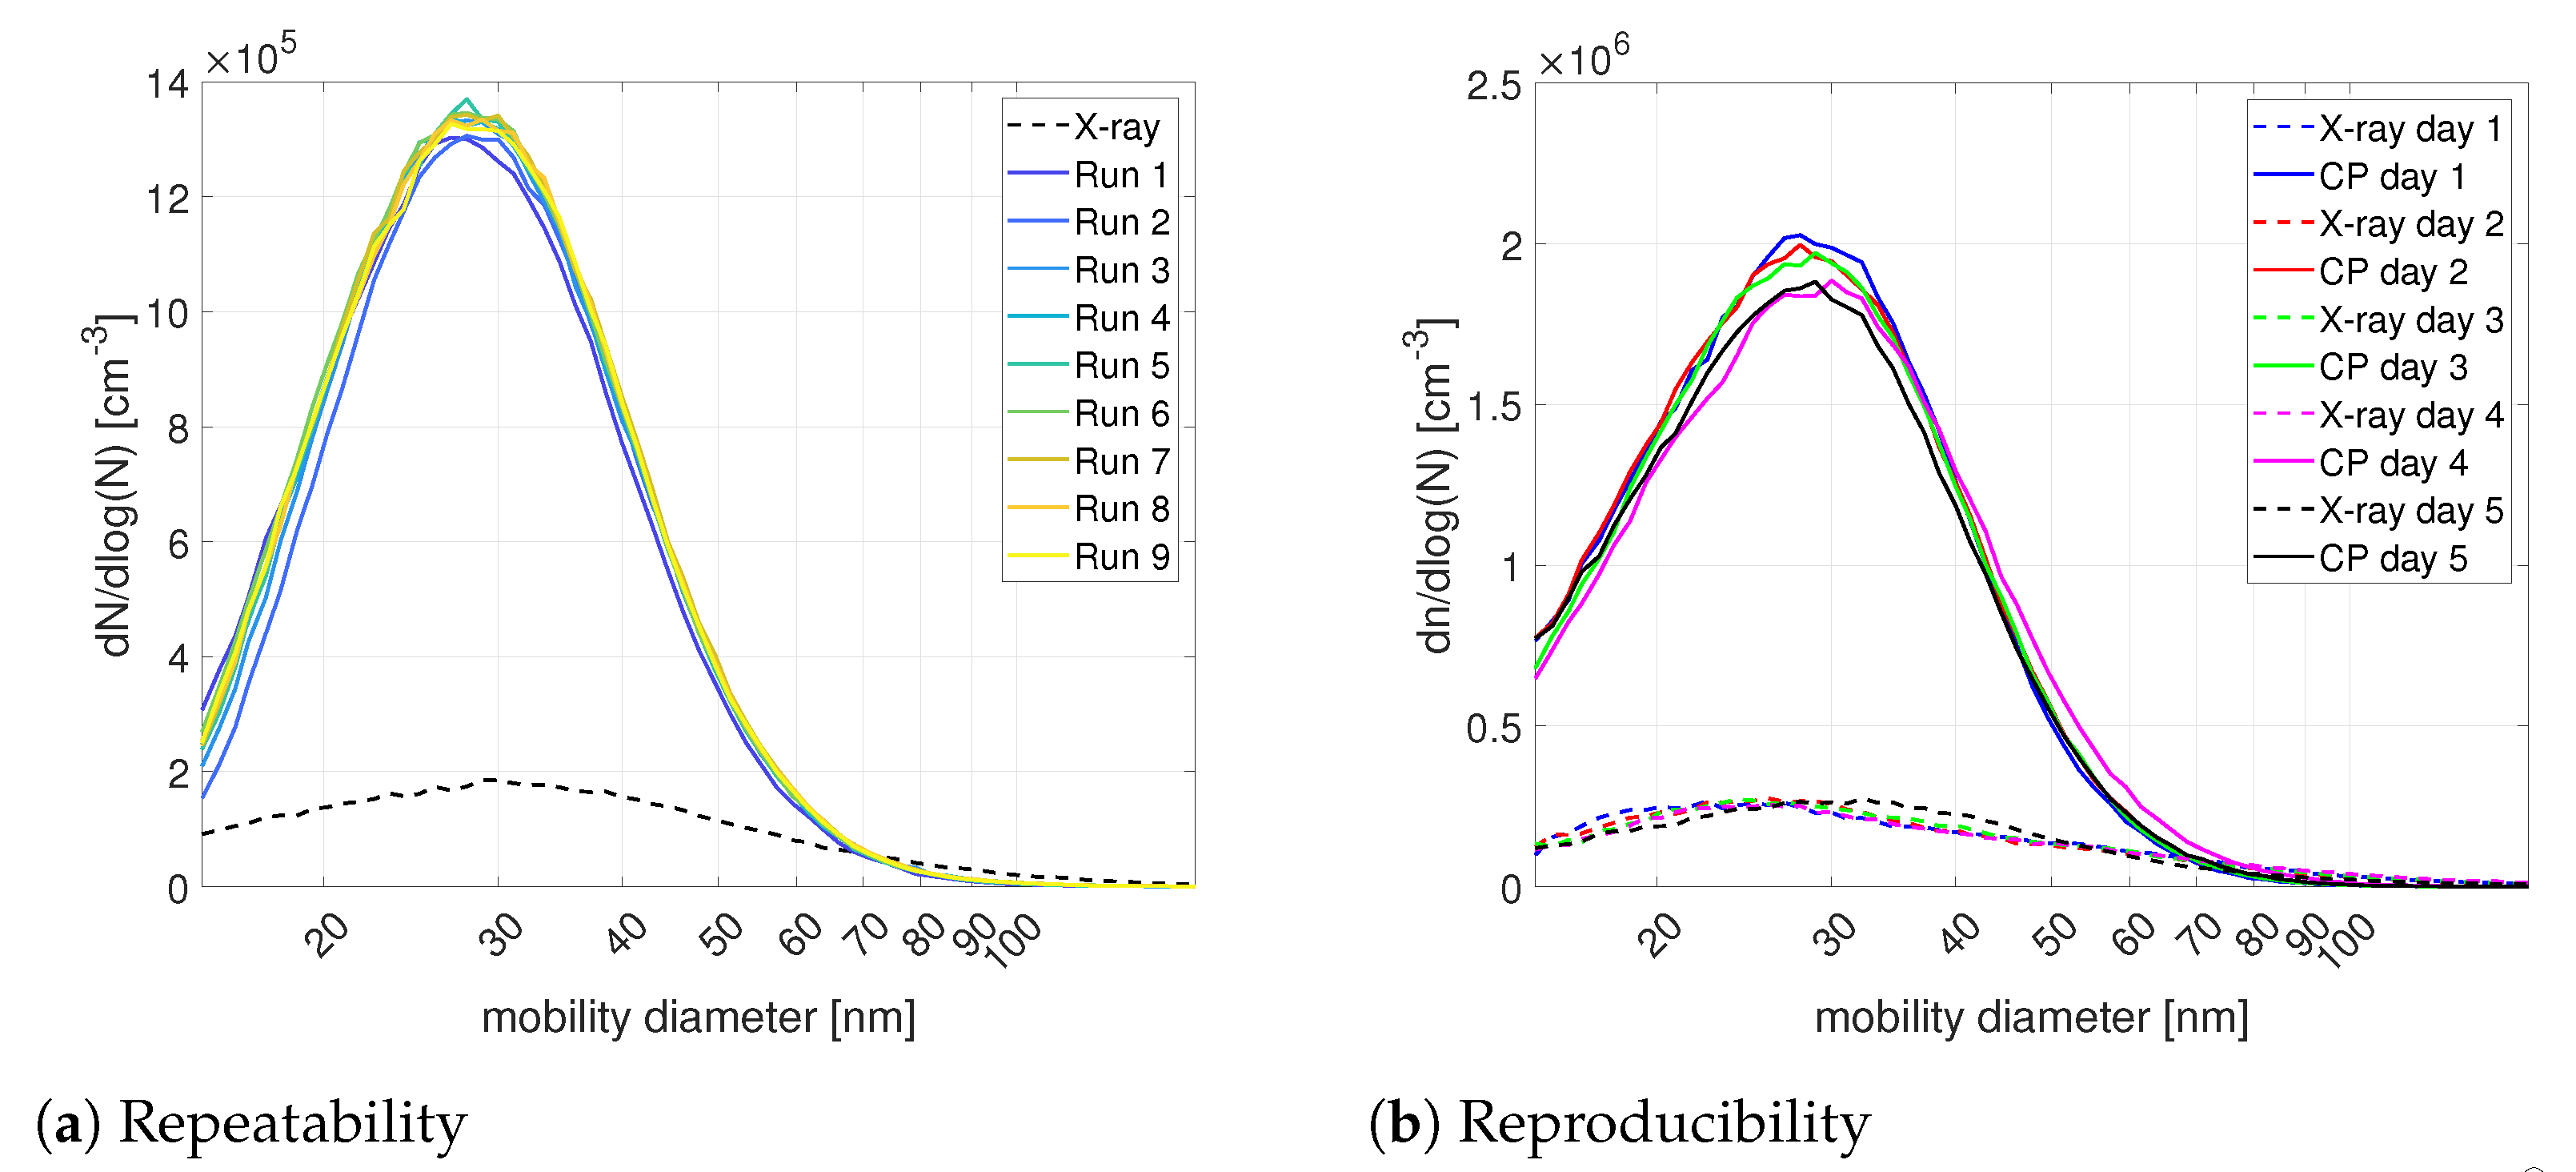
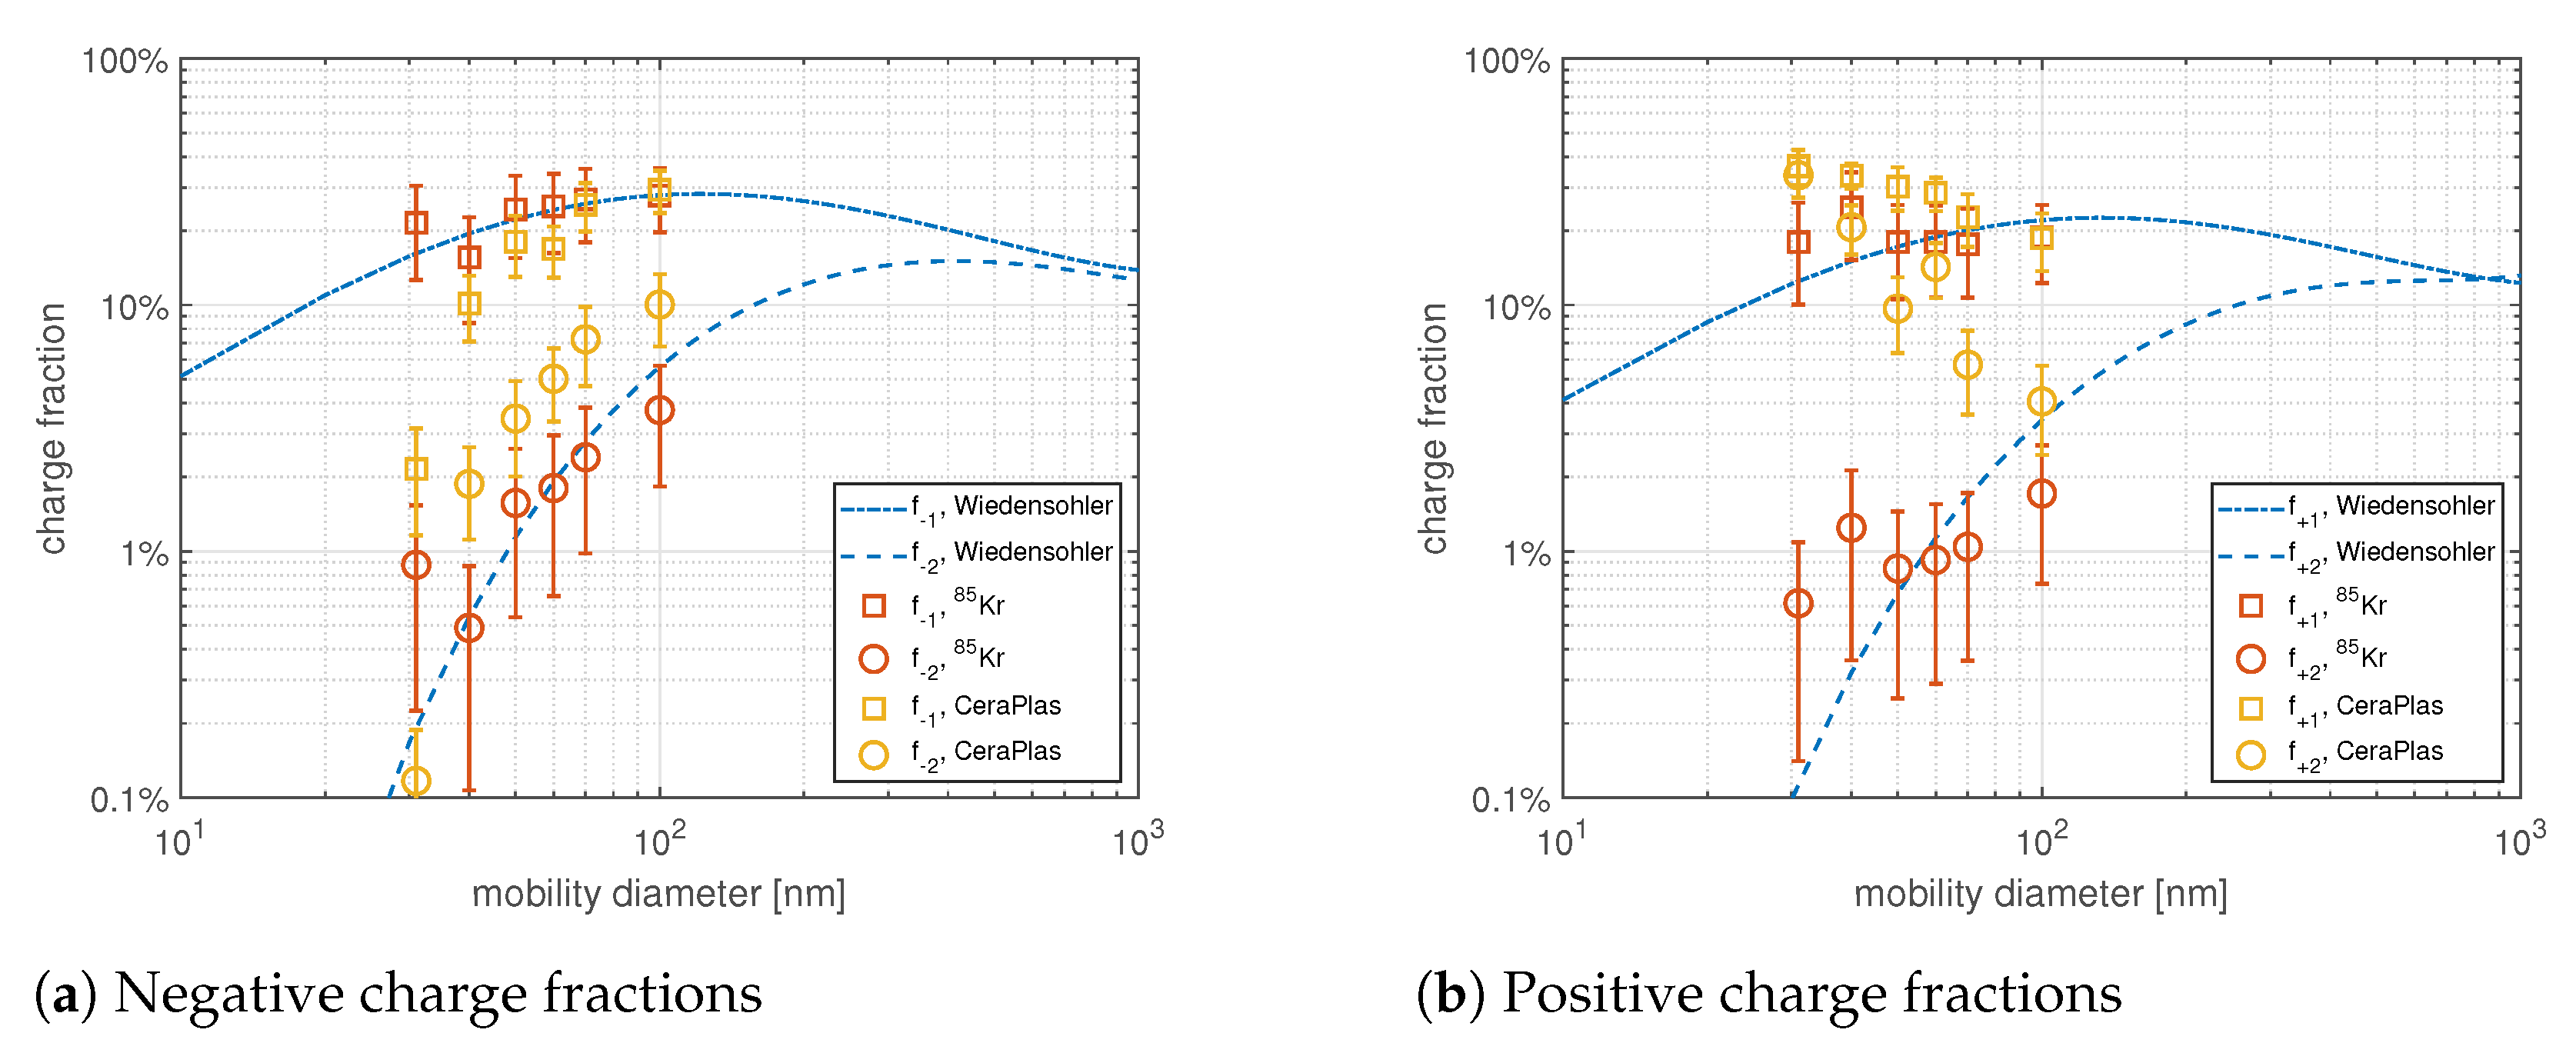
3.1. Feasibility Study Bipolar Charging

For the following measurements, the ESP was always turned on to remove pre-charged particles. In order to check for unwanted particle generation by the CeraPlas®, SMPS scans with a HEPA filter upstream the charging chamber were performed with the CeraPlas® alternately turned on and off (Since the X-ray charger is not active, no defined charge distribution is imparted on the particles. Therefore, the resulting SMPS scans do not show the real size distribution). No increased particle concentration was measured with the CeraPlas® turned on. A total number concentration in the order of 103 cm−3 was detected in both cases (on and off). Due to small leakeages of the 3D-printed package and fluctuating flow rates of the aerosol generator, a small amount of ambient air might be sucked into the charging chamber and cause a constant particle count. The detected leakage is acceptable for this feasibility study, since it was constant and less than 1% of the measured particle number concentration.
To compare the charging performance of CeraPlas® with the X-ray charger, measurements were performed with either the CeraPlas® or the X-ray charger activated at a given time. Consecutive particle size distribution measurements were performed in a 10 min interval to show the repeatability of the CeraPlas® charging behavior. Prior to the first size distribution measurement, SMPS scans with an activated X-ray charger were performed. The resulting data are shown in Figure 4a.
On average, a total number concentration of 5.11 × 105 cm−3 was achieved with the CeraPlas® and 1.04 × 105 cm−3 with the X-ray charger. The measured number concentration with the CeraPlas® compared to the X-ray charger was higher by a factor of around 5. This indicates either a higher charging efficiency or a higher fraction of positively charged particles when using the CeraPlas®, or both.
The mean particle size measured with CeraPlas® charged particles was 30 nm, whereas with the X-ray charger 37 nm on average was measured. The mode of the distribution was unaffected. A significantly higher charging efficiency occurred for particles smaller than 70 nm.
Particle size distributions of NaCl particles were measured over five consecutive days. To account for variations in the particle source, the particle number concentration was adjusted with the dilution bridge using the X-ray charger as reference. The reproducibility of the size distribution with CeraPlas® charged particles is shown in Figure 4b.

3.2. Charge Distribution Measurements

The obtained experimental data were compared to analytical values, which were calculated using Equation (A6) [2]. See the Appendix A for details. Size-dependent charge fractions up to two elementary charges per particle produced by neutralizers were considered. Particles with a diameter smaller than 100 nm can be mostly considered neutral or singly charged after passing a neutralizer, the fraction of particles that acquires more than three elementary charges is below 1% for this size regime [3]. Measurements were done at 30 nm, 41 nm, 50 nm, 60 nm, 70 nm and 100 nm (mobility diameter) for the CeraPlas® and a commercial 85Kr neutralizer (TSI 3077) as a reference. It must be noted though, that for measurements with the 85Kr neutralizer, particles were pre-charged because the charging chamber and ESP were bypassed, as shown in Figure 3.
The results and calculated values are plotted in Figure 5. With the CeraPlas®, the fractions of positive charged particles were much higher than those calculated with the Wiedensohler approximation (A6), especially for particles smaller than 50 nm. The negative singly charged fraction (Figure 5a) is much smaller than calculated, again with the maximum deviation occurring for particles smaller than 50 nm. This indicates that the positive ions produced by the CeraPlas® either exceeded the negative ions in terms of number concentrations or the positive ions are more mobile than negative ions. The measured charge fractions produced by the 85Kr neutralizer for most measurement points widely agree with the calculated curves. The higher positive fractions could be due to the setup, where no neutralizer or ESP were used upstream of the charger under question; thus, the positively charged particles leaving the selector DMA were not neutralized. Further, the calculation was done according to the ISO 15900 [3]; hence, the ratio of ion mobilities was assumed to be 0.875 [2]. This is an empirical value appropriate for 85Kr neutralizer. Ions produced by the CeraPlas® might be of a different kind, with another ratio of ion mobilities.

3.3. Ion Density Measurements

The measurement of the inlet ion concentrations that resulted for the positive ions were N i + = 3.48   ±   0.05   ×   10 6 cm−3 and for the negative ions were N i = 3.15   ±   0.08   ×   10 6 cm−3.
With these measured ion densities and an assumed ion recombination coefficient of 1.6   ×   10 12 m−3 s [15], a N i t product of about 1012 m−3 s for this charging configuration can be calculated.
It has to be mentioned that there was no defined gas flow into the Ionometer because the device does not allow for a tight connection to the setup as was the case for the SMPS. This could lead to a lower volumetric flow in the case of the Ionometer, which would favor ion–ion recombination, resulting in lower ion densities.

4. Discussion

The basic ability of the CeraPlas® to charge ultrafine particles was shown by a comparison of size distribution measurements using either the CeraPlas® or the X-ray charger within an SMPS. The resulting unimodal size distribution curves are comparable with respect to median particle size, while the total number concentration obtained with the CeraPlas® was approximately five times higher. Due to the fact that only positively charged particles were classified with the available TSI classifier, one can conclude that either a higher charging efficiency or a higher fraction of positively charged particles, or both, is obtained by the CeraPlas® compared to a X-ray charger. This behavior was proven to be stable and reproducible. From the estimated N i t product of 1012 m−3 s, we expect the charging efficiency to be lower, or at least too low for obtaining steady-state charge conditions independent from pre-existing charges. On the other hand, the mentioned problems with the ion concentration measurement method might have caused a significant underestimation of the N i t product. However, the obtained estimation underlines the potential of the CeraPlas® for aerosol charging. The values published here are meant to be a first estimation, and a detailed and systematical characterization will be done in a future work.
The charge fraction measurements show that the bipolar charge distribution of the CeraPlas® is unbalanced: it produces more positive then negative charges. This behavior will be investigated in further studies. The latest research shows a flow dependency of the balance of positive to negative charges for 85Kr chargers as well, underestimating the number of positive charges for higher flows [27]. Furthermore, it is was reported that ions are transported with the aerosol downstream the charger. Since the losses for positive ions are lower than for negative, the balance is shifted further towards positive charges with increasing transport length [27,28]. Another important influence that needs to be considered is the composition of the carrier gas; it is known that the ion mobility is different for different gases [29].
The experiments presented in this work were not conducted under ideal conditions. The charge fractions were measured only over a small size regime, restricted by the available measurement equipment. Larger particles showed a dominant peak that originates from multiple charged particles leaving the selector DMA. For the measurement of the negative mobility spectrum, a custom-built positive HV generator was used. Thus, the accuracy of the negative mobility spectrum is lower than for the positive mobility spectrum. The charging chamber was 3D-printed from electrically insulting material. To exclude any possible influence from the wall material of the charging chamber, it would be favorable to use a conductive material.
Attempts to measure the ion concentration using a current measurement by means of an ESP downstream of the CeraPlas® were not successful, and measurements with the Ionometer shall be seen as rough indications. The main reason for unsuccessful ion concentration measurements was that the CeraPlas® induces electromagnetic disturbances, resulting in difficulties with sensitive measurements of low currents induced by ions. The gas species may also have an influence on ion mobility. Within the experiments shown here, nitrogen was used as an aerosol carrier gas in order to suppress possible O3 generation.

5. Conclusions

Within this work a novel PCPG, the CeraPlas®, is proven feasible for aerosol charging. In our proof of concept study, we showed that bipolar particle charging is in principle possible with the CeraPlas® in a reproducible way. Furthermore, a first estimation of the obtainable N i t product promises great potential. The obtained results prove the feasibility and thereby raise the need for a comprehensive study. Charge distribution measurements show that the charging behavior is displaced towards positive charges, with a detailed elaboration still pending. Future work will also include investigations regarding the variation in the charging process by (i) applying an electric field within the charging chamber, (ii) changing the driving parameters of the CeraPlas® and (iii) varying the carrier gas composition. Systematical and detailed charge distribution and ion density measurements will provide a comprehensive characterization. Furthermore, the application as an ultra low-cost, unipolar charging source, possibly for high-volume applications, might be explored in succeeding studies.
In a future work, the concentration of positively and negatively charged ions generated by the CeraPlas® will be obtained from a reliable measurement in order to obtain a estimation for the N i t . Furthermore the influence of altering the driving parameters of the CeraPlas® (frequency, voltage, phase) on the ion concentrations will be investigated, which exceeded the scope of this study. The possibility of using an electric field to manipulate the relative ion concentrations into obtain unipolar charged aerosols will be investigated. This would enable establishing a low-cost charging source without the need for expensive high voltage generators. The long-term behavior of the obtained charge distribution as well as the aging and depletion effect need to be studied in detail, which was outside the scope of this feasibility study.

Author Contributions

Conceptualization, M.A.S., A.M. and A.B.; methodology, M.A.S.; validation, M.A.S. and H.K.; formal analysis, M.A.S., H.K.; investigation, M.A.S., H.K.; resources, A.M. and A.B.; data curation, M.A.S.; writing—original draft preparation, M.K.; writing—review and editing, M.K., M.A.S., A.M., H.K. and A.B.; visualization, M.K., H.K. and M.A.S.; supervision, A.B. All authors have read and agreed to the published version of the manuscript.

Funding

Open Access Funding by the Graz University of Technology.

Institutional Review Board Statement

Not applicable.

Informed Consent Statement

Not applicable.

Data Availability Statement

The data sets used in this study are available from the corresponding author on reasonable request.

Conflicts of Interest

The authors declare no conflict of interest.

Sample Availability

The CeraPlas® can be purchased from TDK.

Abbreviations

The following abbreviations are used in this manuscript:
AACAerodynamic Aerosol Classifier
ACAlternating Current
CPCCondensation Particle Counter
DBDDielectric Barrier Discharge
DMADifferential Mobility Analyzer
ESPElectrostatic Precipitator
HHeight
HEPAHigh Efficiency Particle Air
HVHigh Voltage
LLength
PCPGPiezoelectric Cold Plasma Generator
PDDPiezoelectric Direct Discharge
PNParticle Number
PZTLead Ziconite Titanate
SMPSScanning Mobility Patricle Sizer
UVUltra Violet
WWidth

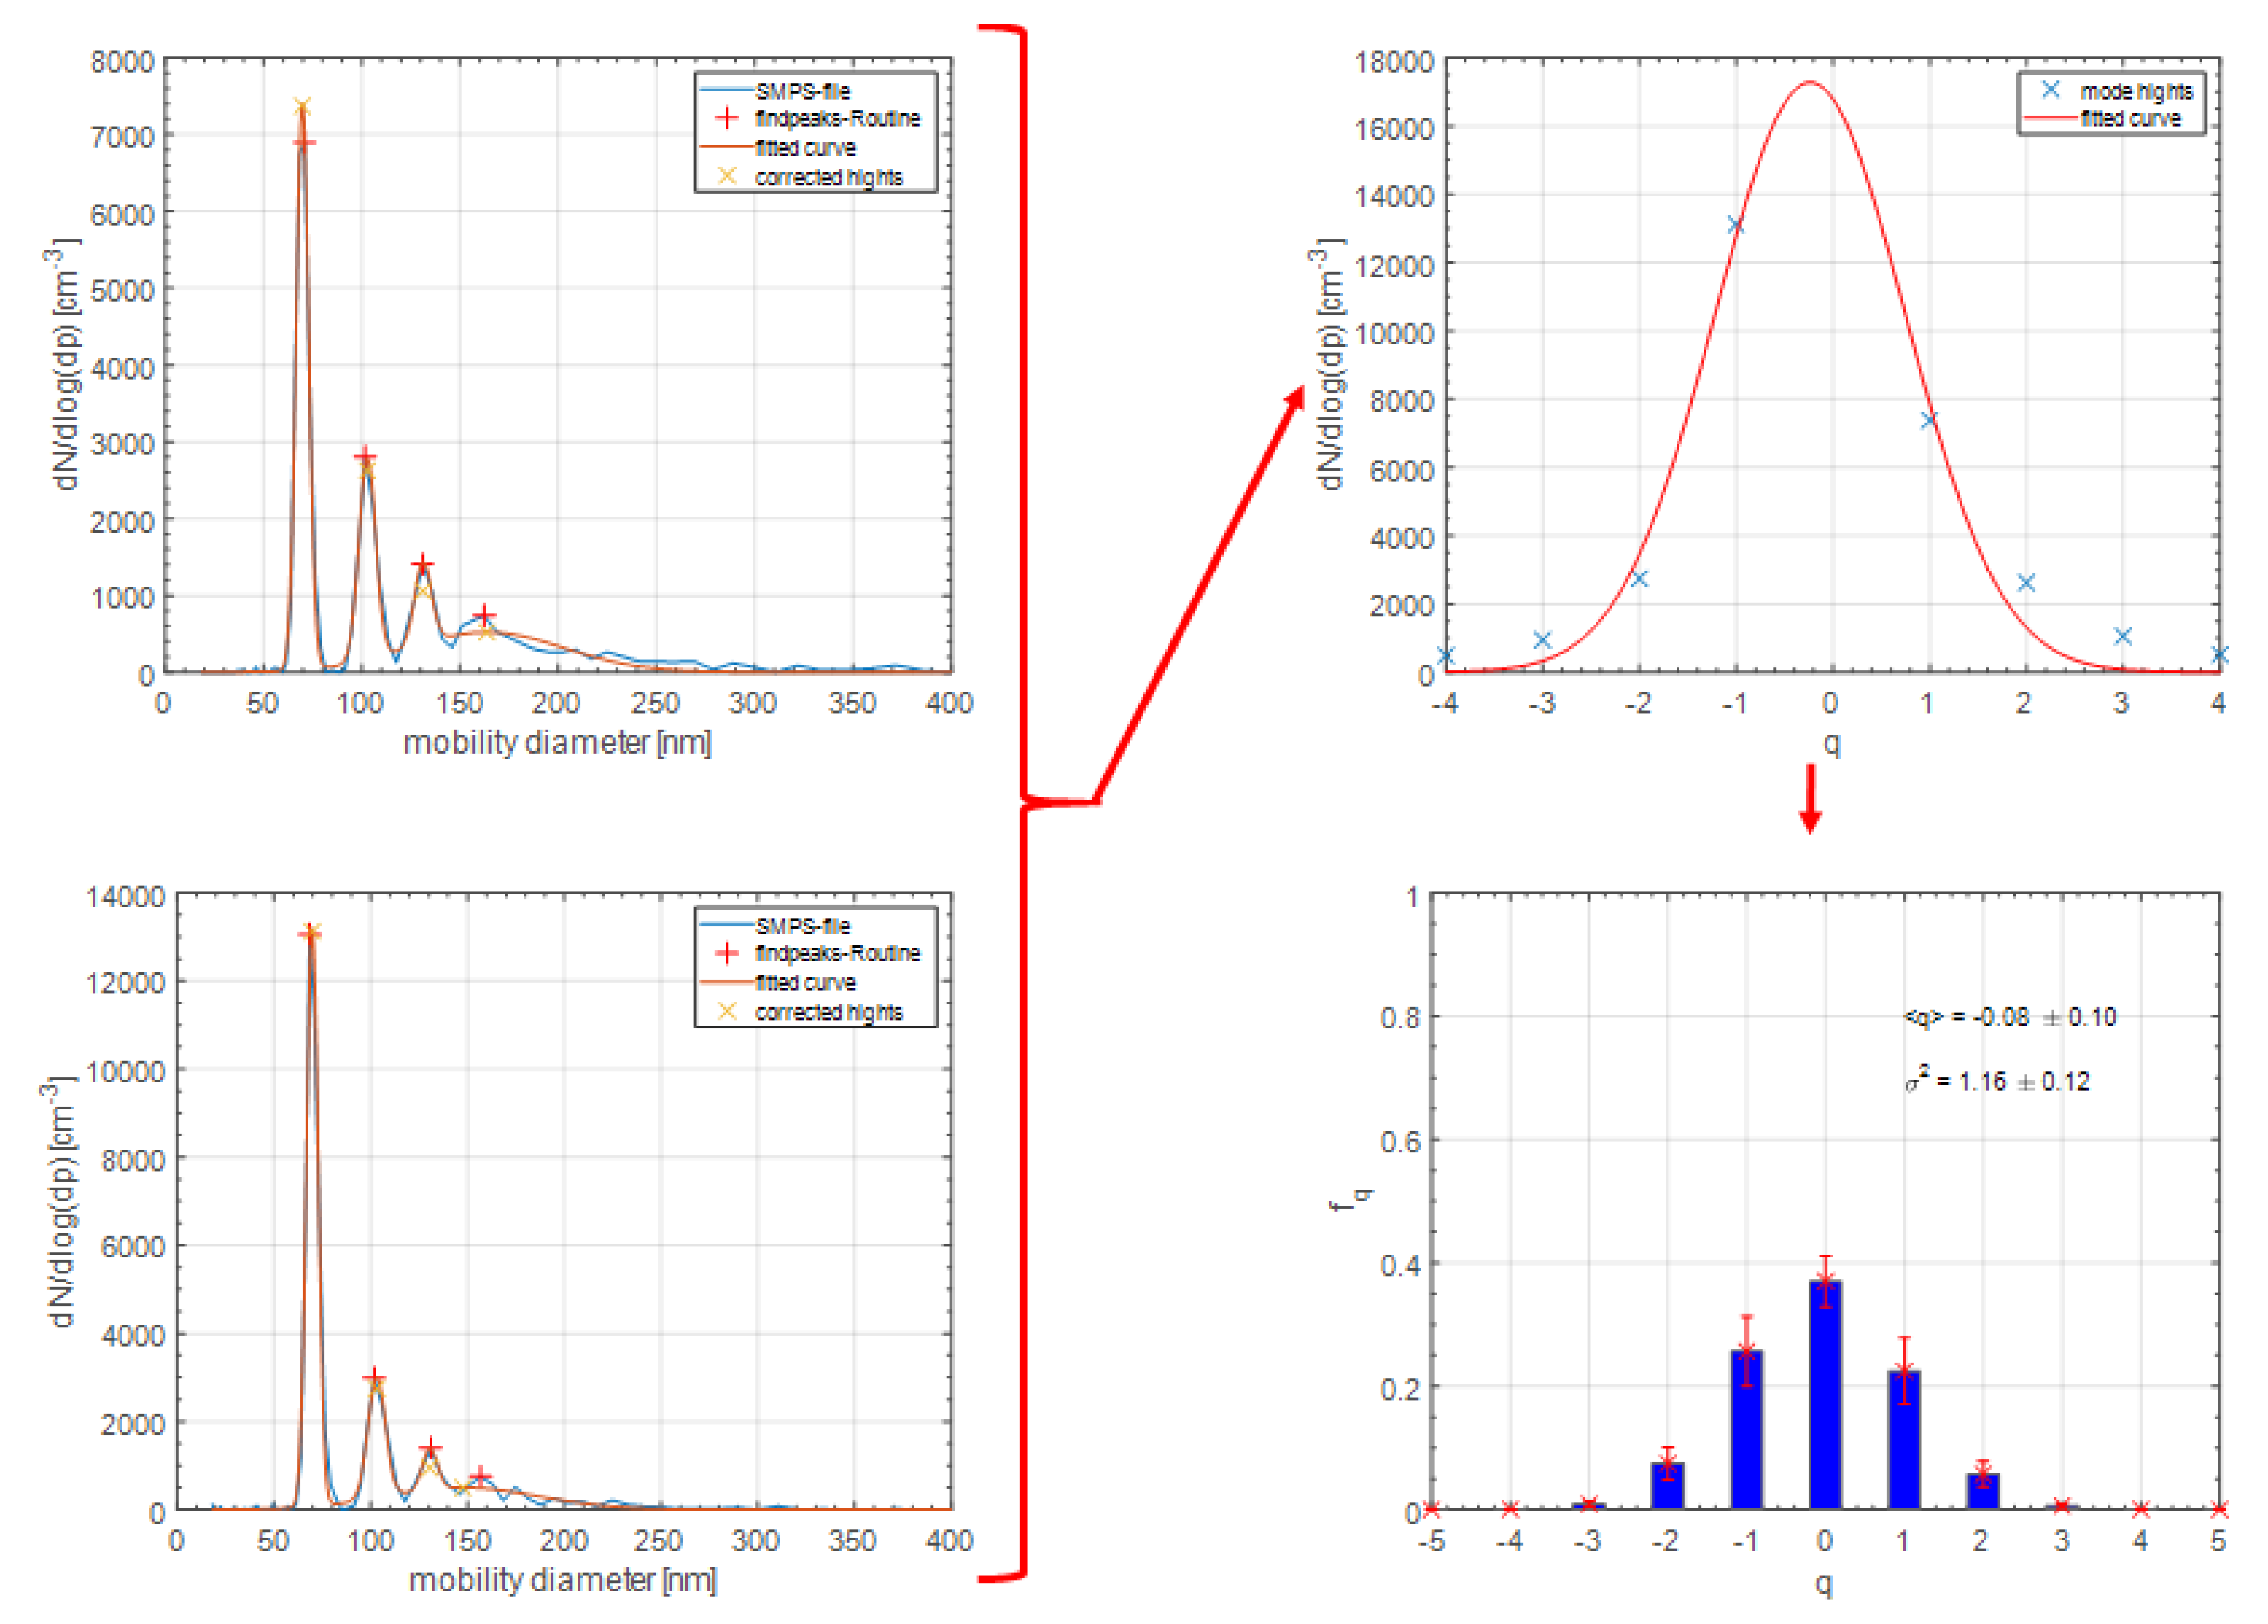
Appendix A. Evaluation of Bipolar Charge Distribution Curves

The mobility spectrum of either positively or negatively charged particles was measured with the setup shown in Figure A1. With the mobility spectra, the charge distribution on monodisperse particles was determined according to the approach in Mathon et. al. [15], which is schematically shown in Figure A1.
The mobility spectra, shown on the left-hand side in Figure A1, were measured with the SMPS by applying either a positive or a negative voltage ramp on the DMA column and were then used in a calculation procedure including the following steps:
  • Determination of the peak heights: Each peak of the mobility spectrum corresponds to a charge fraction. The main peak, which is located at the position of the selected mobility size (set by the selector DMA), corresponds to the singly charged particle fraction. Subsequent peaks correspond to multiply charged particles. Thus, relative peak heights represent the charge fractions. Due to peak overlapping, a multi-modal Gaussian fit is applied to determine the peak heights:
    f ( x ) = i = 1 i m a x a i · exp ( x b i ) 2 2 c i 2
    with x being the mobility diameter in this case.
  • Determination of the charge distribution assuming a Gaussian distribution function: The peak heights from the mobility spectra do not include the uncharged particle fraction. Therefore, the charge distribution is assumed to be Gaussian in shape (see Figure A1) in order to be able to determine the neutral fraction:
    f q = 1 2 π σ 2 exp ( q q ¯ ) 2 2 σ 2
    ln f q = 1 2 ( 2 π σ 2 ) · ( q q ¯ ) 2 2 σ 2
    The logarithmic curve is then fitted with a 2nd-order polynomial y = c 0 + c 1 q + c 2 q 2 with the fitting coefficients c 0 = ( ln 2 π σ 2 2 + q ¯ 2 2 σ 2 ) , c 1 = q ¯ σ 2 and c 2 = 1 2 σ 2 . Mean and standard deviation of the fitting curve can then be calculated from the fit coefficients as:
    σ 2 = 1 2 c c q ¯ = c 1 σ 2
  • Calculation of uncertainties for the charge bins acc. to [15]:
    δ f q = δ q ¯ | q q ¯ σ 2 | f q + δ σ 2 σ 2 1 + | ( q q ¯ ) 2 2 σ 2 | f q
    with the assumed uncertainties δ q 0.1 and δ σ 2 0.1 σ 2 .
Figure A1. Determination of charge distribution on monodisperse particles based on mobility spectra, measured by a tandem DMA approach.
Plasma 04 00027 g0a1
Charge Fractions for DMA Charge Conditioning
Aerosol neutralizers, used prior to a DMA classification device, need to ensure a defined particle charge distribution, according to the ISO 15900 standard [3]. The charge fractions up to two elementary charges for a particle size between 20 nm to 1000 nm, produced by these neutralizers, can be calculated according to the Wiedensohler approximation [2]
log f q ( d ) = i = 0 5 a i q ( log ( d ) ) i
Fit coefficients are shown in Table A1.
Table A1. Fit coefficients up to ±2 elementary charges for Equation (A6).
i q = 2 q = 1 q = 0 q = 1 q = 2
0−26.3328−2.31970.0003−2.3484−44.4756
135.90440.6175−0.10140.604479.3772
2−21.46080.62010.30730.4800−62.8900
37.0867−0.1105−0.33720.001326.4492
4−1.3088−0.12600.1203−0.1553−5.7480
50.15010.0297−0.01050.03200.5049

References

  1. Baron, P.A.; Willeke, K. Aerosol Measruement, 2nd ed.; Wiley-Interscience: Hoboken, NJ, USA, 2001; p. 1063. [Google Scholar]
  2. Wiedensohler, A. An approximation of the bipolar charge distribution for particles in the submicron size range. J. Aerosol Sci. 1988, 19, 387–389. [Google Scholar] [CrossRef]
  3. INTERNATIONAL STANDARD ISO 15900 Determination of particle size distribution—Differential electrical mobility analysis for aerosol particles. J. Aerosol Sci. 2009.
  4. Nishida, R.T.; Johnson, T.J.; Hassim, J.S.; Graves, B.M.; Boies, A.M.; Hochgreb, S. A Simple Method for Measuring Fine-to-Ultrafine Aerosols Using Bipolar Charge Equilibrium. ACS Sens. 2020, 5, 447–453. [Google Scholar] [CrossRef]
  5. Schriefl, M.A.; Bergmann, A. Design principles for diffusion chargers sensing particle number concentration. Proc. IEEE Sens. 2017, 2–4. [Google Scholar] [CrossRef]
  6. Adachi, M.; Kousaka, Y.; Okuyama, K. Unipolar and bipolar diffusion charging of ultrafine aerosol particles. J. Aerosol Sci. 1985, 16, 109–123. [Google Scholar] [CrossRef]
  7. Knoll, M.; Schriefl, M.A.; Nishida, R.T.; Bergmann, A. Impact of pre-charged particles on steady state and pulsed modes of unipolar diffusion chargers. Aerosol Sci. Technol. 2021, 55, 512–525. [Google Scholar] [CrossRef]
  8. Schriefl, M.A.; Nishida, R.T.; Knoll, M.; Boies, A.M.; Bergmann, A. Characterization of particle number counters based on pulsed-mode diffusion charging. Aerosol Sci. Technol. 2020, 54, 772–789. [Google Scholar] [CrossRef]
  9. Fuchs, N.A. On the stationary charge distribution on aerosol particles in a bipolar ionic atmosphere. Geofis. Pura E Appl. 1963, 56, 185–193. [Google Scholar] [CrossRef]
  10. Pui, D.Y.; Fruin, S.; McMurry, P.H. Unipolar diffusion charging of ultrafine aerosols. Aerosol Sci. Technol. 1988, 8, 173–187. [Google Scholar] [CrossRef]
  11. Gopalakrishnan, R.; Thajudeen, T.; Ouyang, H.; Hogan, C.J. The unipolar diffusion charging of arbitrary shaped aerosol particles. J. Aerosol Sci. 2013, 64, 60–80. [Google Scholar] [CrossRef]
  12. Li, L.; Gopalakrishnan, R. An experimentally validated model of diffusion charging of arbitrary shaped aerosol particles. J. Aerosol Sci. 2021, 151. [Google Scholar] [CrossRef]
  13. Boisdron, Y.; Brock, J.R. On the stochastic nature of the acquisition of electrical charge and radioactivity by aerosol particles. Atmos. Environ. (1967) 1970, 4, 35–50. [Google Scholar] [CrossRef]
  14. Biskos, G.; Reavell, K.; Collings, N. Unipolar diffusion charging of aerosol particles in the transition regime. J. Aerosol Sci. 2005, 36, 247–265. [Google Scholar] [CrossRef]
  15. Mathon, R.; Jidenko, N.; Borra, J.P. Ozone-free post-DBD aerosol bipolar diffusion charger: Evaluation as neutralizer for SMPS size distribution measurements. Aerosol Sci. Technol. 2017, 51, 282–291. [Google Scholar] [CrossRef] [Green Version]
  16. de La Verpilliere, J.L.; Swanson, J.J.; Boies, A.M. Unsteady bipolar diffusion charging in aerosol neutralisers: A non-dimensional approach to predict charge distribution equilibrium behaviour. J. Aerosol Sci. 2015, 86, 55–68. [Google Scholar] [CrossRef] [Green Version]
  17. Nishida, R.T. Measuring Aerosol Nanoparticles by Ultraviolet Photoionisation. Ph.D. Thesis, University of Cambridge, Cambridge, UK, 2018. [Google Scholar]
  18. Ye, D.; Gao, D.; Yu, G.; Shen, X.; Gu, F. An investigation of the treatment of particulate matter from gasoline engine exhaust using non-thermal plasma. J. Hazard. Mater. 2005, 127, 149–155. [Google Scholar] [CrossRef]
  19. Tauber, C.; Schmoll, D.; Gruenwald, J.; Brilke, S.; Wlasits, P.J.; Winkler, P.M.; Wimmer, D. Characterization of a non-thermal plasma source for use as a mass specrometric calibration tool and non-radioactive aerosol charger. Atmos. Meas. Tech. 2020, 13, 5993–6006. [Google Scholar] [CrossRef]
  20. Fridman, A.; Chirokov, A.; Gutsol, A. Non-thermal atmospheric pressure discharges. J. Phys. D Appl. Phys. 2005, 38. [Google Scholar] [CrossRef]
  21. TDK CeraPlas® Evaluation Kit Documentation. Available online: https://www.tdk-electronics.tdk.com/inf/130/Cold_Plasma/Z63000Z2910Z1Z69.pdf (accessed on 14 May 2021).
  22. TDK CeraPlas® Piezoelectric Based Cold Plasma Generator Data Sheet. Available online: https://www.tdk-electronics.tdk.com/inf/130/Cold_Plasma/Z63000Z2910Z1Z66.pdf (accessed on 14 May 2021).
  23. TDK CeraPlas® Product Homepage. Available online: https://www.tdk-electronics.tdk.com/en/2464638/products/product-catalog/cold-plasma-technology/ceraplas-element (accessed on 14 May 2021).
  24. Kudela, P.; Puff, M.; Rinner, F. Device for Generating an Atmospheric-Pressure Plasma. US10856399B2, 1 December 2020. [Google Scholar]
  25. Burger, D.; Hoppenthaler, F.; Kudela, P.; Nettesheim, S.; Puff, M.; Weilguni, M. Plasmagenerator. DE102017105410A1, 20 September 2018. [Google Scholar]
  26. Sasaki, Y.; Yamamoto, M.; Ochi, A.; Inoue, T.; Takahashi, S. Small Multilayer Piezoelectric Transformers with High Power Density—Characteristics of Second and Third-Mode Rosen-Type Transformers. Jpn. J. Appl. Phys. 1999, 38, 5598–5602. [Google Scholar] [CrossRef]
  27. Johnson, T.J.; Nishida, R.T.; Irwin, M.; Symonds, J.P.; Olfert, J.S.; Boies, A.M. Measuring the bipolar charge distribution of nanoparticles: Review of methodologies and development using the Aerodynamic Aerosol Classifier. J. Aerosol Sci. 2020, 143, 105526. [Google Scholar] [CrossRef]
  28. Tigges, L.; Jain, A.; Schmid, H.J. On the bipolar charge distribution used for mobility particle sizing: Theoretical considerations. J. Aerosol Sci. 2015, 88, 119–134. [Google Scholar] [CrossRef]
  29. Investigation of the bipolar charge distribution at various gas conditions. J. Aerosol Sci. 1986, 17, 413–416. [CrossRef]
Figure 1. The CeraPlas® as available from TDK.
Plasma 04 00027 g001
Figure 2. Experimental setup for the feasibility study of the particle charging capability of the CeraPlas®.
Plasma 04 00027 g002
Figure 3. Flow schematics of the experimental setup for the measurement of the charge distribution.
Plasma 04 00027 g003
Figure 4. Particle size distribution measurements with both the X-ray charger and the CeraPlas®. (a) Nine repetitions of size distribution measurement using the CeraPlas® for particle charging. The measurements were performed in a 10 min interval. A reference measurement with the X-ray charger was done before Run 1. The settings of the particle generator were not changed. (b) Particle size distributions for NaCl particles, measured with CeraPlas® and X-ray charger. Size distribution curves have been measured on several days to ensure reproducibility.
Plasma 04 00027 g004
Figure 5. Fractions of single and double charged particles plotted against the mobility diameter. Dashed lines show the calculated fractions according to the Wiedensohler approximation (A6), red symbols are the measured fractions generated by the commercial 85Kr neutralizer, and yellow symbols represent measurements with the CeraPlas® as a charging source.
Plasma 04 00027 g005
Publisher’s Note: MDPI stays neutral with regard to jurisdictional claims in published maps and institutional affiliations.

