Article

Dependence of Optical Emission Spectra on Argon Gas Pressure during Modulated Pulsed Power Magnetron Sputtering (MPPMS)

1
Faculty of Engineering, Tokyo Polytechnic University, Atsugi Kanagawa 243-0297, Japan
2
Ayabo Corporation, Anjo Aichi 446-0052, Japan
3
Department of Chemistry, Graduate School of Science, Tohoku University, Sendai 980-8578, Japan
4
Toyota Physical and Chemical Research Institute, Nagakute Aichi 480-1192, Japan
*
Author to whom correspondence should be addressed.
Plasma 2021, 4(2), 269-280; https://doi.org/10.3390/plasma4020018
Submission received: 29 April 2021 / Revised: 14 May 2021 / Accepted: 17 May 2021 / Published: 19 May 2021
(This article belongs to the Special Issue Feature Papers in Plasma Sciences)

Abstract

:
Modulated pulsed power magnetron sputtering (MPPMS) of titanium was investigated as a function of argon gas pressure using optical emission spectroscopy (OES). Delays in discharge and the formation of comb-like discharge current waveforms due to splitting and pulsing were observed with a decrease in pressure. This observation corresponds to the evolution from MPPMS condition to deep-oscillation-magnetron-sputtering (DOMS)-like condition by changing discharge gas pressure. The optical emission intensities of the ionic species (Ar+ and Ti+) increased as the comb-like current waveforms were formed with decreasing Ar pressure. This behavior showed a marked contrast to that of the neutral species (Ar and Ti). The Ar pressure dependence of OES was revealed to be due to the plasma build-up stage, which is the initial generation process of plasma discharge in pulsed dc magnetron sputtering, from the temporal profile for the atomic-line intensities of the optically emitting species in MPPMS and DOMS-like plasmas.

1. Introduction

High power pulsed magnetron sputtering (HPPMS), including high power impulse magnetron sputtering (HiPIMS), is attracting attention as an ionized physical vapor deposition (I-PVD) technique [1,2,3,4,5] that enables the formation of high-performance films with high hardness, smoothness and adhesiveness [6,7,8]. Several running systems with different types of high voltage pulsed power supplies have been proposed for HPPMS. This includes a modulated pulsed power (MPP) system used for magnetron sputtering, referred to as modulated pulsed power magnetron sputtering (MPPMS) [9,10,11,12,13]. The MPP system has also been recently applied to a new magnetron sputtering technique known as deep oscillation magnetron sputtering (DOMS), which has attracted significant attention as an arc-free deposition technique [14,15,16,17,18]. DOMS is MPPMS that uses long-pulsed power consisting of approximately 10 to 20 short pulses. Apart from DOMS, a method known as multi-pulse HiPIMS (m-HiPIMS), in which HiPIMS is performed with a few serial short bipolar pulses, has also been developed [19,20,21]. Both of these techniques have been proposed as new methods to increase the deposition rate by avoiding arcs in DOMS and reducing metal ion back-attraction in m-HiPIMS. Furthermore, very recently, bipolar-DOMS has been developed as a new method that combines the elements of DOMS and m-HiPIMS [22,23].
In I-PVD represented by HiPIMS, abundantly generated Ar ions and sputtered metal ions have opposite effects in coating and film deposition [24,25,26]. A large amount of Ar+ ions cause embrittlement of the substrate with Ar bubbles beneath the surface due to the implantation of Ar atoms. In contrast, a large amount of metal ions that arrive at the sample with normal incidence by the electric field in the plasma potential at the surface [27] result in the formation of void-free, high-density and high-adhesion films. Overall, the generation of Ar ions and metal ions in the sputtering plasma of I-PVD has a trade-off relationship. Hence, it is important for controlling the film deposition to meet the optimal condition for metal-ion generation in the balance of these ions.
In the present study, the effect of the working gas pressure on the correlation between the discharge current/voltage and OES in MPPMS plasma was investigated to obtain further information on the optimal conditions for the formation of a deposited film using MPPMS. Comb-like discharge current waveforms [28] as used in DOMS, and strong optical emission of Ar+ atomic lines which has not been reported in a pure metallic sputtering mode (, not in metal-oxide sputtering mode [29,30]) by MPPMS of a Ti target were observed as the gas pressure decreased. Furthermore, the optical emission intensities of sputtered Ti+ ions and Ar+ gas ions were also observed to change according to the number of pulses in the comb-like current waveforms. The presence of Ar+ in the film formation of I-PDV such as HPPMS has a great influence on the film deposition rate and the film quality. In the present study, a time-resolved measurement of optical emissions was also performed in order to obtain an origin and conditions for the strong Ar+ atomic lines in OES for DOMS-like plasma. As a result, it was found that the MPPMS plasma generated in the comb-like discharge current waveform exhibited the characteristics of dc pulse discharge. In this article, we will discuss the relationship between the evolution of OES and the MPPMS current waveforms based on the pulse discharge stage.

2. Materials and Methods

The experimental setup is shown in Figure 1. The sputtering source chamber was evacuated to a base pressure of 5 × 10⁻⁶ Pa with a 2200 L/s turbomolecular pump (Edwards, STP-A2203C, Sweden). Argon (99.999%) was used as the sputtering gas, which was introduced to the sputtering source chamber with a mass flow controller (1) (Kofloc, CR-400, Japan). MPP sputtering was conducted under working pressures in the range of 0.81–1.60 Pa, which corresponded to Ar flow rates of 600–1300 sccm. An unbalanced circular magnetron sputtering assembly (Gencoa, Circular VTech, UK) was employed as the sputtering source with a 2-inch diameter titanium target disk. The grounded anode was a flat ring-shaped shield that was removed from the sputtering source in this study to observe the plasma emission closer to the target surface. The effect of the anode shape of the sputtering source on the discharge of the sputtering plasma was reported in detail in a previous paper [28], and it will not be further described here.
The sputtering source was powered by a high-power pulse generator (Zpulser, Axia, MA, USA) which consisted of an MPP system. The charging voltage for capacitors in the pulse generator was fixed at 350 V in this study. The pulse generator was driven under a repetition rate of 20 Hz. The waveform of the micro pulse train is shown in Figure 2, which is used to control the insulated gate bipolar transistor (IGBT) in the pulse generator to chop the charging voltage. As detailed elsewhere [28], the pulse-on/-off time widths for the output waveform (macro pulse) were 6 μs/30 μs for the first pulse train and 12 μs/10 μs for the last pulse train. The bundle of micro pulses corresponds to the synchronous pulse, in which the rise and cut-off edges are formed by the first and the last micro pulses of the MPP system, respectively. The discharge current and voltage waveforms were monitored and recorded with a digital storage oscilloscope (LeCroy, LT344, NY, USA).
OES spectra of the plasma were sampled using an optical fiber mounted in the sputtering source chamber, and the emission spectra were measured with a CCD spectrometer (Ocean Optics, USB2000, Dunedin, FL, USA). Additional argon gas was introduced at a flow rate of 50 sccm through the mass flow controller (2) shown in Figure 2 (Kofloc, CR-300, Nagoya, Japan) at 10 mm downstream from the target surface, so as to prevent the deposition of sputtered particles on the tip of the optical fiber. The optical fiber was used with a focusing system consisting of a commercially available L-type lens assembly which is a built-in collimating lens (Gencoa, Right angle lens assembly, Liverpool, UK). The emission intensity obtained from the CCD spectrometer was calibrated for the wavelength range from 200 nm to 800 nm using a standard light source (Photo Research, PR-2301, Chatsworthm, CA, USA). The assignment of atomic lines measured with the CCD spectrometer was confirmed by comparison with the results obtained using a wavelength-scanning type 25-cm spectrometer (Koken Kogyo, SG-250, Tokyo, Japan) [31]. A photomultiplier tube (Hamamatsu Photonics, R928, Hamamatsu, Japan) was used as the photodetector. Temporal profiles of the optical signal detected by the photomultiplier tube set on the 25-cm spectrometer were monitored and recorded with the digital storage oscilloscope.

3. Results and Discussion

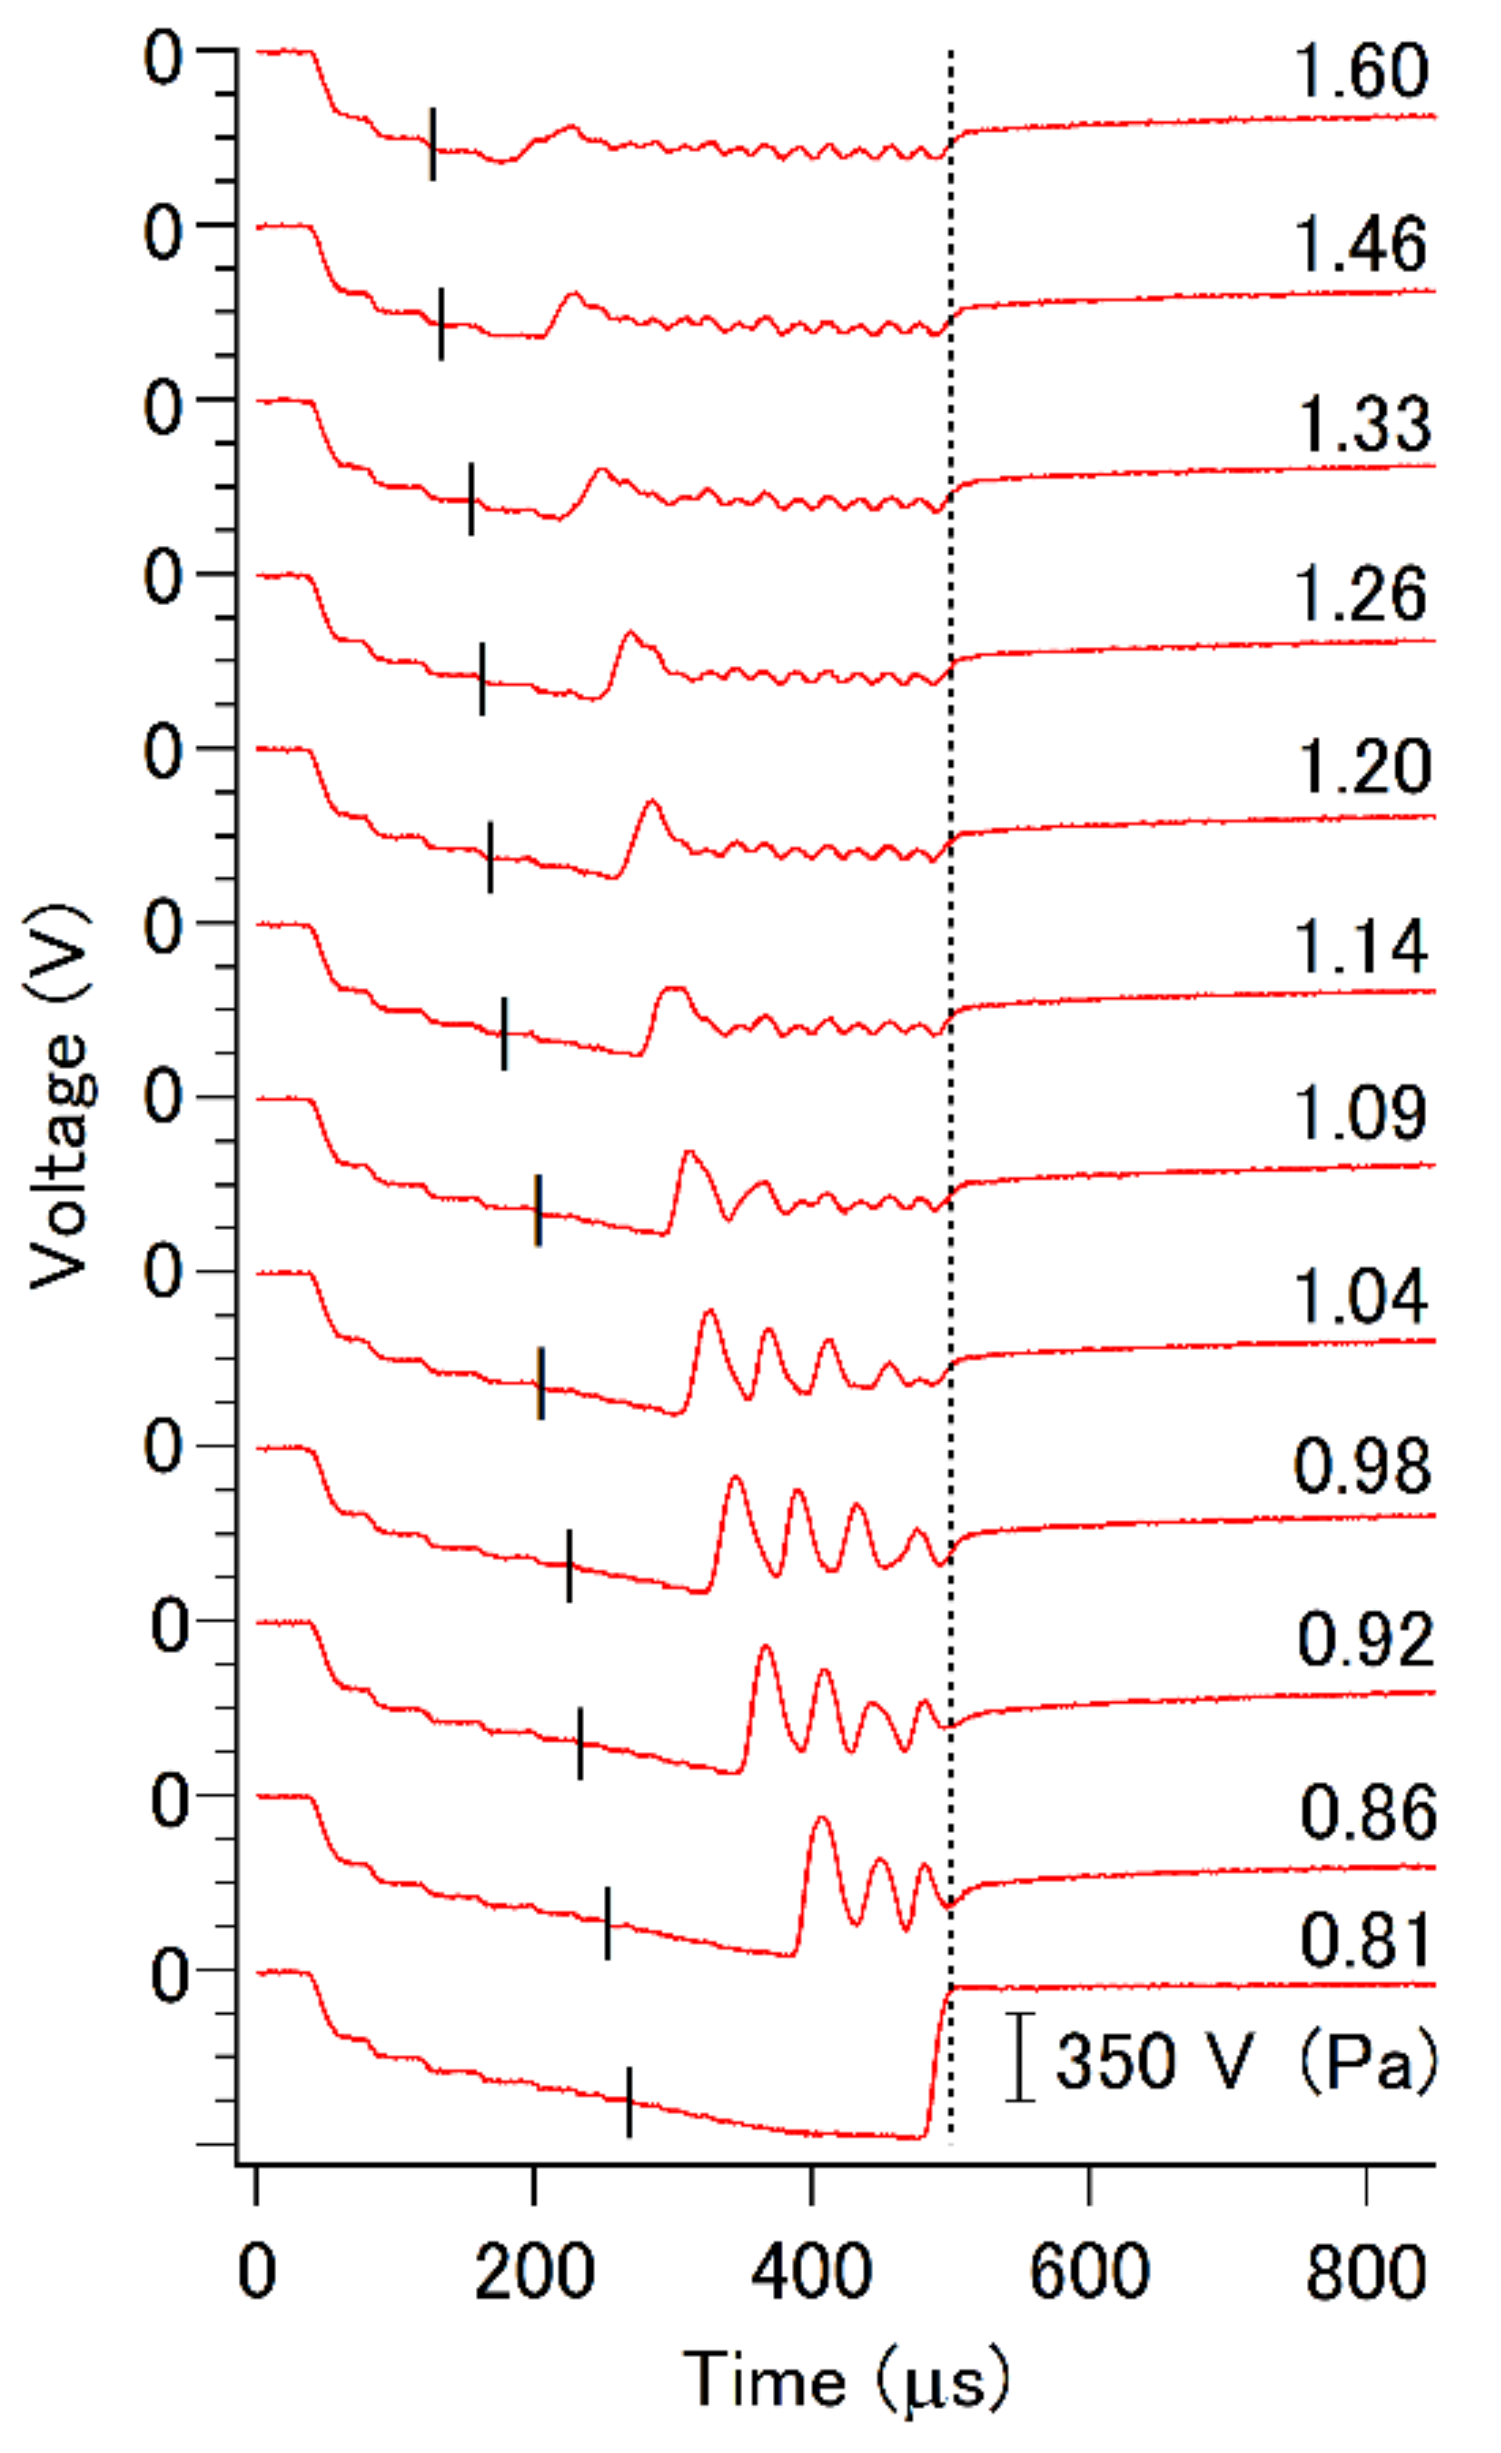
3.1. Discharge Pulse Waveforms
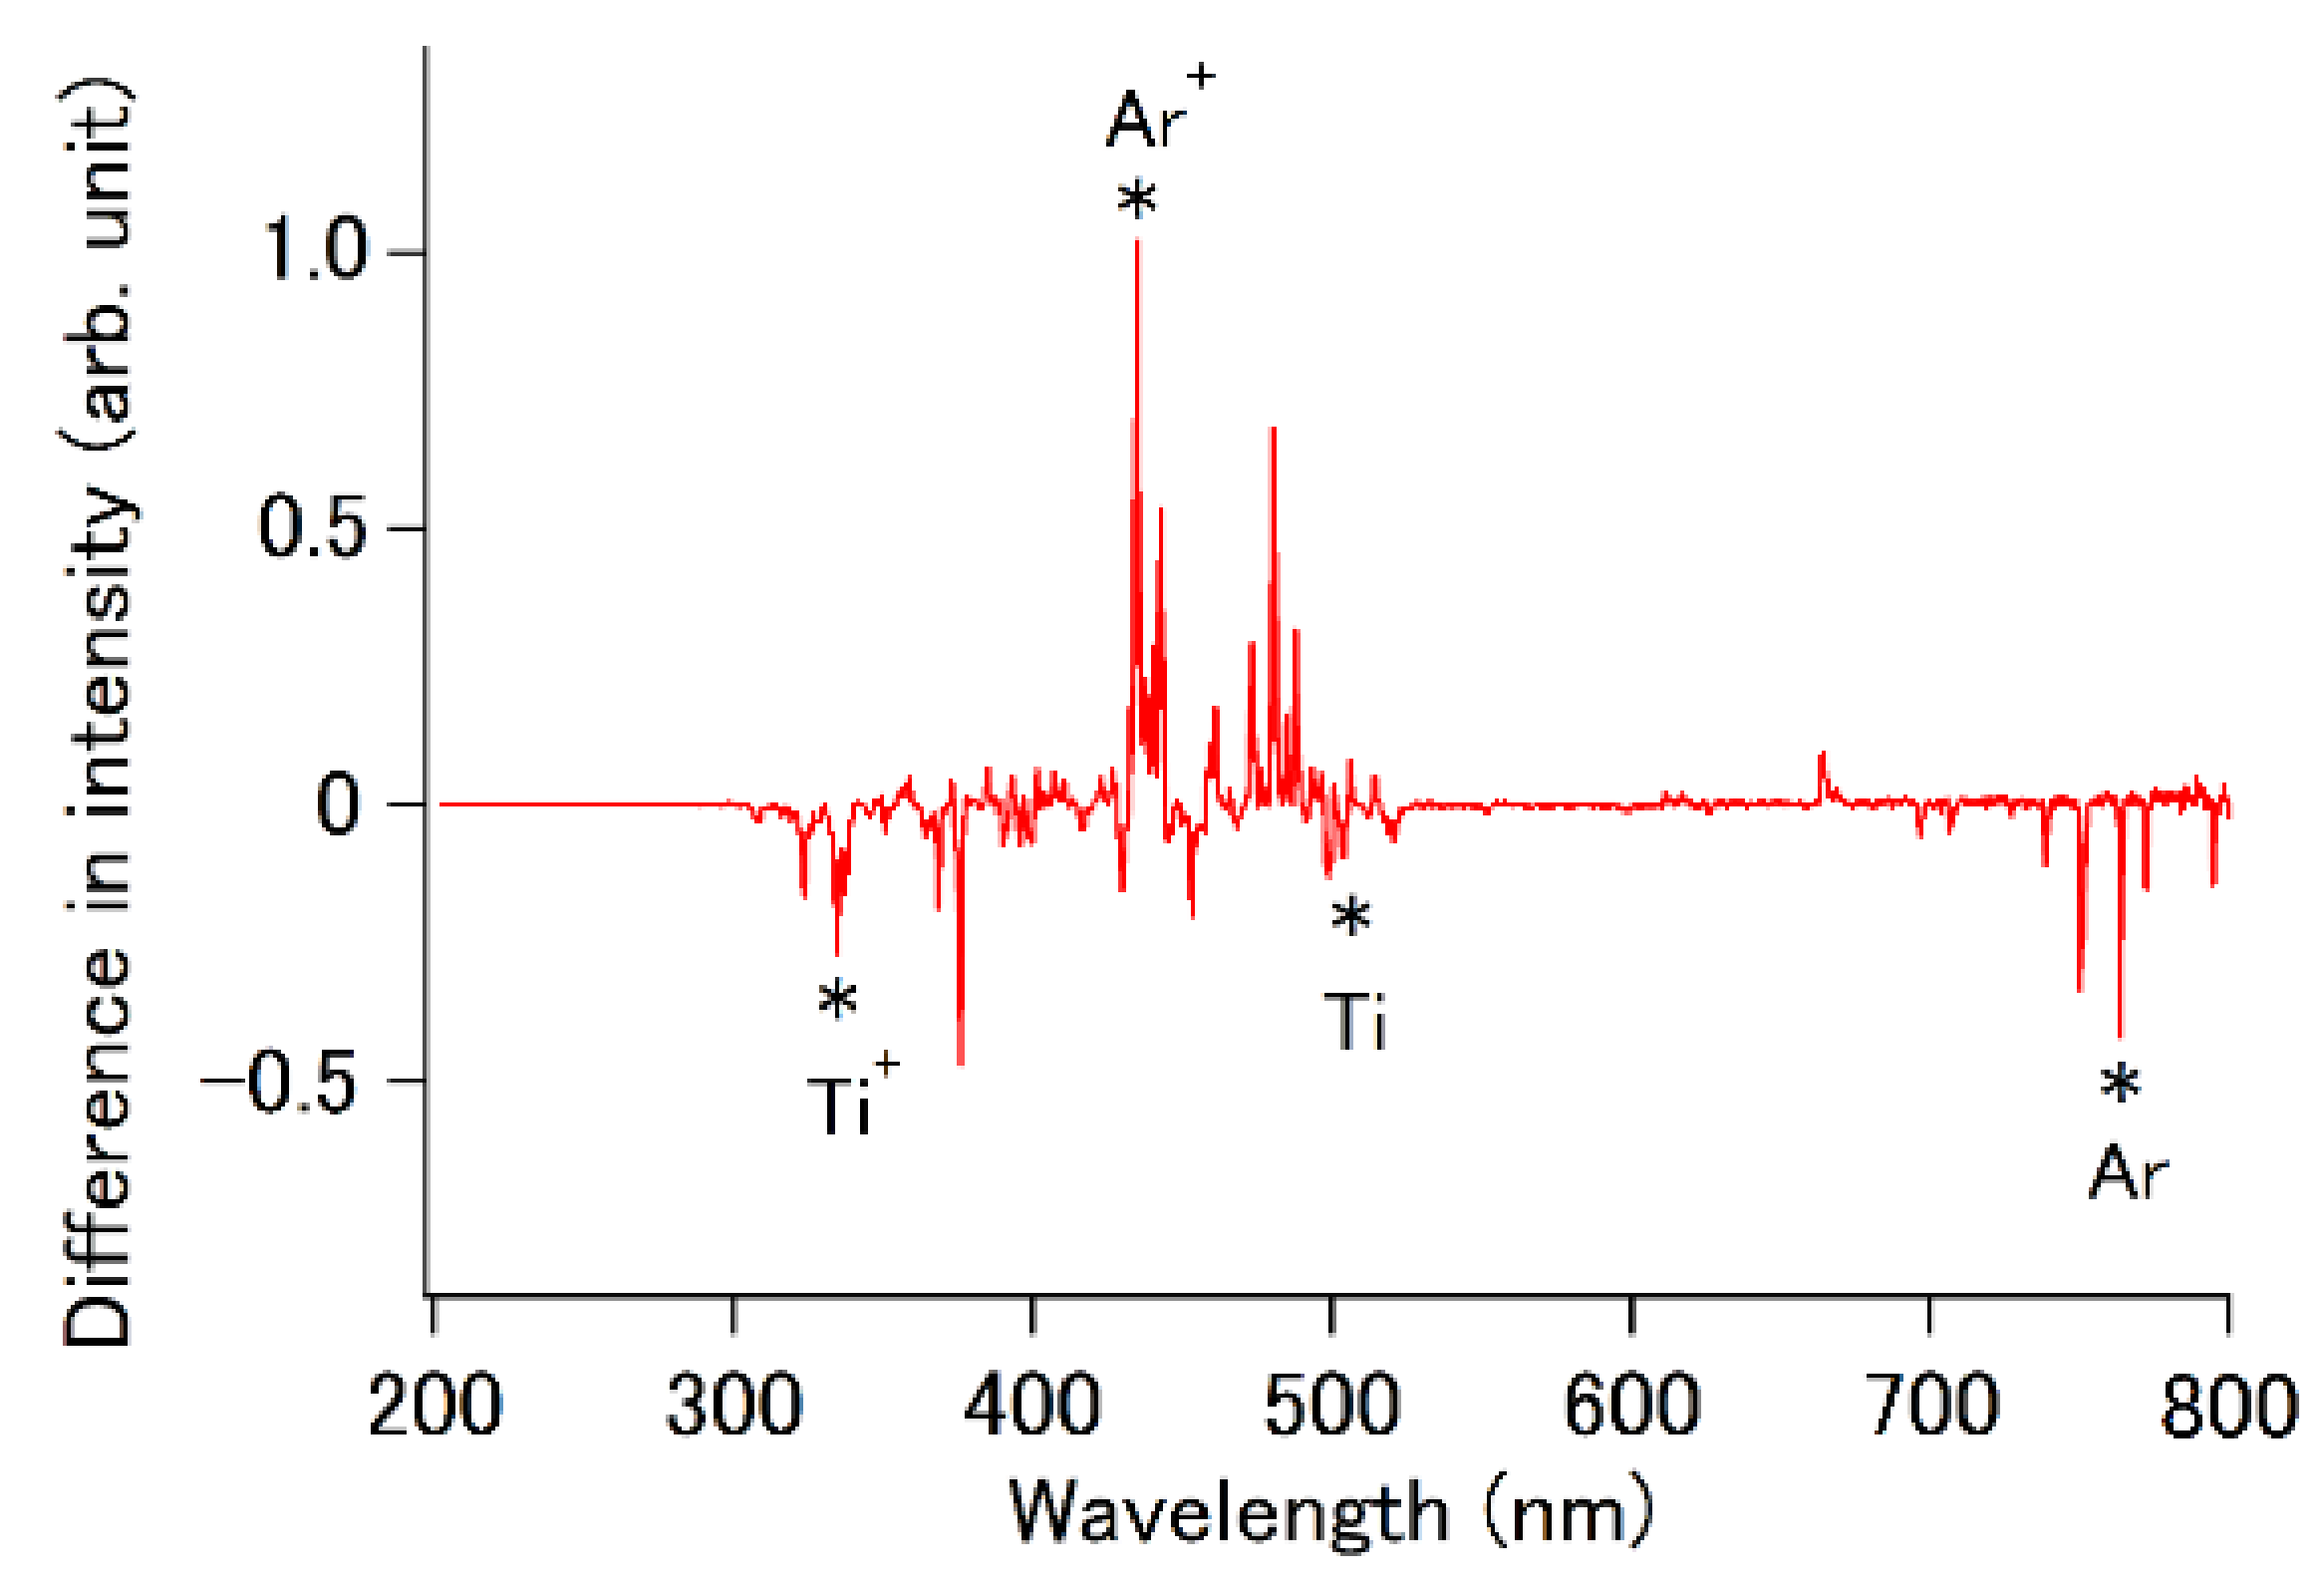
Figure 3 and Figure 4 show the waveforms of discharge current and discharge voltage in the working-pressure range of 0.81–1.60 Pa, respectively. The evolution of the current waveform with a limited Ar flow rate indicated a significant delay of the onsets of current [28]. This phenomenon referred to as delayed discharge [32] was observed in HiPIMS plasma of several metals (zinc, copper, niobium, chromium and tungsten) [33], and was observed in the MPPMS plasma of titanium [28]. The breakdown of discharge voltage at a given gas pressure shown in Figure 4 was also observed with the same timing to rise of the discharge current at the same pressure in Figure 3. As the Ar pressure decreased, the current waveform was divided into a few peaks, and was transformed from standard MPPMS discharge waveform to the so-called comb-like current waveform [11,12,34], which finally became a single pulse with a high peak current at 0.81 Pa and lower pressures. In this study, comb-like current waveforms, such as those applied in DOMS [14,15,16,17,18], were observed in the working pressure range of 0.86–1.04 Pa. The time interval between pulses of the comb-like current waveform was the same as that of the micro pulses of the MPP power supply: For example, the pulse width in the comb-like current waveform and the micro pulse were almost the same width of ca. 12 μs at 1.04 Pa discharge. However, the pulse interval (ca. 45 μs) in the comb-like current waveform at this pressure was several times longer than the pulse-off times between micro pulses (10 μs). This difference was probably determined by the electrical time constant of the MPP power supply. A significant delay in the increase of the discharge current, which corresponded to a power pulse width of 500 μs, was observed at a pressure of 0.81 Pa.
The peak power density, the average power density and the peak current for these discharge waveforms are shown in Figure 5 as a function of the working pressure in the range of 0.81–1.60 Pa. The average power density was determined by dividing the definite integral value of the power density from the time 0 to the end time of the repetition period by the repetition period. The peak power density increased with a decrease in the working pressure due to spark discharge by accumulated charge in the power supply, depending on the delay time of discharge. The peak current was found to show a similar Ar-pressure dependence to the peak power density in Figure 5. On the other hand, the average power density dropped steeply at lower pressures, where the delayed discharge occurred at the cut-off time of the macro pulse due to being the power supplying from the high-power pulsed generator off.
According to the well-known duty-cycle diagram for magnetron sputtering depicted by Gudmundsson et al. [1], the peak power of the HiPIMS region is defined as more than 0.6 kW/cm2. The discharge power corresponding to the HiPIMS region in the present experiment was observed under conditions with a remarkable delayed discharge, although these conditions are far from those for typical plasma operation using an MPP power source.

3.2. OES

Figure 6 shows a series of optical emission spectra for MPPMS plasma at working pressures of 0.81–1.60 Pa. Atomic lines corresponding to Ar+, Ar, Ti+ and Ti were observed in these spectra. The intensities of the atomic lines showed the different evolution in each species with a decrease in the working pressure. The line intensity ratios of the same species were confirmed to be independent of the pressure. A difference spectrum, which was obtained by subtracting the intensity of the OES spectrum at 1.20 Pa from that at 0.86 Pa, is shown in Figure 7 to clarify the spectral behavior. This spectrum indicates that the Ar+ atomic lines were more strongly observed at lower working pressure.
Figure 8 shows the emission intensities normalized with respect to the maximum emission intensity for each species as a function of the gas pressure. The atomic lines used in the plots in Figure 8 are selected emission lines in which the lower-energy levels are the ground state or close to the ground states that correspond to the terminal levels of the transition cascade on account of the tendency to reflect the population closer to that of the ground state [35]. The wavelength resolution of the spectrometer was not sufficiently high in the present experiment. However, we selected the atomic lines for which the lower states are the ground levels for Ti and Ti+ and the lower levels for Ar and Ar+ of low-energy lines, with the help of positive and negative signals in the difference spectrum shown in Figure 7. The atomic lines shown as the peaks marked with an asterisk in Figure 7 are summarized in Table 1 [35].
Figure 8 shows that the intensity of neutral species (Ti and Ar) tended to decrease monotonically with a reduction of the working pressure, whereas that of Ar+ sharply increased and reached a maximum at pressures lower than 1.14 Pa, and then steeply decreased at 0.81 Pa. The intensity of Ti+ ions slightly increased at a pressure lower than 1.14 Pa, began to decrease below 1.04 Pa and then decreased sharply below 0.86 Pa, with a decrease of the working pressure.
The steep increase in the intensity of Ar+ from approximately 1.1 Pa observed as the working pressure decreases is due to the increasing peak power as shown in Figure 5 and the number of pulses in the comb-like current waveform as shown in Figure 3. This is results for the synergistic effect of the increase in the degree of ionization of Ar in the pulse discharge with higher power density equivalent to that of HiPIMS [1] accompanying the formation of comb-like current waveforms at low pressures lower than approximately 1.1Pa and the increase of the number of pulses in comb-like current waveform. In contrast to the Ar+ intensity, it is found that the Ti+ intensity shows a close tendency with the average power density based on a comparison to Figure 5 and Figure 8. The trend of the Ti+ intensity apparently differs from those of neutral-species (Ar and Ti) intensities decreasing monotonically in the working pressure range from 1.14 to 0.86 Pa. This is a result that shows the hump of average power in the range from 1.14 to 0.86 Pa, which is the result of the formation of the comb-like current waveforms, contributes to the generation of sputtered Ti+ as shown by the light blue hatched region in Figure 8. In comparison, the hump of Ar+ intensity shifts to the lower pressure side than those of average peak power and Ti+ intensity, because the ionization degree of Ar correlates with the increase in peak power density.
The generation of Ti+ is deeply related to the formation of Ar+ in the discharge generated by the comb-like current waveform. In detail, this suggests due to the number of pulses in the comb-like current waveform. To elucidate it, we observed the time profiles of the OES intensities to confirm the plasma stage for the comb-like current waveforms. Figure 9 shows temporal profiles of the atomic-line optical emission observed in the OES spectra for MPPMS at pressures (a) higher and (b) lower than 1 Pa, in addition to the current waveforms in MPPMS. The conditions are almost equivalent to those of (a) 1.33 Pa and (b) 0.92 Pa in Figure 3, respectively, although the actual pressures were sensitively dependent on the positions of the cathode magnet and the source geometries. At pressures higher than 1 Pa, the profiles were similar to the current waveform with a rising edge, except for Ar as reported for MPPMS plasma by Papa et al. [13] and for m-HiPIMS plasma by Fekete et al. [20] Excited Ar is an energy source for sputtered particles (Ti+ and Ti) and is the origin of Ar+; therefore, the optical emission decreases with time. On the other hand, for the result at lower than 1 Pa in DOMS-like plasma, the tendencies for the current waveforms of the gas particles (Ar+ and Ar) and the sputtered particles (Ti+ and Ti) with respect to the current waveform are slightly different.
Comparing the peak ratio in the optical-emission profiles with the intensity ratio for pulses in the current waveform, the first peak comparing to the second peak tends to be strong for gas particles (Ar+ and Ar) and weak for sputtered particles (Ti+ and Ti). The reason for this can be explained by the three plasma stages in pulsed dc magnetron sputtering discharge proposed by Musil et al., which are (1) plasma build-up, (2) stationary plasma and (3) decaying plasma [36]. In the pulsed discharge, plasma build-up is Ar discharge as the first pre-sputtering process, and the next steady plasma is the plasma process that involves the sputtering process. In a HiPIMS study using a short pulse of 100 μs, stationary plasma was reported to not be reached within the pulse width of 100 μs [37].
Therefore, the excited gas particle and its ion are predominantly produced to play the role of plasma build-up in the discharge generated by the first pulse [28,38]. The excited Ar produced as a plasma build-up species sharply decreases at the second peak, and the absolute emission intensity for neutral Ar is also much weaker than that for Ar+ in the gas pressure for this OES measurement because the excited (i.e., metastable) Ar is an energy supplying source for the ionization of Ar+ and Ti+, and also for the excitation of Ti. These results for the DOMS-like discharge in Figure 9b suggest that Ar+ is generated in large amounts as a plasma build-up component in the first stage of the plasma process, ahead of other components, and then becomes a stationary-plasma component for the second stage at the second pulse. In addition, another notable feature observed in Figure 9b is that the ion particles (Ar+ and Ti+) show clear deep-oscillating temporal profiles of optical emission intensity corresponding to the current waveform, while the second and subsequent peaks in the temporal profiles of the neutral particles (Ar and Ti) are lack of the peak independency observed for ion particles. In these peaks’ region, the decaying plasma for individual pulsed discharge effectively assists as a pre-ionization, which consists mainly electrons and Ar+, for the next pulsed discharge [38]. This suggests that the plasma and sputtering process in inter-pulse afterglow discharge are as following; the electrons generated in the decaying plasma play a role in the excitation of the neutral particles, so that the peak independence of these temporal profiles is lost; and the non-optically-emitting Ar+ generated in the decaying plasma plays a role in the sputtering of Ti+ in the next pulsed discharge, so that the emission peak intensity of Ar+ rapidly decreases at the second and subsequent peaks.
Reconsidering the tendencies for argon pressure of Figure 6 and Figure 8 from the result of Figure 9, the sputtered particle ion (Ti+) is generated after the time required for plasma build-up depending on the average power density which is closely related to the total power input time rather than the peak power density. The steep decrease of the Ti+ intensity in the pressure region lower than 0.9 Pa is due to insufficient transition time from the plasma build-up process to the sputtering process at these low pressures, for example, the average power density is composed of only one pulse of ca. 10 μs at 0.81 Pa in Figure 4.
Finally, the pulse width (ca. 10 μs) for a single pulse in the comb-like current waveforms is as short as the reported minimum pulse width of a HiPIMS short pulse (5 μs). Therefore, a single pulse is not suitable for film formation using MPPMS because it produces a large amount of Ar+ that contributes to Ar bubbles and produces only a small amount of Ti+ particles. It was concluded that the Ar pressure region in which the generation of Ti+ particles increases with the number of comb-like pulses at Ar pressures of 1.04 Pa or higher is a favorable condition for deposition and coating with MPPMS.

4. Conclusions

The influence of the working Ar pressure on OES was investigated in MPPMS. As the working pressure is reduced, the discharge current waveforms show a comb-like waveform similar to DOMS, and the optical emission intensity for the ionized species (Ti+ and Ar+) in the OES spectra increases according to the number of pulses in the comb-like current waveform. In the case of a comb-like current waveform, the generation of sputtered ion particles is dependent on the average power density, which is related to the number of pulses in the comb-like current waveform, rather than the peak power density.
In this study, it was concluded that evolution from MPPMS plasma to DOMS-like plasma could be observed by changes in the working pressure and an optimal Ar pressure condition for film formation and coating using MPPMS of titanium. We are also currently preparing to report the detailed characteristics of the delayed discharge observed in this MPPMS plasma.

Author Contributions

Conceptualization, M.S.; methodology, M.S.; validation, M.S. and H.N.; formal analysis, M.S. and H.N.; investigation, M.S., H.N., Y.N. and Y.H.; data curation, M.S.; writing—original draft preparation, M.S.; writing—review and editing, M.S., N.N., M.T., N.H, H.Y., K.T., K.O., F.M. and K.F.; supervision, N.N., F.M. and K.F.; funding acquisition, M.S., M.T., N.H., H.Y., K.T., K.O., F.M. and K.F. All authors have read and agreed to the published version of the manuscript.

Funding

This work was supported by New Aichi creative research and development grants 2017 (Grant No. 118-9, Industry and Science Technology Division 29), 2018 (Grant No. 122-10, Industry and Science Technology Division 30) from Aichi prefecture, Japan, Manufacturing enterprise promotion business grants-in-aid of research and development 2019 (Grant No. 65-2) and 2020 (Grant No. 65-1) from Anjo City, Japan and a Grant-in-Aid for Scientific Research from the Japan Society for the Promotion of Science (JSPS) 2021 (Grant No. 21K03503).

Institutional Review Board Statement

Not applicable.

Informed Consent Statement

Not applicable.

Data Availability Statement

The data presented in this study are available on request from the corresponding author.

Acknowledgments

The authors thank Yoshihiko Azuma for assistance in the measurement with the standard light source.

Conflicts of Interest

The authors declare no conflict of interest.

References

  1. Gudmundsson, J.T.; Brenning, N.; Lundin, D.; Helmersson, U. High power impulse magnetron sputtering discharge. J. Vac. Sci. Technol. A 2012, 30, 030801. [Google Scholar] [CrossRef] [Green Version]
  2. Helmersson, U.; Lattemann, M.; Bohlmark, J.; Ehiasarian, A.P.; Gudmundsson, J.T. Ionized physical vapor deposition (IPVD): A review of technology and applications. Thin Solid Films 2006, 513, 1–24. [Google Scholar] [CrossRef] [Green Version]
  3. Anders, A. Tutorial: Reactive high power impulse magnetron sputtering (R-HiPIMS). J. Appl. Phys. 2017, 121, 171101. [Google Scholar] [CrossRef] [Green Version]
  4. Sarakinos, K.; Alami, J.; Konstantinidis, S. High power pulsed magnetron sputtering: A review on scientific and engineering state of the art. Surf. Coat. Technol. 2010, 204, 1661–1684. [Google Scholar] [CrossRef]
  5. Britun, N.; Minea, T.; Konstantinidis, S.; Snyders, R. Plasma diagnostics for understanding the plasma–surface interaction in HiPIMS discharges: A review. J. Phys. D Appl. Phys. 2014, 47, 224001. [Google Scholar] [CrossRef] [Green Version]
  6. Anders, A. A structure zone diagram including plasma-based deposition and ion etching. Thin Solid Films 2010, 518, 4087–4090. [Google Scholar] [CrossRef] [Green Version]
  7. Lattemann, M.; Ehiasarian, A.P.; Bohlmark, J.; Persson, P.Å.O.; Helmersson, U. Investigation of high power impulse magnetron sputtering pretreated interfaces for adhesion enhancement of hard coatings on steel. Surf. Coat. Technol. 2006, 200, 6495–6499. [Google Scholar] [CrossRef] [Green Version]
  8. Shimizu, T.; Teranishi, Y.; Morikawa, K.; Komiya, H.; Watanabe, T.; Nagasawa, N.; Yang, M. Impact of pulse duration in high power impulse magnetron sputtering on the low-temperature growth of wurtzite phase (Ti,Al)N films with high hardness. Thin Solid Films 2015, 581, 39–47. [Google Scholar] [CrossRef]
  9. Lin, J.; Moore, J.J.; Sproul, W.D.; Mishra, B.; Wu, Z. Modulated pulse power sputtered chromium coatings. Thin Solid Films 2009, 518, 1566–1570. [Google Scholar] [CrossRef]
  10. Lin, J.; Moore, J.J.; Sproul, W.; Mishra, B.; Wu, Z.; Wang, J. The structure and properties of chromium nitride coatings deposited using dc, pulsed dc and modulated pulse power magnetron sputtering. Surf. Coat. Technol. 2010, 204, 2230–2239. [Google Scholar] [CrossRef]
  11. Hála, M.; Čapek, J.; Zabeida, O.; Klemberg-Sapieha, J.E.; Martinu, L. Pulse management in high power pulsed magnetron sputtering of niobium. Surf. Coat. Technol. 2012, 206, 4186–4193. [Google Scholar] [CrossRef]
  12. Liebig, B.; Braithwaite, N.S.J.; Kelly, P.J.; Chistyakov, R.; Abraham, B.; Bradley, J.W. Time-resolved plasma characterisation of modulated pulsed power magnetron sputtering of chromium. Surf. Coat. Technol. 2011, 205, S312–S316. [Google Scholar] [CrossRef]
  13. Papa, F.; Gerdes, H.; Bradorf, R.; Ehiasarian, A.P.; Kolev, I.; Braeuer, G.; Tietema, R.; Krug, T. Deposition rate characteristics for steady state high power impulse magnetron sputtering (HIPIMS) discharges generated with a modulated pulsed power (MPP) generator. Thin Solid Films 2011, 520, 1559–1563. [Google Scholar] [CrossRef]
  14. Lin, J.; Wang, B.; Sproul, W.D.; Ou, Y.; Dahan, I. Anatase and rutile TiO2 films deposited by arc-free deep oscillation magnetron sputtering. J. Phys. D: Appl. Phys. 2013, 46, 084008. [Google Scholar] [CrossRef]
  15. Lin, J.; Sproul, W.D. Structure and properties of Cr2O3 coatings deposited using DCMS, PDCMS, and DOMS. Surf. Coat. Technol. 2015, 276, 70–76. [Google Scholar] [CrossRef]
  16. Ou, Y.X.; Lin, J.; Tong, S.; Che, H.L.; Sproul, W.D.; Lei, M.K. Wear and corrosion resistance of CrN/TiN superlattice coatings deposited by a combined deep oscillation magnetron sputtering and pulsed dc magnetron sputtering. Appl. Surf. Sci. 2015, 351, 332–343. [Google Scholar] [CrossRef]
  17. Ferreira, F.; Oliveira, J.C.; Cavaleiro, A. CrN thin films deposited by HiPIMS in DOMS mode. Surf. Coat. Technol. 2016, 291, 365–375. [Google Scholar] [CrossRef]
  18. Oliveira, J.C.; Fernandes, F.; Serra, R.; Cavaleiro, A. On the role of the energetic species in TiN thin film growth by reactive deep oscillation magnetron sputtering in Ar/N2. Thin Solid Films 2018, 645, 253–264. [Google Scholar] [CrossRef]
  19. Tiron, V.; Velicu, I.L.; Dobromir, M.; Demeter, A.; Samoila, F.; Ursu, C.; Sirghi, L. Reactive multi-pulse HiPIMS deposition of oxygen-deficient TiOx thin films. Thin Solid Films 2016, 603, 255–261. [Google Scholar] [CrossRef]
  20. Fekete, M.; Hnilica, J.; Vitelaru, C.; Minea, T.; Vašina, P. Ti atom and Ti ion number density evolution in standard and multi-pulse HiPIMS. J. Phys. D Appl. Phys. 2017, 50, 365202. [Google Scholar] [CrossRef]
  21. Tiron, V.; Velicu, I.-L.; Mihǎilǎ, I.; Popa, G. Deposition rate enhancement in HiPIMS through the control of magnetic field and pulse configuration. Surf. Coat. Technol. 2018, 337, 484–491. [Google Scholar] [CrossRef]
  22. Oskirko, V.O.; Zakharov, A.N.; Pavlov, A.P.; Grenadyorov, A.S.; Semenov, V.A. Unipolar and bipolar mode of deep oscillation magnetron sputtering. J. Phys.:Conf. Ser. 2019, 1393, 012051. [Google Scholar] [CrossRef]
  23. Oskirko, V.O.; Zakharov, A.N.; Pavlov, A.P.; Solovyev, A.A.; Grenadyorov, A.S.; Semenov, V.A. Dual mode of deep oscillation magnetron sputtering. Surf. Coat. Technol. 2020, 387, 125559. [Google Scholar] [CrossRef]
  24. Bean, J.C.; Becker, G.E.; Petroff, P.M.; Seidel, T.E. Dependence of residual damage on temperature during Ar+ sputter cleaning of silicon. J. Appl. Phys. 1977, 48, 907–913. [Google Scholar] [CrossRef]
  25. Ehiasarian, P.; Wen, J.G.; Petrov, I. Interface microstructure engineering by high power impulse magnetron sputtering for the enhancement of adhesion. J. Appl. Phys. 2007, 101, 054301. [Google Scholar] [CrossRef]
  26. Rossnagel, S.M.; Hopwood, J.J. Phase transformation of thin sputter-deposited tungsten films at room temperature. Vac. Sci. Technol. B 1994, 12, 449–453. [Google Scholar] [CrossRef]
  27. Antonin, O.; Tiron, V.; Costin, C.; Popa, G.; Minea, T.M. On the HiPIMS benefits of multi-pulse operating mode. J. Phys. D Appl. Phys. 2015, 48, 015202. [Google Scholar] [CrossRef]
  28. Sanekata, M.; Nishida, H.; Watabe, T.; Nakagomi, Y.; Hirai, Y.; Nishimiya, N.; Tona, M.; Yamamoto, H.; Hirata, N.; Tsukamoto, K.; et al. Delayed Discharge bridging two sputtering modes from modulated pulsed power magnetron sputtering (MPPMS) to deep oscillation magnetron sputtering (DOMS). Plasma 2021, 4, 16. [Google Scholar] [CrossRef]
  29. Hála, M.; Čapek, J.; Zabeida, O.; Klemberg-Sapieha, J.E.; Martinu, L. Hysteresis-free deposition of niobium oxide films by HiPIMS using different pulse management strategies. J. Phys. D Appl. Phys. 2012, 45, 055204. [Google Scholar] [CrossRef]
  30. Britun, N.; Konstantinidis, S.; Belosludtsev, A.; Silva, T.; Snyders, R. Quantification of the hysteresis and related phenomena in reactive HiPIMS discharges. J. Appl. Phys. 2017, 121, 171905. [Google Scholar] [CrossRef]
  31. Tsukamoto, K.; Tamura, T.; Matsusaki, H.; Tona, M.; Yamamoto, H.; Nakagomi, Y.; Nishida, H.; Hirai, Y.; Nishimiya, N.; Sanekata, M.; et al. Time-of-flight mass spectrometric diagnostics for ionized and neutral species in high-power pulsed magnetron sputtering of titanium. Jpn. J. Appl. Phys. 2020, 59, SHHB05. [Google Scholar] [CrossRef]
  32. Raizer, Y.P. Gas Discharge Physics; Allen, J.E., Ed.; Springer: New York, NY, USA, 1991; pp. 52–137. [Google Scholar]
  33. Yushkov, G.Y.; Anders, A. Origin of the delayed current onset in high-power impulse magnetron sputtering. IEEE Trans. Plasma Sci. 2010, 38, 3028–3034. [Google Scholar] [CrossRef] [Green Version]
  34. Lin, J.; Moore, J.J.; Sproul, W.D.; Mishra, B.; Rees, J.A.; Wu, Z.; Chistyakov, R.; Abraham, B. Ion energy and mass distributions of the plasma during modulated pulse power magnetron sputtering. Surf. Coat. Technol. 2009, 203, 3676–3685. [Google Scholar] [CrossRef]
  35. Kramida, K.; Ralchenko, Y.; Reader, J.; NIST ASD Team. NIST Atomic Spectra Database (Ver. 5.6.1); National Institute of Standards and Technology: Gaithersburg, MD, USA, 2018. Available online: https://physics.nist.gov/asd (accessed on 11 April 2019).
  36. Musil, J.; Leština, J.; Vlček, J.; Tölg, T. Pulsed dc magnetron discharge for high-rate sputtering of thin films. J. Vac. Sci. Technol. A 2001, 19, 420–424. [Google Scholar] [CrossRef]
  37. Gudmundsson, J.T.; Alami, J.; Helmersson, U. Spatial and temporal behavior of the plasma parameters in a pulsed magnetron discharge. Surf. Coat. Technol. 2002, 161, 249–256. [Google Scholar] [CrossRef]
  38. Vašina, P.; Meško, M.; Imbert, J.C.; Ganciu, M.; Boisse-Laporte, C.; de Poucques, L.; Touzeau, M.; Pagnon, D.; Bretagne, J. Experimental study of a pre-ionized high power pulsed magnetron discharge. Plasma Sources Sci. Technol. 2007, 16, 501–510. [Google Scholar] [CrossRef]
Figure 1. Schematic diagram of the experimental setup for OES measurement during MPPMS.
Plasma 04 00018 g001
Figure 2. A micro-pulse train waveform (red line) and a sync macro pulse waveform (gray line) from the high-power pulse generator controlled by the MPP system. The rising edge of the sync macro pulse is 0 s of time.
Plasma 04 00018 g002
Figure 3. Discharge current waveforms (blue lines) in MPPMS for working pressures in the range of 0.81–1.60 Pa. The minor tick interval of the current axis is 40 A/div. The black dotted line represents the cut-off time of the edge in a sync macro-pulse waveform output from the high-power pulsed generator controlled by an MPP system.
Plasma 04 00018 g003
Figure 4. Discharge voltage waveforms (red lines) in MPPMS for working pressures in the range of 0.81–1.60 Pa. The minor tick interval of the voltage axis is −175 V/div. The black dotted line represents the cut-off time of the edge in a sync macro-pulse waveform output from the high-power pulsed generator controlled by an MPP system. The black short lines on the discharge voltage waveforms indicate the measured breakdown voltages as a function of argon pressure, which are described in previous paper in detail [28].
Plasma 04 00018 g004
Figure 5. Average power density (blue filled circles), peak power density (red filled circles) and peak current (green filled circles) in MPPMS for working pressures in the range of 0.81–1.60 Pa.
Plasma 04 00018 g005
Figure 6. OES spectra for plasma generated in MPPMS for working pressures in the range of 0.81–1.60 Pa.
Plasma 04 00018 g006
Figure 7. Difference spectrum where the sensitivity-corrected intensity of the OES spectrum for 1.20 Pa is subtracted from that for 0.86 Pa, as shown in Figure 6. The peaks marked with an asterisk correspond to the atomic lines of the optically emitting species listed in Table 1.
Plasma 04 00018 g007
Figure 8. The normalized optical emission intensities for optically-emitting species observed in the optical emission spectra in MPPMS for the working pressure in the range of 0.81–1.60 Pa. The emission intensities are normalized by the maximum emission intensity for atomic line of each optically emitting species which is listed in Table 1. The red, orange, blue and green filled circles correspond to the normalized intensities for Ar+, Ar, Ti+ and Ti, respectively. Light blue hatched region indicates emission intensity that are expected to increase with comb-like current discharge.
Plasma 04 00018 g008
Figure 9. Temporal profiles of optical emission intensity for atomic lines observed in the OES spectra and current waveforms for MPPMS at pressures (a) higher and (b) lower than 1 Pa. The red and blue lines correspond to the results with the former and latter pressures, respectively. The currents and emission intensities are normalized with respect to each maximum value. The optical emission intensity for each optically emitting species was measured for the atomic lines listed in Table 1. The black dotted lines correspond to the cut-off time of the synchronous pulse.
Plasma 04 00018 g009
Table 1. Summary of Ar+, Ar, Ti+ and Ti atomic lines, as indicated by asterisks in Figure 7. The atomic data are taken from the National Institute of Standards and Technology (NIST) spectral database [35].
Atomic
-Line
Wavelength
(nm)
Nature of Lower Level
(Energy from Ground
Level in cm−1)
Spectral Transition
(Upper Level → Lower Level)
434-Ar+434.80Metastable
(134,241.7)
47/2 (3s23p44p) → 4P5/2 (3s23p44s)
763-Ar763.51Metastable
(93,143.7)
2[3/2]2 (3s23p54p) → 2[3/2] °2 (3s23p54s)
334-Ti+334.94Ground
(393.4)
z411/2 (3d24p) → a4F9/2 (3d24s)
503-Ti503.99Ground
(170.1)
z32 (3d24s4p) → a3F3 (3d24s2)
Publisher’s Note: MDPI stays neutral with regard to jurisdictional claims in published maps and institutional affiliations.

