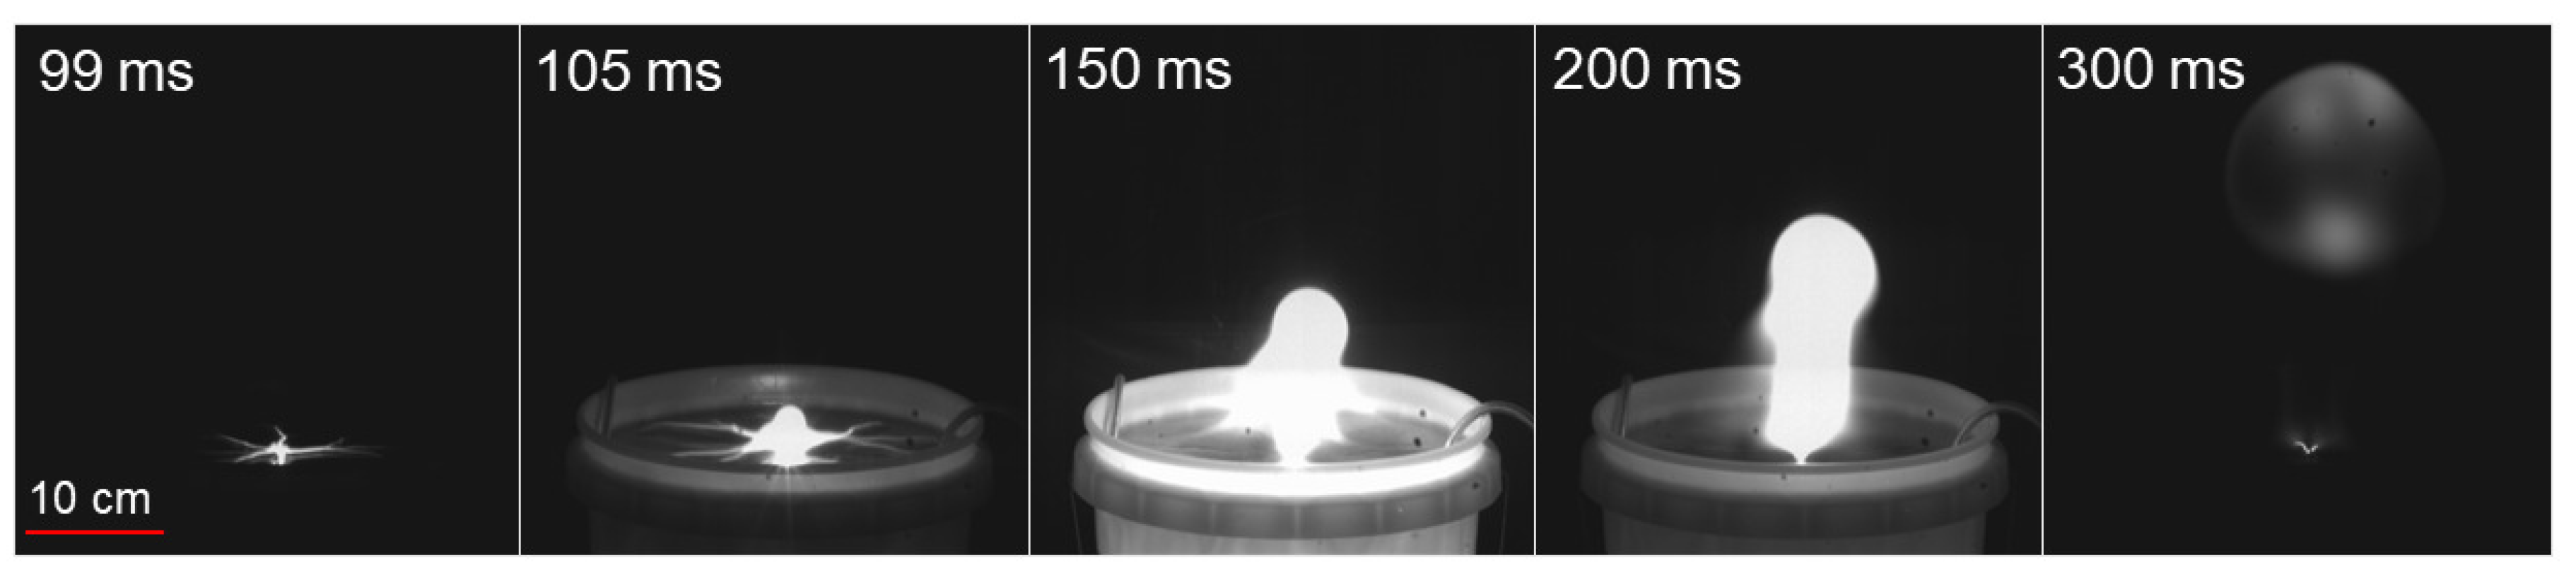
Figure 2 shows a series of images collected from a 7000 V ball plasmoid discharge with the Phantom v5.2 camera. The video from which these images were taken can be found in the
Supplemental Materials. A scale bar is included, and the times provided in the images indicate the time after the discharge is initiated. These images also demonstrate various phases of the discharge as previously described by [
9,
12]. Towards the end of the discharge (∼300 ms), it appears as though an autonomous plasmoid exists without power input from the electrode. The images contained in
Figure 2 are similar to results that we have reported previously [
10,
11].
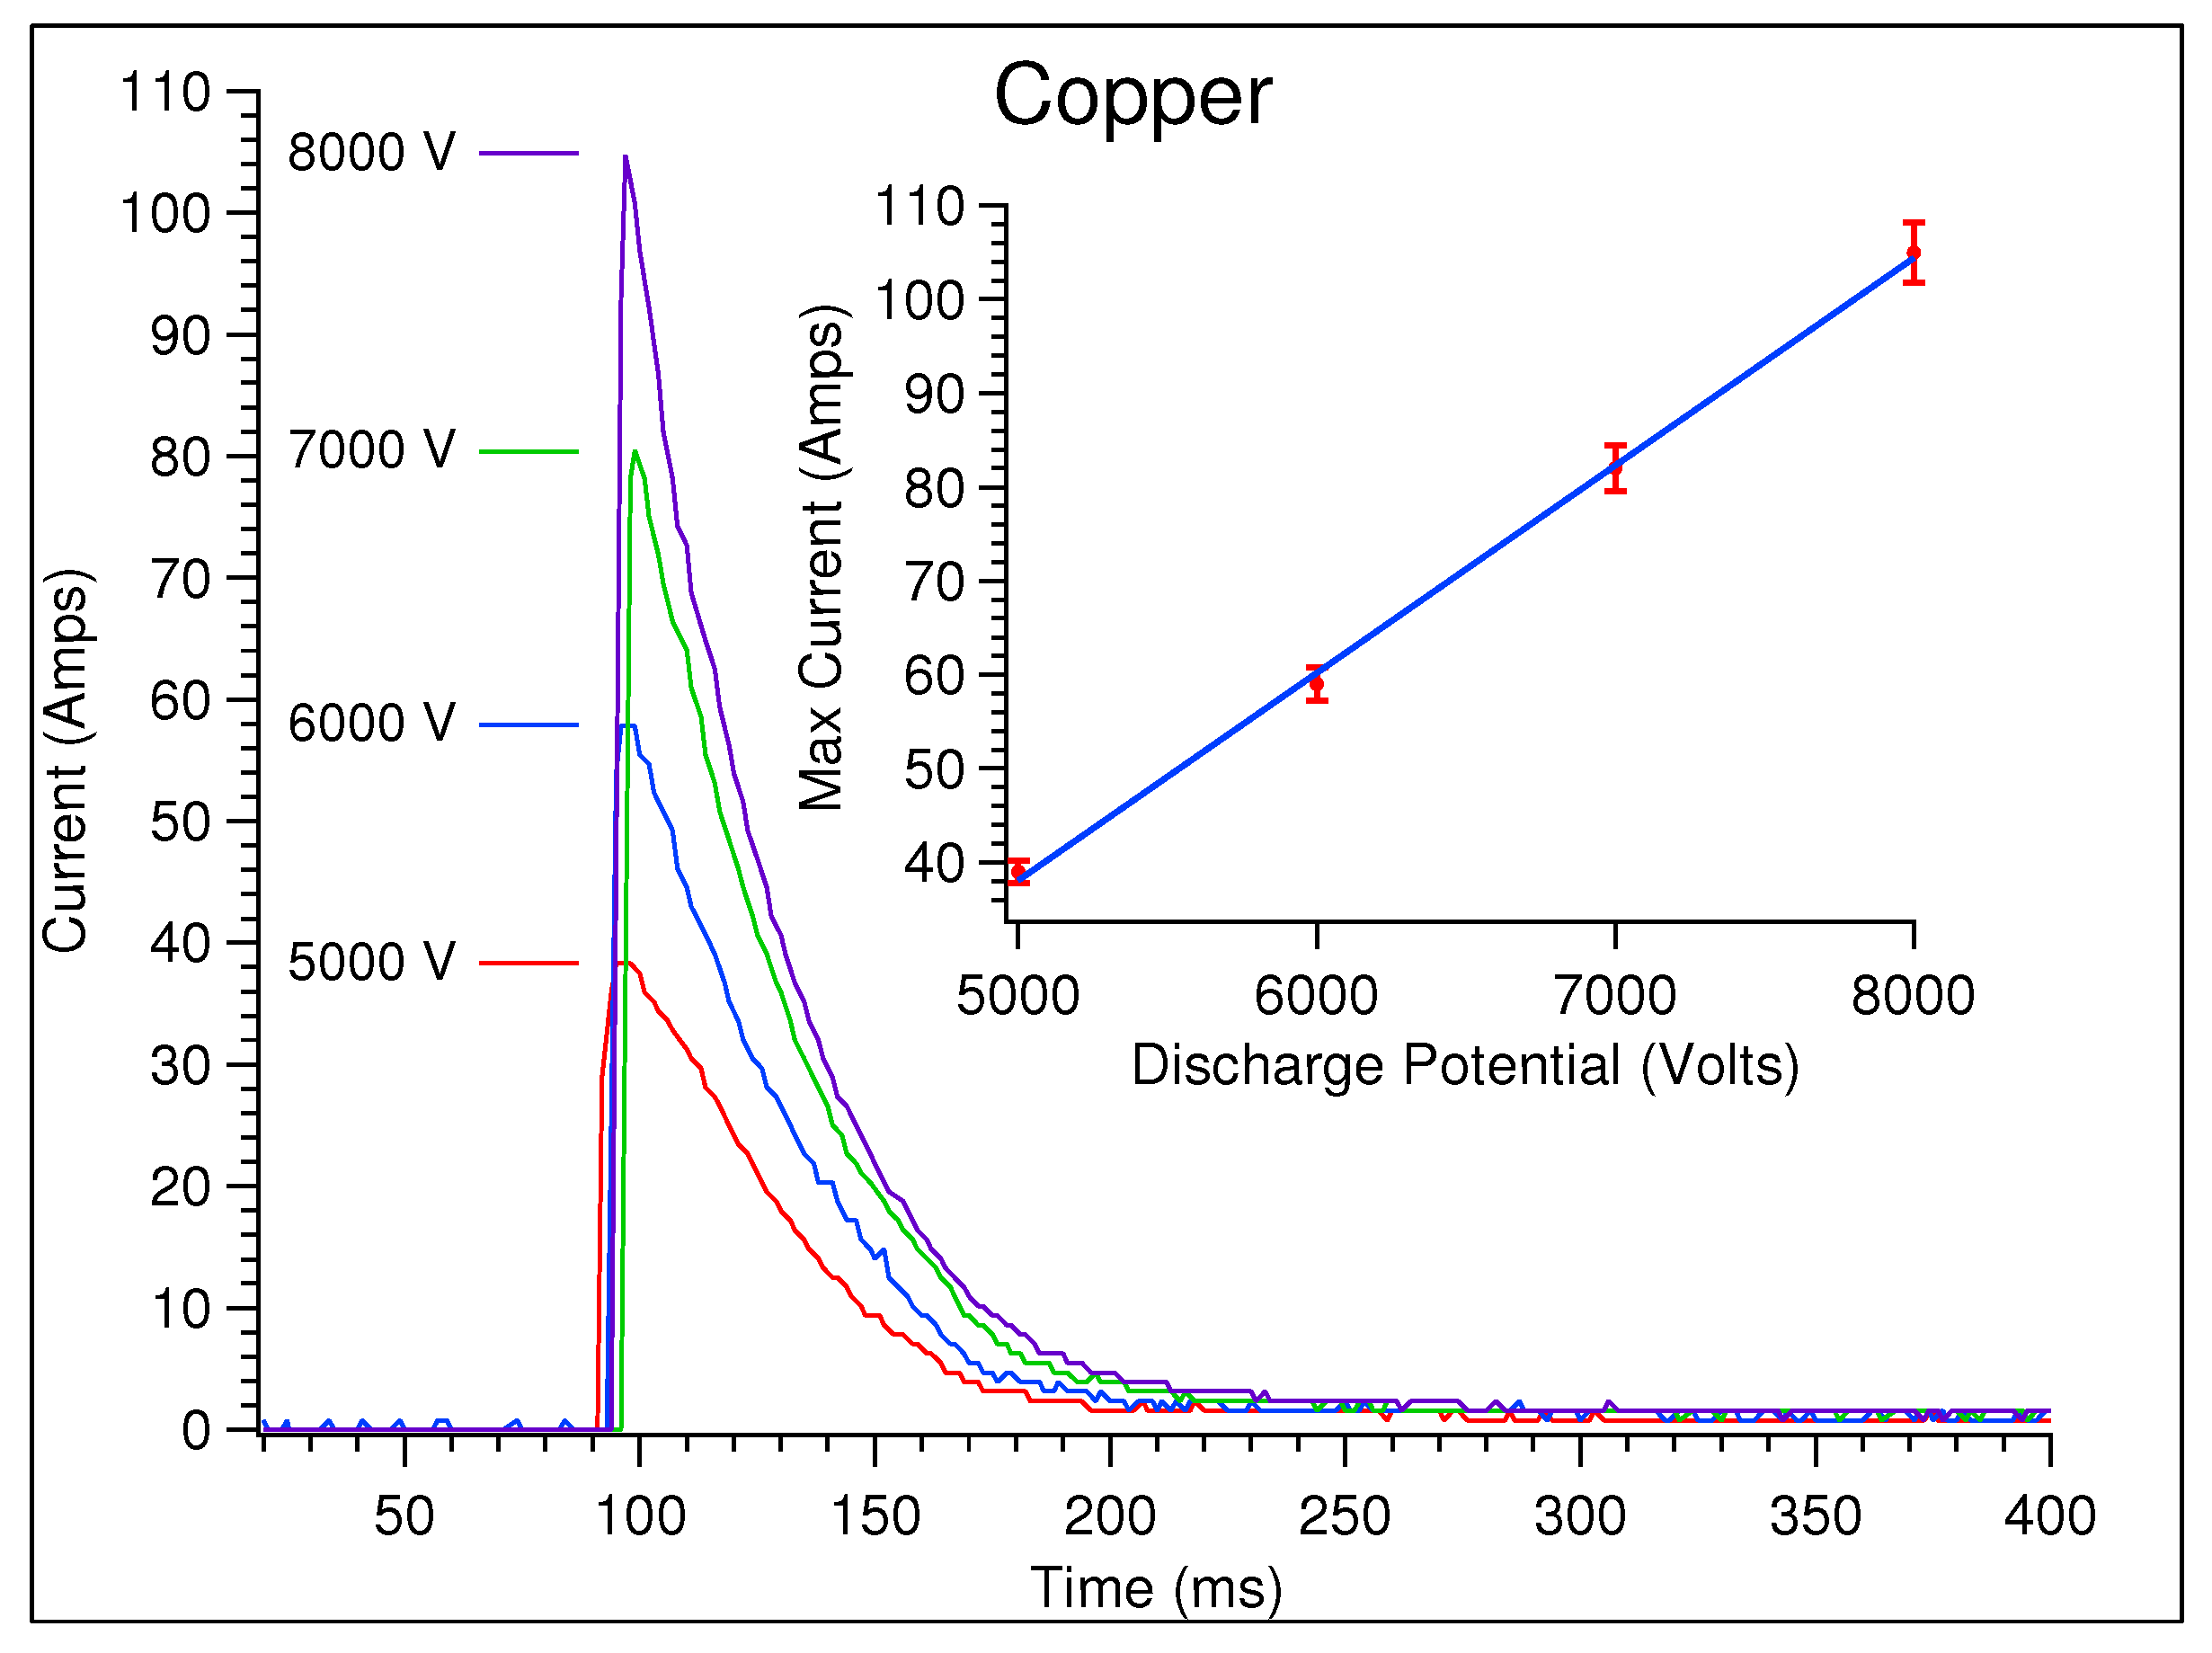
3.1. Current
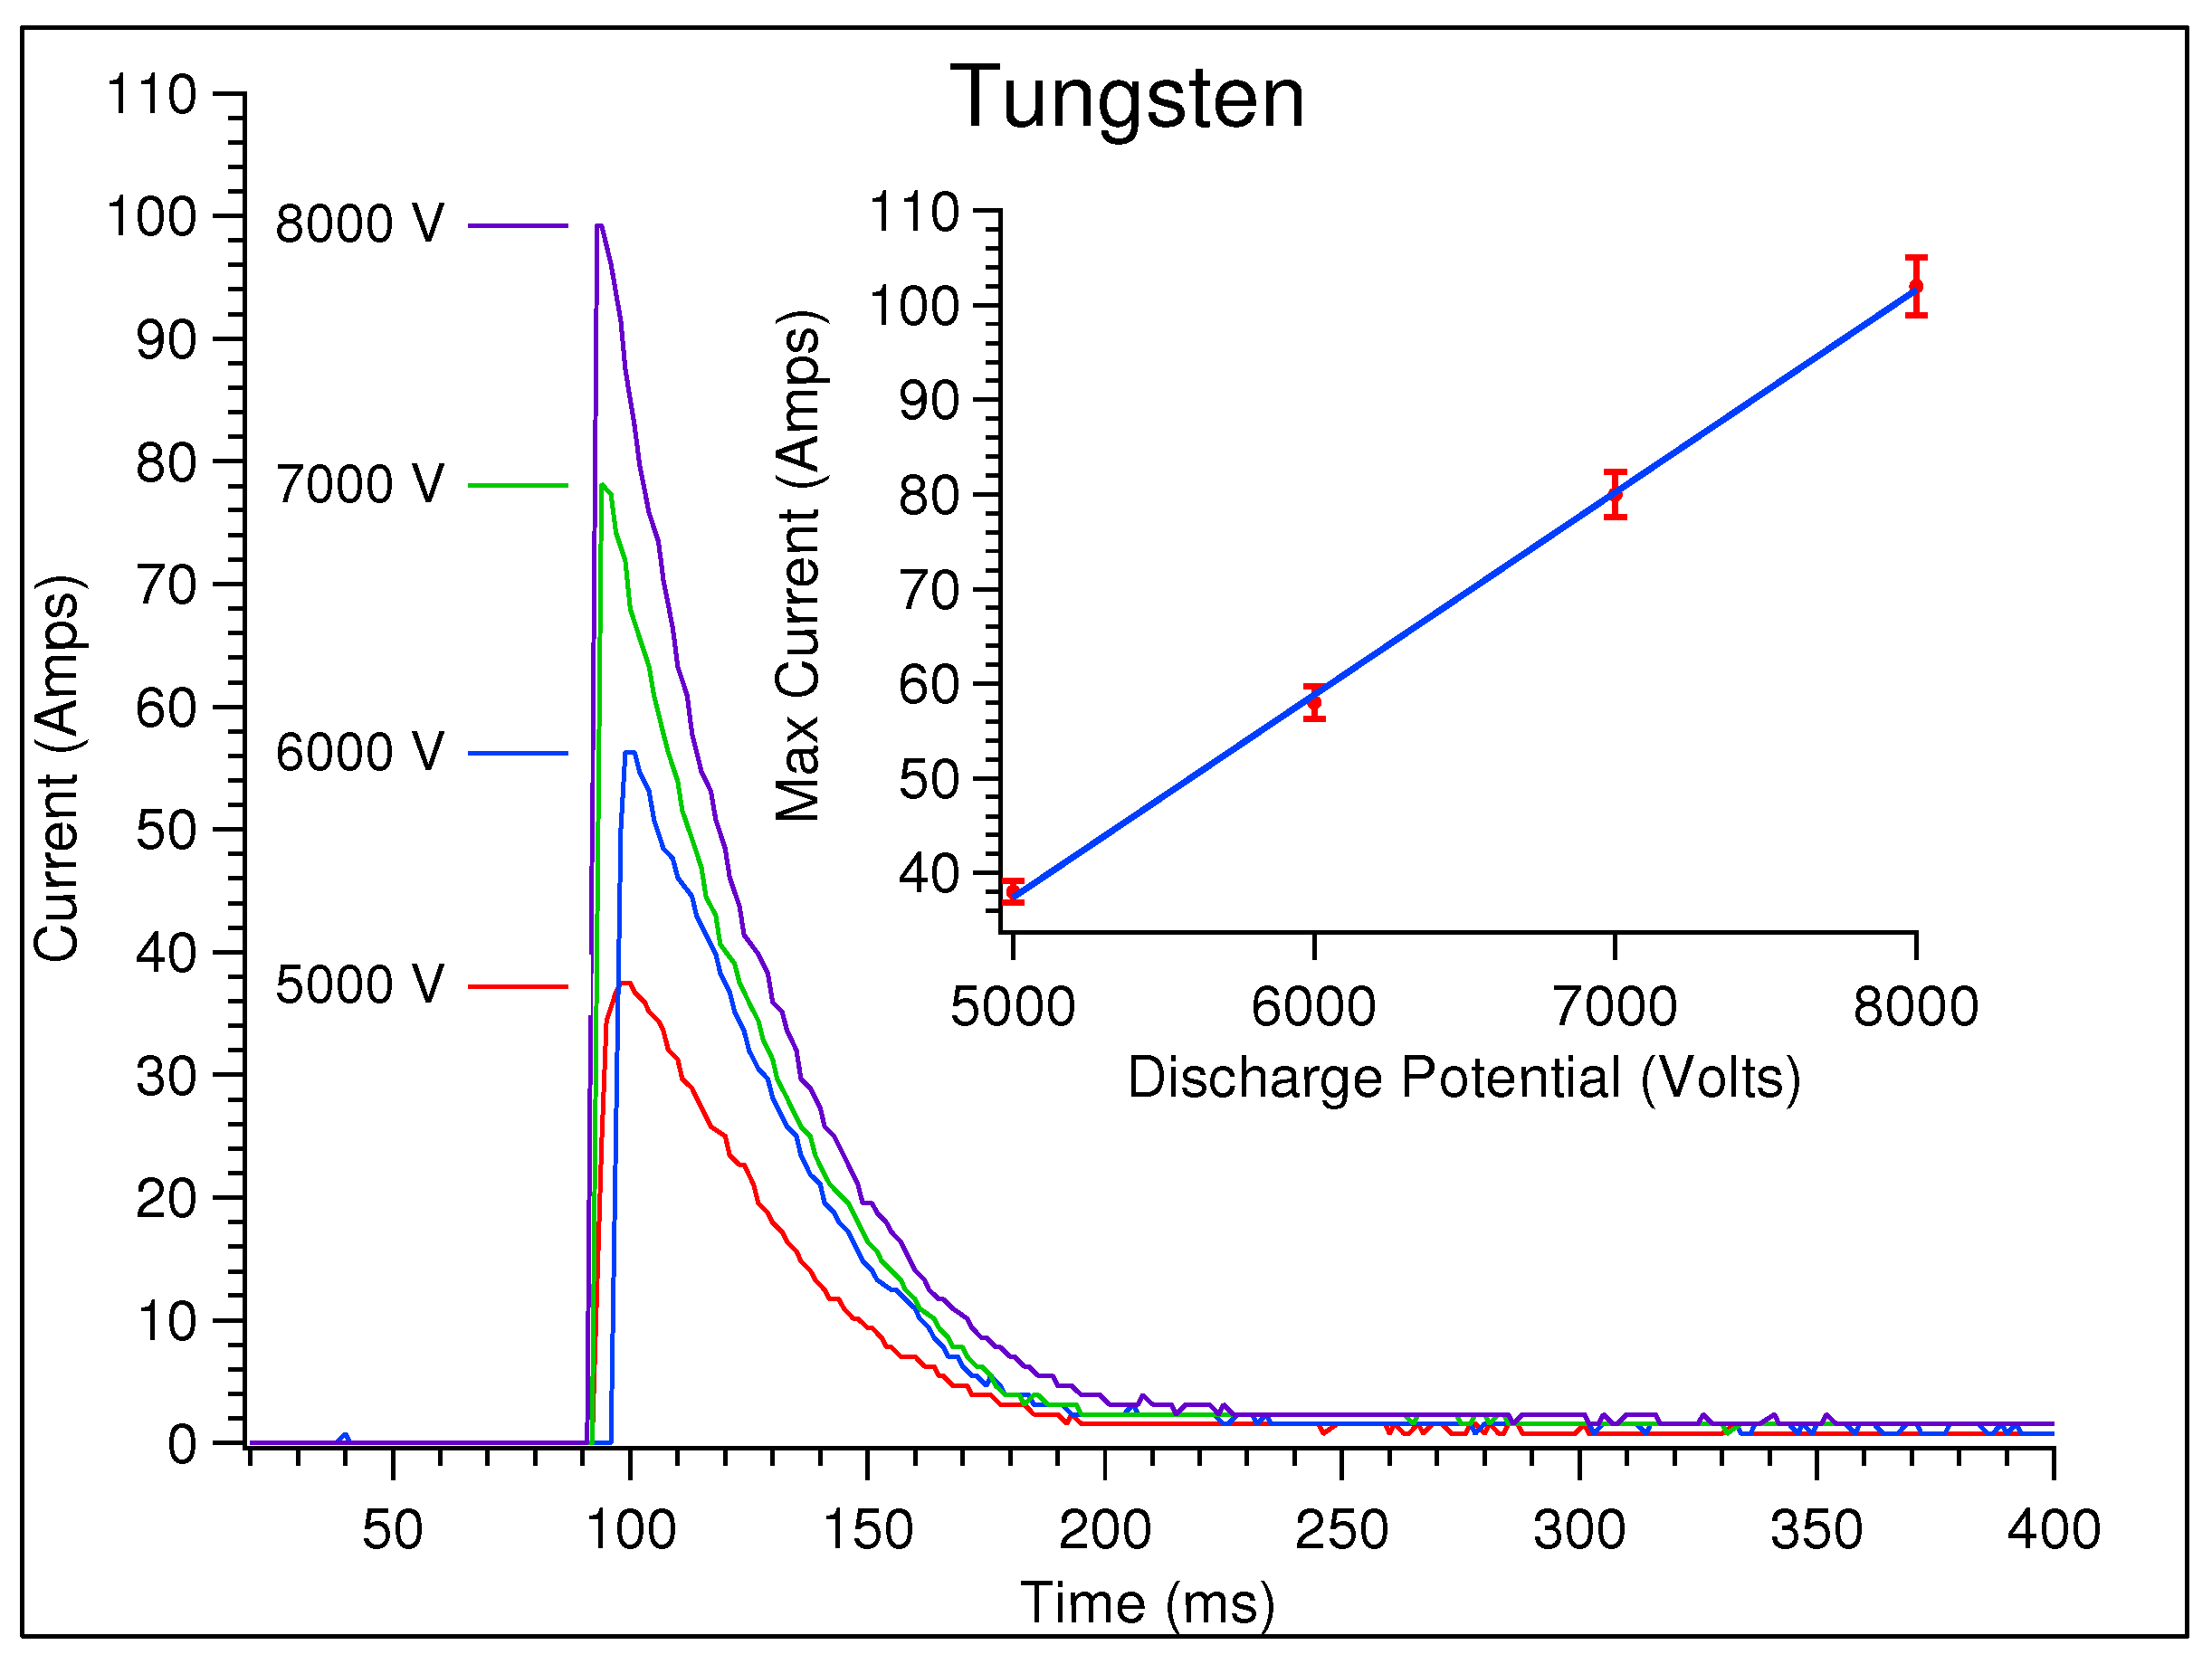
Figure 3 and
Figure 4 are current traces collected at different discharge potentials for copper and tungsten anodes, respectively. The current profiles shown here resemble those recorded from impulse discharges, and are similar to those reported by other groups with similar discharge circuitry [
7,
8,
9,
12]. However, as stated in the Introduction, these discharges were generated with the electrode polarity reversed. The “FIRE” switch (see
Figure 1) closes at 50 ms, and the first visible emission at the anode occurs at approximately 100 ms, after which a plasma begins to develop. Streamers (arcs) form and significant current begins to flow, reaching a maximum after a few ms. At this point, the discharge current and potential of the capacitor bank begin to decrease exponentially as the plasma grows in size and eventually detaches from the electrodes.
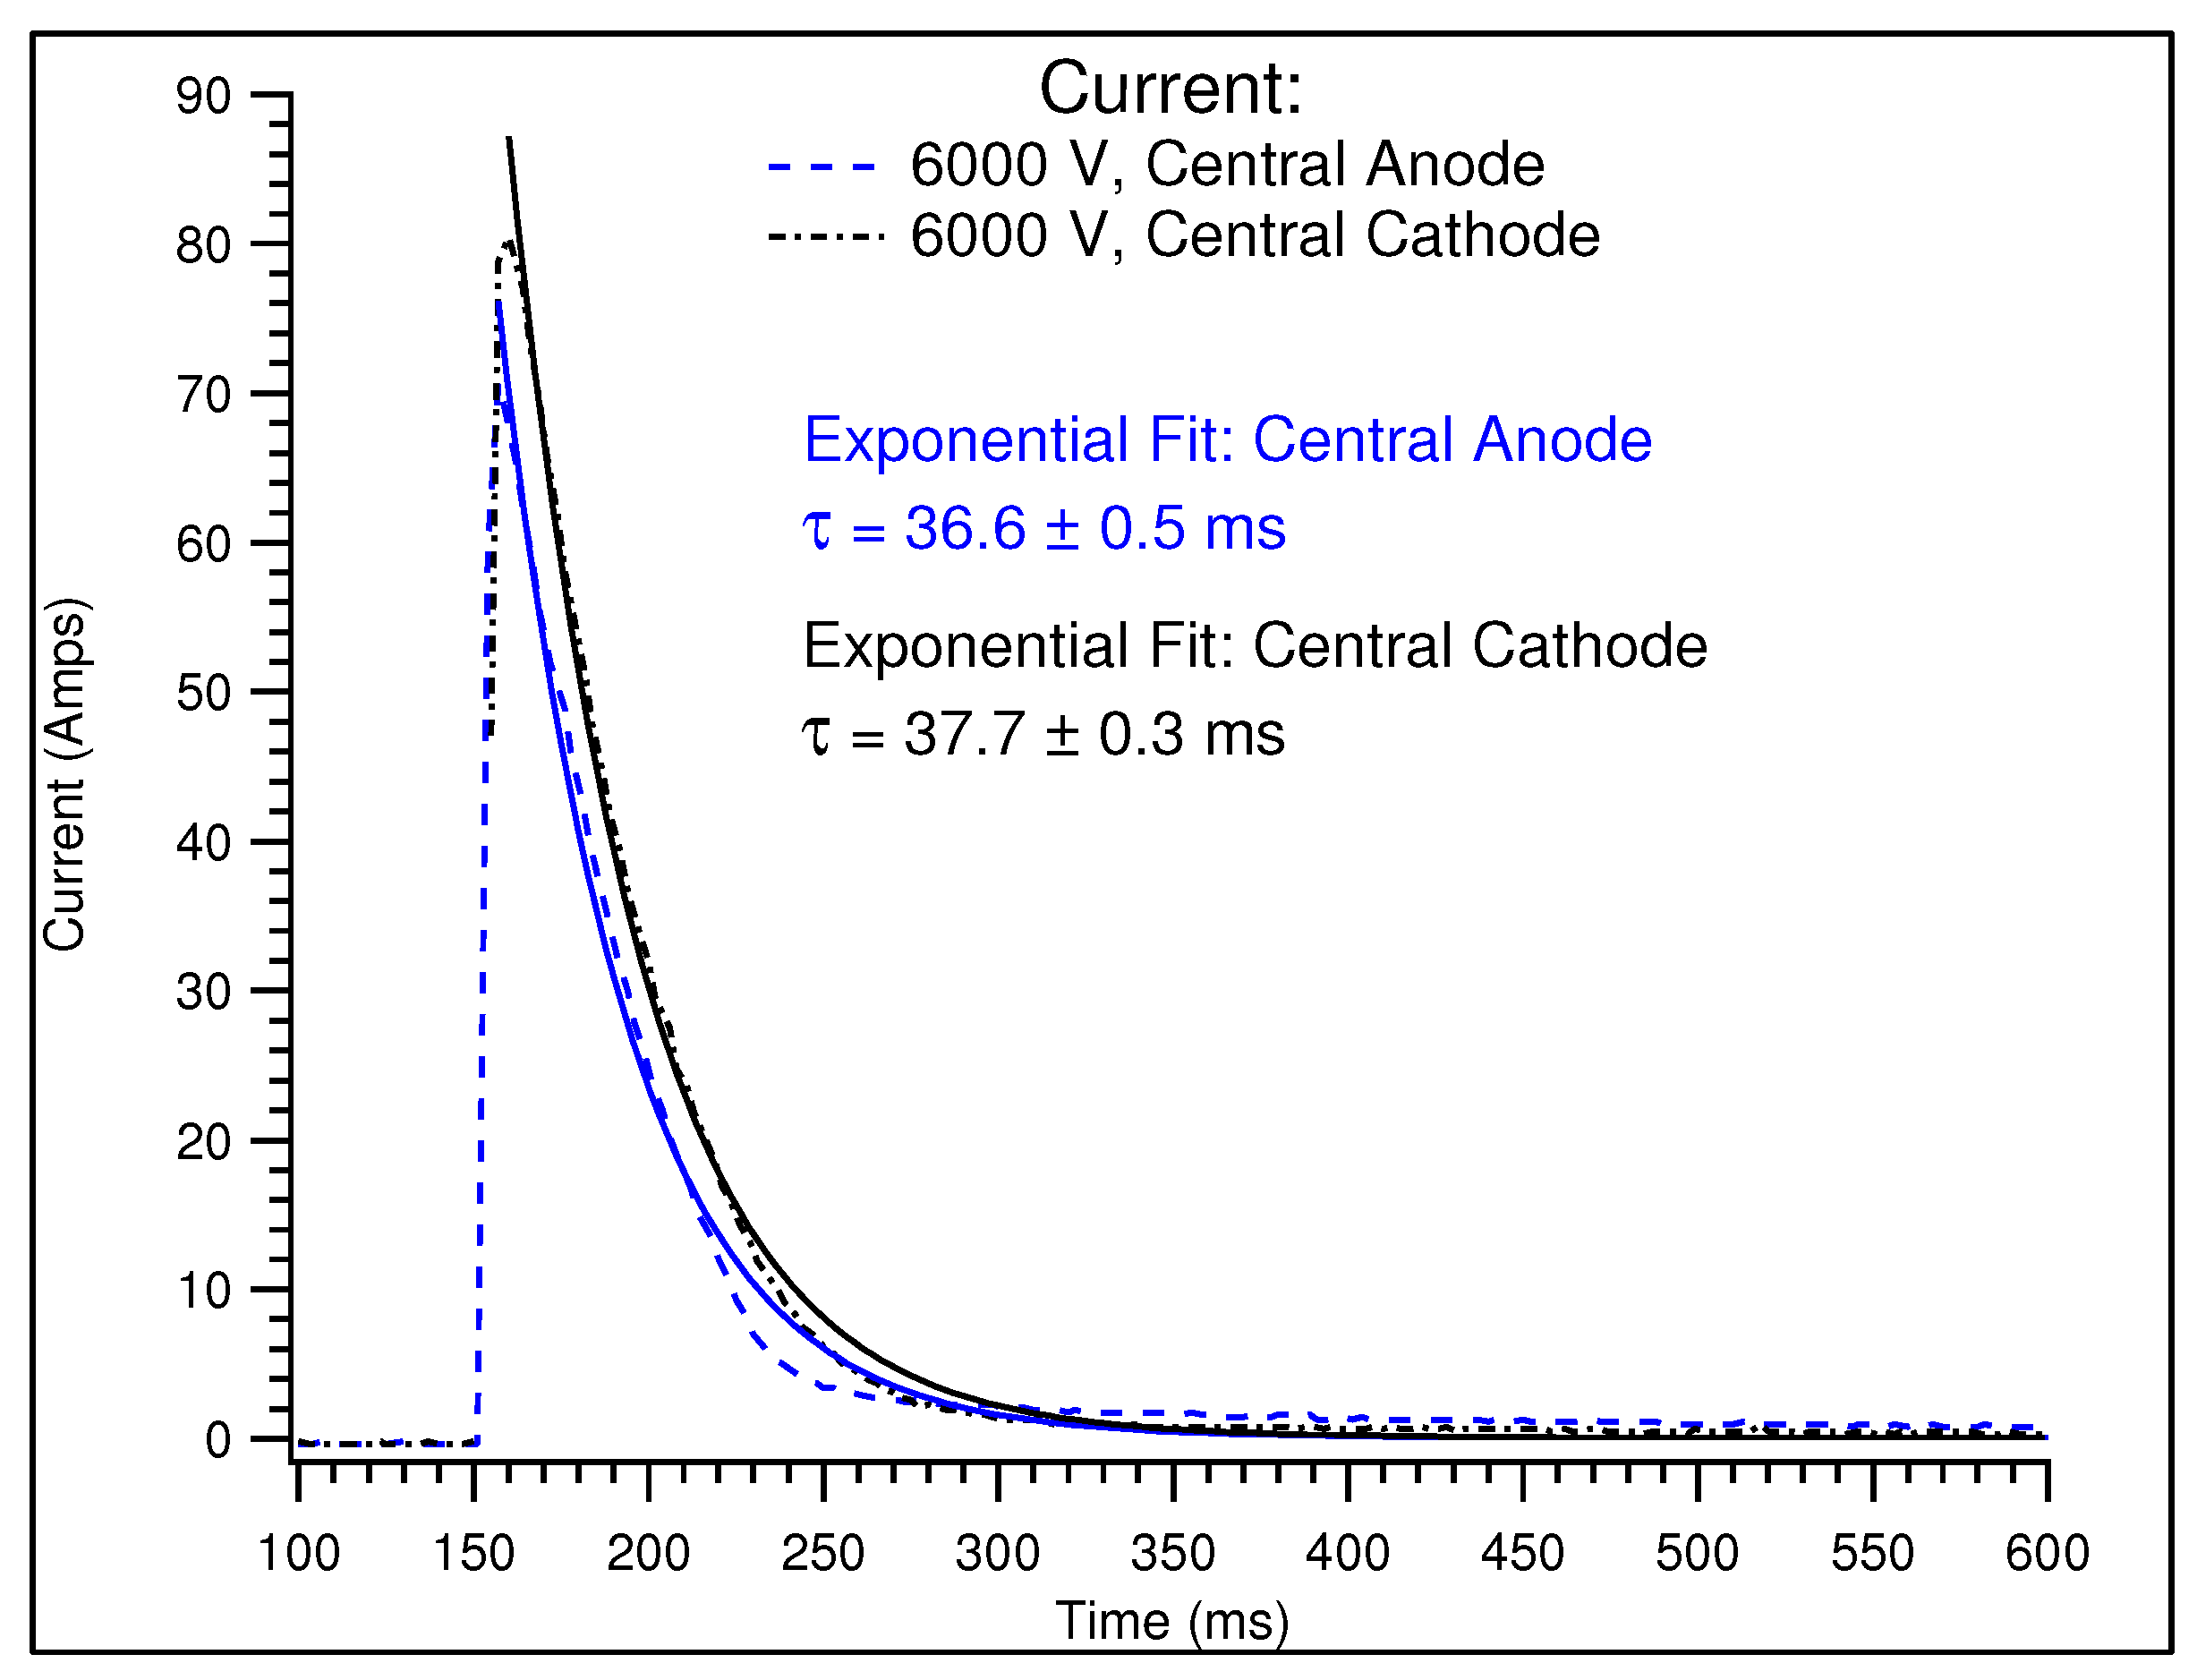
Current traces were also recorded from ball plasmoid discharges with the opposite electrode polarity, i.e., with the central electrode as the cathode.
Figure 5 shows overlayed current traces collected from 6000 V ball plasmoid discharges at both electrode polarities and the numerical results of exponential fits to those data. It is apparent that the overall shape of the current profiles are similar between the two data sets; however, the maximum current reached with the central electrode as the cathode is significantly larger (approx. 10 Amps). Furthermore, it appears as though the current is slightly larger for a slightly longer period of time (in other words, the “width” of the current pulse is slightly larger) when the central electrode is the cathode. Exponential fits to the current traces were also performed on data collected from the opposite electrode polarity. The values of
extracted from these fits are very similar to one another, which suggests that changing the electrode polarity does not significantly affect the behavior of the current during the discharge.
The current waveforms can be fit to an exponential, and do not vary significantly with discharge potential or electrode material. The maximum current increases linearly with the capacitor potential (
Figure 3 and
Figure 4). The maximum currents recorded for different electrode materials are also not significantly different. These two electrode materials appear to have only a slight influence on the electrical properties of ball plasmoid discharges, at least under these experimental conditions. It would be valuable in future studies to examine the effects of other electrode materials, e.g., platinum, stainless steel, aluminum, etc. on the electrical properties of ball plasmoid discharges.
It is apparent that current still flows late in the discharge in some cases. This current flow between the anode and the electrolyte results from spark channel formation and is discussed in more depth in the following sections. The 10-bit resolution of the A/D converter used in the microcontroller (4.9 mV per bit) combined with the properties of the Hall effect sensors gives uncertainties of ±0.8 A for high-current discharges (75 A and above) and ±0.3 A for moderate-current discharges (<75 A). It is also important to note that when performing discharges between 5000 and 8000 V (and at a sampling rate of 1 kHz) the current waveform reaches its maximum in a single time step. Therefore, at these potentials, only the decay of the potential and voltage are used to calculate the resistance and power (see below).
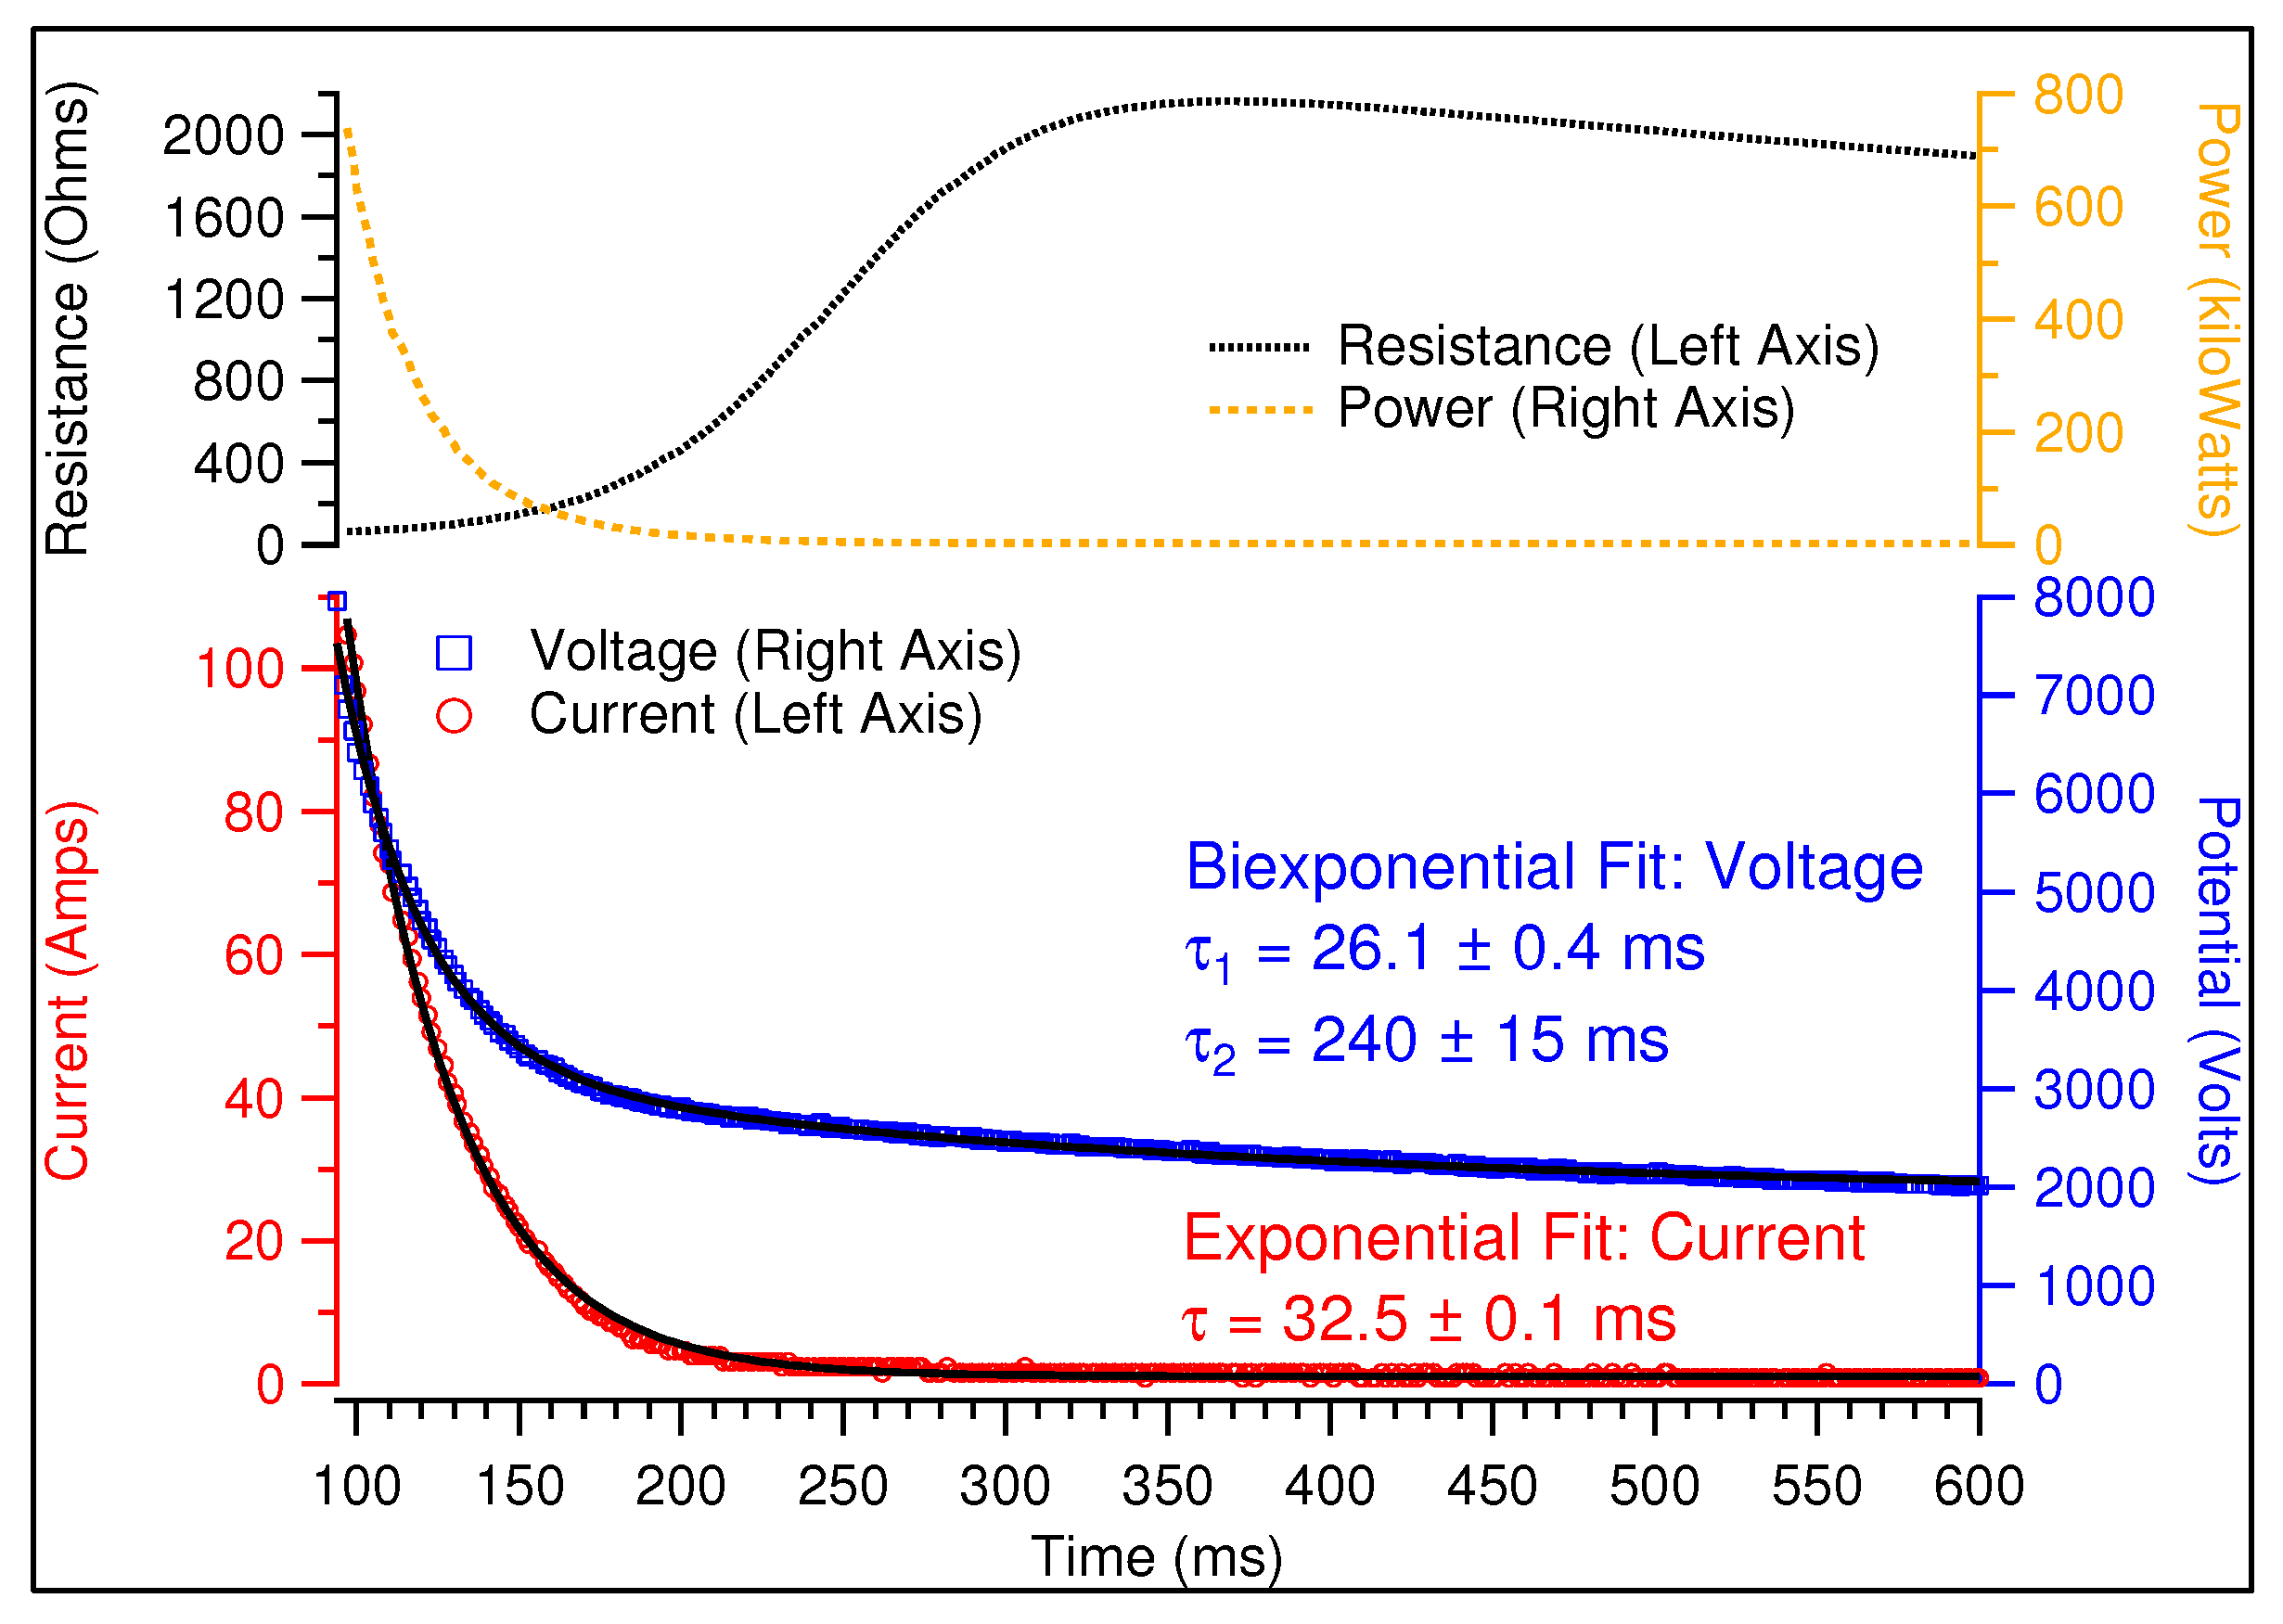
3.2. Voltage
Voltage profiles were fit to a biexponential: this indicates that a fast time constant
governs the voltage at early times, while a larger constant
is dominant at longer times. These two time constants are interpreted to describe two physical processes that are initiated at the beginning and continue throughout the lifetime of the discharge (under certain conditions). These processes are discussed further below.
Figure 6 provides an example analysis of the electrical characteristics of a ball plasmoid discharge (8000 V in this case). Resistance and power were calculated from experimental data according to Ohm’s Law and the power relation (
).
The fast constant governs the first portion of the discharge during which there is significant current flow, streamer development, and jet production at the tip of the anode. The effect from is always present, but becomes much more significant after the current and voltage have decreased substantially. At this point, a jet is no longer observed at the anode, but there is still an electrical connection between the anode and the electrolyte, and a small amount of current continues to flow. This connection is established at the start of the discharge via spark channels and is a result of the close proximity of the anode to the electrolyte. Indeed, positioning the anode below the surface of the insulator increases the length of the air gap between the anode and the electrolyte and does not facilitate spark channel (or plasmoid) formation. This observation (of the persistent spark channel connection) indicates that it is not feasible to use the electrical profiles reported here to determine the point in time at which the plasmoid becomes detached from the electrodes. However, this limitation only applies to the electrode geometry and circuit used in our laboratory.
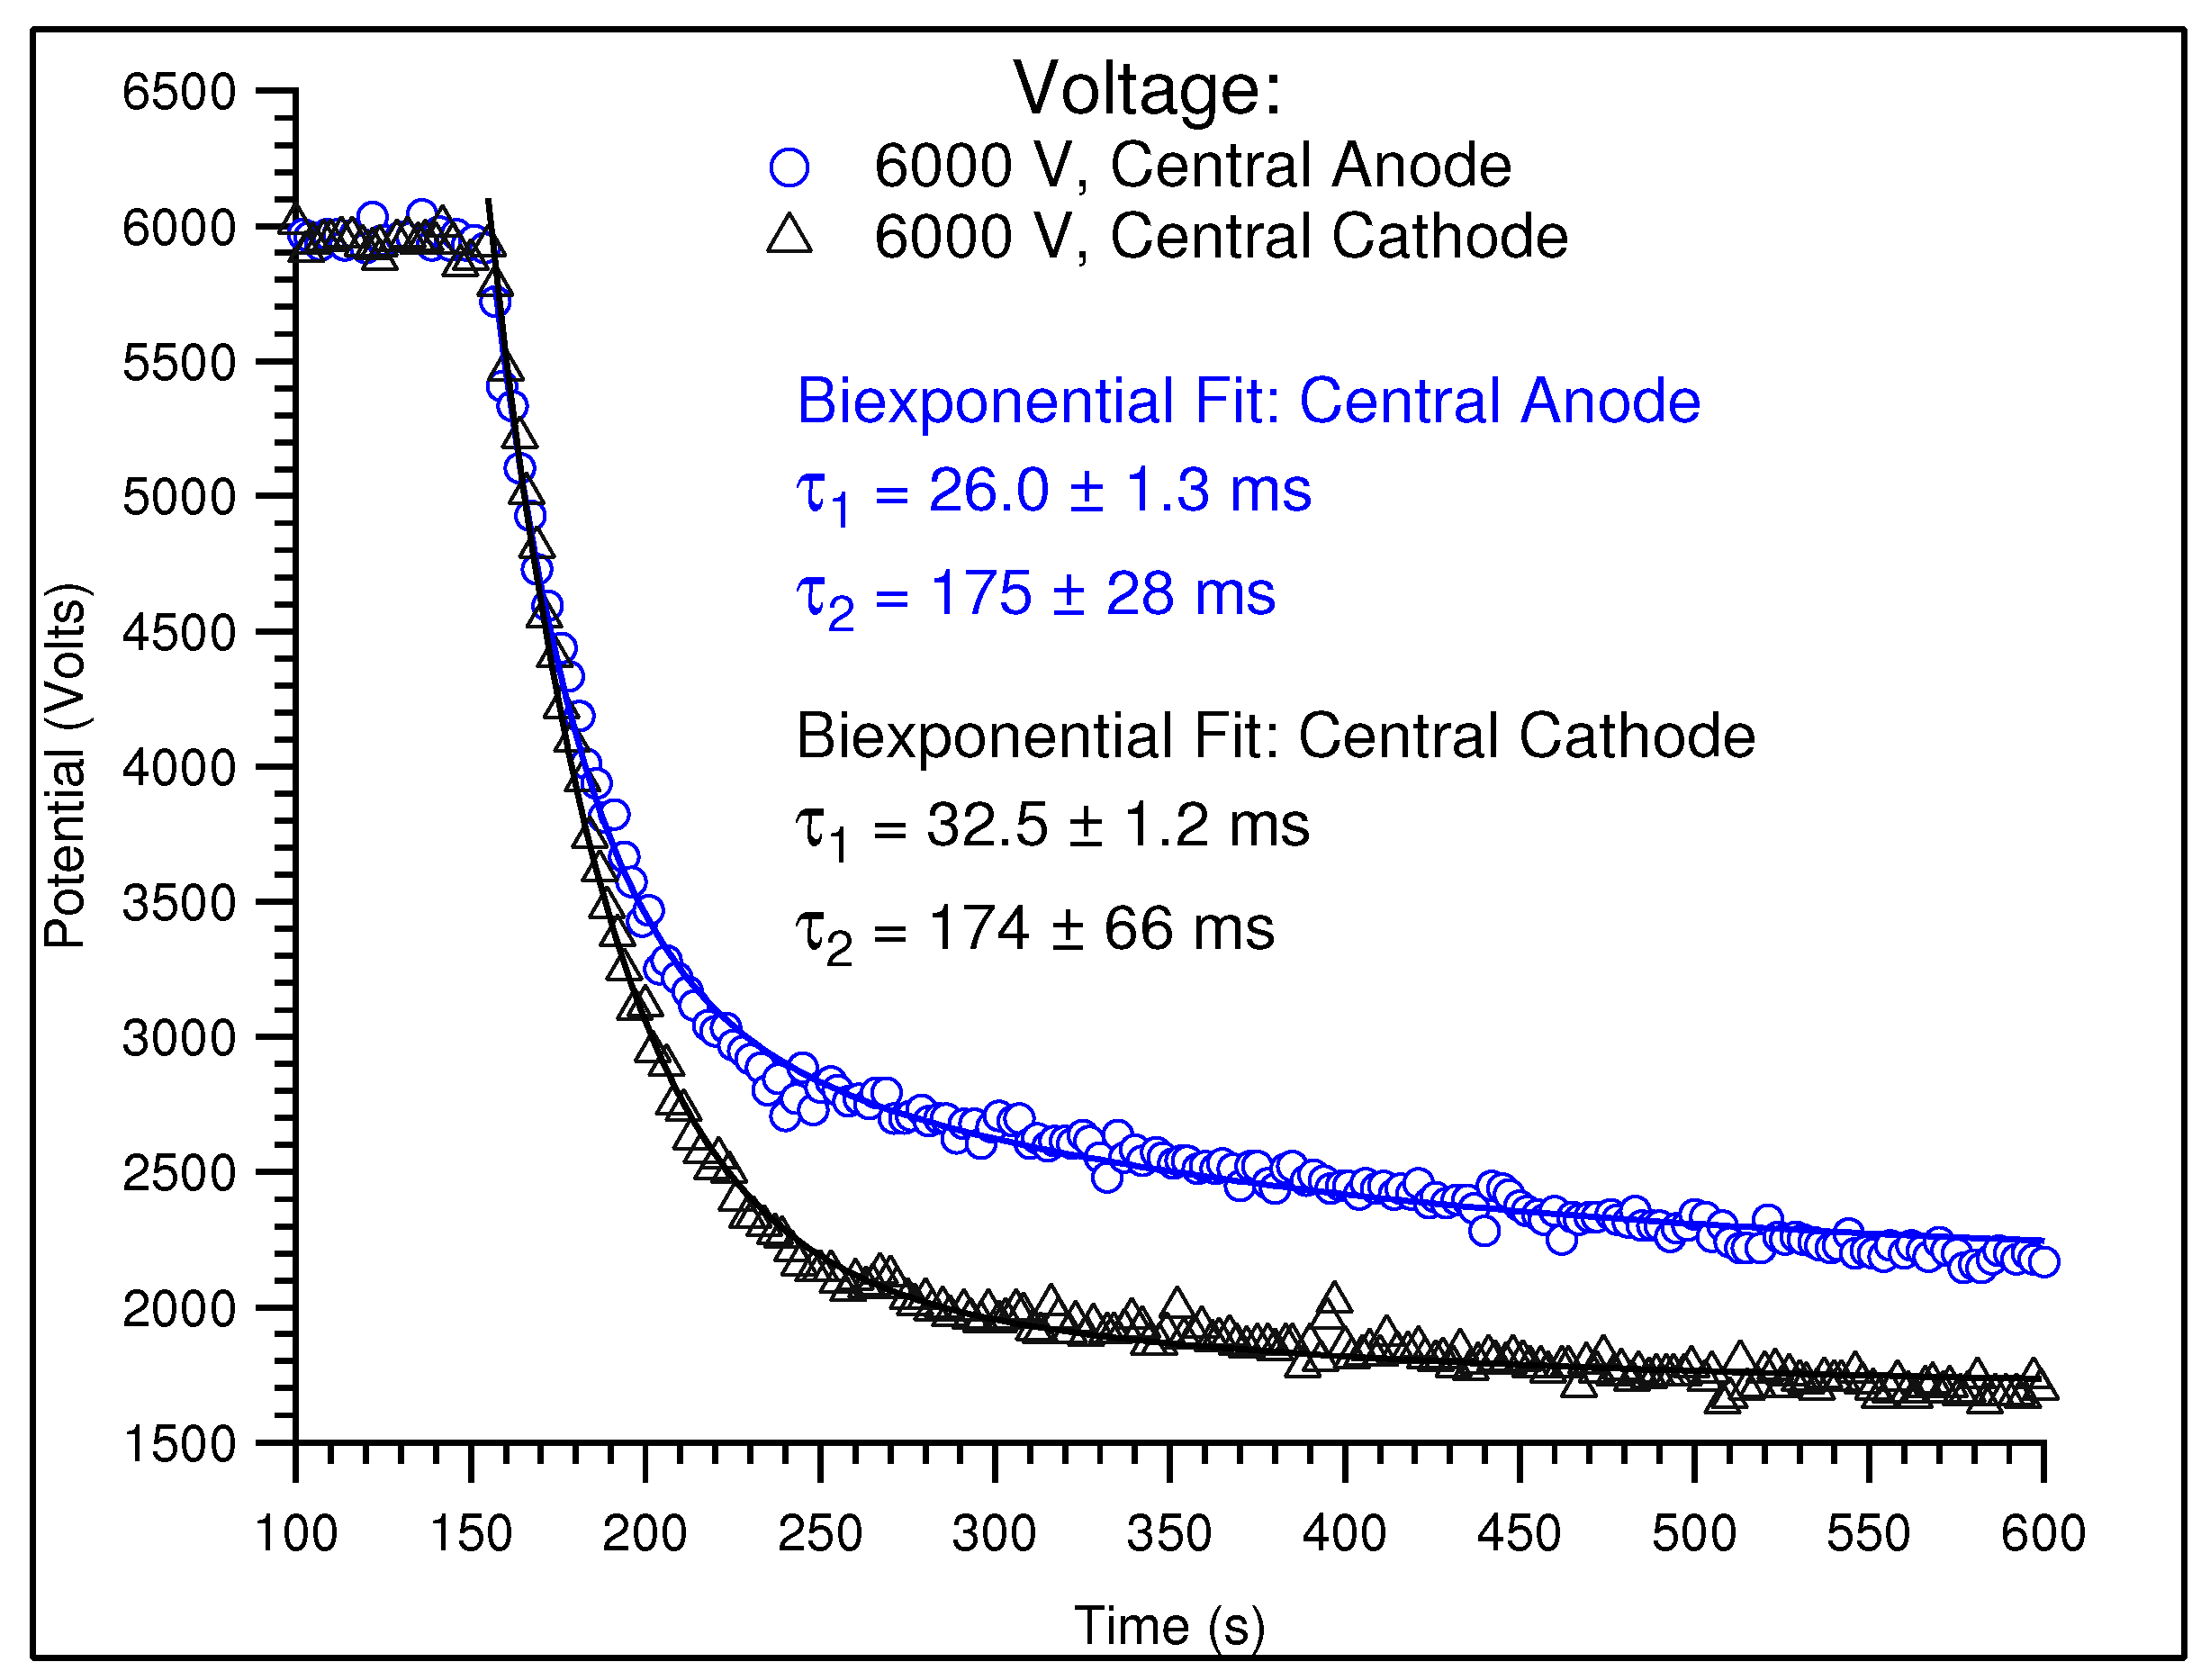
Voltage traces were also recorded from ball plasmoid discharges with the opposite electrode polarity, i.e., with the central rod as the cathode. The data presented in
Figure 7 correspond to the current data that are presented in
Figure 5. As is the case with the current traces, the voltage traces are similar between the two electrode polarities. However, it is apparent that when the central rod is the cathode, the voltage across the capacitor plates decreases much more rapidly, and the ending voltage is a few hundred volts lower than at the opposite polarity. If the total resistance of the circuit stays essentially the same between the two polarities, it stands to reason that a discharge with a larger maximum current could result in a smaller minimum (ending) voltage.
Additionally, biexponential fits to the voltage traces were performed for plasmoid discharges at both electrode polarities. The results included in
Figure 7 show that
is very similar at both polarities; however,
is larger when the central electrode is the anode. This discrepancy suggests that the first phase of the discharge (during which a jet is produced) occurs more quickly when the central electrode is the cathode, which in turn could also explain why the ending voltage for this polarity is significantly lower. The physical explanation for why the initial stages of the discharge seem to be faster when the central electrode is the cathode is presently unclear.
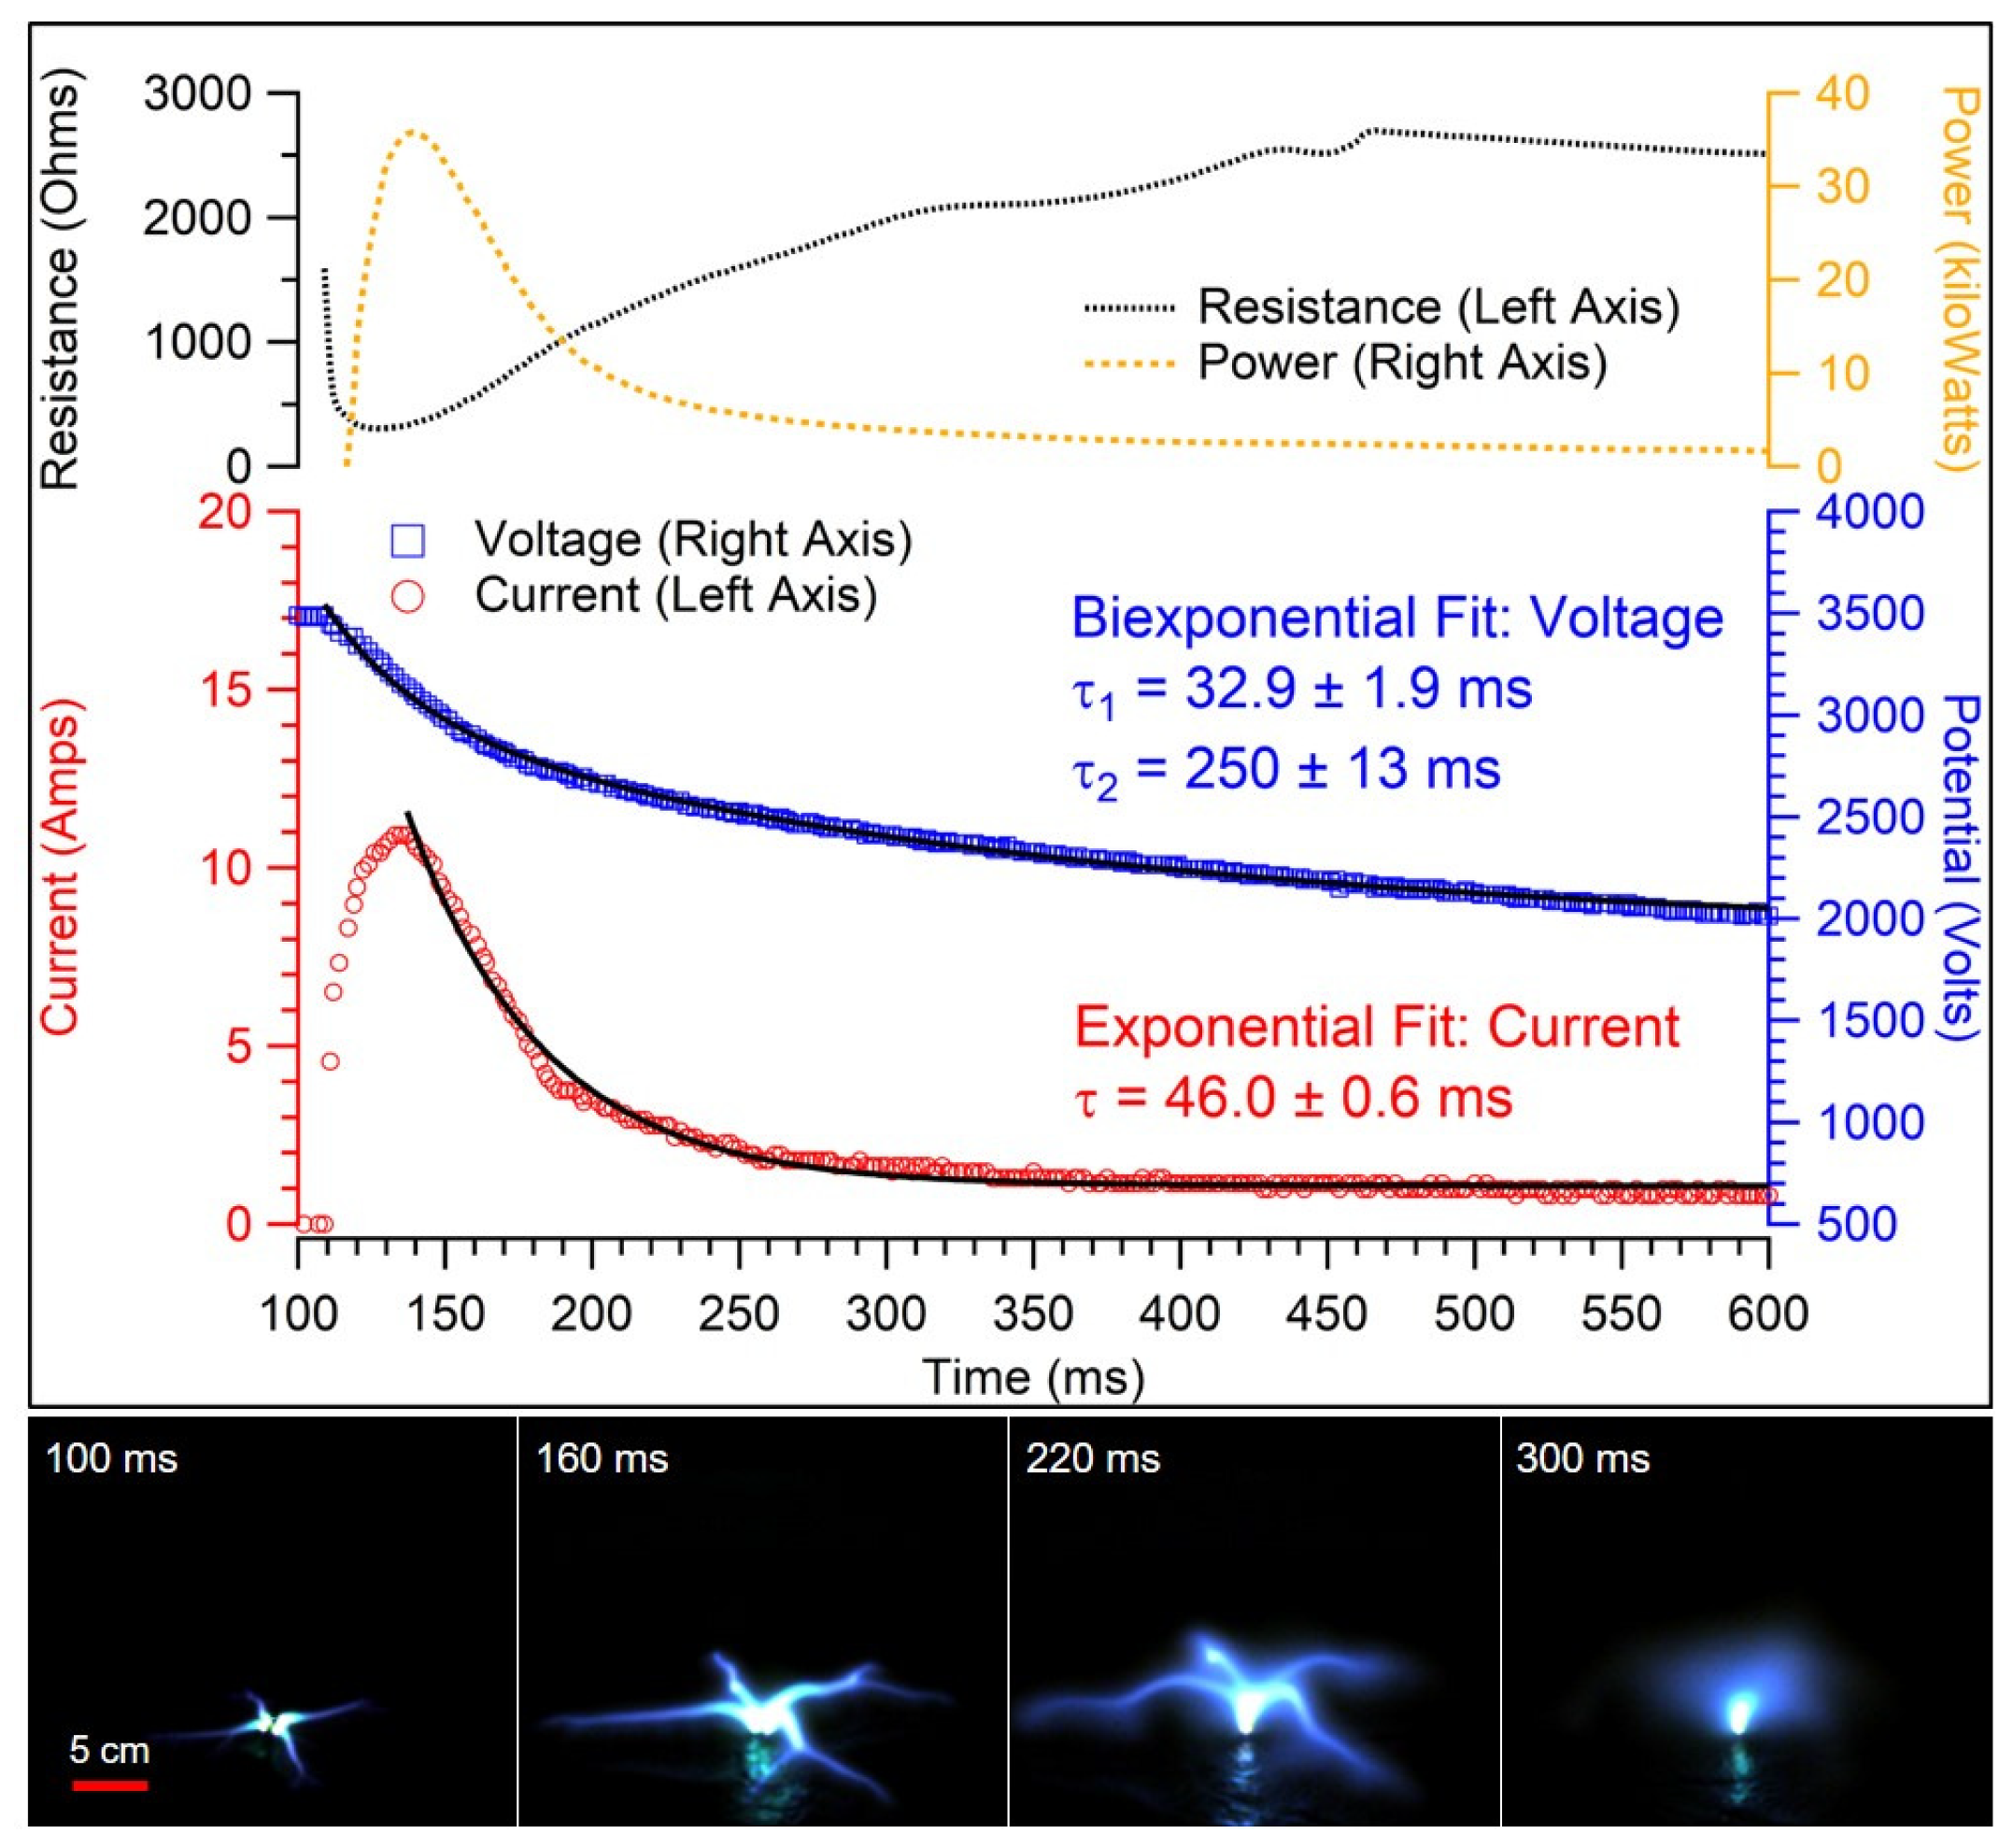
We have determined that (for this circuit) a plasmoid will not form at potentials less than ∼2800 V. The jet formed at the tip of the anode is not generated below this potential. Intentionally charging the capacitor bank to a voltage that will not produce a plasmoid, but does establish spark channel connections, generates a voltage waveform that can be fit to a single exponential. Thus, the fast time constant (
) likely corresponds to the formation of a jet at the anode. Electrical diagnostics and videography of discharges at 3500 V and 2500 V clearly demonstrate this phenomenon (
Figure 8 and
Figure 9).
In the case of a 3500 V discharge (
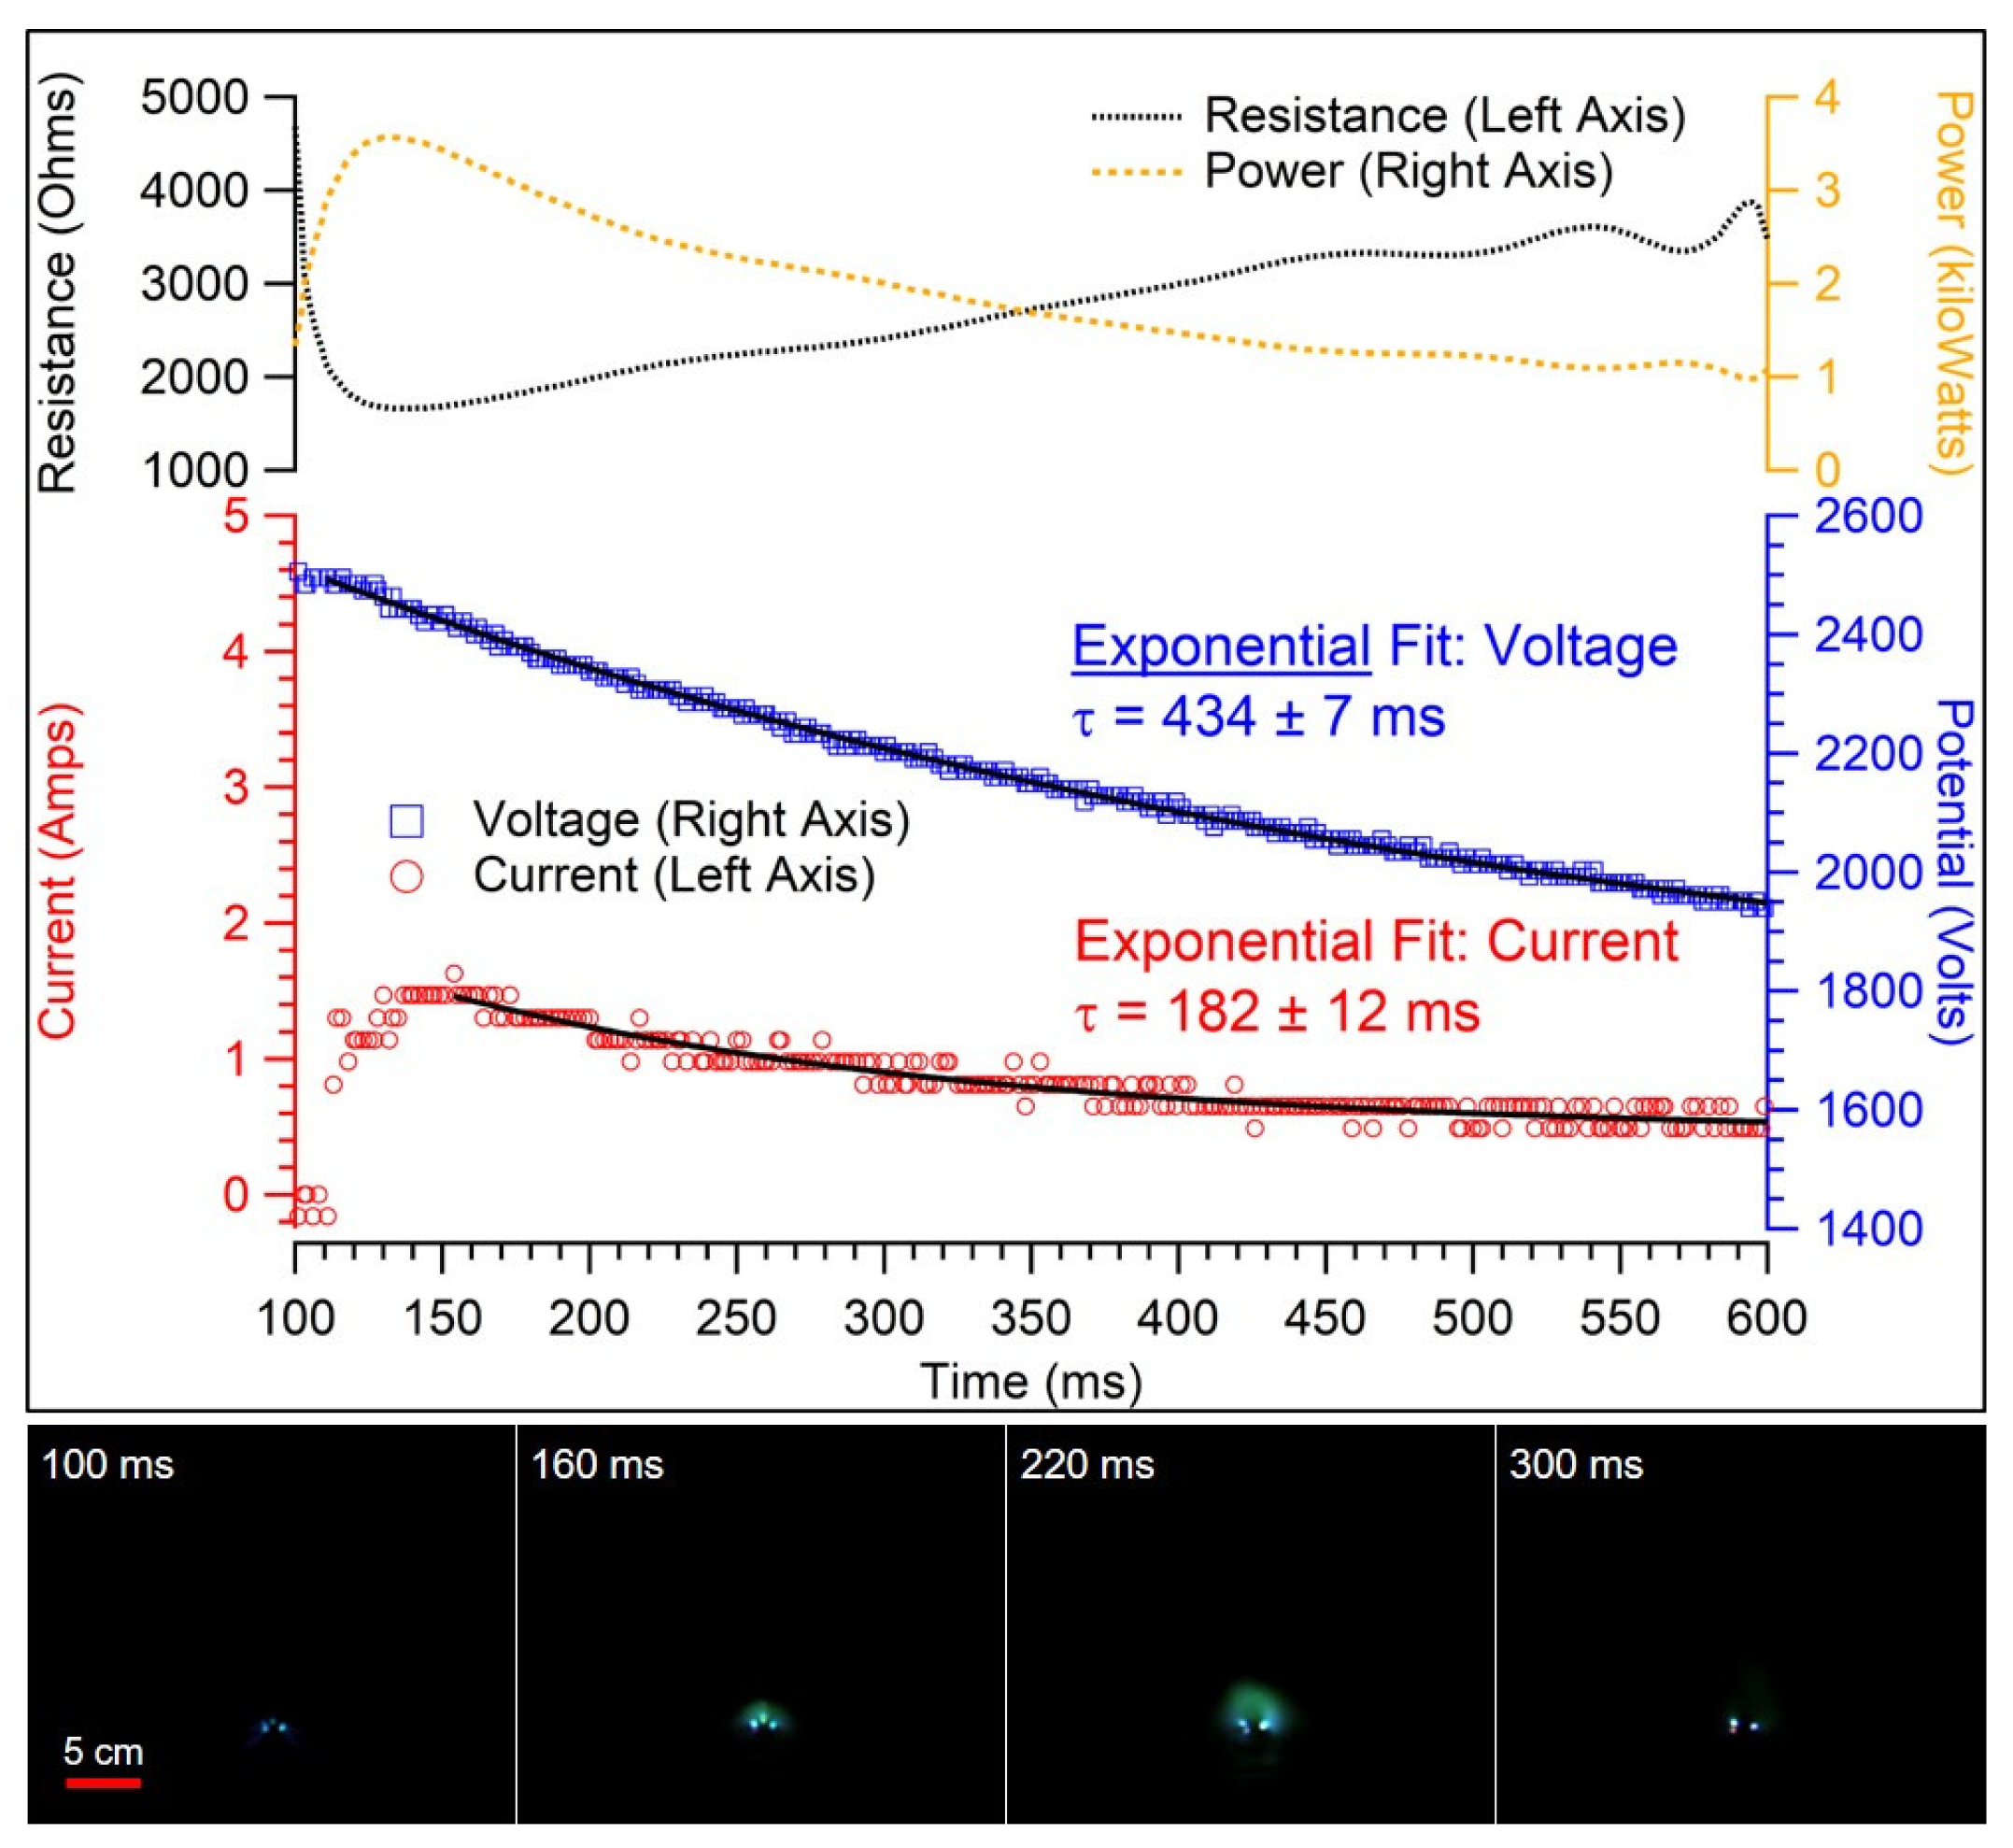
Figure 8), streamers and a jet are observed forming at the anode, and the voltage profile is fit to a biexponential. For a 2500 V case (
Figure 9), however, no plasmoid is formed, yet a small amount of current flows via spark channels. This observation is similar to the initiation phase described in [
12]. These spark channels are visualized as bright spots at the edges of the anode in images obtained with the PixelLink camera. Fits to voltage profiles of 2500 V discharges (that do not produce a jet) are described by a single time constant which is on the same order but larger than
as reported above. Thus, the larger time constant (
) likely corresponds to the spark channel connections between the anode and the electrolyte surface.
3.3. Resistance
Similar to what was reported in [
7], the resistance across the lifetime of the discharge is not constant; these data are shown in
Figure 6,
Figure 8 and
Figure 9. The resistance is essentially infinite before triggering the discharge and before breakdown of the air gap between electrolyte and anode. Once the discharge is triggered, the resistance rapidly decreases to a minimum before slowly increasing as the discharge develops. This minimum value of resistance (several tens of
) tends to decrease with increasing discharge potential. This trend is present no matter the voltage used to produce the plasmoid, although the magnitude of the total resistance change can vary. When discharges are performed below the potential threshold for jet formation (
Figure 9), the same overall trend in the resistance profile is observed. However, the minimum resistance, i.e., the value to which the resistance decreases in the first several milliseconds of the discharge, is considerably larger (∼2 k
).
The most likely explanation for the increase in resistance as the discharge develops is a decrease in the conductance of the plasma resulting from two possible mechanisms. As the plasma conductivity is proportional to the square of the electron density, an overall decrease in electron density would manifest as a decrease in overall conductivity and increase in resistivity of the plasma formed in the discharge. This assumes that as the measured current (and, subsequently, the current density) decreases, the electron density in the plasmoid also decreases. The dynamic nature of the arcs observed via high-speed videography in [
12] could also explain this increase in resistance: as the lengths of the streamer channels increase (and the conductivity of the channels remain essentially constant) the conductance of the plasmoid will subsequently decrease. The nature of the resistance of the discharge will be examined in greater detail in future studies.


