Article

Sustainable Ceramic Tiles from Recycled Glass and Bentonite: Microstructure, Properties and Energy-Efficient Processing


1
Mechanical Engineering Department, Faculty of Technology, M’Hamed Bougara University-Boumerdes, Boumerdes 35000, Algeria
2
Thermal Analysis Laboratory for the Characterization of Materials, Department of Engineering “Enzo Ferrari”, University of Modena and Reggio Emilia, Via Pietro Vivarelli 10, 41125 Modena, MO, Italy
3
Department of Metallurgy, Faculty of Materials, Metallurgy and Recycling, Technical University Košice, 040 01 Košice, Slovakia
4
Research Unit, Materials, Processes and Environment, Faculty of Technology, M’Hamed Bougara University-Boumerdes, Boumerdes 35000, Algeria
5
Faculty of Foundry Engineering, AGH University of Krakow, Reymonta 23 St., 30-059 Krakow, Poland
*
Authors to whom correspondence should be addressed.
Ceramics 2026, 9(7), 65; https://doi.org/10.3390/ceramics9070065
Submission received: 3 May 2026 / Revised: 13 June 2026 / Accepted: 15 June 2026 / Published: 23 June 2026

Abstract

This study aims to develop eco-efficient ceramic tiles through the valorization of recycled glass (GW; soda–lime glass cullet) as a partial raw material substituent, enabling a reduction in sintering temperature and, consequently, a decrease in thermal energy demand, carbon-equivalent emissions, and the depletion of virgin mineral resources. Ceramic tiles were elaborated by partially substituting natural bentonite with 30–50 wt.% GW and fired at 900 °C and 950 °C. Use of GW promoted liquid-phase sintering, driving significant densification evidenced by a marked reduction in open porosity and water absorption. SEM images confirm a denser, more homogeneous structure with reduced porosity, leading to improved mechanical strength and chemical durability. Compositions containing 30–35 wt.% bentonite exhibit the most optimized microstructure, characterized by well-dispersed crystalline phases embedded within a dense vitreous matrix. These findings demonstrate that high-performance ceramic tiles meeting standard classification thresholds can be manufactured at sub-1000 °C firing temperatures through judicious incorporation of recycled glass waste. This approach offers a viable pathway toward reduced energy consumption, diminished reliance on primary mineral resources, and enhanced circularity within the construction ceramics industry.

1. Introduction

The rapid growth of the global construction sector has resulted in an unprecedented demand for natural raw materials, accompanied by a continuous increase in industrial waste generation. Among these wastes, glass represents a major environmental concern due to its high production volume and low biodegradability. Soda–lime glass, which accounts for more than 70% of worldwide glass production, is extensively used in packaging and building applications owing to its favorable mechanical properties, chemical stability and optical transparency [1,2]. Despite its intrinsic recyclability, a significant proportion of post-consumer glass remains underutilized and is ultimately disposed of in landfills, leading to environmental, economic and resource-efficiency challenges. Consequently, the development of sustainable recycling routes that allow the conversion of glass waste into value-added materials has become a critical research focus [3,4,5].
Ceramic materials are widely employed in construction and engineering applications due to their excellent mechanical strength, thermal stability, wear resistance and chemical inertness [6,7]. In recent decades, considerable attention has been devoted to the incorporation of industrial and urban wastes into ceramic matrices as an effective strategy to reduce the consumption of natural resources while improving the environmental sustainability of ceramic manufacturing processes [1,8]. In this context, recycled soda–lime glass has emerged as a particularly attractive secondary raw material, owing to its fluxing ability and its capacity to promote liquid-phase sintering during firing [9,10,11].
Numerous studies have demonstrated that the addition of waste glass to clay-based ceramic bodies can significantly modify sintering behavior, leading to enhanced densification, reduced open porosity and improved mechanical performance [12,13,14]. The formation of a viscous glassy phase at intermediate temperatures facilitates mass transport mechanisms, accelerates particle rearrangement and improves microstructural homogeneity [15,16]. As a result, the incorporation of recycled glass enables a substantial reduction in firing temperature, which is a key factor in decreasing energy consumption, production costs and associated CO2 emissions in the ceramic industry [17].
Conventional ceramic tile production typically requires firing temperatures exceeding 1200 °C to achieve adequate densification and mechanical strength [14]. However, recent investigations have shown that the partial substitution of traditional ceramic raw materials with glass waste allows the development of ceramic products with comparable or even superior properties at significantly lower firing temperatures, often below 1000 °C [18]. In addition to densification enhancement, the presence of a continuous glassy phase has been reported to improve chemical durability and resistance to aggressive acidic and alkaline environments, which is essential for long-term performance in construction and infrastructure applications [19,20].
Despite these advantages, the integration of recycled glass into ceramic bodies also presents several scientific and technological challenges. The interactions between glass waste and clay minerals strongly influence phase evolution [21], vitrification mechanisms and final material properties. In particular, the role of glass composition, particle size distribution and firing parameters on sintering kinetics and microstructural development remains complex and requires systematic investigation [22]. Moreover, achieving controlled low-temperature vitrification while maintaining adequate mechanical strength and durability is still a key challenge for the large-scale industrial application of glass-containing ceramic materials [23,24].

2. Materials and Methods

In order to select appropriate raw materials for tile fabrication, two types of bentonite and two particle size fractions of recycled glass wastes, were selected and thoroughly characterized.

2.1. Raw Materials

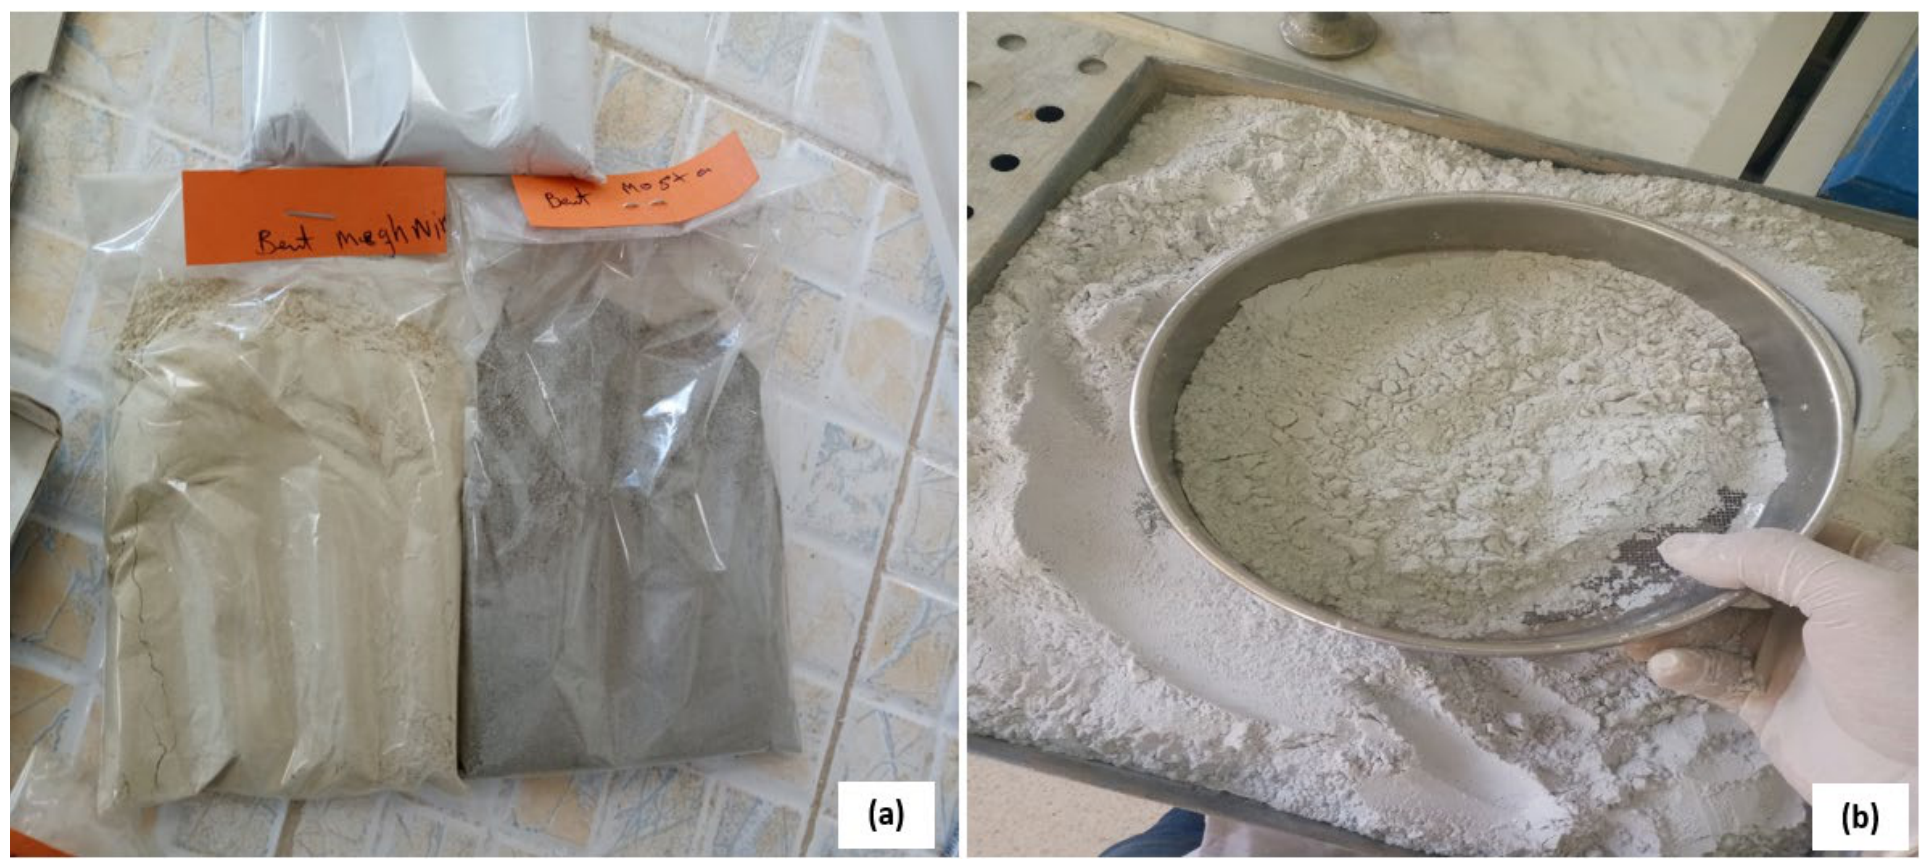
The raw materials used in this study consisted of Algerian bentonite clays and recycled glass of the soda–lime glass type. Two natural bentonites originating from Tlemcen (B1) and Mostaganem (B2) were selected in order to investigate the influence of clay mineralogy and exchangeable cations on the sintering behavior and final properties of ceramic tiles (Figure 1). Both bentonites belong to the smectite family, with montmorillonite as the dominant mineral phase, providing high plasticity and reactivity during shaping and firing.
The recycled glass (GW) is a soda–lime glass mainly composed of SiO2, Na2O and CaO, making it particularly suitable as a fluxing agent in ceramic formulations. Prior to use, the cullet was manually cleaned to remove impurities, then crushed, milled, and sieved into different particle size fractions. The powders were subsequently dried at 110 °C to eliminate residual moisture and ensure reproducibility during weighing and processing.

2.2. Characterization of Raw Materials

The chemical composition of the bentonites and recycled glass was determined by X-ray fluorescence (XRF) analysis, allowing the identification of the major oxides responsible for fluxing and structural development during firing. The thermal behavior of the raw materials was investigated using thermogravimetric and differential scanning calorimetry (TG–DSC) analysis in order to evaluate mass loss phenomena and phase transformations occurring during heating. These analyses provided insight into dehydration, dehydroxylation of clay minerals, and the onset of vitrification, which are critical for optimizing firing conditions.
The thermal-analysis data presented have been re-exported from the original NETZSCH STA 449 F3 Jupiter instrument files (.ngb-ss3 format) using NETZSCH Proteus v8.0 software, and re-plotted in Origin Pro 2024 with proper axis labels, consistent units (mW/mg for DSC; %/min for DTG), polynomial baseline correction (order 5), and clear annotation of the principal thermal events: dehydration (25–180 °C), dehydroxylation (350–500 °C), carbonate decomposition (600–800 °C, stronger for B2 due to its higher CaO content), and vitrification onset (>900 °C). All peak assignments are now supported by visible and interpretable features in the curves.
The particle size distribution of the ground-recycled glass as analysed to assess its influence on sintering kinetics and microstructural development. A controlled granulometry was adopted to ensure good dispersion of the glass particles within the clay matrix and to promote uniform densification.
A comprehensive characterization of the raw materials was carried out to better understand densification behavior, vitrification mechanisms, and mineralogical evolution during firing. The investigation included thermal analysis (TG–DSC), chemical composition (XRF), mineralogical identification (XRD), and particle size distribution. All experimental analyses were conducted at the University of Boumerdès and at the Enzo Ferrari Laboratory-University of Modena and Reggio Emilia, Italy.

Bentonite

Two bentonites with distinct physicochemical characteristics were investigated: a low-CaO bentonite (B1, Tlemcen, CaO = 2.37 wt%) and a calcium-rich bentonite (B2, Mostaganem, CaO = 8.70 wt%). Both materials are predominantly composed of montmorillonite, a smectite-group mineral characterized by a layered (lamellar) microstructure, which imparts high swelling capacity, strong interparticle bonding, elevated plasticity, and excellent shaping ability.
The choice of bentonite as the primary clay component—rather than the more conventional kaolin, illite or ball clay—is motivated by three converging scientific and economic considerations. (i) Geological availability and economic accessibility: Algeria hosts one of North Africa’s largest bentonite deposits at Hammam Boughrara (Tlemcen, NW Algeria), exploited industrially since 1947 by SPA BENTAL (ENOF subsidiary), with proven reserves estimated at >100 Mt. The local extraction price (40–60 USD/t delivered, 2024 data) is 30–40% below the cost of imported kaolin or ball clay. (ii) Functional plasticity and binding behaviour: The high cation-exchange capacity (CEC ≈ 80–100 meq/100 g) and elevated specific surface area (350–500 m2/g for the Tlemcen Wyoming-type bentonite) provide exceptional green strength at the moderate uniaxial pressing pressure (80 MPa) employed here. (iii) Chemical reactivity with the soda–lime cullet matrix: The bentonite-derived Al2O3 (14.84–17.19 wt%) combined with CaO from both bentonites and from the cullet (CaO 11.18 wt% in GW2) supplies the stoichiometric ratio required for in situ anorthite (CaAl2Si2O8) crystallization in the CaO–Al2O3–SiO2 system. The Fe2O3 content of B1 (5.61 wt%), TiO2 (0.65 wt%) and alkali oxides Na2O + K2O (3.25 wt%) all fall within the tile-grade compositional thresholds (Fe2O3 < 7%, TiO2 < 1.5%, alkali oxides < 5%) established [24] for porcelain stoneware, monoporosa and earthenware bodies. The bentonite-glass strategy adopted here constitutes a deliberate experimental approach that exploits the high reactivity of montmorillonite to enable low-temperature liquid-phase sintering, while compensating for its well-known drawbacks through the high cullet fraction that buffers them via viscous-flow sintering.
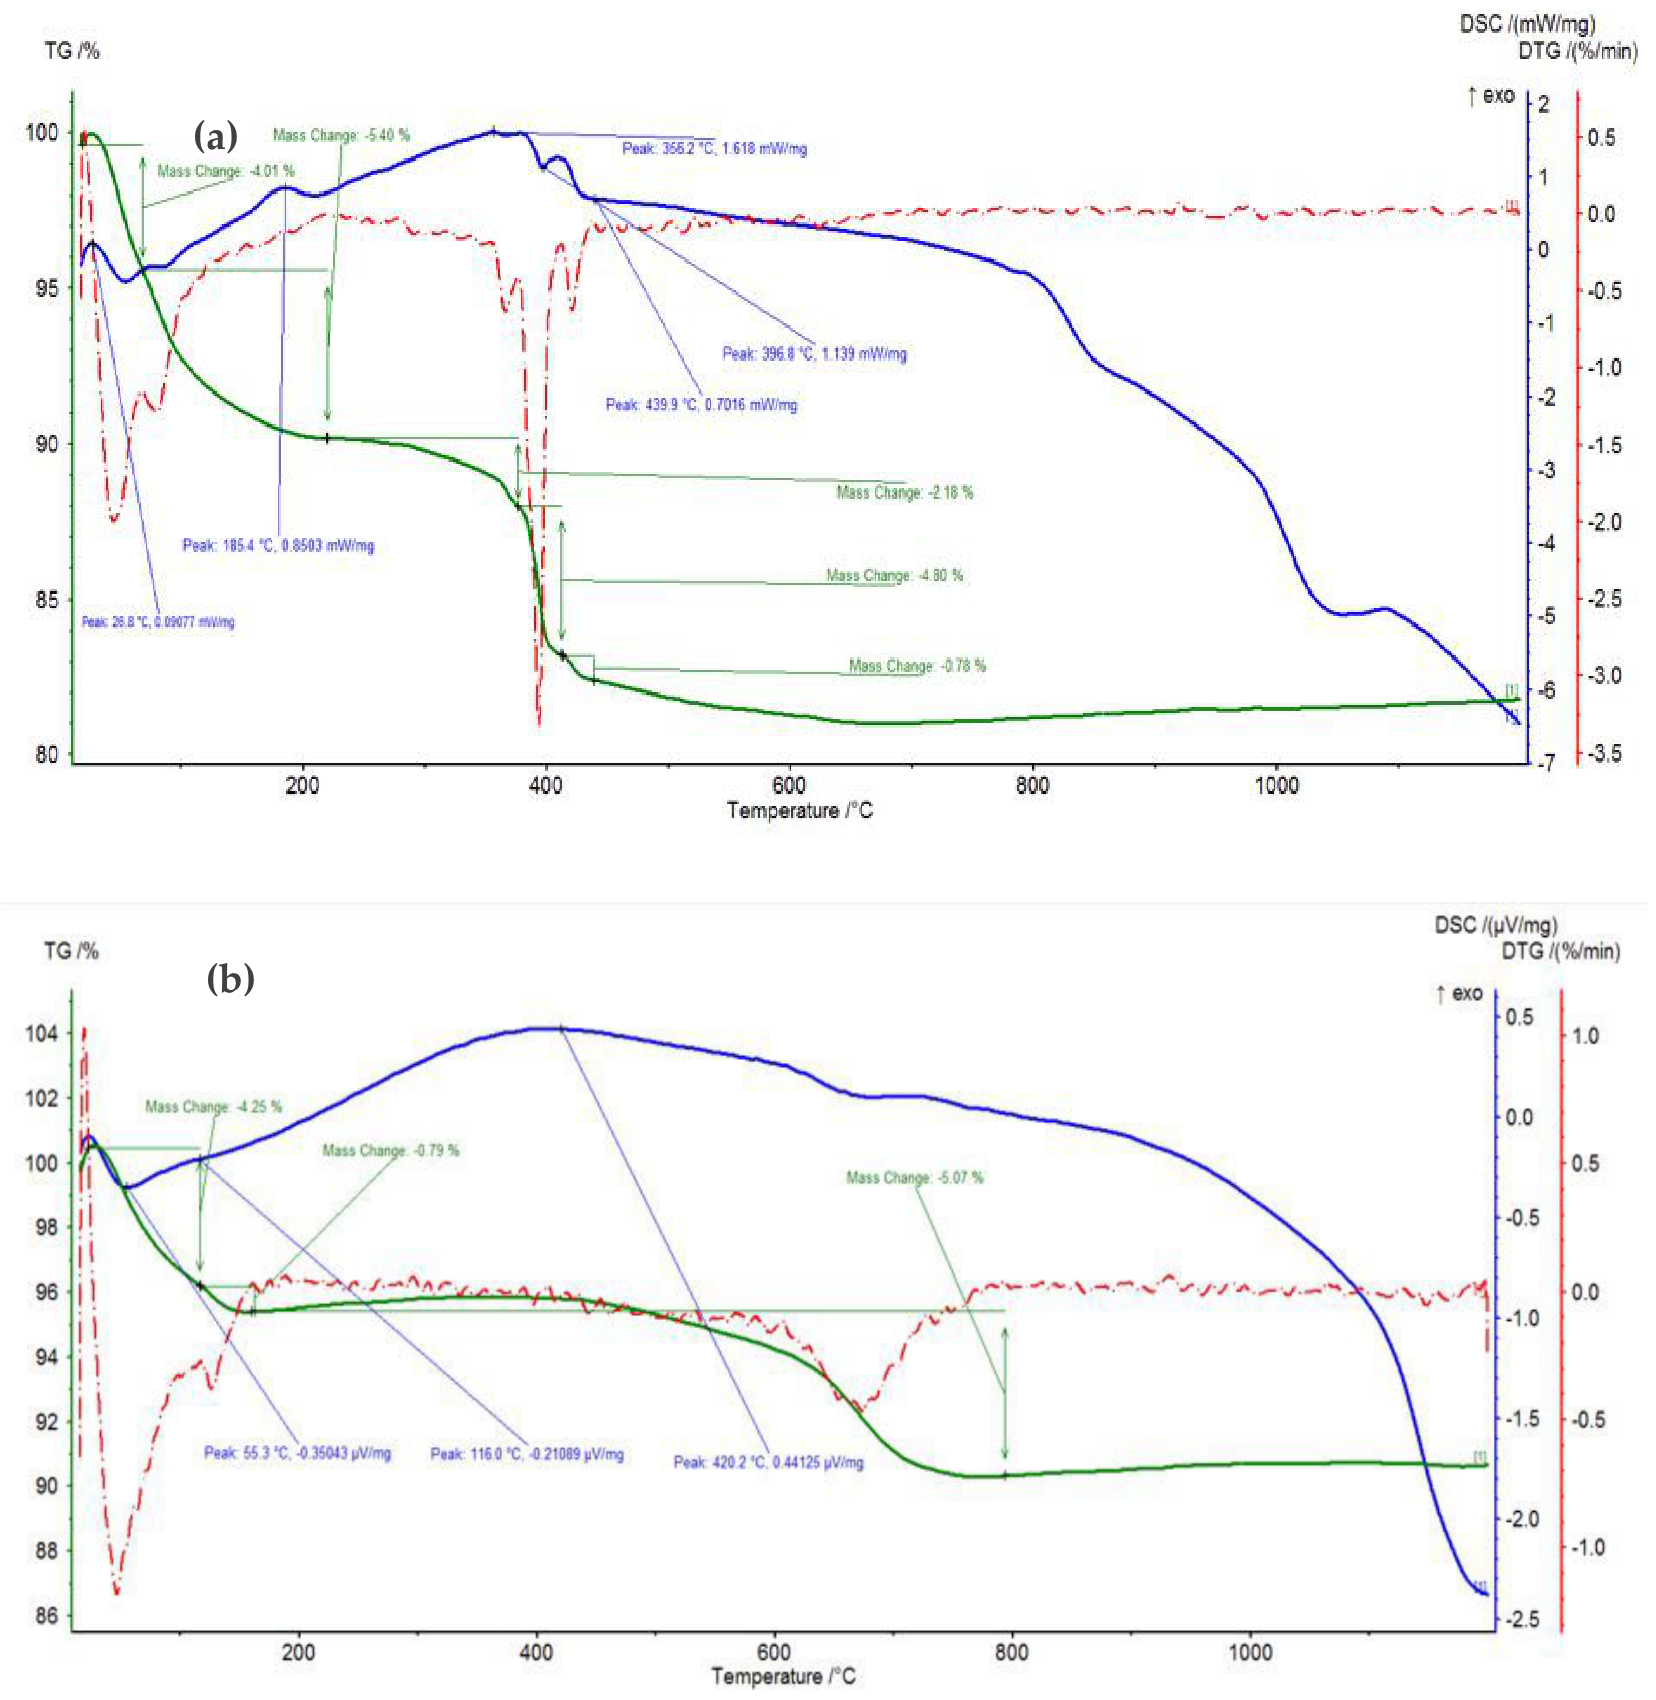
TG–DSC analysis: Thermogravimetric and differential scanning calorimetry analysis (TG–DSC), were carried out to assess the thermal stability of the bentonites during heating (Figure 2). The thermal curves show typical features of montmorillonitic clays, with noticeable differences related to their chemical composition. The first mass loss, occurring between 25 and 180 °C, corresponds to the elimination of free and physically adsorbed water. B1 bentonite exhibits a higher mass loss (≈5.4%) compared to the B2 bentonite (≈4.2%), indicating a higher interlayer hydration level. This behavior is consistent with the superior plasticity and swelling capacity of the B1, which is beneficial for shaping operations and the development of green strength. The second thermal stage, observed between 180 and 360 °C, is attributed to the release of interstitial and partially structural water [24]. A significantly higher mass loss is recorded for the B1 (≈4%) compared to the B2 sample (≈0.8%), confirming a more hydrated and thermally sensitive structure. This characteristic may enhance the reactivity of the clay during its interaction with the molten glass phase at elevated temperatures.
Between 350 and 500 °C, thermal events associated with partial dehydroxylation and the oxidation of minor organic matter are detected. The B2 bentonite displays a pronounced exothermic peak around 420 °C, indicating higher thermal reactivity. In the temperature range of 600–800 °C, mass losses of approximately 5% are observed for both bentonites, mainly related to carbonate decomposition and continued dehydroxylation. B2 shows more pronounced decarbonation behavior due to its higher CaO content (8.70 wt%, vs. 2.37 wt% for B1) and the associated higher calcite (CaCO3) fraction, which releases CO2 during firing and—when combined with low-viscosity ultrafine cullet such as GW1—promotes bloating defects in the green-to-fired transition (Figure 2). Above 1000 °C, the DSC curves reveal structural rearrangements associated with the onset of vitrification. Both bentonites show endothermic effects in this temperature range; the moderate Na2O content of both samples (1.61–1.75 wt%) contributes to partial melting.
Overall, these results demonstrate that bentonite chemistry strongly governs thermal behavior, directly influencing sintering kinetics, vitrification mechanisms, and liquid-phase formation in low-temperature ceramic tile production [23,24,25,26].
Chemical analysis: The chemical compositions of the two bentonites (Table 1), determined by X-ray fluorescence, confirm their smectitic nature and highlight significant compositional differences that strongly affect sintering behavior, vitrification processes and color development.
The bentonite B1 (Tlemcen) is characterized by SiO2 and Al2O3 contents of 59.49% and 17.19%, respectively, corresponding to a SiO2/Al2O3 molar ratio of approximately 3.46. Its low CaO content (2.37%), together with low Na2O (1.61%) and moderate K2O (1.64%), indicates a low-flux, low-carbonate composition typical of partially leached or dilute calcic montmorillonites. This oxide composition limits CO2 release from carbonate decomposition during firing, favouring dimensional stability and reduced bloating defects in the green-to-fired transition. The Fe2O3 content (5.61%) is moderately elevated and contributes to the brick-red coloration of the fired tile. The loss on ignition (8.36%) is mainly attributed to dehydration and partial dehydroxylation processes between 100 and 700 °C.
In contrast, the bentonite B2 (Mostaganem) exhibits lower SiO2 (56.77%) and Al2O3 (14.84%) contents, with a higher SiO2/Al2O3 molar ratio of approximately 3.83. Its higher CaO content (8.70%) and moderate K2O (2.38%) confirm its calcium-rich, carbonate-bearing composition. This chemical profile promotes early-stage decarbonation reactions (calcite CaCO3 → CaO + CO2↑ between 650 and 800 °C) and favours the formation of calcium silicate phases during sintering, but also generates substantial CO2 gas release that can promote bloating defects, particularly when combined with low-viscosity ultrafine fluxes such as GW1. The lower Fe2O3 content (4.21%) accounts for its slightly lighter fired coloration. The loss on ignition (8.15%) is comparable to B1 and is dominated by dehydration and decarbonation contributions.
Overall, these compositional differences provide a coherent explanation for the distinct sintering behaviours observed: B1, with its low-CaO content and minimal carbonate fraction, favours dimensional stability and limited gas evolution during firing—making it particularly suitable for combination with high-fluxing soda–lime cullet without bloating defects. By contrast, B2, with its higher CaO content and the associated calcite fraction, generates significant CO2 release during firing that, combined with the ultrafine ultra-low-viscosity GW1 cullet, promotes the bloating and pore expansion observed experimentally. This mechanism (carbonate decomposition + low-viscosity early liquid phase trapping CO2 as gas bubbles) is consistent with the swelling behaviour reported in the literature for high-cullet/high-CaO tile bodies fired under fast conditions.
X-ray diffraction analysis: Mineralogical phase identification was performed by powder X-ray diffraction (XRD) on the optimal M1 ceramic tile formulation (30 wt% B1 + 70 wt% GW2) fired at 950 °C. Measurements were carried out using a PANalytical X’Pert Pro diffractometer, equipped with a Cu-Kα radiation source (λ = 1.5406 Å), operating at 40 kV/40 mA. Diffractograms were acquired from 5° to 70° (2θ), with a step size of 0.02° and a counting time of 1 s per step. Specimens were prepared by gentle dry-grinding in an agate mortar (<75 µm) and back-loaded into a standard PMMA holder. Phase identification was performed by comparison with the ICDD PDF-2 database (release 2024) using HighScore Plus v5.1 software (Malvern Panalytical, Almelo, The Netherlands).
Recycled Glass (GW)
Recycled glass (GW) was selected due to its wide availability, high silica content, and well-established fluxing behavior, making it particularly suitable for low-temperature ceramic processing. The incorporation of recycled glass contributes not only to the reduction of natural raw material consumption but also plays a key role in enhancing vitrification, densification, and microstructural homogenization at firing temperatures below 1000 °C. Prior to its utilization, the glass waste was thoroughly washed to eliminate surface impurities, dried, crushed, and sieved into well-defined particle size fractions. A comprehensive characterization was then performed to determine its chemical composition, thermal behavior, and granulometric distribution, all of which significantly influence liquid-phase formation, sintering kinetics, and pore evolution during the firing process.
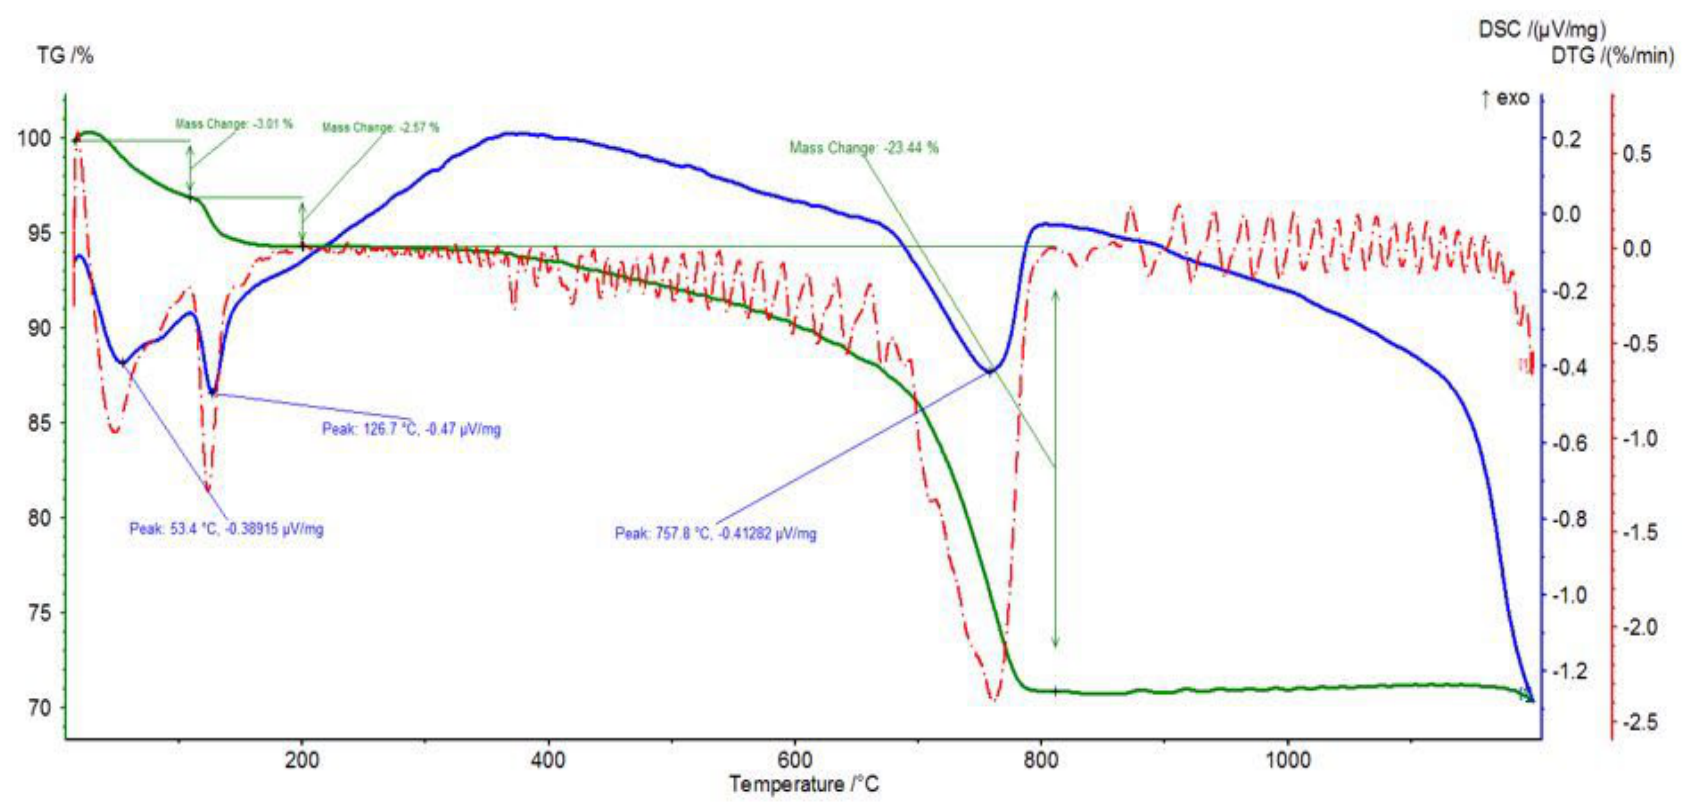
TG–DSC analysis: TG–DSC analysis of the GW (Figure 3) provides essential insight into its thermal stability, minor decomposition reactions and softening behavior during heating. Unlike clay-based materials, glass does not undergo dehydroxylation; its thermal evolution is mainly governed by the removal of residual volatiles and the transition to a viscous flow state.
The first mass loss stage, observed up to approximately 200 °C, corresponds to the elimination of physically adsorbed moisture and superficial volatile species. A mass loss of about 3.01% is recorded, accompanied by a weak endothermic peak centered around 53.4 °C. This behavior is typical of finely ground glass powders with high specific surface area and confirms the absence of structural water.
Between 200 and 500 °C, a secondary and limited mass loss of approximately 2.57% is detected. This stage is mainly attributed to the decomposition of residual organic contaminants and minor surface impurities originating from industrial handling. The absence of pronounced thermal peaks in this range confirms the high thermal stability of the amorphous glass network.
The main thermal transformation occurs between 600 and 800 °C, where the DSC curve shows a clear endothermic effect around 757.8 °C, corresponding to the glass transition and the onset of viscous flow. Unlike crystalline materials, this transformation is not associated with true decomposition but with structural relaxation and softening of the amorphous network. This viscous flow is a key mechanism controlling liquid-phase sintering, pore filling and intergranular bonding within the ceramic matrix.
Above 800 °C, the mass becomes nearly stable, indicating the formation of a continuous molten glassy phase. At this stage, the viscosity of the glass decreases significantly, allowing efficient penetration into intergranular pores and promoting densification and microstructural homogenization. This behavior confirms the strong fluxing ability of soda–lime glass and its suitability for activating vitrification at relatively low temperatures (<1000 °C), contributing to energy-efficient ceramic processing.
Chemical analysis by X-ray fluorescence: The chemical composition of the recycled glass, determined by X-ray fluorescence (Table 2), confirms its typical soda–lime nature. The glass is dominated by SiO2 (75.39%), which forms the backbone of the glassy network, providing chemical durability and thermal stability. The high silica content ensures the formation of a continuous amorphous phase during firing, which plays a critical role in pore sealing and stress redistribution.
Fluxing oxides, mainly Na2O (11.98%) and CaO (9.19%), significantly reduce the melting temperature and viscosity of the glass. Sodium oxide acts as a network modifier, breaking Si–O–Si bonds and enhancing ionic mobility, while calcium oxide stabilizes the glass structure and promotes the formation of calcium aluminosilicate phases when reacting with bentonite-derived oxides. This balanced Na2O–CaO system ensures both high fluidity and adequate chemical resistance of the molten glass. Minor oxides (MgO, K2O, Al2O3 and trace Fe2O3) further influence the thermal and rheological behavior of the glass. The very high SiO2/Al2O3 ratio (~157) confirms the predominantly siliceous character of the cullet and explains its strong vitrifying ability within the 800–950 °C temperature range.
Overall, this oxide composition makes the recycled glass an efficient fluxing agent capable of promoting liquid-phase sintering, enhancing densification and reducing firing temperature without compromising chemical stability. Two particle size distributions were selected in order to identify the most suitable granulometric class for producing high-quality ceramic tiles.
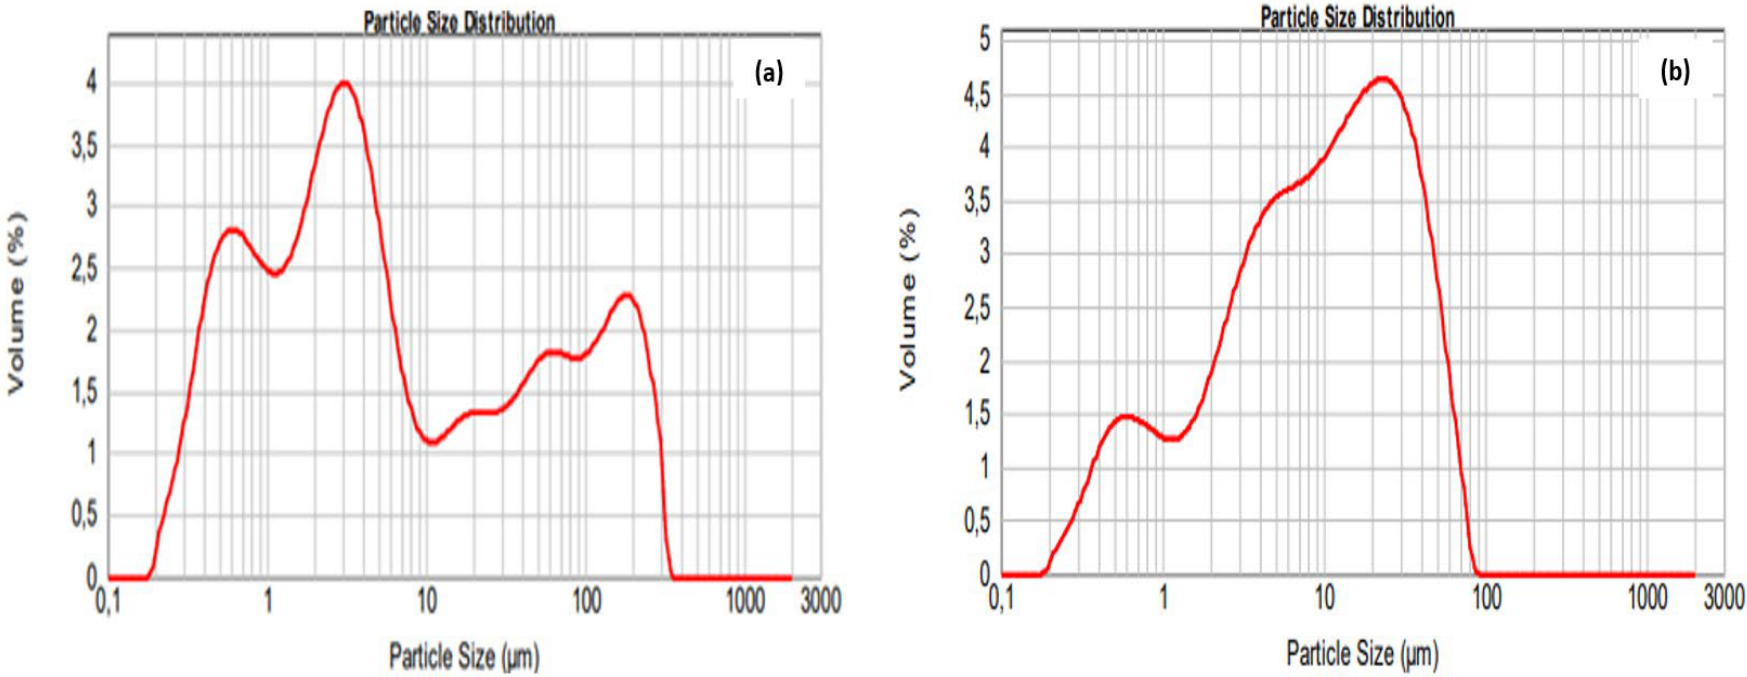
Particle size distribution: Figure 4a,b present the particle size distributions of the two recycled glass with two-granulometric class. A clear difference in granulometric behavior is observed, which strongly affects packing efficiency, viscous flow and densification mechanisms during firing. The particle size distribution of the recycled glass fraction GW1 (Figure 4a) exhibits a multimodal and highly polydisperse profile, characterized by a substantial proportion of ultrafine particles (<1 µm) and a median diameter d50 ≈ 3.9 μm. The pronounced gap between d10 and d90 reflects significant granulometric heterogeneity and a wide particle size dispersion.
In contrast, the second recycled glass fraction GW2 (Figure 4b) displays a narrower and more uniform particle size distribution, with a median diameter d50 ≈ 53.7 μm. The predominantly unimodal distribution indicates improved granulometric homogeneity and a lower tendency toward particle agglomeration.
Such ultrafine particles possess a very high specific surface area, leading to increased surface energy and a strong tendency toward agglomeration driven by van der Waals and electrostatic interactions. As a result, particle clustering may occur during mixing and compaction, causing heterogeneous packing and the formation of closed porosity within the green body [27,28,29]. During firing, these agglomerates undergo localized softening, generating non-uniform viscous flow and trapping residual pores within the ceramic matrix [30].
From a sintering perspective, although fine glass particles exhibit earlier softening and melting, their excessive reactivity can be detrimental, as it promotes localized liquid-phase formation rather than uniform liquid-phase sintering. This behavior often leads to microstructural defects such as bloating, irregular pore distribution, and reduced mechanical strength, particularly at relatively low firing temperatures (<1000 °C) [31,32].
In contrast, an intermediate particle size distribution facilitates efficient particle rearrangement during compaction, resulting in higher green density and improved interfacial contact between glass and clay particles [33]. During firing, the softened glass phase progressively infiltrates intergranular voids, promoting homogeneous liquid-phase sintering, pore filling, and strong interparticle bonding [34]. Furthermore, a smoother granulometric distribution ensures a more continuous melting behavior, which is essential for controlled densification without excessive deformation [35]. Consequently, ceramic bodies incorporating this optimized glass fraction exhibit lower open porosity, higher bulk density, and enhanced mechanical performance, as confirmed by previous studies [34,35].

2.3. Raw Material Preparation for Ceramic Tile Production

Ceramic bodies were designed by combining bentonite (B1 or B2) with recycled glass waste at varying weight proportions. The glass content ranged from 30 to 50 wt.%, while the bentonite fraction was adjusted between 25 and 50 wt.% according to the targeted formulation (Table 3). Particular emphasis was placed on the glass-to-bentonite ratio, as this parameter critically governs vitrification behavior, densification kinetics, and the dimensional stability of the sintered products.
All raw materials were dry-mixed for 30 min to ensure homogeneity, followed by the controlled addition of distilled water (approximately 6 wt.%) to obtain a workable paste. The mixtures were then sealed and aged to promote uniform moisture distribution before shaping.

2.4. Shaping and Drying

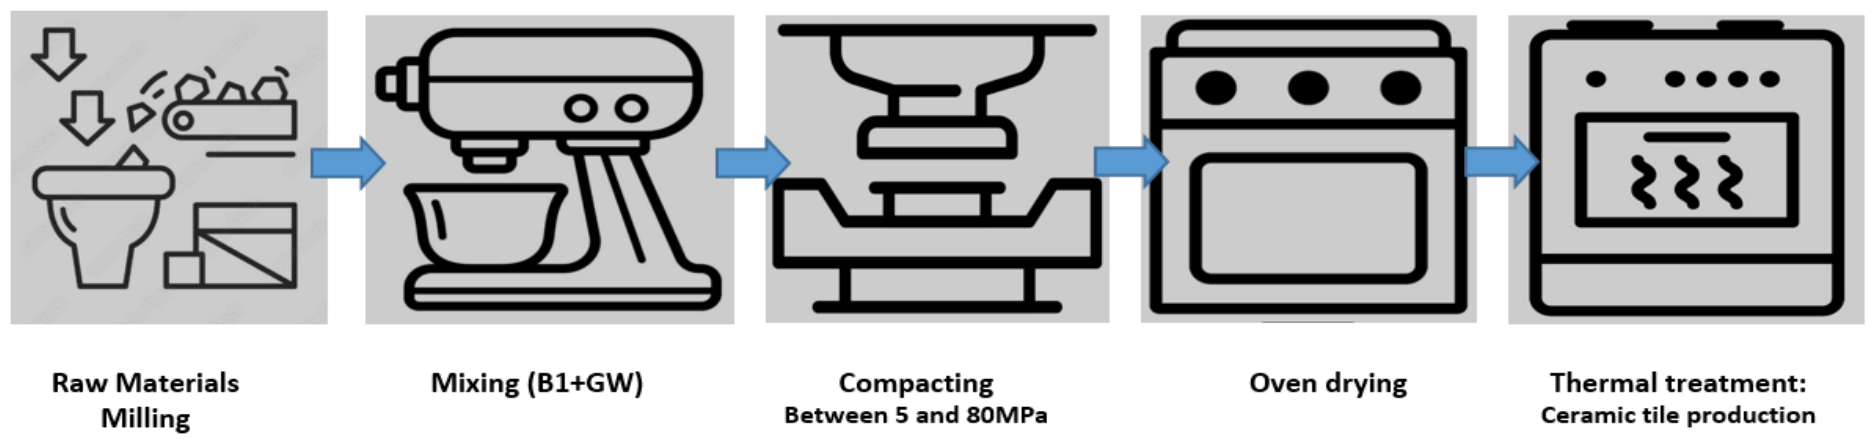
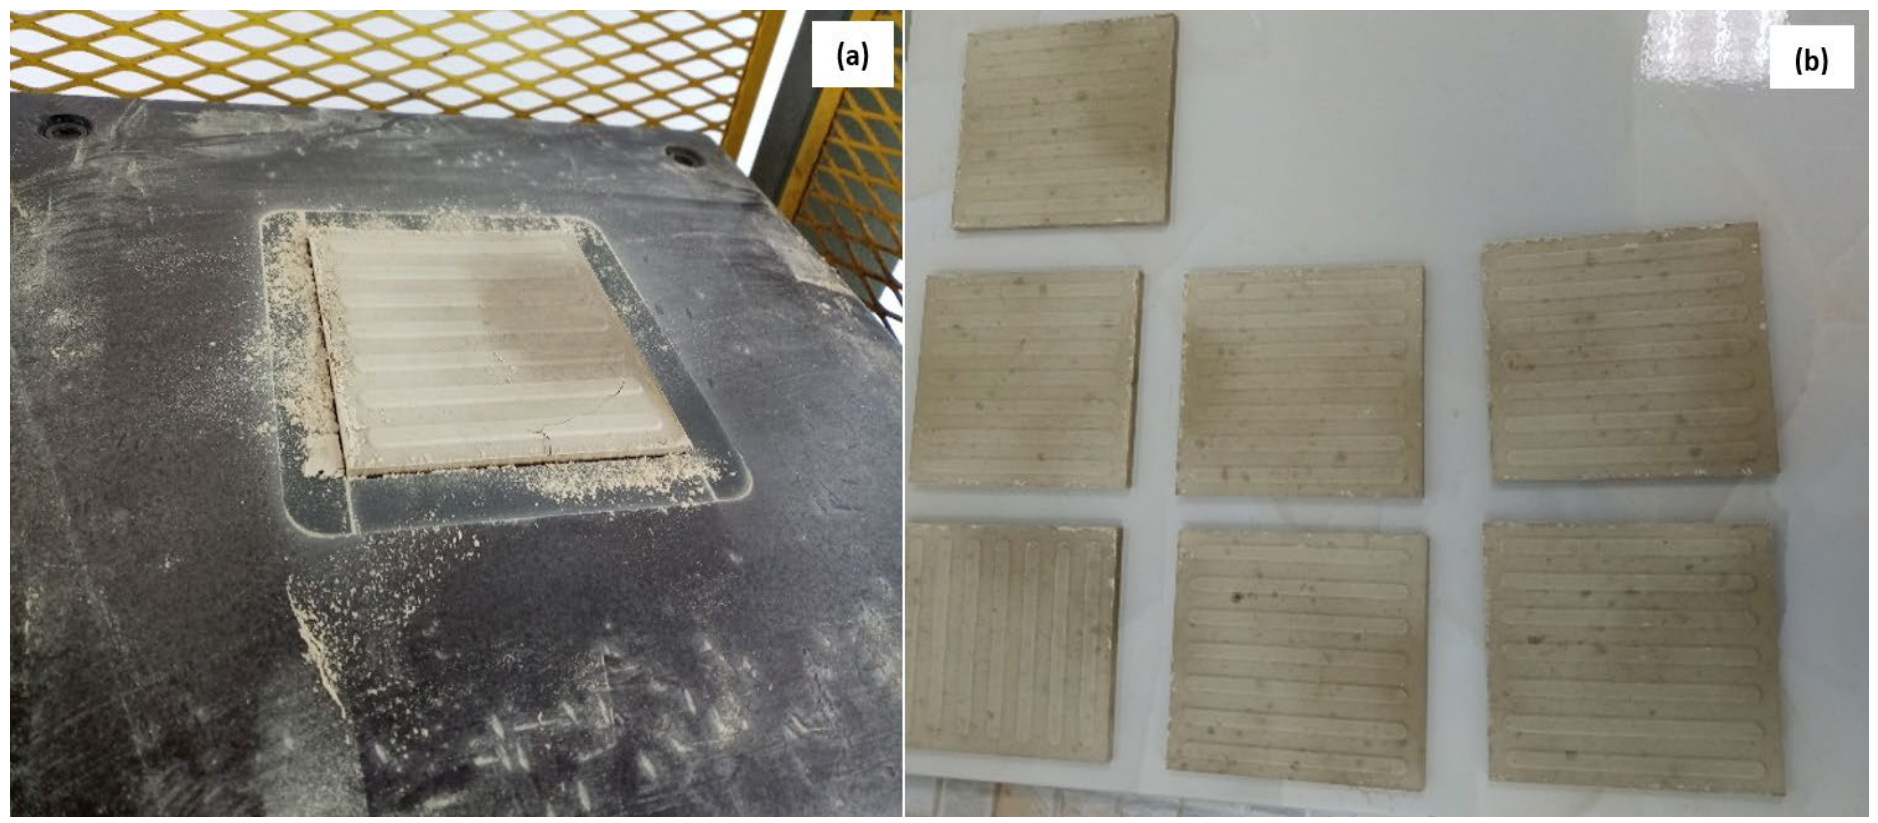
Usually, the fabrication of ceramic tiles involves three main stages: milling and mixing of raw materials, compaction, drying, and firing. First, uniaxial pressing to produce green bodies with adequate mechanical strength (Figure 5) shapes the prepared powder mixture.
The specimens are then dried to eliminate residual moisture, followed by thermal treatment at controlled temperatures (900 and 950 °C) to induce sintering, enhance densification, and develop the final mechanical properties. Shaping was mainly carried out by uniaxial pressing using a hydraulic press, two-stage uniaxial pressing procedure applied identically to ALL M1–M5 specimens at both firing temperatures (n = 5 per formulation).
Step 1—De-airing at 5 MPa: A first low-pressure compaction at 5 MPa for 20 s is applied to the spray-dried powder bed (6 wt% forming humidity, 24 h ageing) inside the die to expel air trapped between the granules. This de-airing step is essential to prevent residual air pockets that would otherwise cause lamination defects during the second pressing step and during the subsequent firing (Figure 6).
Step 2—Final compaction at 80 MPa: Immediately after de-airing, the same green body is compacted at 80 MPa for 60 s in the same die, producing a dense, crack-free green tile. Equipment: GABBRIELLI hydraulic press (Italy), 100 × 100 mm2 hardened-steel die cavity. Green-body densities (geometric method): ρ(M1) = 2.05 ± 0.04 g/cm3; ρ(M5) = 1.91 ± 0.03 g/cm3 (n = 5 specimens each). All M1–M5 samples were therefore prepared under IDENTICAL forming conditions, ensuring full comparability of the reported results. References to isostatic pressing, extrusion, and slip casting were intended only as a general overview of ceramic forming techniques.
After shaping, the specimens were dried under controlled ambient conditions (≈25 °C, relative humidity ≈ 50%) for 24 h to remove free and adsorbed water. Additional drying at 110 °C was applied to selected samples to minimize residual moisture and reduce the risk of cracking or deformation during firing. Mass and dimensional variations were monitored in order to determine drying shrinkage, green density and porosity.

2.5. Heat Treatment Conditions (Firing)

The dried specimens were fired in an electric furnace under air atmosphere using two different peak temperatures: 900 °C and 950 °C. The heating rate was fixed at 3 °C/min, followed by a soaking time at the maximum temperature to allow complete vitrification and phase development. These firing conditions were selected to evaluate the feasibility of producing semi-vitrified ceramic tiles at reduced temperatures compared to conventional stoneware processes.
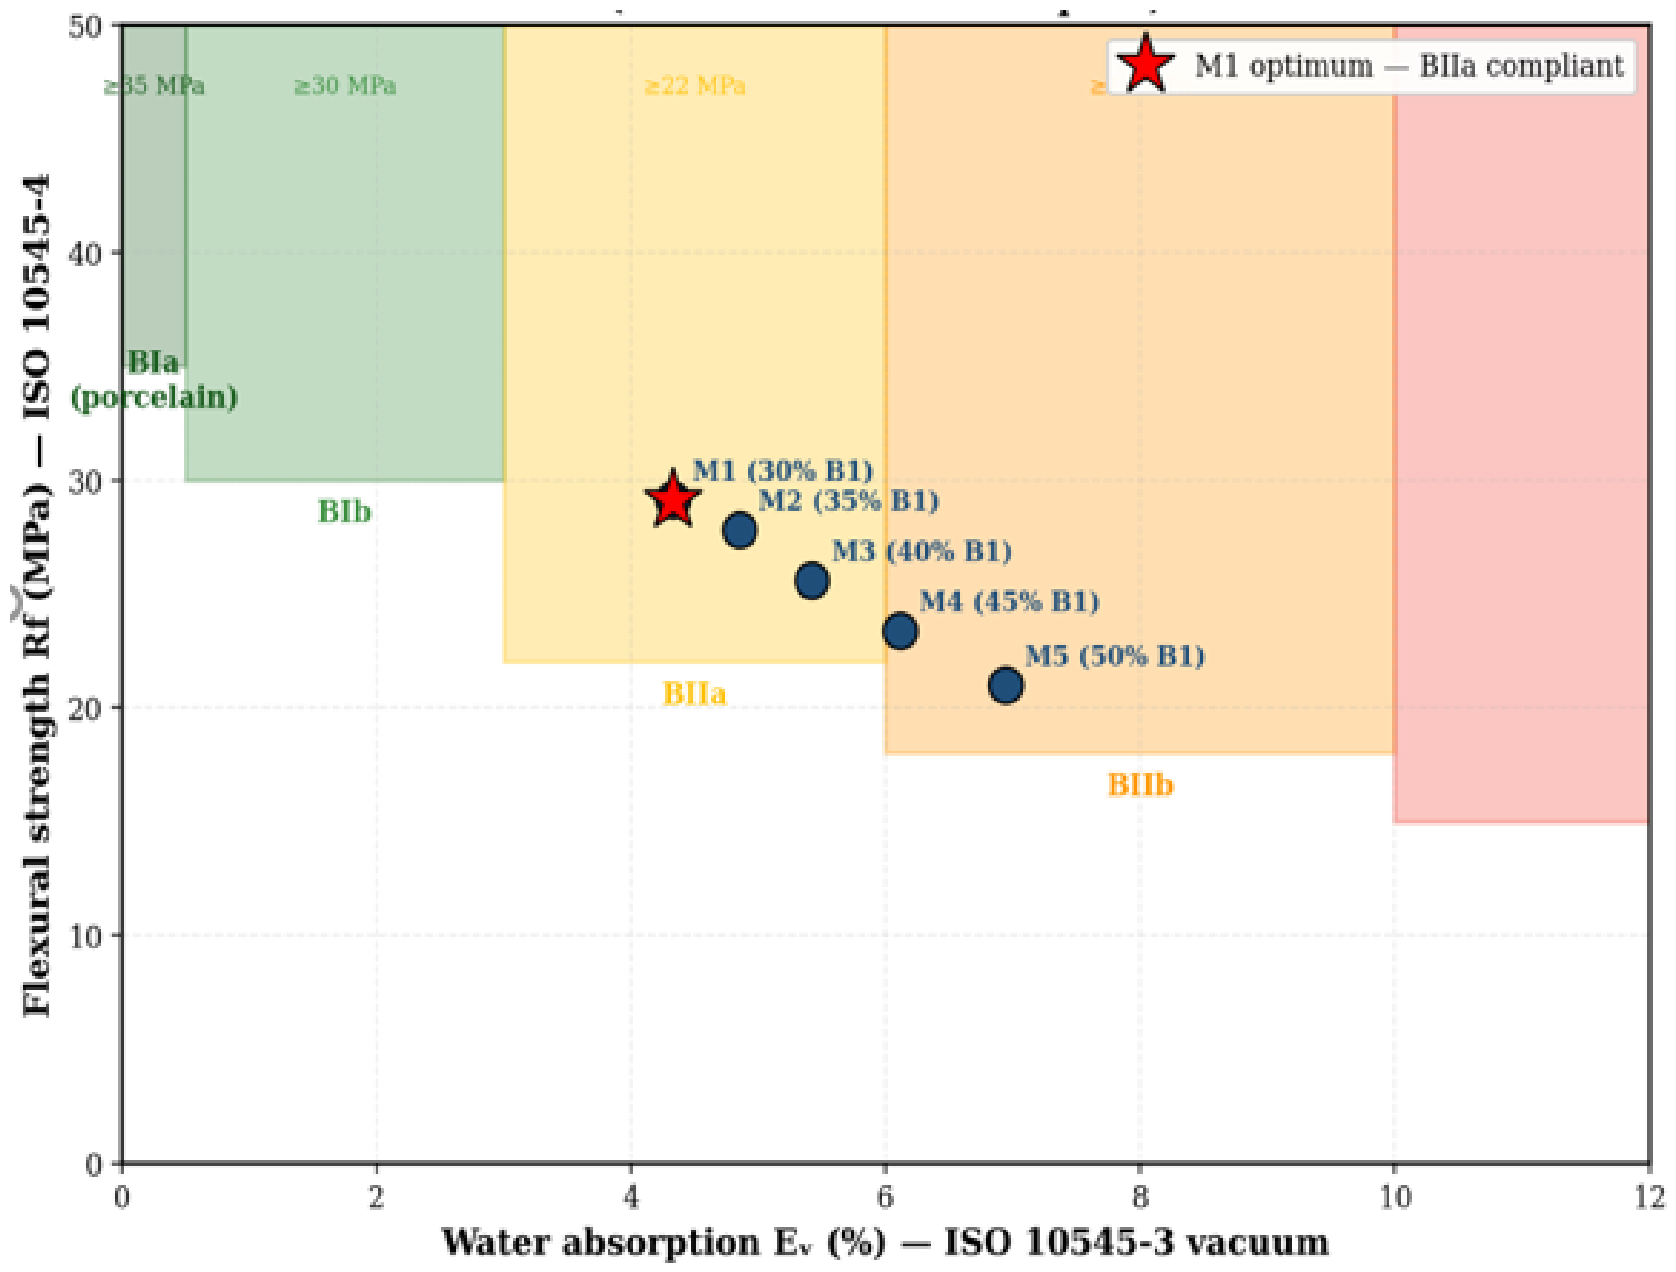
The choice of these two peak firing temperatures rests on four converging scientific and engineering criteria. (i) Thermal characterization of the cullet matrix: The glass-transition temperature (Tg) of the soda–lime cullet GW2 was measured by DSC at 757.8 °C and the dilatometric softening point at approximately 720 °C, establishing 800 °C as the practical lower bound below which viscous-flow sintering becomes impractically slow within reasonable industrial hold times. (ii) Preliminary firing screening: Exploratory firings at 850, 900, 950, established that 900 °C is the minimum temperature at which any M1–M5 formulation achieves water absorption below 7%, while 950 °C is the minimum at which M1 reaches BIIa-grade classification (Ev ≤ 6%, Rf ≥ 22 MPa). (iii) Industrial energy considerations: The 250 °C reduction relative to the conventional Algerian tile-firing range (1180–1200 °C) corresponds to approximately 40% savings in firing-stage natural-gas consumption. (iv) Pyroplasticity limit: Firings above 1000 °C (1050 °C tested) caused pronounced pyroplastic deformation of the high-cullet M1 and M2 formulations, with loss of rectangular tile shape. The 950 °C therefore represents the maximum useful firing temperature for the cullet fractions investigated. The selected 900–950 °C window is consistent with the published behaviour of CaO–Al2O3–SiO2 glass-ceramic systems showing anorthite + wollastonite crystallization between 900 and 1100 °C.

2.6. Optimization of Raw Materials for Ceramic Tile Production

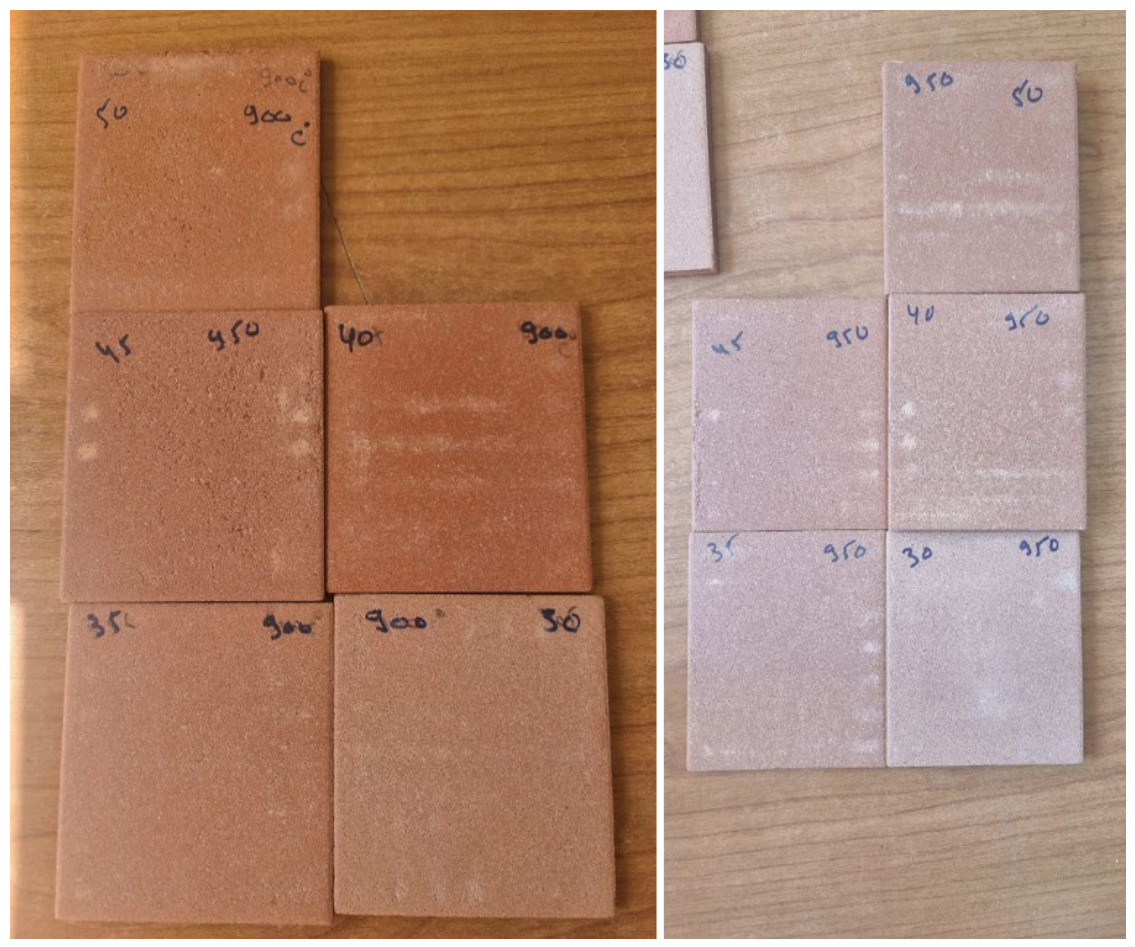
Raw material selection was guided by their ability to enhance the densification and stability of ceramic tiles, based on comprehensive physicochemical characterization and the quality of the fired products (Figure 7 and Figure 8). This approach enabled the identification of an optimized formulation capable of producing dense, dimensionally stable, and defect-free tiles at reduced firing temperatures.
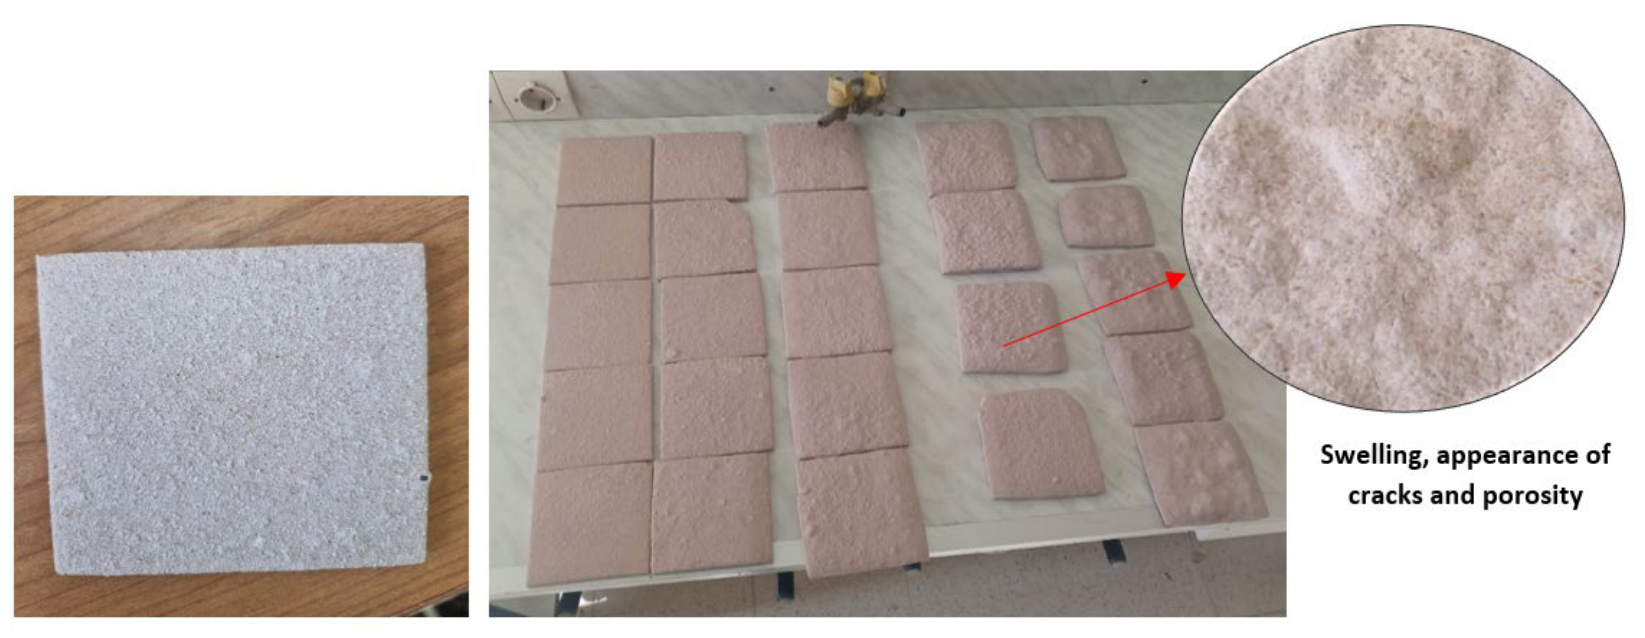
The low-CaO bentonite B1 (Tlemcen, CaO = 2.37 wt%) was identified as the most suitable clay. In contrast to B2 (CaO = 8.70 wt%), which exhibited pronounced swelling, cracking, and elevated porosity, B1 ensured superior dimensional stability and reduced defect formation. This behaviour is primarily attributed to B1’s substantially lower CaO content (2.37% vs. 8.70% for B2) and correspondingly lower carbonate fraction, which limits CO2 release during firing and prevents the bloating defects induced by gas evolution when high-CaO clays are combined with low-viscosity fluxing glass.
The figures reveal the presence of surface defects and macrocracks in ceramic tiles produced from recycled glass (GW1) combined with B2 bentonite after firing. In contrast, tiles fabricated using B1 bentonite and GW2 recycled glass exhibit a significantly improved surface quality, characterized by the absence of swelling and visible defects.
Selected Mixture Composition for the Study
The base composition of the bentonite–GW mixture used for the fabrication of ceramic tiles in this study is given in the table below (Table 4).
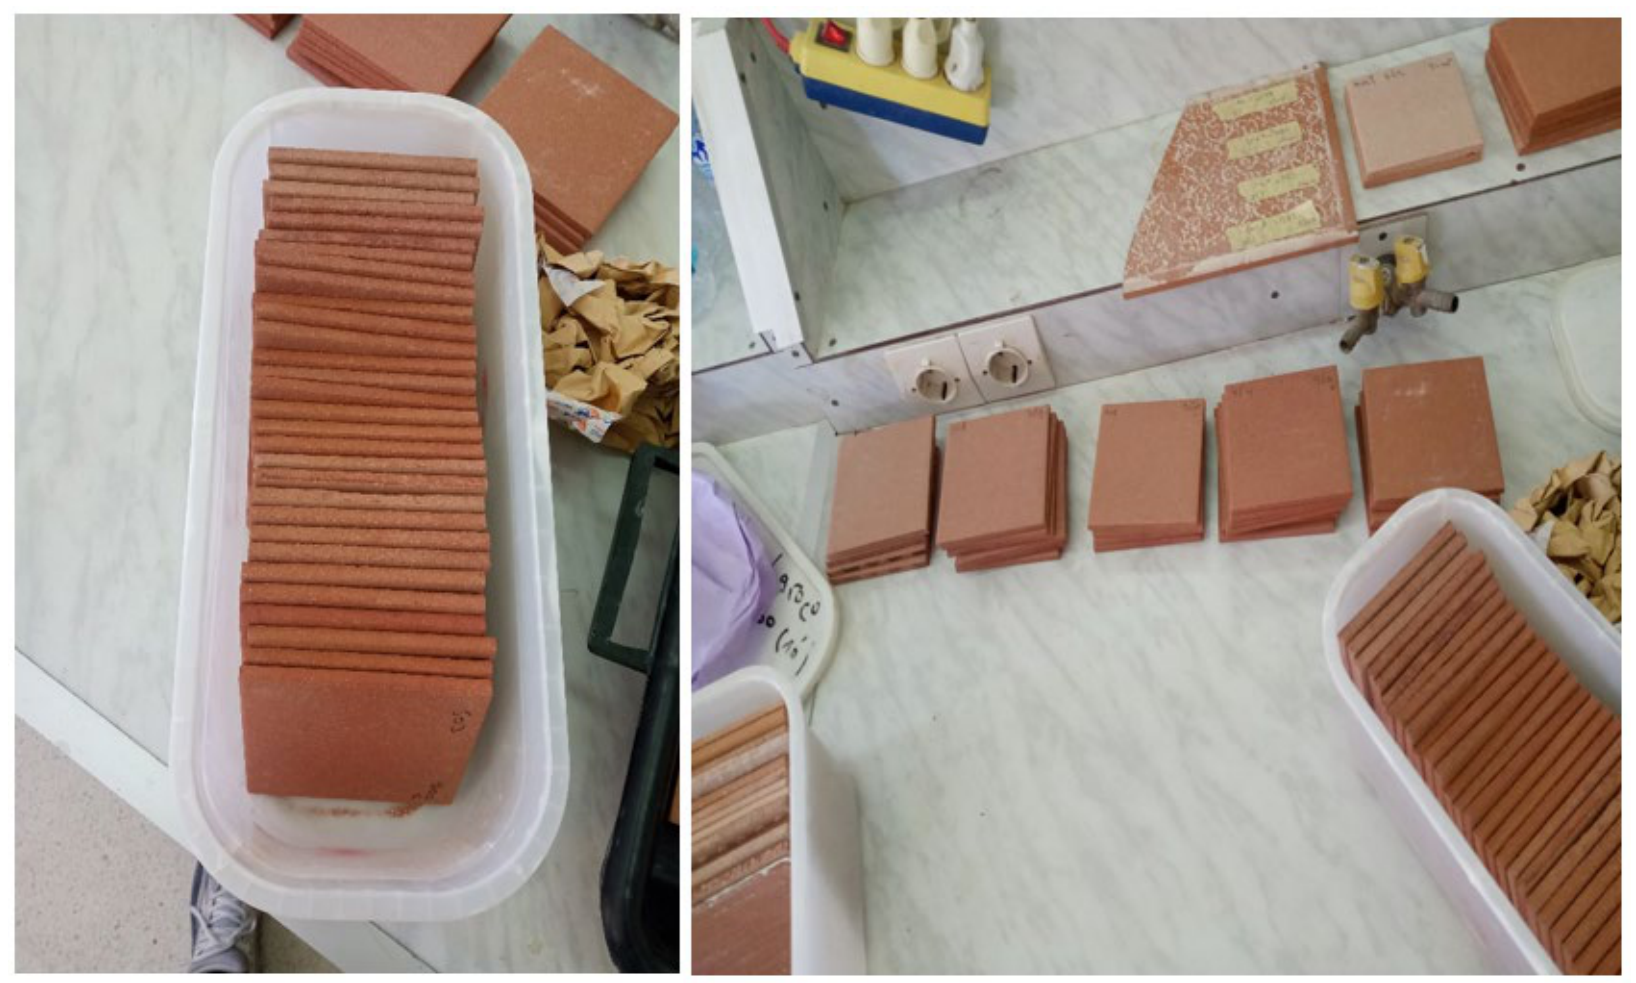
After selecting the optimal raw materials—namely B1 bentonite and recycled glass (GW2) with an intermediate particle size distribution—a comprehensive characterization of the fabricated ceramic tiles was carried out to assess their quality (Figure 9). This evaluation included the determination of key physical, mechanical, and microstructural properties, allowing verification of densification, dimensional stability, and the absence of defects. Such characterization is essential to validate the suitability of the selected formulation and to ensure that the resulting tiles meet the required performance standards.
Ceramic tiles were prepared with bentonite contents ranging from 30 to 50 wt.% and fired at 900 °C and 950 °C to evaluate the effect of composition and temperature on material performance. For each formulation, five samples were produced to ensure reproducibility. The characterization focused on physical (water absorption, porosity, shrinkage), mechanical (flexural strength, hardness), chemical (acid and alkali resistance) and thermal properties (conductivity and heat specific). Microstructural analysis using optical microscopy and SEM was also performed to understand the relationship between structure and properties. This approach allows the identification of optimal compositions and processing conditions for producing dense, stable and high-performance ceramic tiles.

3. Results

3.1. Processing Behavior and Dimensional Evolution During Sintering

Dimensional changes during drying and firing are key indicators of ceramic tile stability and quality. In this study, shrinkage is mainly influenced by bentonite content and firing temperature. Bentonite provides plasticity and structural support, while recycled glass acts as a flux, promoting vitrification and densification during sintering.

3.1.1. Drying Shrinkage and Early-Stage Structural Consolidation

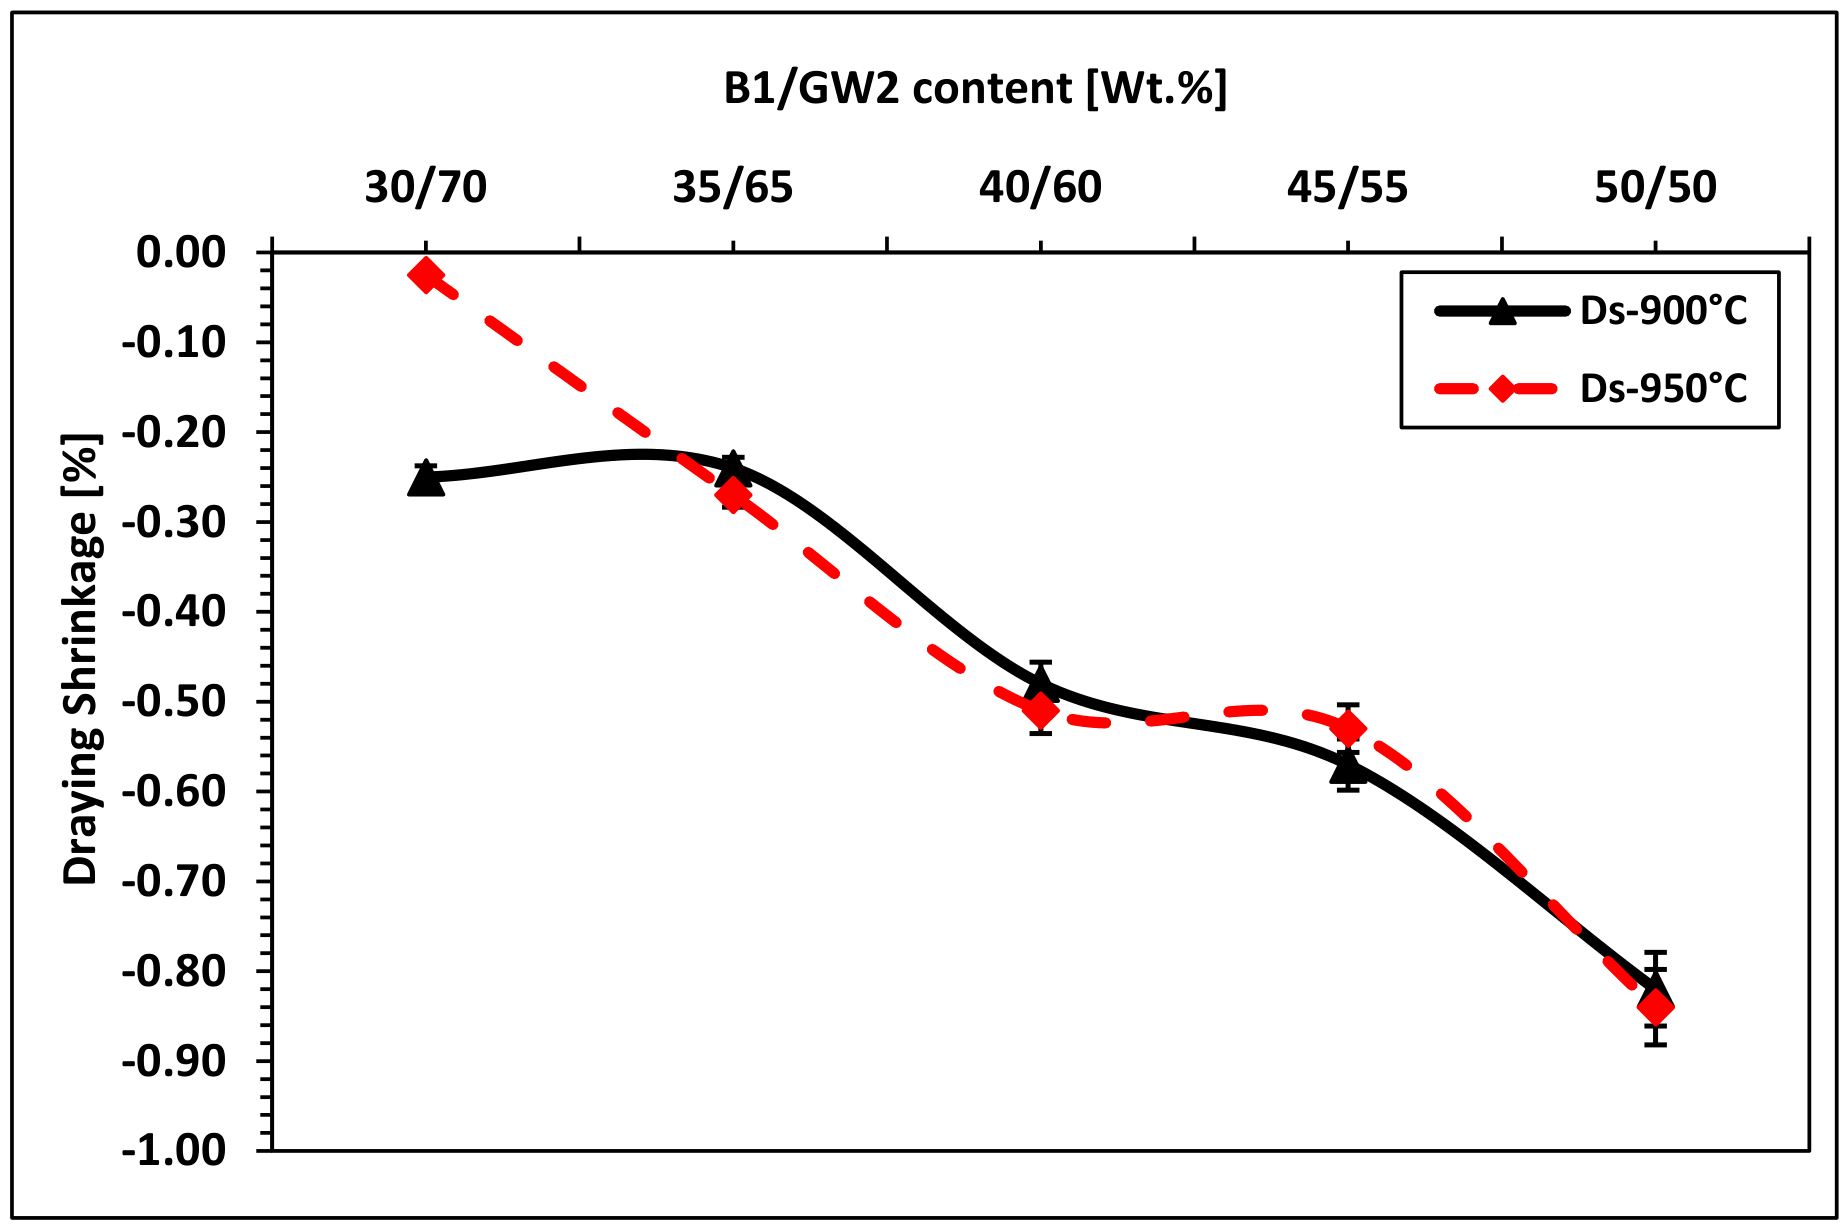
Drying shrinkage corresponds to the dimensional contraction that occurs during the removal of water from the green body after shaping. This shrinkage is mainly related to the evaporation of free water and interlayer water contained in bentonite. The results indicate that drying shrinkage values are very similar for the specimens intended for firing at 900 °C (DS-1) and 950 °C (DS-2). This behavior is expected, as drying shrinkage occurs prior to thermal treatment and is therefore independent of the final firing temperature (see Figure 10).
For both series, drying shrinkage increases progressively with bentonite content, ranging from approximately −0.25% at 30 wt.% bentonite to about −0.82% to −0.84% at 50 wt.%. Intermediate compositions exhibit moderate shrinkage values, with approximately −0.24% to −0.27% at 35 wt.%, around −0.48% to −0.51% at 40 wt.%, and approximately −0.53% to −0.57% at 45 wt.%.
This systematic increase can be attributed to the intrinsic mineralogical nature of bentonite. Montmorillonite, the predominant clay mineral, is characterized by a layered structure, high specific surface area, and strong water adsorption capacity. During drying, the removal of physically adsorbed and interlayer water induces a progressive reduction in interlayer spacing, resulting in the contraction of the clay framework and consequently higher shrinkage with increasing clay content [33,34,35,36,37]. These observations are consistent with previous studies on clay-rich systems. Dondi et al. and Souza et al. reported that drying shrinkage in bentonite-based ceramic formulations is primarily governed by the hydration–dehydration behavior of smectitic clays, particularly montmorillonite, due to its expandable interlayer structure [33,38]. Similarly, recent work by Carbajal et al. (2007) confirmed that increasing clay fraction systematically enhances drying shrinkage as a result of intensified capillary stresses and interlayer water loss during dehydration [34]. The obtained results confirm that drying shrinkage is mainly controlled by the bentonite content and its associated water adsorption–desorption behavior, while remaining unaffected by the subsequent firing temperature.
Despite this increase, the overall magnitude of drying shrinkage remains relatively low (less than 1%), indicating good dimensional stability during drying and confirming that the particle packing and drying conditions were well controlled during sample preparation [32].

3.1.2. Firing Shrinkage and Liquid-Phase Sintering Mechanisms

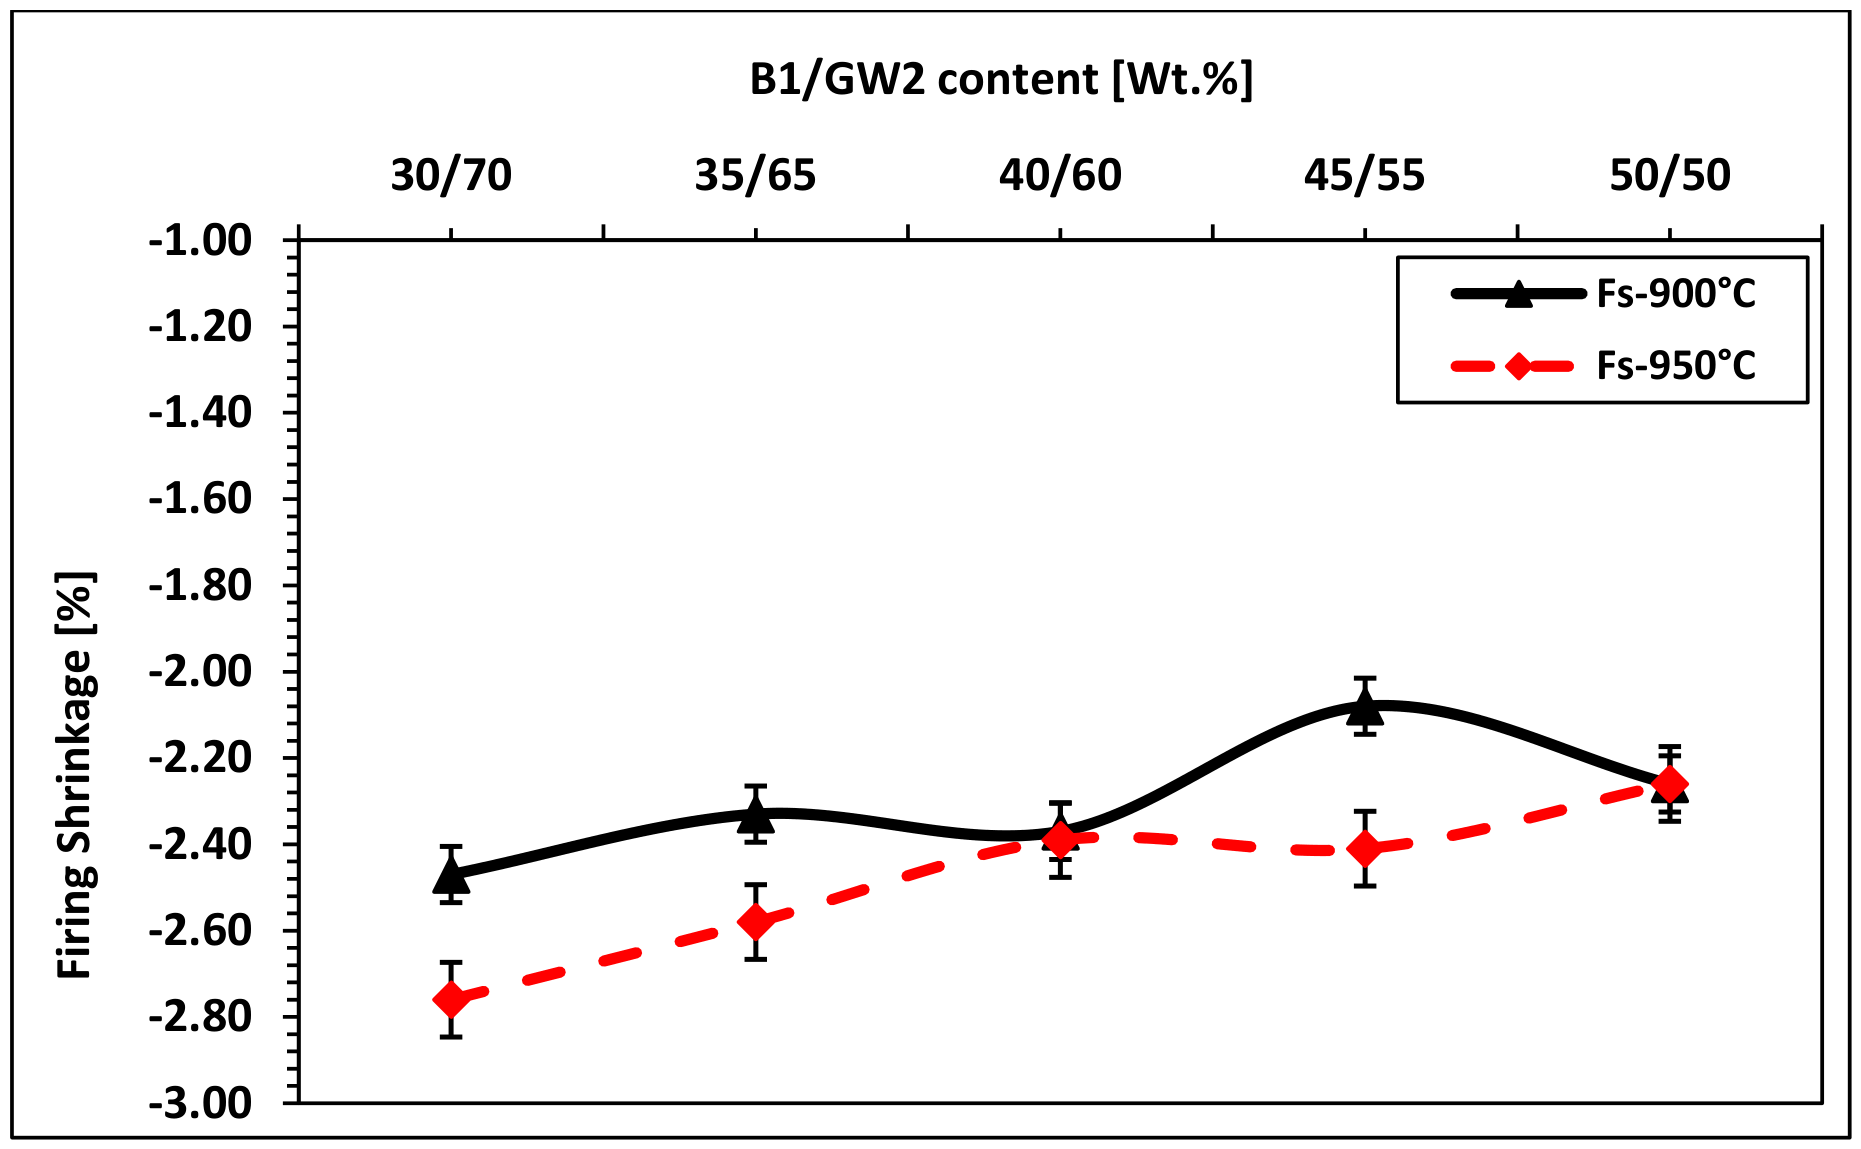
Firing shrinkage represents the dimensional contraction occurring during thermal treatment as a result of sintering and vitrification processes. During heating, several physicochemical transformations take place, including mineral decomposition, particle diffusion and the formation of a viscous liquid phase originating from the partial melting of recycled glass [15]. For samples fired at 900 °C, firing shrinkage values remain moderate and range approximately between −2.08% and −2.47% depending on the bentonite content (Figure 11). The lowest value is observed for the formulation containing 45 wt.% bentonite (−2.08%), while higher shrinkage values close to −2.47% are observed for compositions containing around 30 wt.% bentonite.
These values indicate the beginning of vitrification. At this temperature, recycled soda–lime glass begins to soften, forming a viscous phase that partially fills the interparticle pores. However, the viscosity of this liquid phase remains relatively high, which limits the complete densification of the ceramic body [33,35]. When the firing temperature increases to 950 °C, firing shrinkage becomes slightly more pronounced. The Rc values generally range between approximately −2.19% and −2.55%. The highest shrinkage value is observed for the 30 wt.% bentonite composition (−2.55%), while intermediate compositions show values around −2.37% to −2.46%. This increase in shrinkage is associated with enhanced liquid-phase sintering. At 950 °C, recycled glass melts more extensively and forms a lower-viscosity liquid phase that can flow more easily between clay particles (Figure 11). This viscous flow promotes stronger grain contacts and accelerates pore closure, leading to improved densification of the ceramic matrix [34].

3.1.3. Total Shrinkage and Dimensional Stability of the Glass–Bentonite System

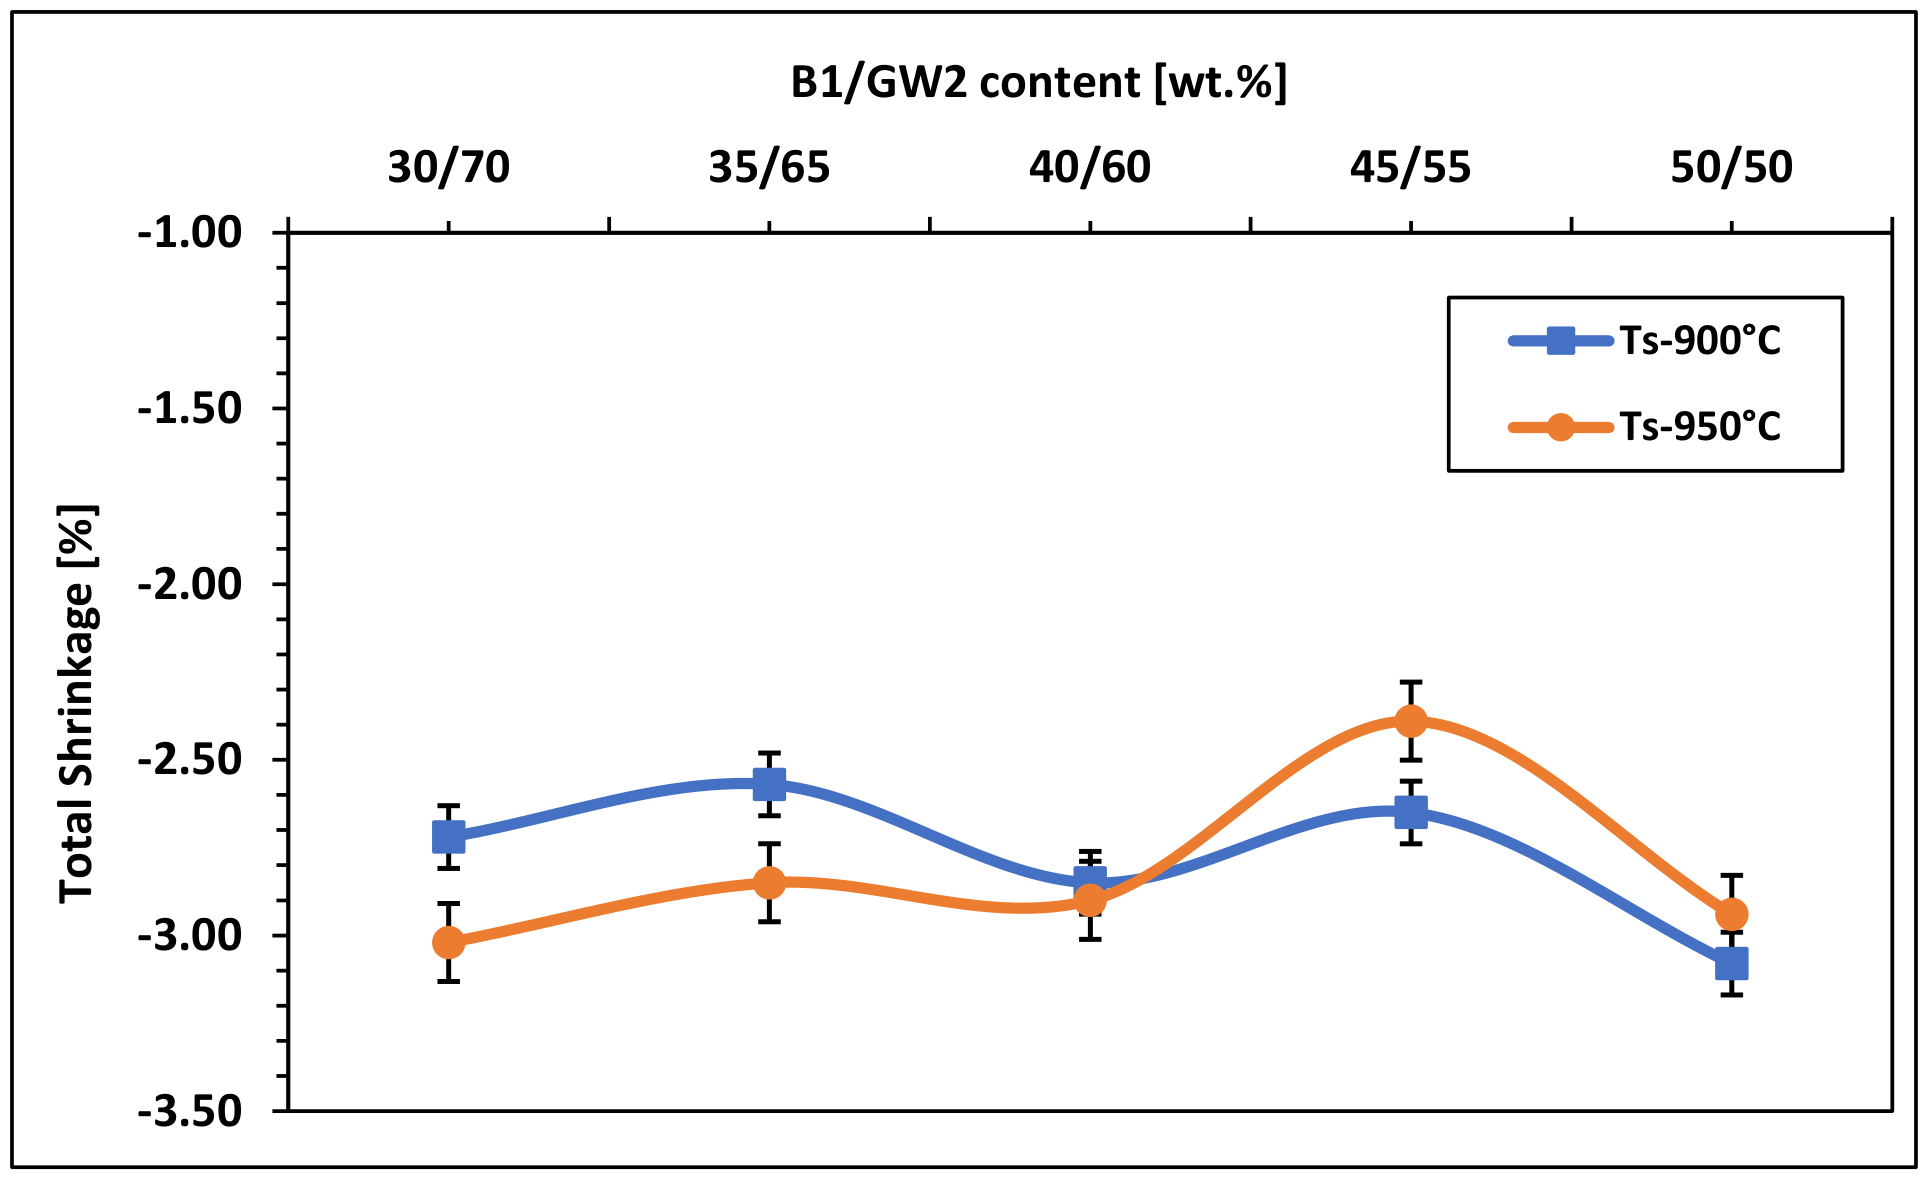
Total shrinkage corresponds to the overall dimensional contraction between the initial green body and the final fired product. It therefore reflects the combined effects of drying shrinkage and firing shrinkage [34,35]. For samples fired at 900 °C, total shrinkage values vary between approximately −2.85% and −3.11%. The lowest shrinkage value is observed for the composition containing 35 wt.% bentonite (−2.85%), while the highest value of −3.11% corresponds to the formulation containing 50 wt.% bentonite.
At 950 °C, the total shrinkage values remain relatively similar but slightly lower for some compositions, ranging between approximately −2.57% and −3.08% (Figure 12). The lowest shrinkage value is again observed for the 35 wt.% bentonite composition (−2.57%), while the highest value is recorded for 50 wt.% bentonite (−3.08%).
The obtained results given in Figure 12, indicate that compositions containing 30–35 wt.% bentonite exhibit the most favorable dimensional stability. In this range, the recycled glass content remains sufficiently high to ensure effective vitrification and the development of a continuous glassy phase, while the bentonite fraction provides adequate plasticity and green strength during shaping, facilitating defect-free forming [35]. In contrast, when the bentonite content increases to 50 wt.%, the relative reduction in glass fraction limits the formation of a continuous liquid phase during firing. This leads to less efficient densification and a slight increase in shrinkage, reflecting a less effective sintering mechanism and reduced structural accommodation during thermal treatment. These observations are consistent with previous studies reporting that an optimal balance between clay and glass phases is essential to achieve controlled densification and dimensional stability in glass–ceramic systems. For instance, Andreola et al. and Dondi et al. demonstrated that excessive clay content reduces liquid-phase continuity during firing, thereby increasing shrinkage variability and limiting vitrification efficiency [1,33]. More recently, Chen et al. (2008) confirmed that intermediate compositions in clay–glass systems favor a synergistic interaction between plastic forming behavior and liquid-phase sintering, resulting in improved dimensional control and microstructural homogeneity [30]. Generally, the results demonstrate that the glass–bentonite system exhibits stable dimensional behavior, particularly for intermediate compositions, where the optimized balance between clay plasticity and glass vitrification promotes efficient sintering and structural stability during firing.

3.1.4. Mass Loss and Thermochemical Transformations

Mass loss during firing is a fundamental indicator of the physicochemical transformations occurring within ceramic bodies, reflecting processes such as evaporation of physically adsorbed water, dehydroxylation of clay minerals, decomposition of carbonates, and release of structurally bound hydroxyl groups. These reactions are strongly dependent on both firing temperature and raw material composition, particularly the clay-to-glass ratio.
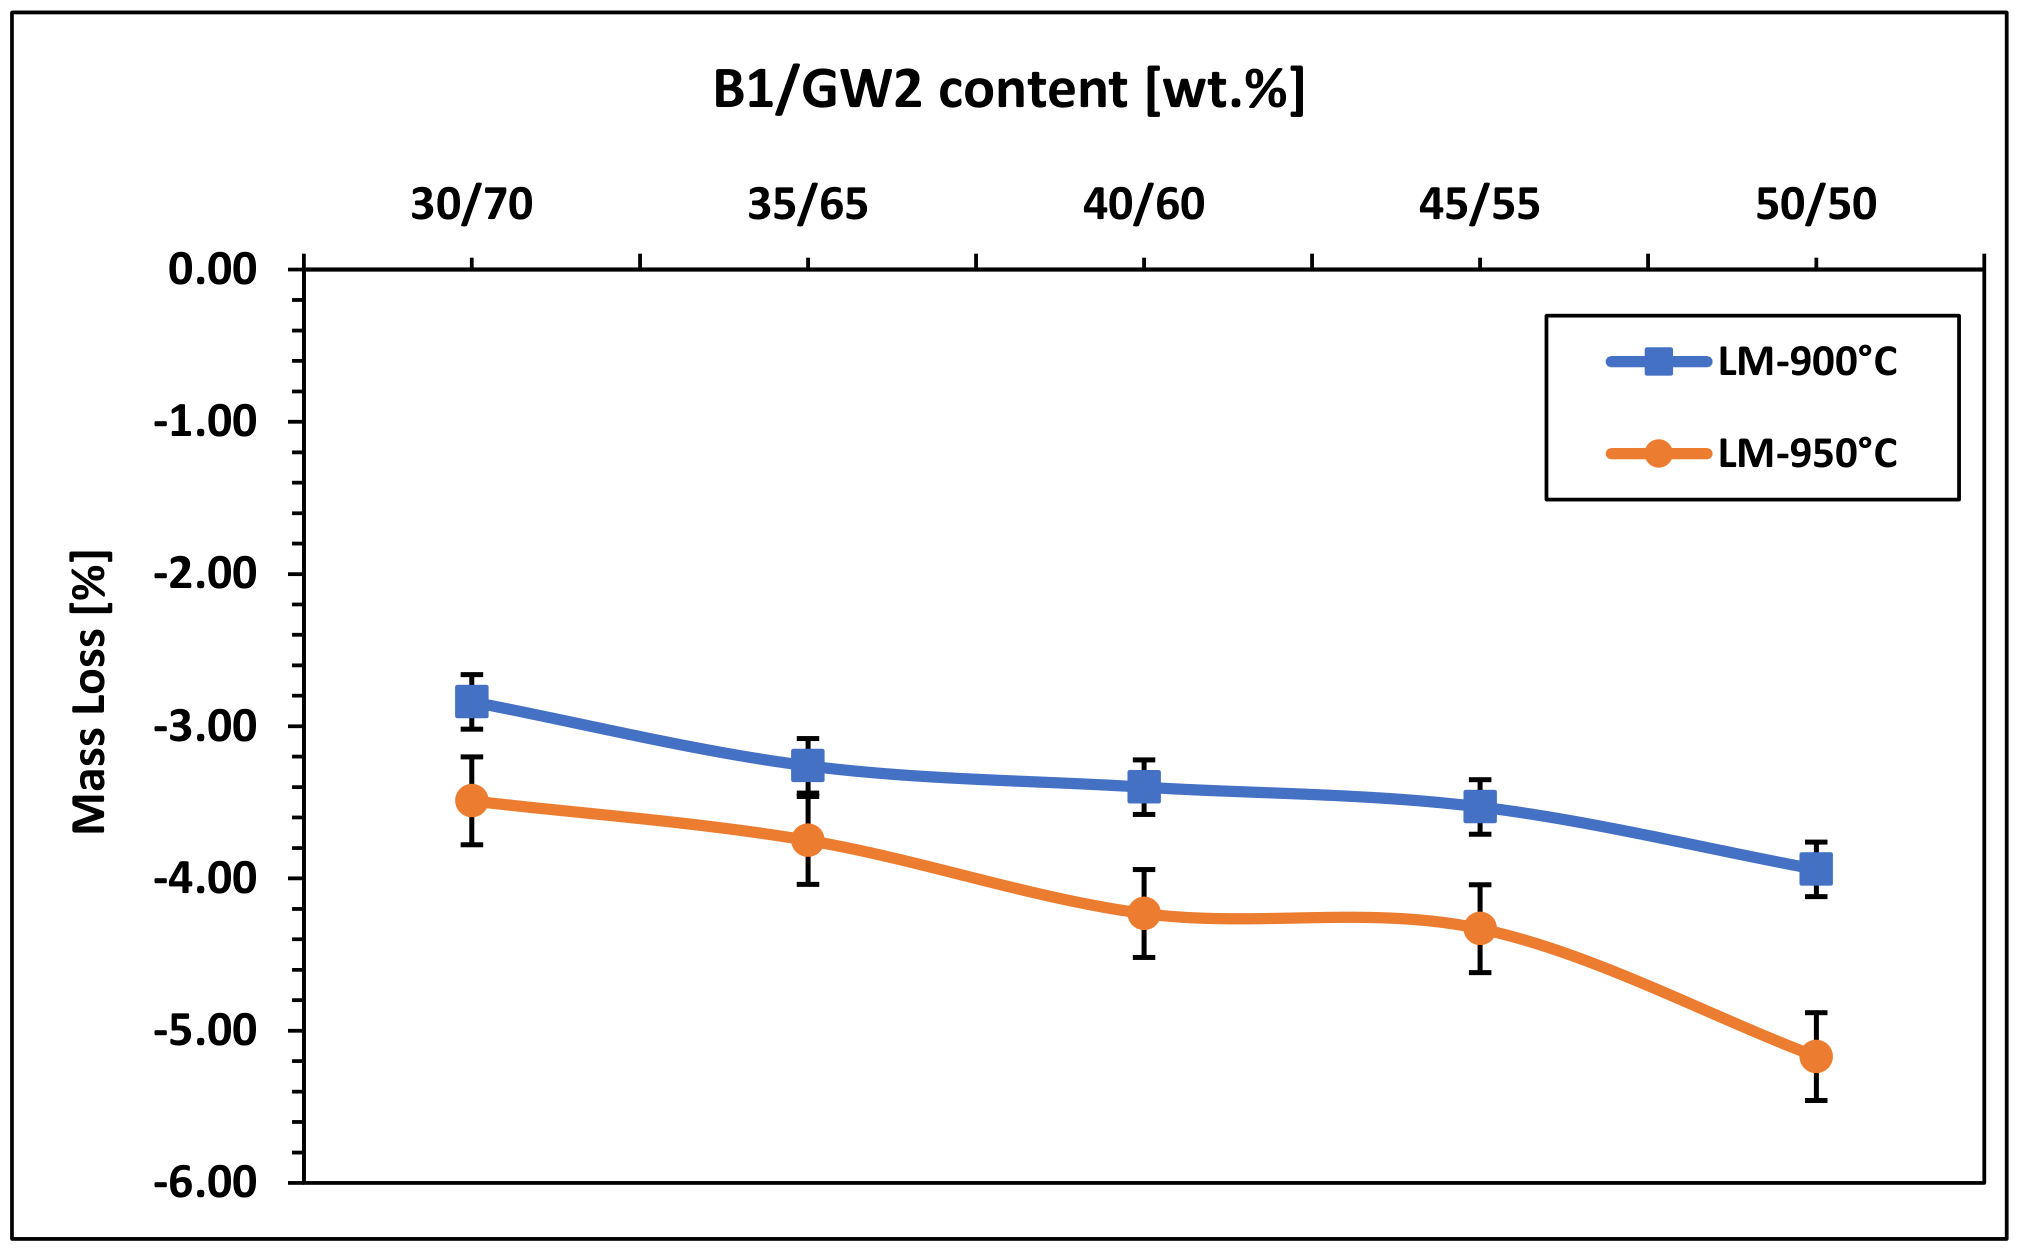
The experimental results indicate that mass loss slightly increases with increasing firing temperature and varies with bentonite content (Figure 12). At 900 °C, the recorded values range from approximately −2.84% to −3.94%, depending on the formulation. Lower mass loss is generally associated with higher bentonite contents, while slightly higher losses are observed in compositions with reduced clay fraction, which is consistent with a greater proportion of thermally reactive phases.
These findings are in good agreement with previous studies on clay–glass ceramic systems. Similar trends have been reported by several authors, who observed that mass loss is primarily governed by dehydroxylation of montmorillonite-rich clays and decarbonation reactions, typically occurring between 400 °C and 900 °C, with limited additional losses at higher temperatures due to the stabilization of the vitreous phase [33,36,37]. Also, Souza et al. (2011) confirmed that increasing glass content tends to slightly reduce overall mass loss, as glass acts as a thermally stable phase with negligible volatile release, thereby diluting the effect of clay decomposition [38]. Overall, the obtained results confirm that mass loss in the investigated ceramic bodies is mainly controlled by the proportion of clay minerals and the extent of their dehydroxylation, while recycled glass contributes to stabilizing the system during thermal treatment by limiting further mass reduction at elevated temperatures.
When the firing temperature is increased to 950 °C, the mass loss shows a slight but noticeable increase, reaching values of up to approximately −3.49% to −5.17% (Figure 13). This phenomena maybe is attributed to the intensification of thermally activated reactions at higher temperature, particularly the more complete dehydroxylation of montmorillonite and the decomposition of residual minor mineral phases, resulting in the release of additional volatile species. The relatively limited difference in mass loss between 900 °C and 950 °C indicates that the majority of volatile components are already eliminated at lower temperatures. This suggests that the main physicochemical transformations, including dehydration and the initial stages of dehydroxylation, predominantly occur up to around 900 °C, whereas only minor residual reactions continue at 950 °C (Figure 13). Moreover, recycled soda–lime glass does not significantly contribute to mass loss, as it does not undergo decomposition within this temperature range but rather softens and participates in viscous flow sintering. Its main role is therefore associated with the formation of a liquid phase that enhances densification through pore filling and particle rearrangement. These results are consistent with previous studies on clay–glass ceramic systems. Dondi et al. (2014) reported that mass loss in montmorillonite-rich systems is mainly governed by dehydration and dehydroxylation processes occurring below 900–950 °C, while further heating leads only to minor additional losses due to the stabilization of the vitreous phase [33]. Similarly, Tucci et al. (2004) confirmed that soda–lime glass acts as a thermally stable phase in ceramic formulations, contributing to densification rather than volatilization, and therefore having a negligible effect on total mass loss [37]. The moderate increase in mass loss at 950 °C confirms the progressive completion of clay mineral transformations and highlights the thermal stability of the glass–bentonite system within the investigated firing range.
A strong correlation is observed between shrinkage, mass loss and densification behavior, highlighting the coupled nature of thermochemical transformations and microstructural evolution during sintering [38,39].
At 900 °C, firing shrinkage values range between −2.08% and −2.47%, while mass loss varies between −2.26% and −2.47%. These moderate values indicate the initial stage of sintering, where partial decomposition of clay minerals and limited softening of the glass phase occur. At this stage, densification remains incomplete due to the relatively high viscosity of the liquid phase. When the temperature increases to 950 °C, both shrinkage and mass loss show a slight increase. The firing shrinkage reaches up to −2.55%, while mass loss increases to approximately −2.76%. This behavior reflects enhanced densification driven by liquid-phase sintering. The increased mass loss facilitates structural rearrangement by removing volatile components, while the more fluid glass phase improves particle packing and promotes pore closure. The interaction between these mechanisms leads to a more compact and homogeneous microstructure at higher temperature. However, this correlation is strongly influenced by the bentonite content. For ceramic tiles containing 30–35 wt.% bentonite, an optimal balance is achieved, with moderate shrinkage (≈−2.57% to −2.85% total shrinkage) and controlled mass loss, resulting in efficient densification and good structural stability. In contrast, at higher bentonite content (50 wt.%), total shrinkage increases up to −3.08%, while densification becomes less efficient. This is due to the reduced proportion of recycled glass, which limits the formation of a continuous liquid phase necessary for effective sintering [40].

3.2. Density Evolution

The densification of glass–bentonite ceramics is mainly controlled by liquid-phase sintering during firing. Recycled glass softens and forms a viscous phase that fills pores and improves particle packing, while bentonite undergoes mineral transformations that contribute to structural stability. The combined effect of viscous flow, diffusion and crystallization leads to a denser and more homogeneous microstructure.
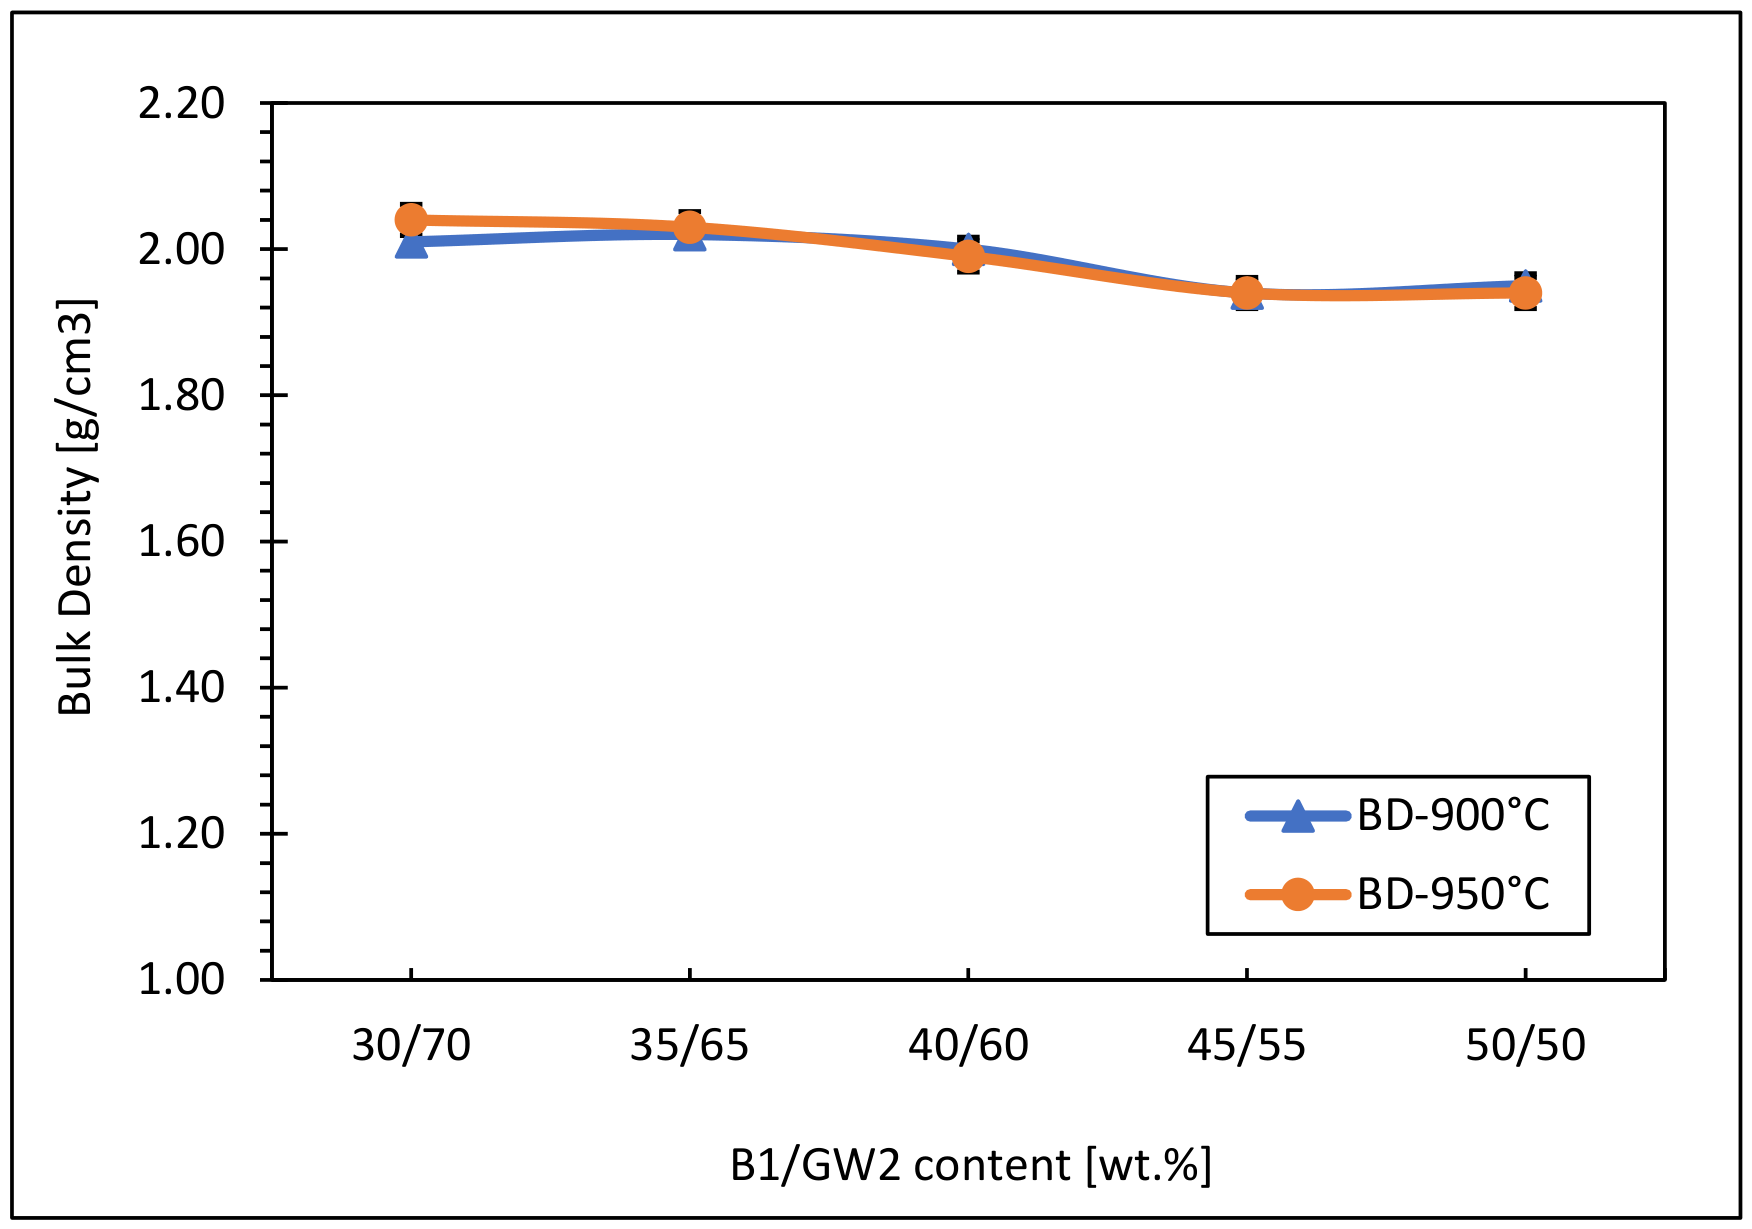
The apparent density evolution reflects the progressive densification of the ceramic body during firing. The obtained results are given in Figure 14. At 900 °C, the density values remain relatively moderate, ranging between approximately 1.94 and 2.02 g·cm−3. This indicates that densification is still limited, as the viscous phase formed from recycled glass is not sufficiently developed. The sintering process is mainly controlled by solid-state diffusion and partial particle rearrangement, leaving a significant amount of residual porosity.
At 950 °C, the density increases noticeably, reaching values between approximately 1.99 and 2.06 g·cm−3 (Figure 14). This improvement confirms enhanced vitrification and more effective pore closure due to the formation of a more fluid liquid phase. The increased mobility of the glass phase promotes better packing and stronger interparticle bonding. The increase in density with temperature clearly demonstrates the transition from initial sintering to more advanced liquid-phase densification [38,39].

3.3. Porosity and Water Absorption

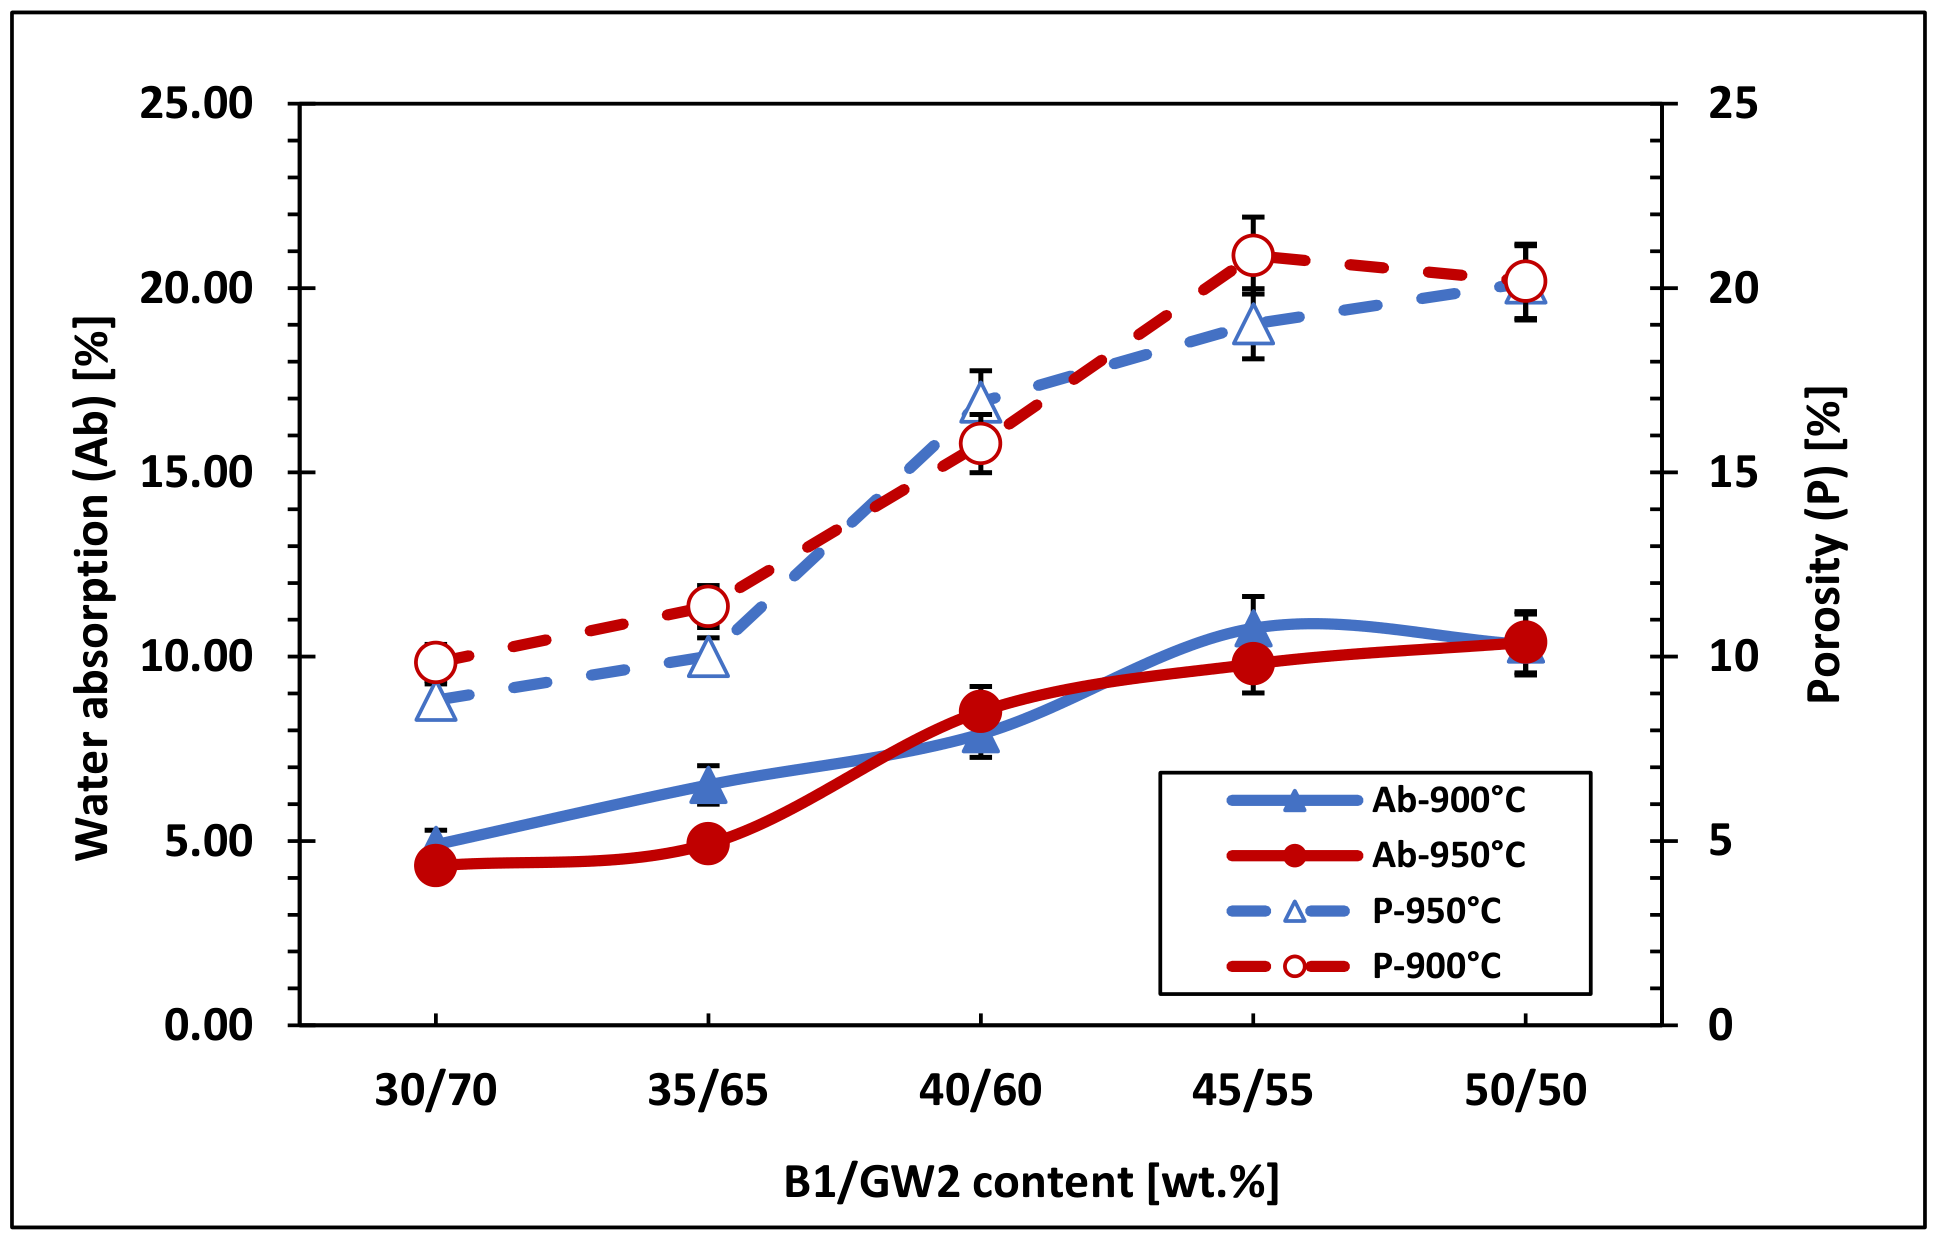
The porosity and water absorption results of the investigated ceramic tiles are presented in (Figure 15). Porosity and water absorption are directly related to the volume and connectivity of pores within the ceramic structure, and are key indicators of densification and microstructural quality [40,41,42]. At 900 °C, porosity values range from approximately 9.84% to 20.88%, while water absorption varies between 4.90% and 10.77%. The lowest values correspond to 30 wt.% bentonite, whereas higher bentonite contents (45–50 wt.%) lead to a significant increase in both parameters. This indicates incomplete densification and the presence of interconnected open pores [40].
At 950 °C, compositions with low bentonite content exhibit improved densification, with porosity and water absorption decreasing to 8.82% and 4.33%, respectively, for 30 wt.% bentonite. This improvement is attributed to the enhanced softening of recycled glass, which generates a low-viscosity liquid phase that promotes viscous flow, particle rearrangement, and pore filling during liquid-phase sintering. As a result, a continuous vitreous network is formed, reducing open porosity and improving microstructural homogeneity [39,40]. In contrast, higher bentonite contents lead to increased residual porosity and water absorption (up to 20.14% and 10.39%, respectively), due to the reduced glass fraction and limited vitrification. Although bentonite contributes reactive aluminosilicate species through the thermal transformation of montmorillonite, excessive amounts restrict the development of a sufficient liquid phase, hindering pore closure and densification [41,42]. Therefore, compositions containing 30–35 wt.% bentonite achieve the most favorable balance between glassy matrix formation and crystalline phase development, resulting in superior densification and structural stability [42,43,44].

3.4. Mechanical Performance of the Ceramic Composites

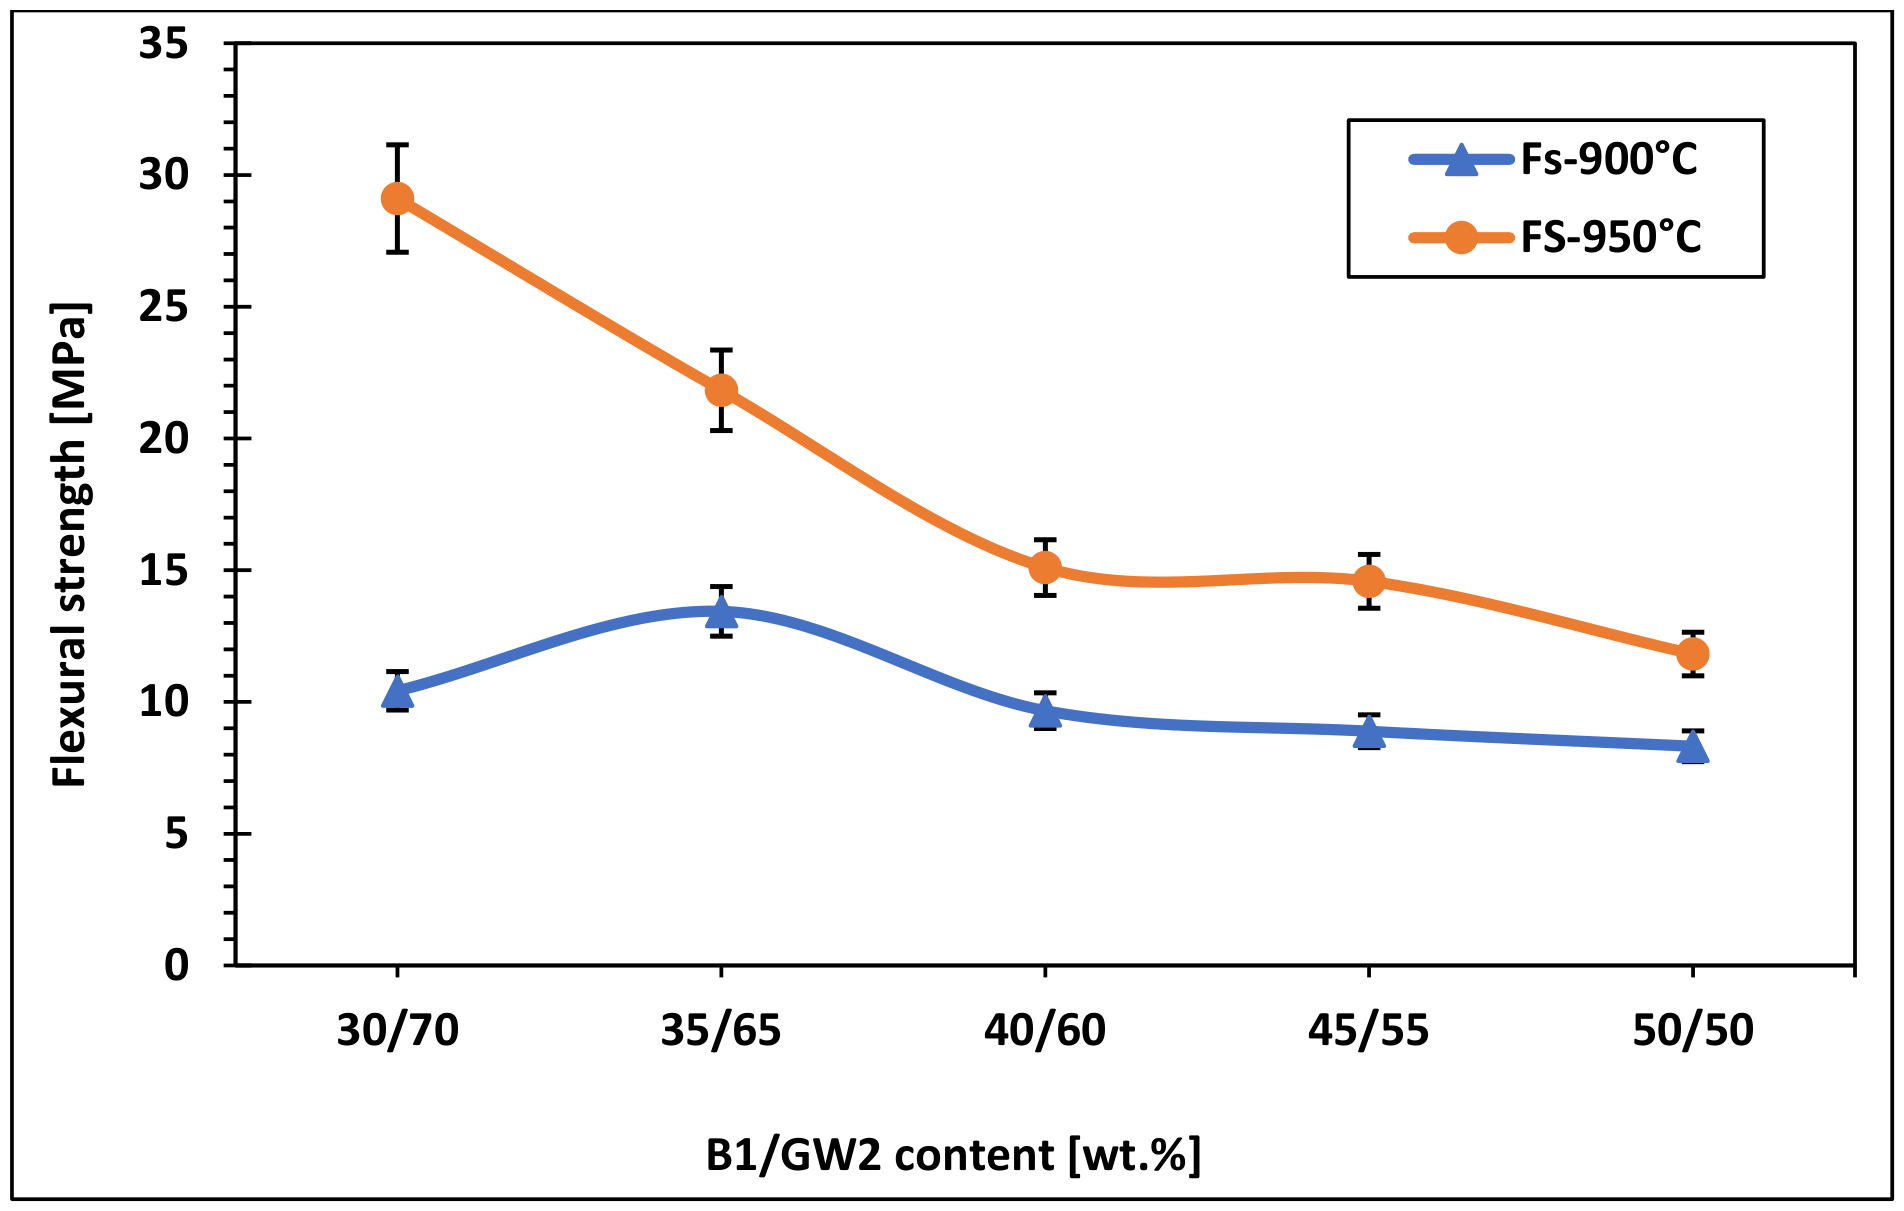
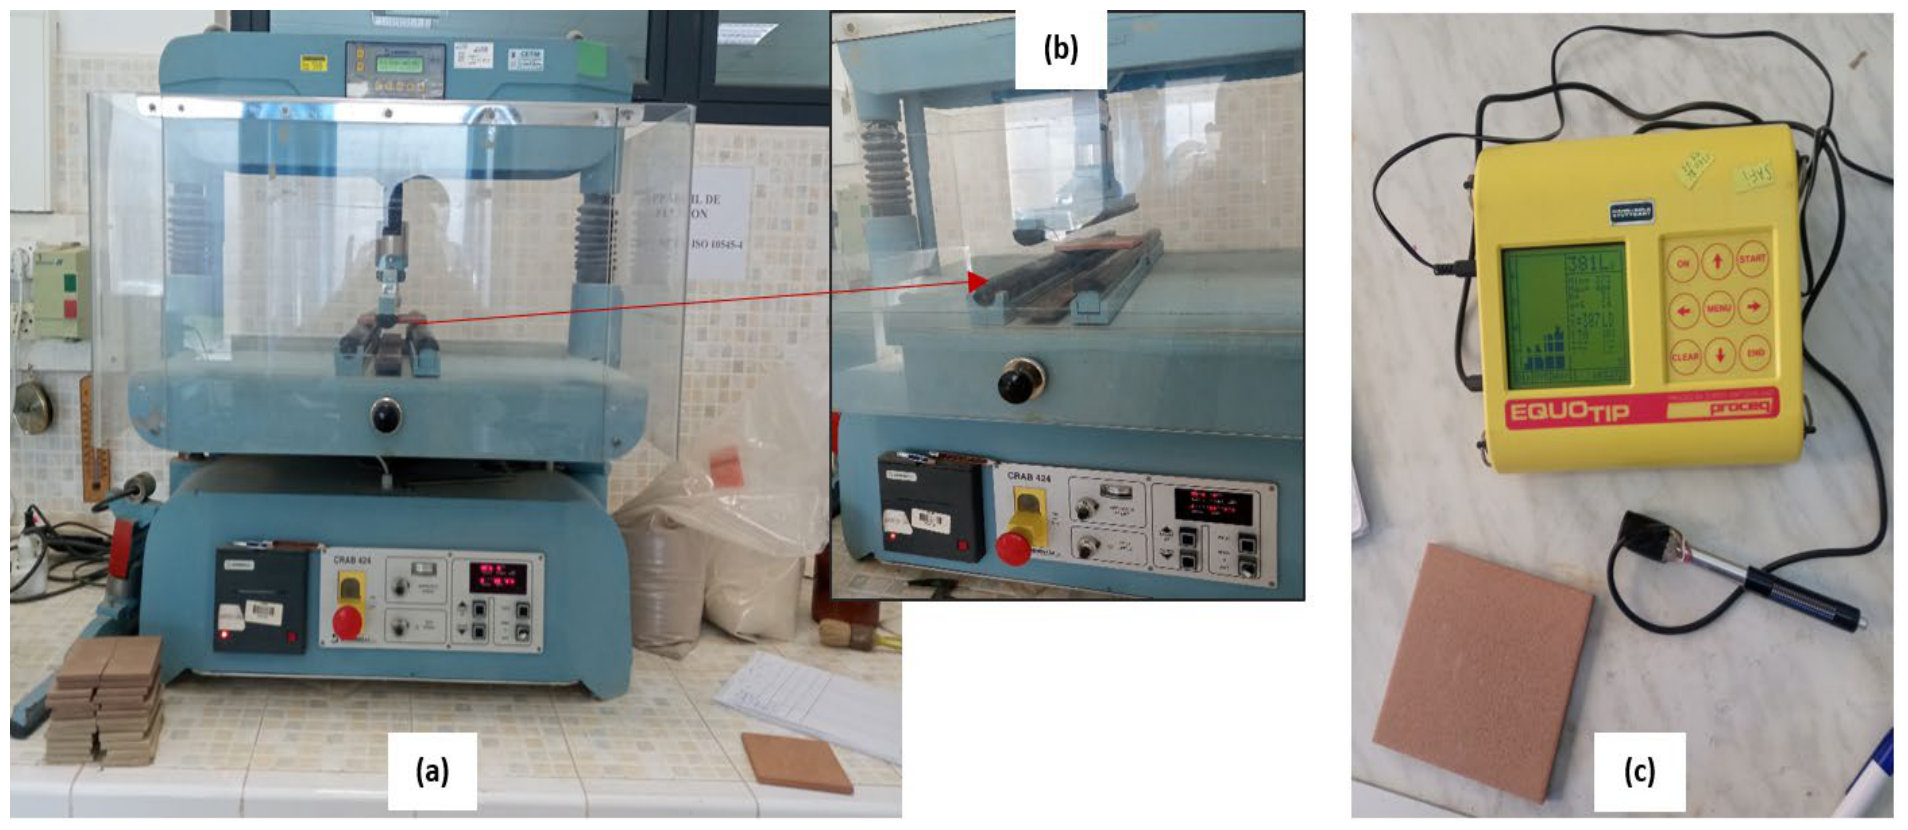
The mechanical behavior of glass–clay ceramic composites is mainly governed by densification during sintering, particularly through vitrification, porosity reduction and the development of strong interparticle bonding. In this study, mechanical performance was evaluated using flexural strength (Rf), fracture load (Fr) and hardness (DRT) (see Figure 16). The results indicate that both bentonite content and firing temperature have a significant influence on the mechanical properties of the ceramic tiles, reflecting the evolution of microstructural consolidation.

3.4.1. Flexural Strength and Fracture Load

Flexural strength and fracture load are critical indicators of ceramic structural integrity, as they strongly depend on porosity and microstructural continuity [45]. At 900 °C, flexural strength ranges from 8.32 to 13.44 MPa, with the best performance observed at 35 wt.% bentonite Figure 17, corresponding to a fracture load of 557 N. Higher bentonite contents (45–50 wt.%) lead to reduced mechanical resistance due to the lower glass fraction, which limits liquid-phase formation, restricts densification, and increases residual porosity [46]. At 950 °C, mechanical properties improve significantly, with flexural strength reaching 29.11 MPa and fracture load 1170.5 N for 30 wt.% bentonite. This enhancement is attributed to more effective liquid-phase sintering, where the softened recycled glass forms a continuous vitreous phase that strengthens interparticle bonding, reduces defects, and improves load transfer. The results confirm that an optimal bentonite–glass ratio is essential to achieve high densification and superior mechanical performance.

3.4.2. Hardness and Microstructural Reinforcement

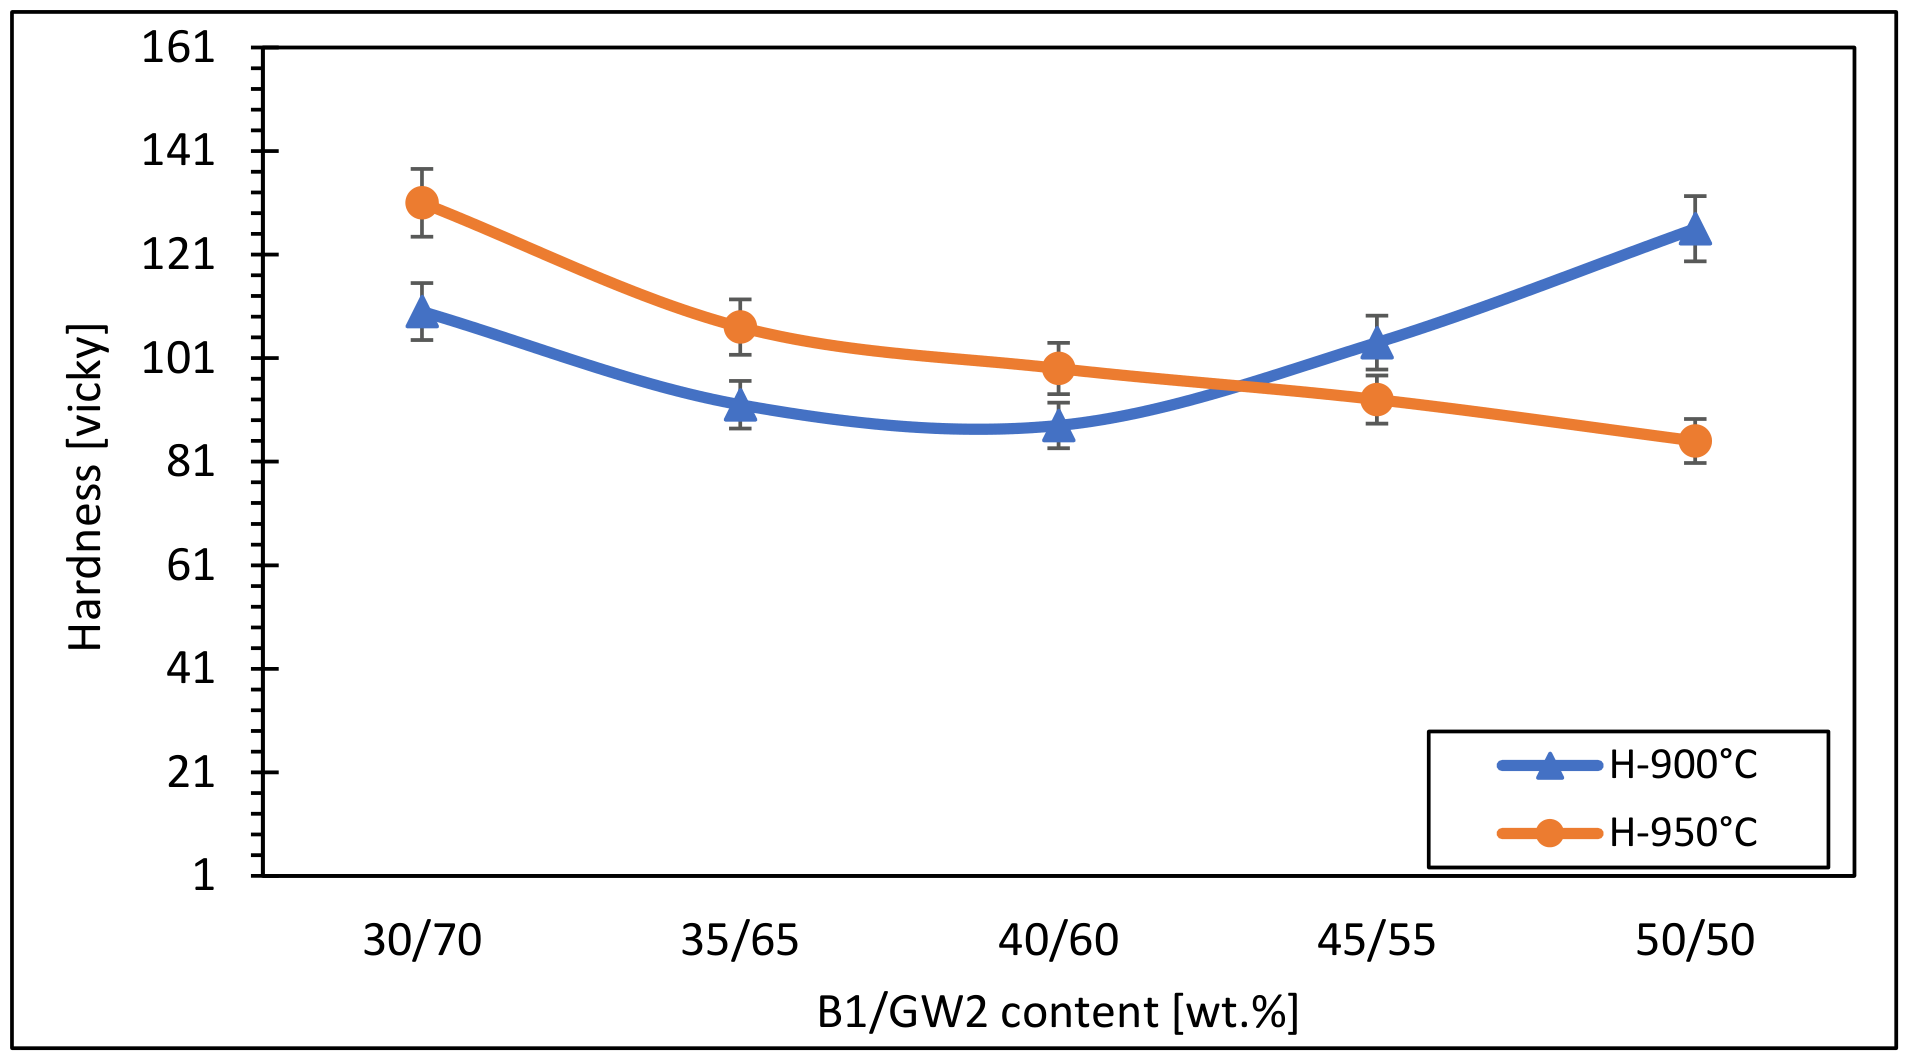
Hardness measurements constitute a key indicator of the resistance of ceramic surfaces to localized deformation and are closely linked to densification level and microstructural development [42,47,48,49]. The hardness results of the investigated ceramic tiles are presented in Figure 18. For specimens fired at 900 °C, hardness (DRT) values range from 88 to 126, depending on the bentonite content (Figure 18). The highest hardness value (126) is recorded for the composition containing 50 wt.% bentonite, while the lowest value (88) corresponds to 40 wt.% bentonite. These moderate values are characteristic of partial vitrification and the persistence of residual porosity, as the glassy phase generated at this temperature is not sufficiently developed to completely infiltrate intergranular spaces and eliminate pores. Such behavior is consistent with previous studies reporting that incomplete liquid-phase sintering at relatively low firing temperatures leads to limited densification and moderate hardness in glass–ceramic systems [48,49].
When the firing temperature increases to 950 °C, a significant change in hardness is observed. The maximum value (131) is achieved for the composition containing 30 wt.% bentonite, while other compositions exhibit lower values of 107, 99, 93 and 85 for 35, 40, 45 and 50 wt.% bentonite, respectively. The improvement in hardness for glass-rich compositions is mainly attributed to enhanced vitrification and better.

3.5. Thermophysical Behavior of the Studied Ceramic Tiles

Thermophysical properties are governed by vitrification and porosity reduction during sintering. Recycled glass enhances densification and modifies heat transfer behavior. Thermal properties were evaluated as a function of bentonite content (30–50 wt.%) and firing temperature (900–950 °C). To identify the influence of bentonite on the thermophysical properties of the fabricated ceramic tiles, measurements of specific heat capacity and thermal conductivity were performed.

3.5.1. Specific Heat Capacity and Thermal Energy Storage

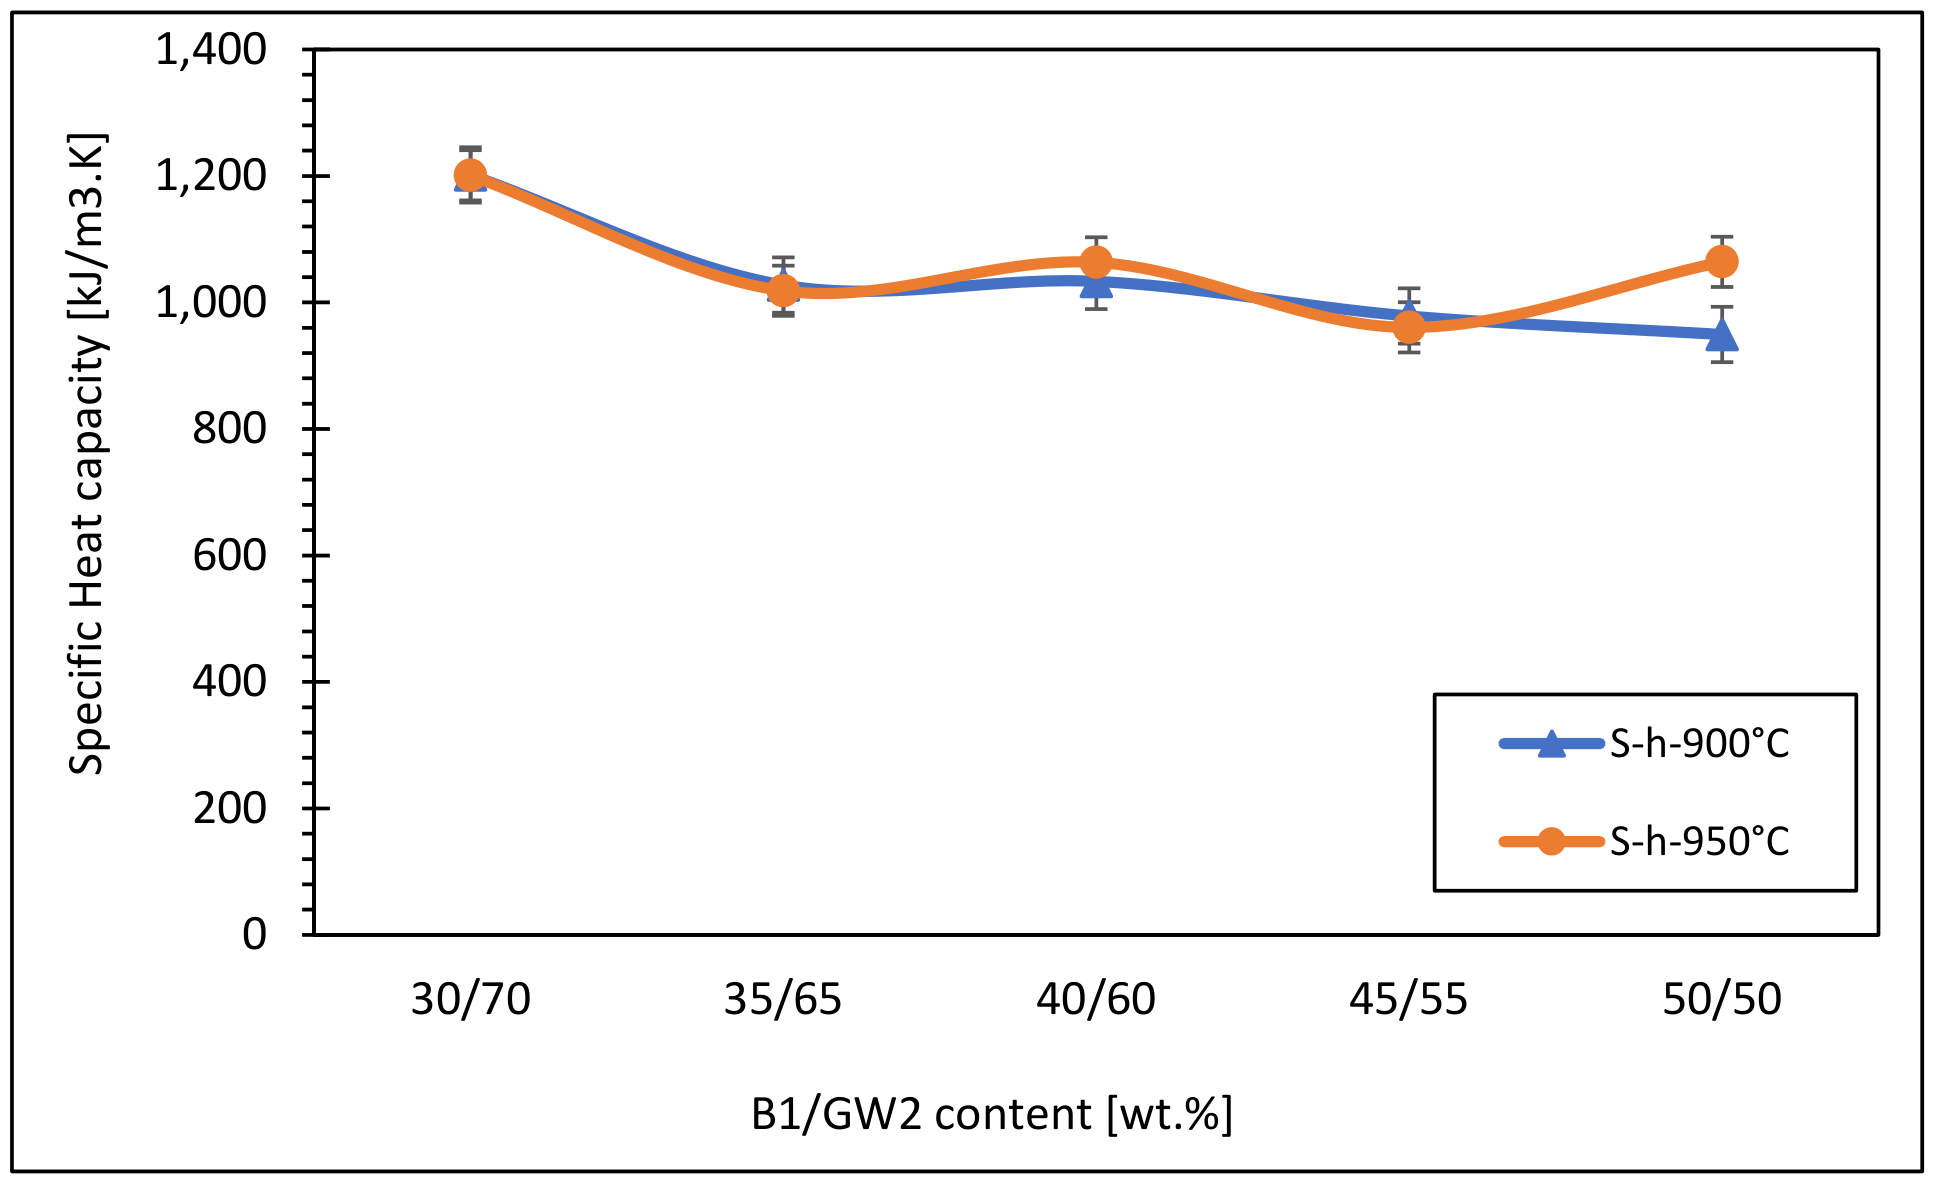
Specific heat capacity reflects the ability of the material to store thermal energy and depends on composition, phase assemblage and microstructure. The results show a slight decrease in specific heat capacity with increasing bentonite content for both firing temperatures (Figure 19). At 900 °C, values decrease from about 1201.63 to 949.37 kJ/m3·K, while at 950 °C they range from 1201.10 to 1064.20 kJ/m3·K. Intermediate compositions exhibit moderate variations.
This trend is attributed to the balance between the glassy phase, which enhances heat storage, and crystalline aluminosilicate phases, which slightly reduce it. In addition, improved microstructural homogeneity at higher temperature contributes to more stable thermal behavior [50,51,52,53].

3.5.2. Thermal Conductivity and Heat Transfer Mechanisms

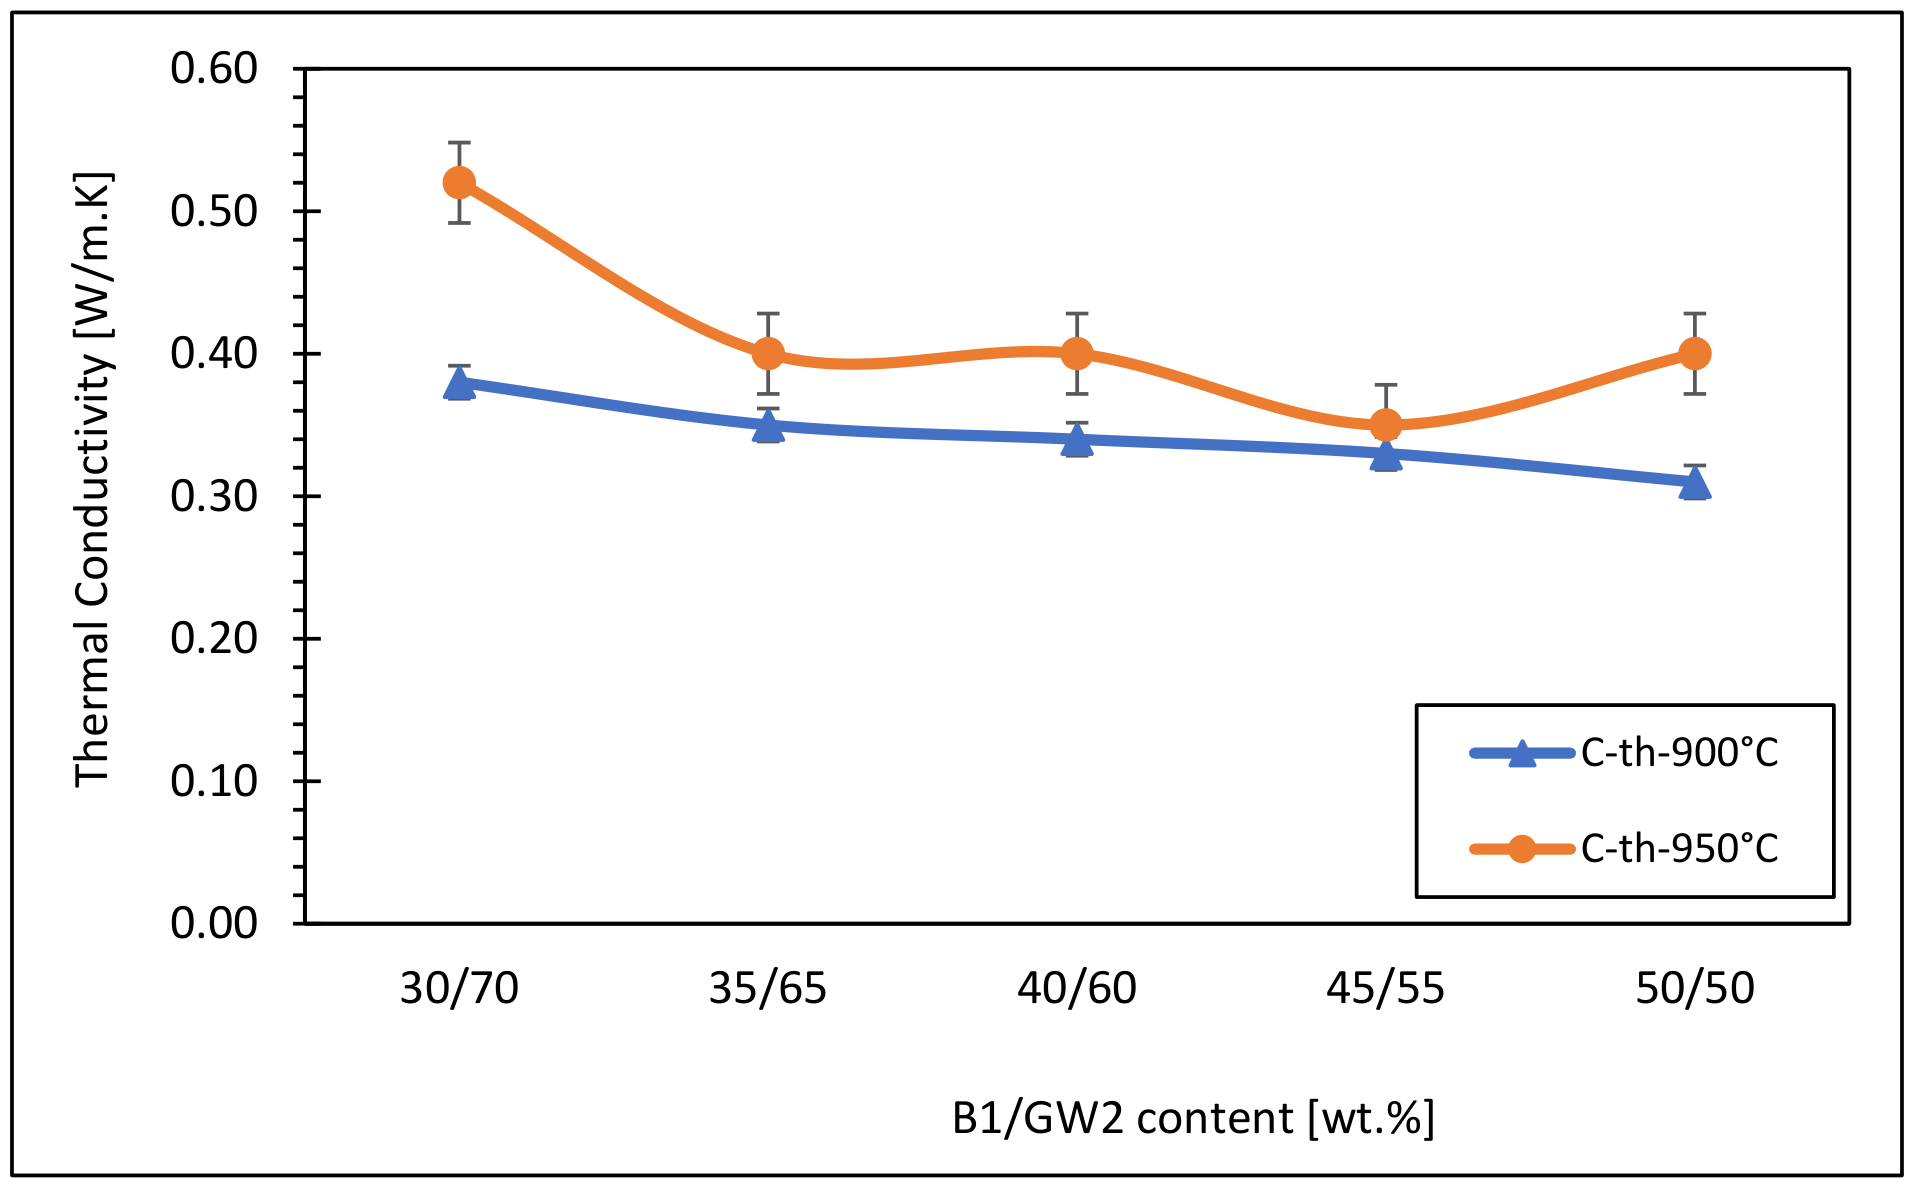
The combined effects of densification, porosity, and phase distribution within the ceramic matrix govern the observed thermal conductivity behavior (Figure 20). At 900 °C, the relatively low thermal conductivity values (0.31–0.38 W/m·K) are associated with incomplete sintering and the persistence of interconnected porosity, which acts as a thermal barrier due to the low conductivity of entrapped air (See Figure 19). As the firing temperature increases to 950 °C, enhanced vitrification and liquid-phase sintering promote densification and pore closure, resulting in a more continuous heat-transfer pathway and consequently higher thermal conductivity values (0.40–0.52 W/m·K). The gradual decrease in thermal conductivity with increasing bentonite content at both temperatures is primarily attributed to the reduced proportion of recycled glass, which limits vitreous phase formation and densification. Higher bentonite levels also increase structural heterogeneity and residual porosity, creating additional interfaces and defects that intensify phonon scattering. Since heat conduction in ceramics occurs mainly through lattice vibrations, these discontinuities disrupt phonon transport and reduce the overall thermal conductivity [50]. Thus, compositions with lower bentonite content and higher firing temperature exhibit superior thermal transport due to their denser and more homogeneous microstructure.

3.6. Chemical Durability and Environmental Resistance

Chemical durability is a key parameter for assessing the long-term stability of ceramic materials in aggressive environments. It is mainly governed by vitrification degree, glassy phase distribution and residual porosity. The results show that both firing temperature and bentonite content significantly influence the chemical resistance of the developed ceramic composites.
All chemical durability tests reported in Section 3.6.1, Section 3.6.2 and Section 3.6.3 were conducted strictly following the ISO 10545-13:2016 standard [41]. The complete experimental protocol is summarized below: (i) Acid attack reagent: 3 wt% HCl solution (analytical grade, ≥37% stock from Sigma-Aldrich, St. Louis, MO, USA), pH ≈ 0.5, prepared with deionized water (18 MΩ·cm). (ii) Alkali attack reagent: 3 wt% NaOH solution (analytical grade pellets from Sigma-Aldrich), pH ≈ 14, prepared with the same deionized water. (iii) Water resistance: distilled water (pH 6.5–7.5) was used as a neutral-environment control. (iv) Test temperature: 20 ± 2 °C maintained in a climate-controlled chamber (relative humidity ≈ 50%). (v) Exposure duration: 96 ± 1 h, with solution renewal at 48 ± 1 h to maintain constant reagent concentration. (vi) Volume-to-surface-area ratio: V/A = 0.8 ± 0.05 mL/cm2 (specimens 25 × 25 × 7 mm3, exposed surface area = 13.25 cm2, approximately 110 mL of solution per specimen), conforming to the ISO 10545-13 minimum of 0.5 mL/cm2. (vii) Mass measurement: Mettler Toledo XS204 analytical balance (precision ± 0.1 mg) after drying at 110 °C for 24 h followed by 2 h equilibration in a silica-gel desiccator. (viii) Replication: n = 5 specimens per formulation per environment, with all results reported as the mean ± standard deviation (cf. Section 3.13). (ix) Visual rating per Annex A of ISO 10545-13: UA = no visible alteration of glaze or surface; UB = slight alteration detectable only under inclined lighting; UC = severe alteration visible to the naked eye. All M1–M5 specimens fired at 950 °C were rated UA in neutral water, UA–UB in acid (HCl), and UB–UC in alkali (NaOH). (x) Sample preparation: specimens were polished on a Struers LaboPol-2 with 1200 SiC paper to obtain a uniform surface finish before testing, then washed in deionized water and dried at 110 °C for 24 h to constant mass. These parameters ensure full traceability and reproducibility of the chemical durability results reported in the following subsections.

3.6.1. Stability in Neutral Aqueous Environment

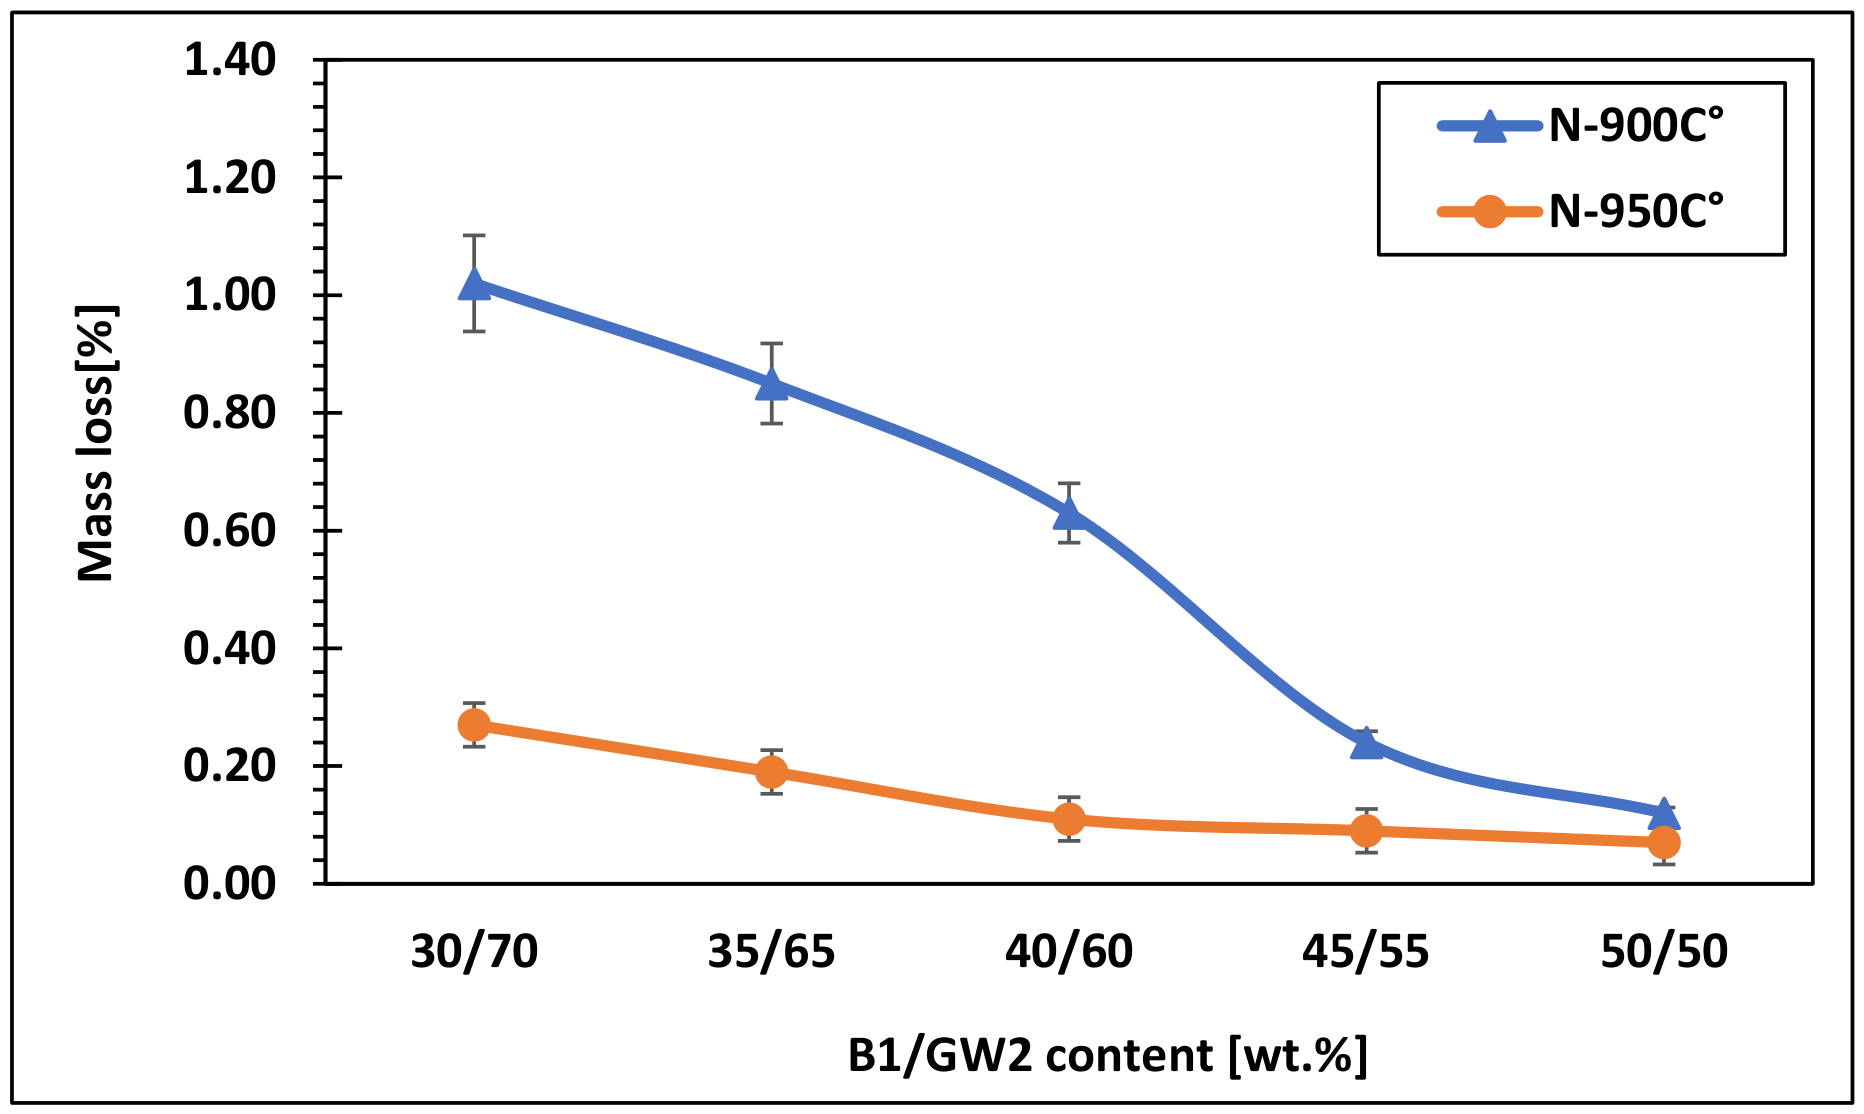
The behavior of ceramic materials in neutral aqueous environments provides insight into their resistance to moisture penetration and hydrolytic degradation [48]. For samples fired at 900 °C, the mass variation after immersion ranges from 0.12% to 1.02%, depending on bentonite content (Figure 21). The highest value is observed for 30 wt.% bentonite (1.02%), while lower values are obtained for higher contents, decreasing to 0.12% at 50 wt.%.
These relatively high values indicate the presence of open porosity, allowing water to penetrate the microstructure. At 950 °C, mass variation significantly decreases, ranging from 0.07% to 0.27%. This improvement reflects enhanced vitrification and pore closure, which limit water absorption and improve hydrolytic stability [53]. This significant reduction in water sensitivity clearly indicates that increasing the firing temperature enhances vitrification and pore closure, thereby limiting moisture penetration and improving the hydrolytic stability of the ceramic matrix [54,55].

3.6.2. Acid Corrosion Resistance

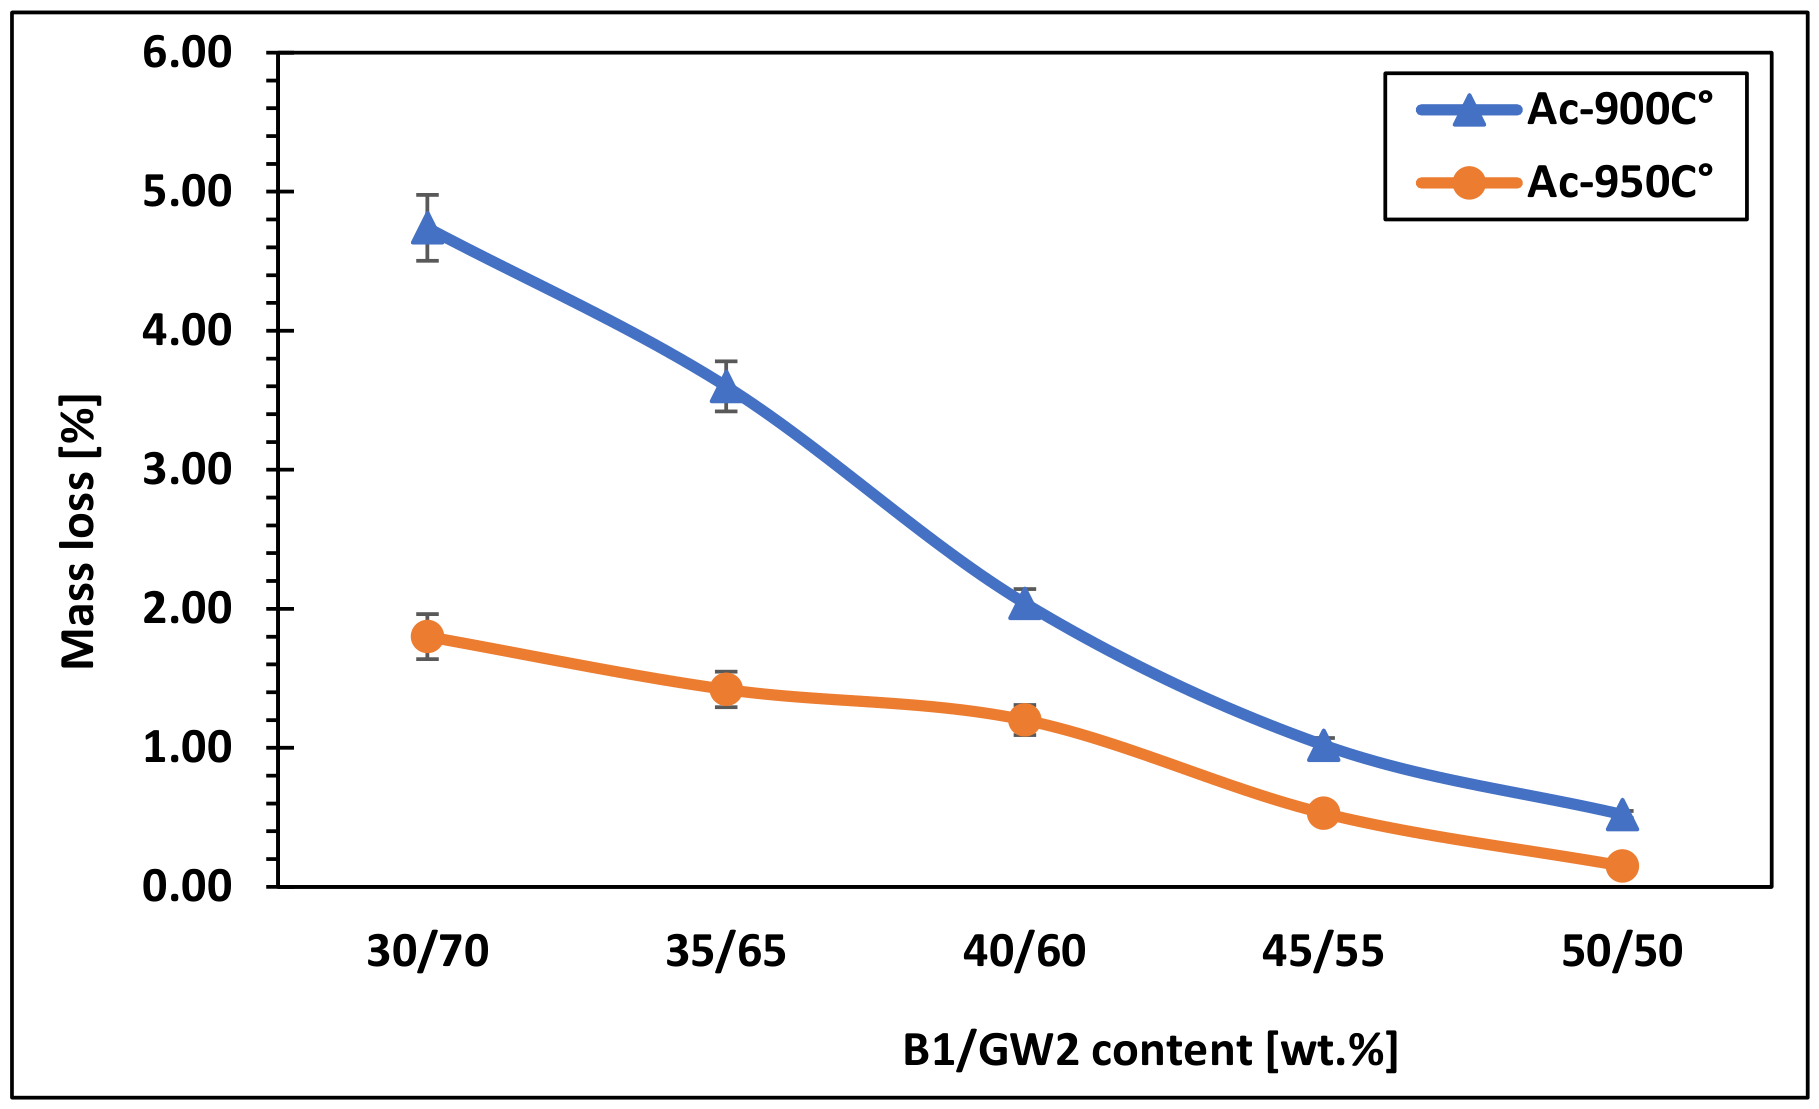
Acid resistance is a critical parameter for ceramic materials used in construction, particularly under exposure to aggressive environments such as acid rain or industrial conditions [56,57,58,59,60]. For samples fired at 900 °C, mass loss in acidic solution ranges from 0.52% to 4.74%. The highest degradation is observed for 30 wt.% bentonite (4.74%), while it progressively decreases to 0.52% for 50 wt.% bentonite (see Figure 22).
This decrease with increasing bentonite content is associated with the higher proportion of crystalline aluminosilicate phases, which exhibit better resistance to acid corrosion compared to the more reactive glassy phase [56,57]. At 950 °C, acid resistance improves significantly, with mass loss reduced to 0.15–1.8%. This enhancement is mainly due to improved densification and partial crystallization of the glass phase, which limit ion exchange and reduce dissolution of the silicate network [58,59,60].

3.6.3. Alkali Resistance and Glass Network Stability

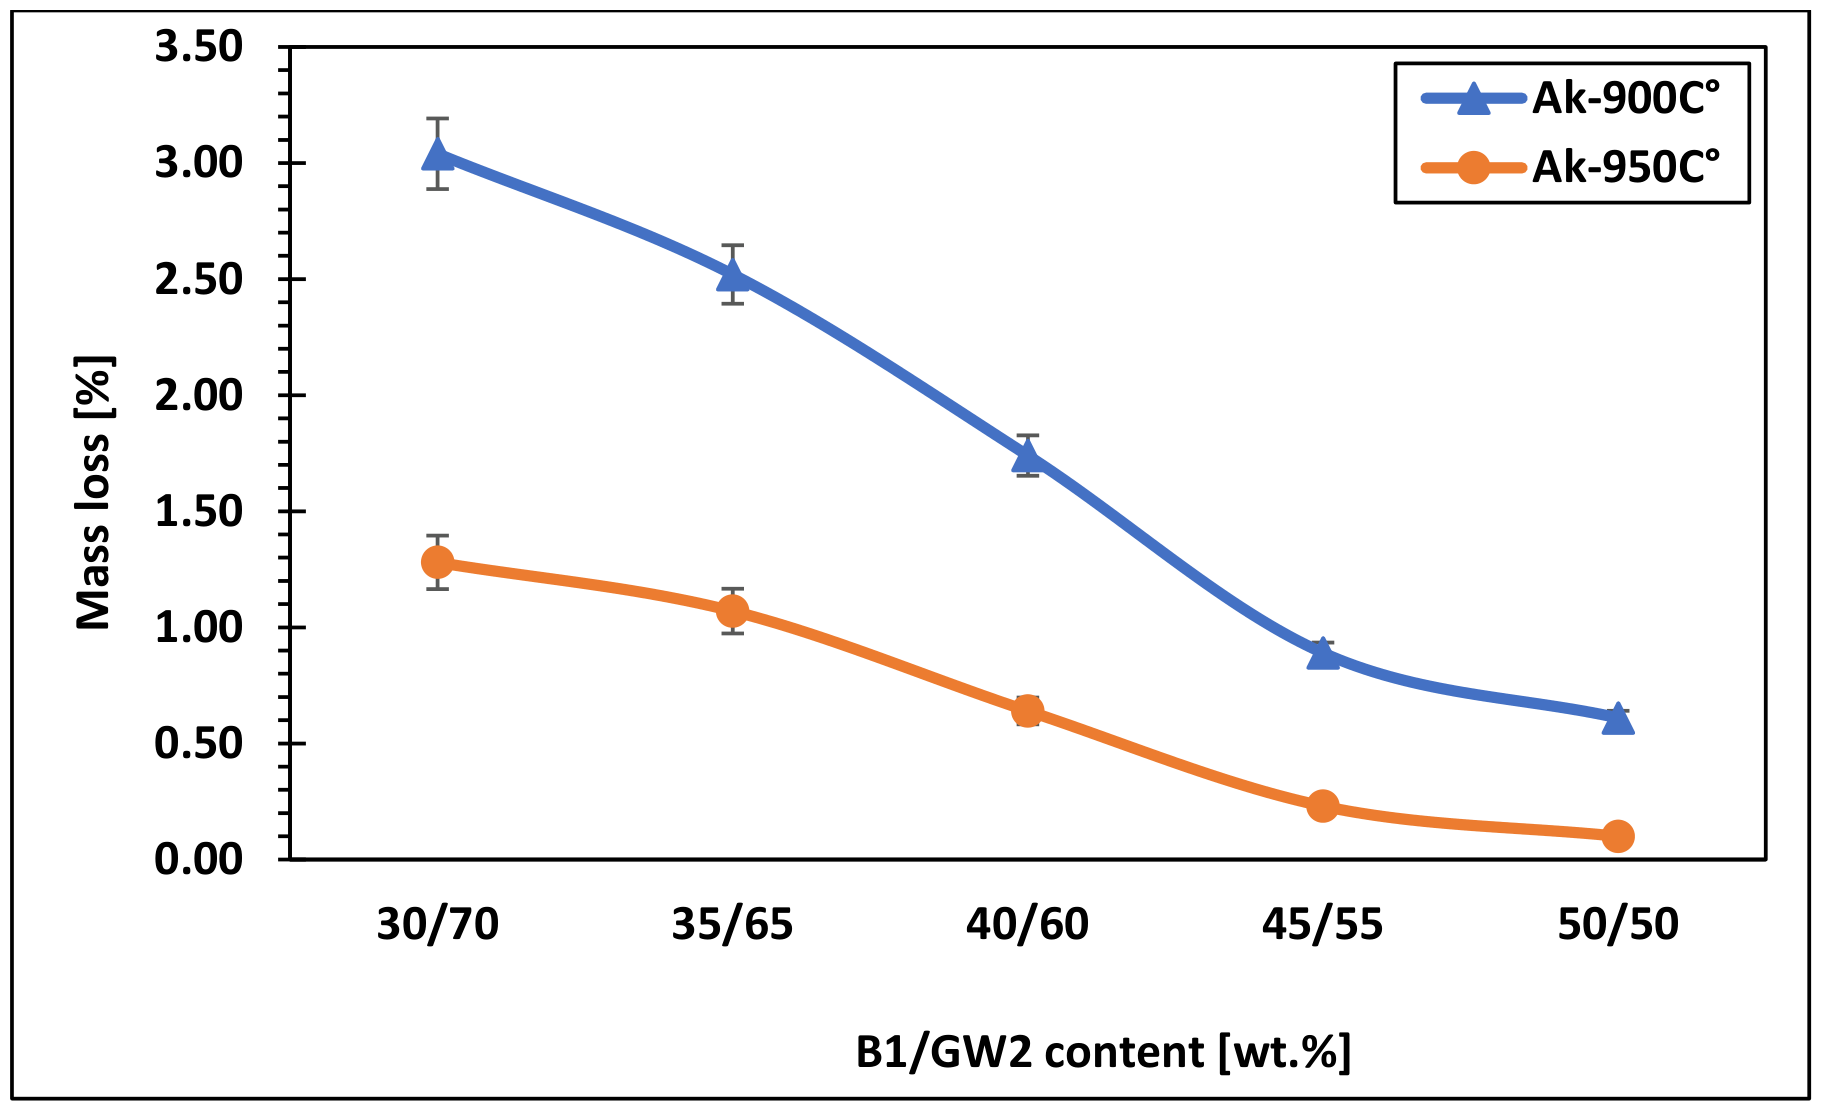
Alkaline environments are highly aggressive for glass-containing ceramics, as hydroxide ions can attack the silicate network and break Si–O–Si bonds [61]. For samples fired at 900 °C, mass loss ranges from 0.61% to 3.54%, with the highest degradation observed for 30 wt.% bentonite (3.54%). Higher bentonite contents show lower degradation, decreasing to 0.89% for 45 wt.% (Figure 23).
At 950 °C, alkali resistance improves significantly, with mass loss reduced to 0.10–1.28%. This improvement is attributed to enhanced densification and the formation of a more stable glass–ceramic network. The incorporation of alumina from bentonite promotes Si–O–Al bond formation, which increases resistance to alkaline dissolution compared to pure silicate structures [56,62,63].

3.7. Microstructural Study of Produced Ceramic Tiles

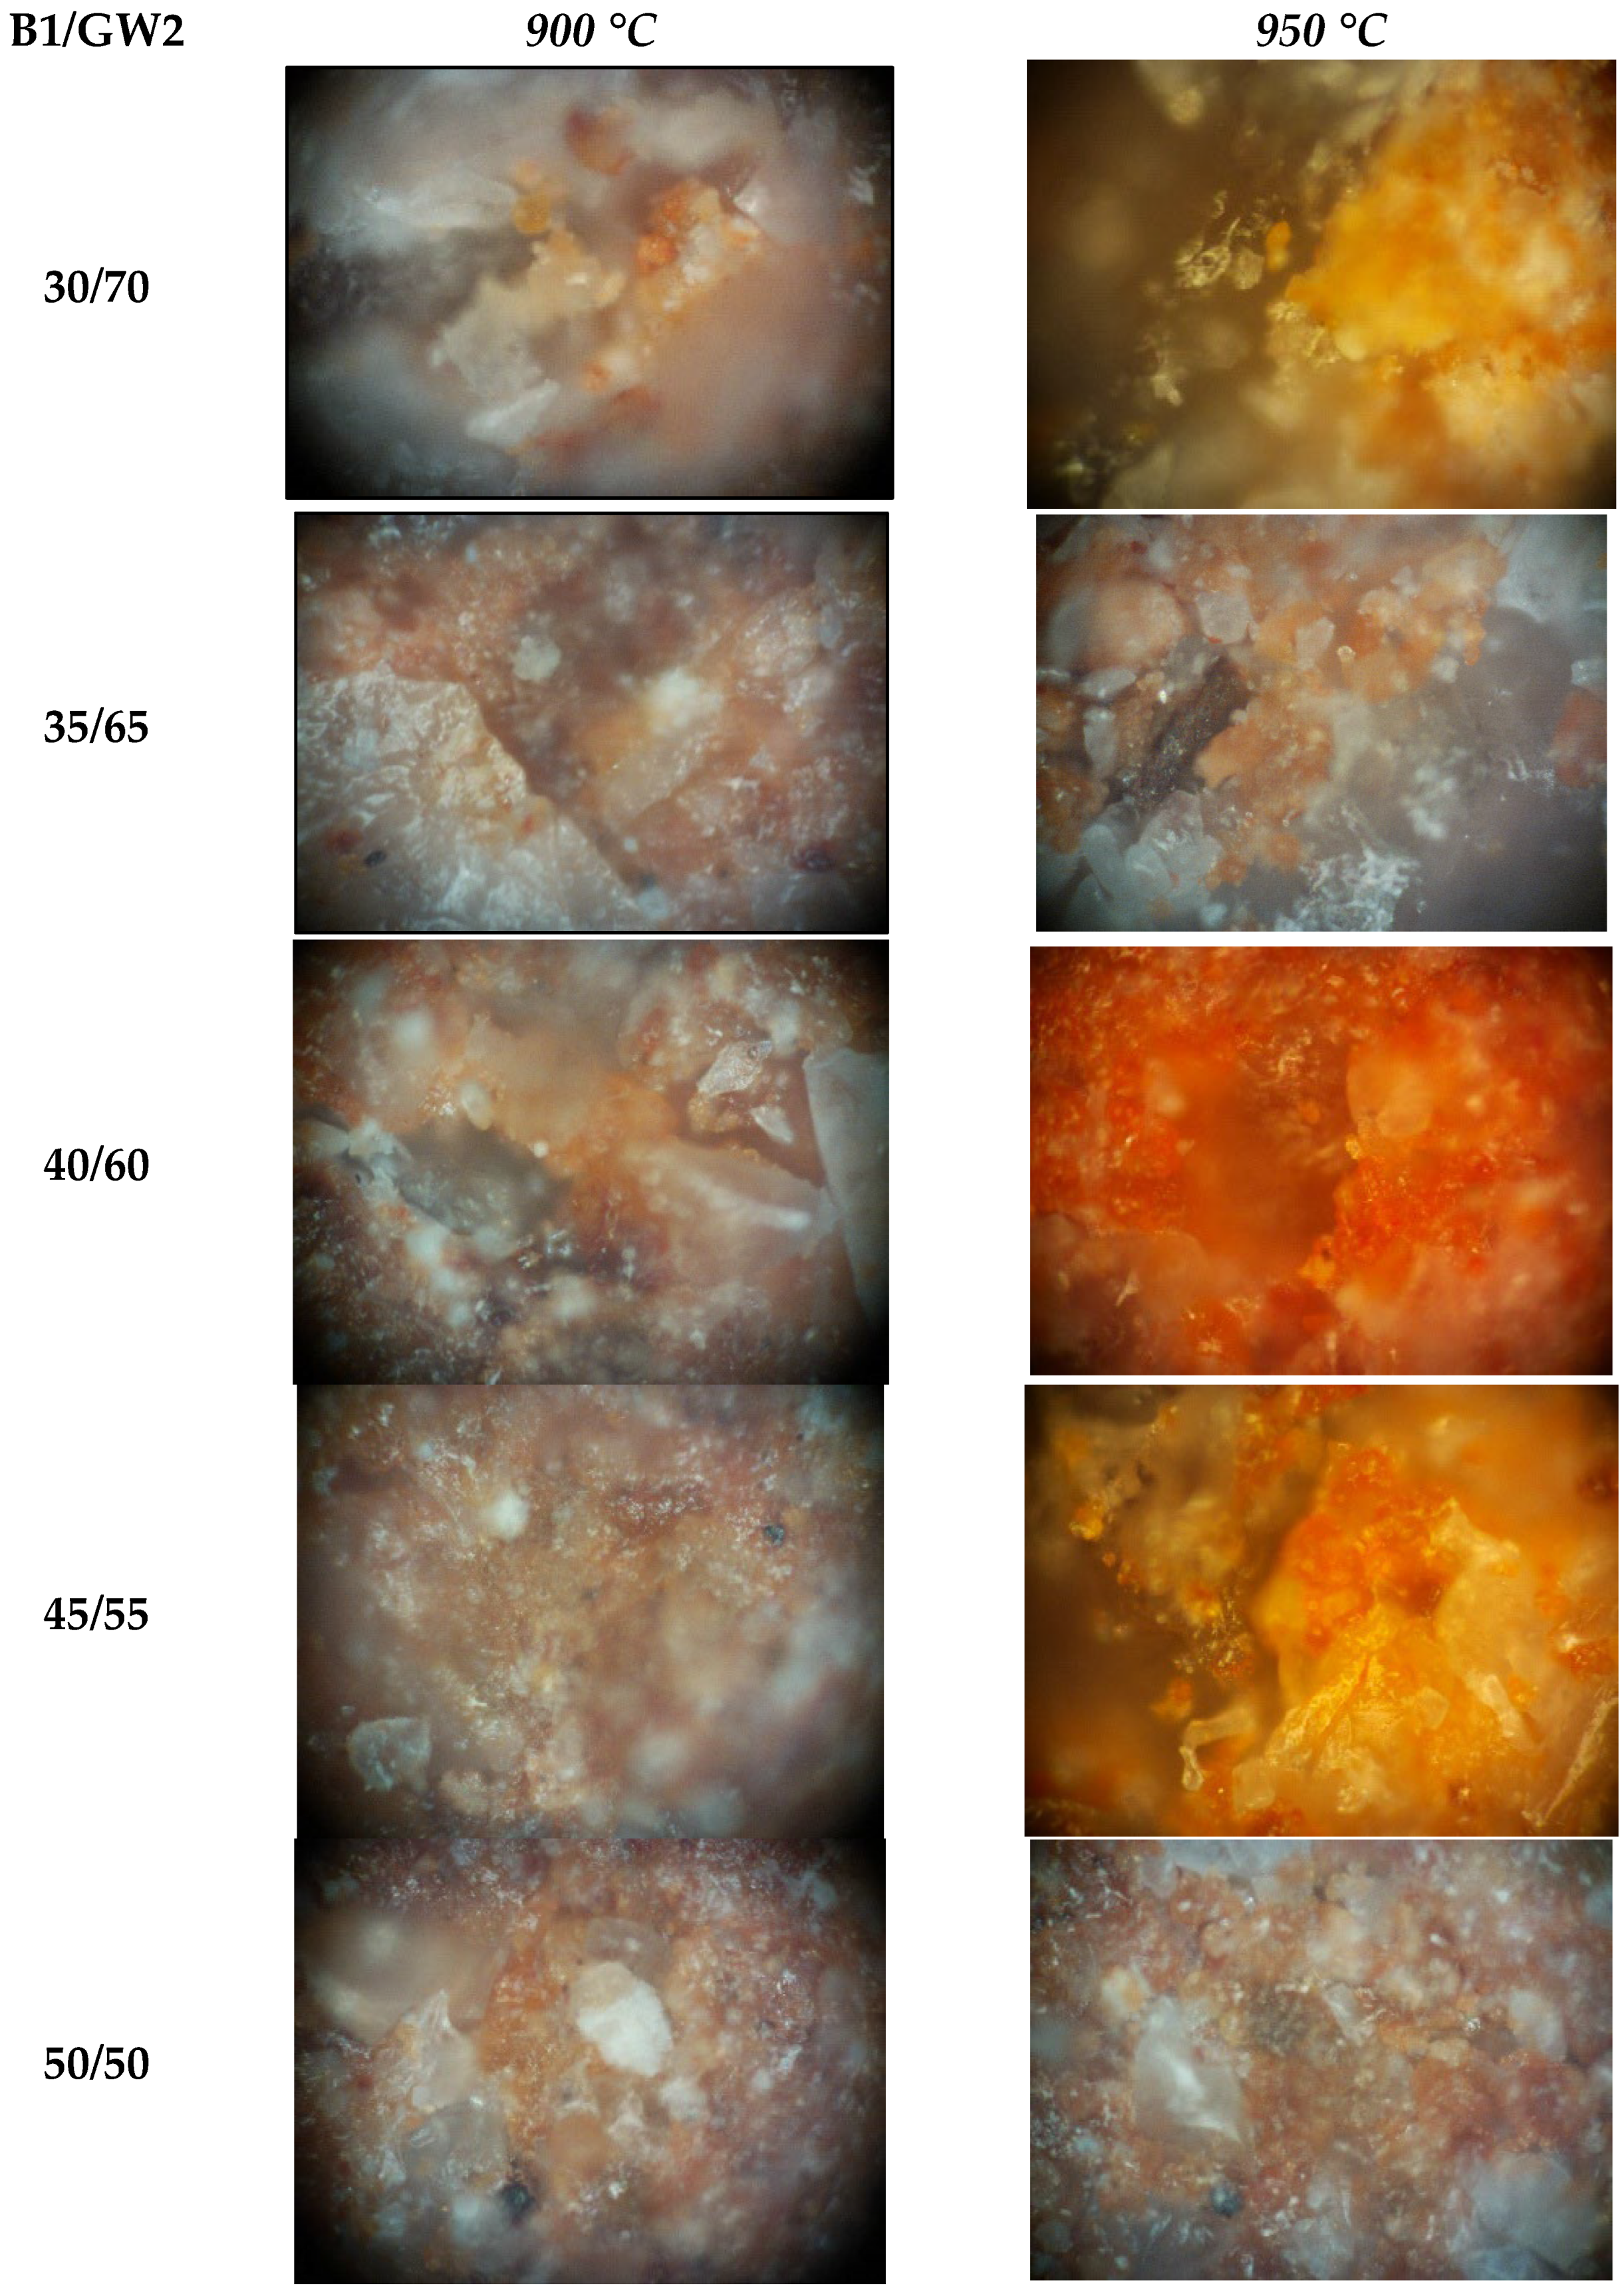
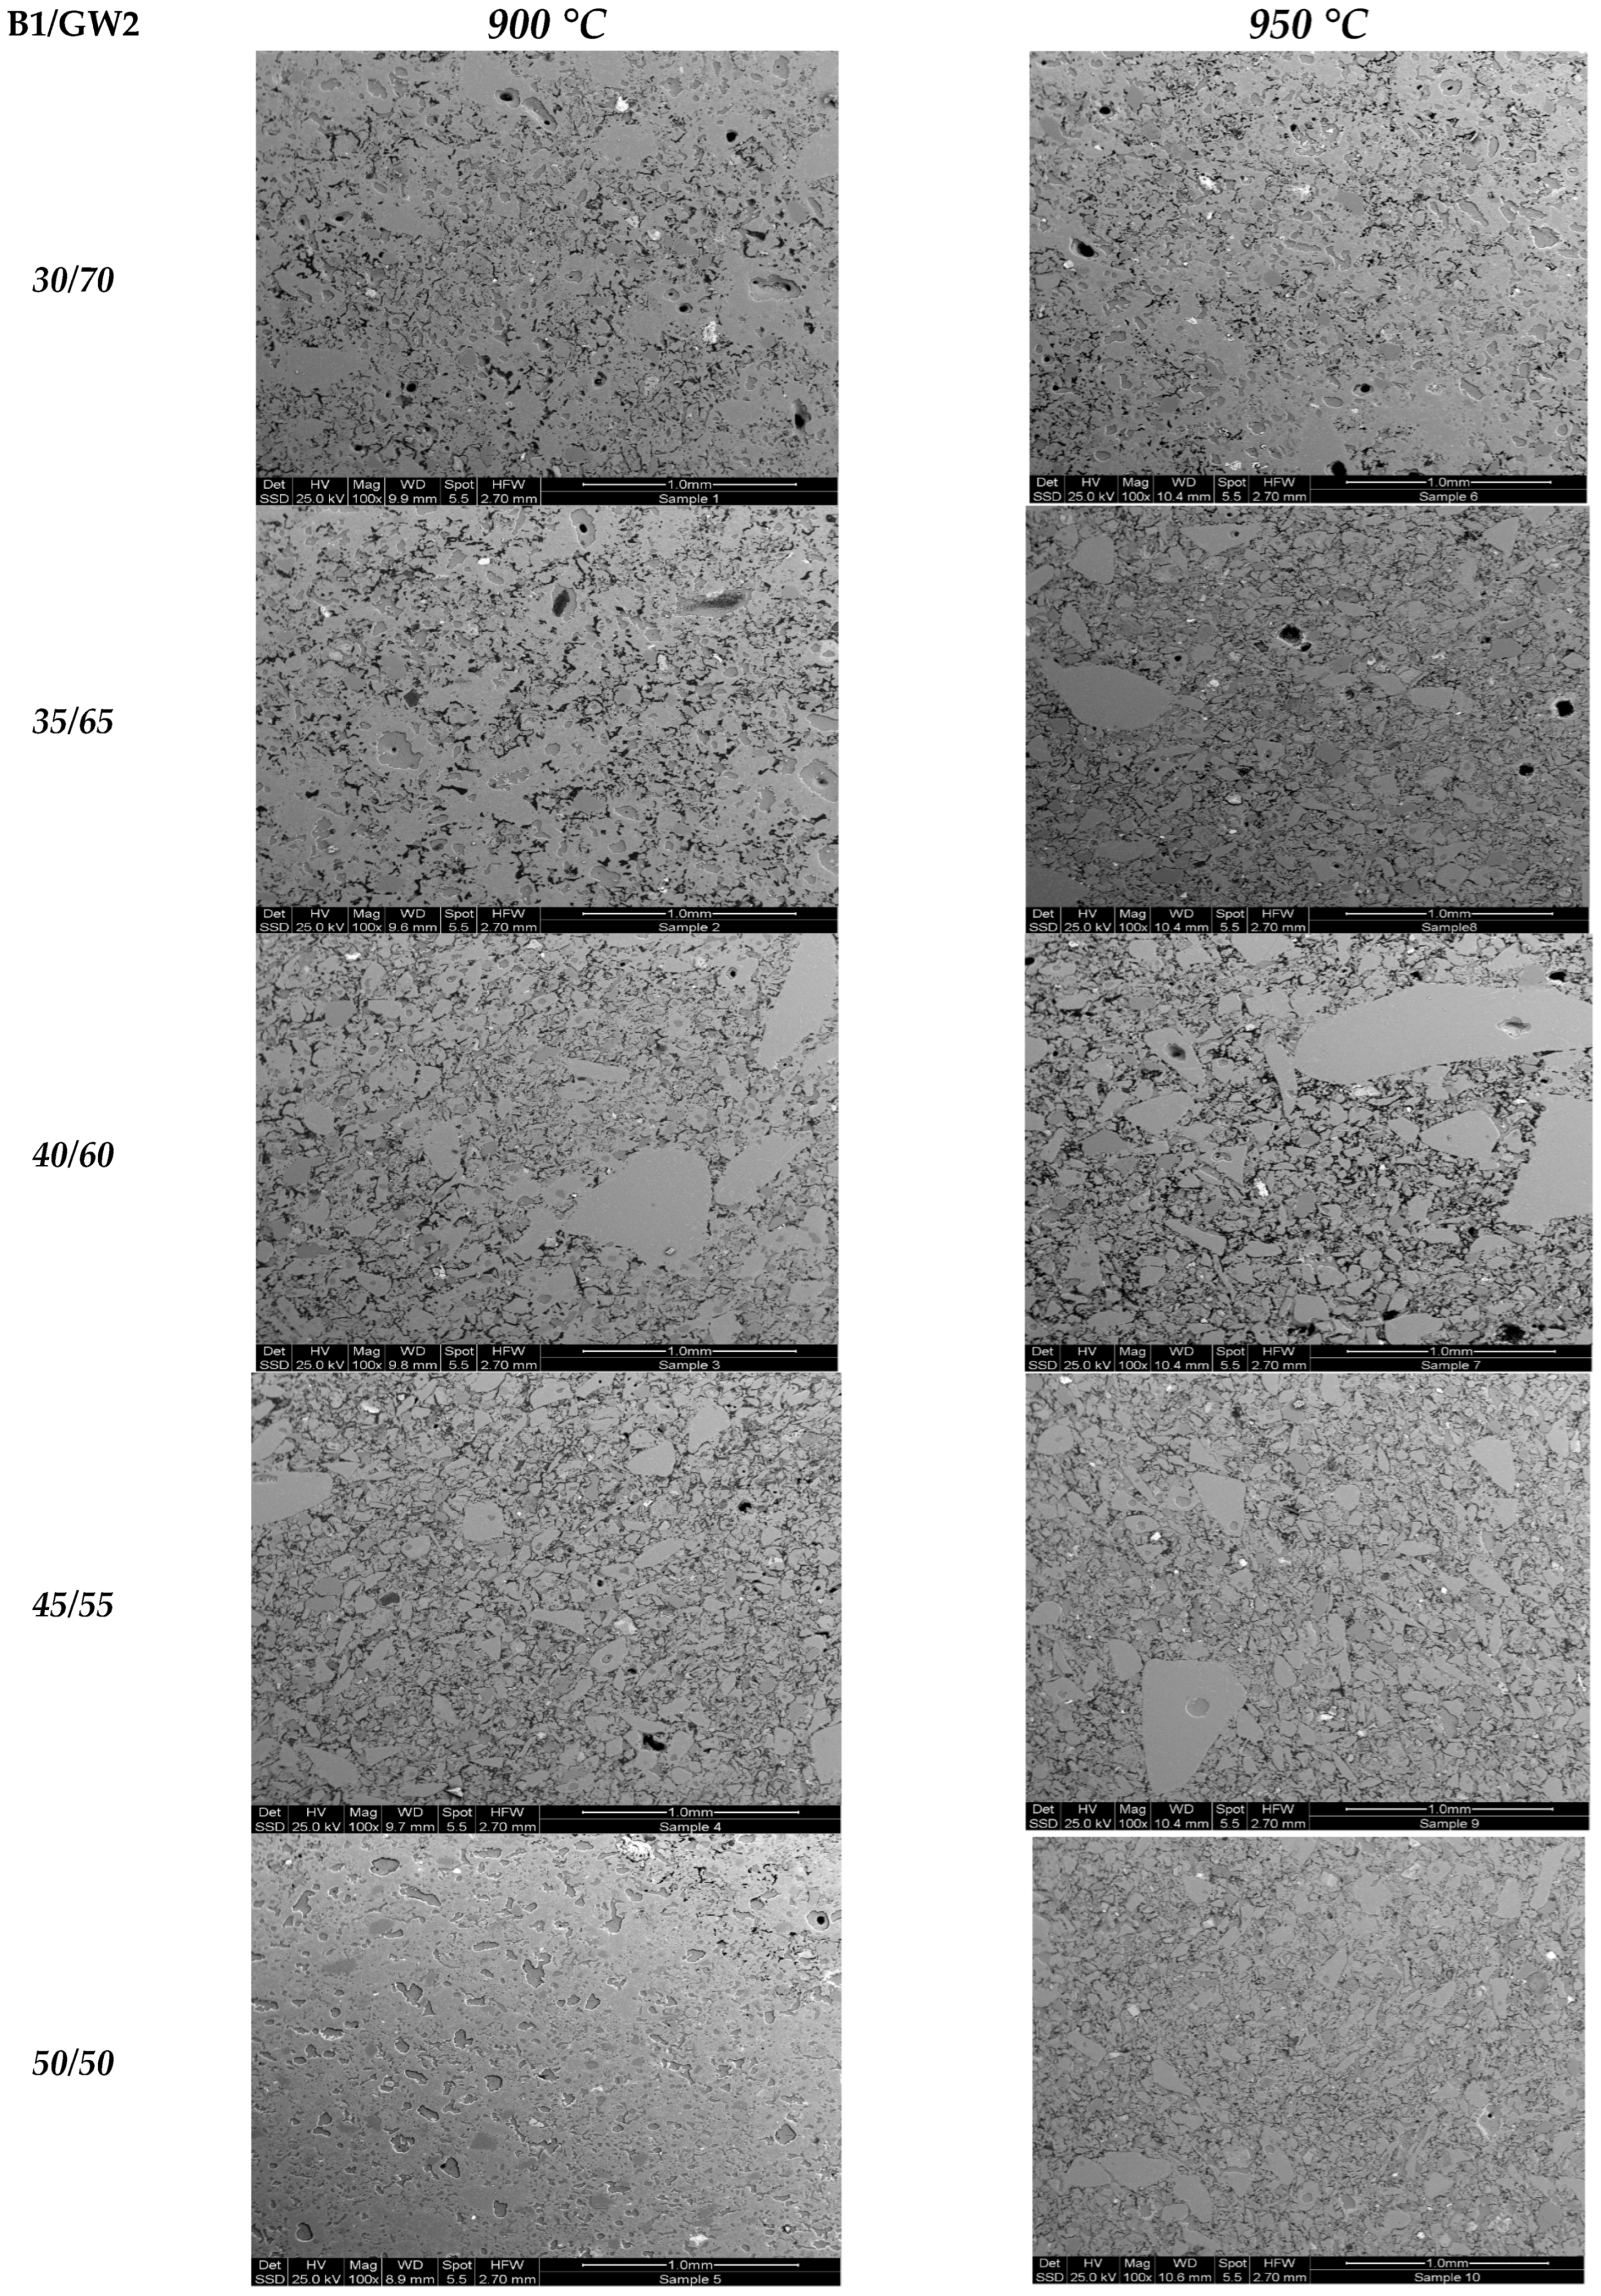
A comprehensive microstructural characterization of the fabricated ceramic tiles was conducted using optical microscopy and scanning electron microscopy (SEM), as presented in Figure 23 and Figure 24. The observations reveal a marked evolution in microstructure as a function of both bentonite content (30–50 wt.%) and firing temperature (900–950 °C), closely correlating with the measured physical, mechanical, and thermal properties.
At 900 °C, all compositions display a partially sintered and heterogeneous microstructure, characterized by incomplete particle bonding, irregular pore distribution, and the persistence of unreacted or partially reacted phases. The matrix remains discontinuous, with distinguishable clay particles and glass grains separated by interconnected open porosity. At this stage, the glassy phase is limited in quantity and retains relatively high viscosity, which restricts its ability to infiltrate interparticle spaces and promote effective densification. Such features are typical of solid-state sintering in silicate-based ceramics and explain the elevated porosity, higher water absorption, and moderate mechanical performance observed at this temperature [37,64,65,66].
Raising the firing temperature to 950 °C induces a pronounced microstructural transformation driven by liquid-phase sintering. The recycled soda–lime glass undergoes substantial softening, generating a low-viscosity liquid phase that effectively wets particle surfaces, penetrates intergranular voids, and enhances particle rearrangement. This process promotes the formation of a continuous vitreous matrix, significantly reducing open porosity and strengthening interparticle cohesion. SEM analysis confirms a denser and more homogeneous microstructure, particularly in compositions containing 30–35 wt.% bentonite, where well-dispersed crystalline phases are embedded within a compact glassy network.
By contrast, formulations with higher bentonite contents (≥45 wt.%) exhibit increased structural heterogeneity and residual porosity, attributable to the reduced proportion of glass and, consequently, insufficient liquid-phase formation for complete densification. This imbalance limits the development of a continuous vitreous framework, resulting in less efficient pore closure and weaker microstructural integrity.
Overall, the microstructural evolution observed at higher firing temperature directly accounts for the enhanced mechanical strength, hardness, thermal stability, and chemical durability of the optimized compositions. These findings highlight the critical interplay between raw material composition and thermal treatment in controlling sintering mechanisms and final performance, in agreement with previous studies on glass–ceramic systems [67].
The effect of bentonite content becomes particularly evident at this temperature. Compositions containing 30–35 wt.% bentonite show a dense and homogeneous microstructure with a well-developed glassy matrix, ensuring optimal densification and overall performance. At around 40 wt.%, the formation of secondary crystalline phases such as anorthite and gehlenite is observed, resulting from reactions between CaO, Al2O3 and SiO2; these phases enhance chemical stability but slightly limit densification [68]. For higher bentonite contents (45–50 wt.%), the reduced glass fraction limits liquid-phase formation, leading to a more porous, heterogeneous and crystalline microstructure. This explains the decrease in mechanical strength despite relatively stable thermal behavior. Overall, these observations demonstrate that the synergy between glass vitrification and bentonite reactivity controls microstructural development. A firing temperature of 950 °C is optimal for activating liquid-phase sintering while minimizing defects, and compositions with 30–35 wt.% bentonite provide the best compromise between density, homogeneity, mechanical performance and durability [69] (see Figure 25).
The effect of GW2 content on microstructural development becomes particularly evident at 950 °C, where liquid-phase sintering is fully activated. Compositions containing 30–35 wt.% bentonite exhibit a dense and homogeneous microstructure with limited residual porosity. This behavior is attributed to the high proportion of recycled glass, which generates a continuous vitreous phase capable of coating clay particles, filling intergranular spaces, and promoting efficient densification. The partial dissolution of iron-bearing species from bentonite into the silicate network further contributes to structural uniformity and compositional stabilization. At approximately 40 wt.% bentonite, the microstructure becomes moderately heterogeneous due to the increased formation of secondary crystalline phases, primarily anorthite and gehlenite. These phases originate from reactions between CaO supplied by the recycled glass and aluminosilicate species released from bentonite during firing. While their presence enhances chemical and thermal stability, excessive crystallization may locally disrupt the continuity of the glassy matrix and reduce densification efficiency. For higher bentonite contents (45–50 wt.%), the reduced glass fraction becomes insufficient to sustain complete vitrification, resulting in a predominantly crystalline and more porous microstructure. The limited liquid phase restricts pore elimination and interparticle bonding, leading to increased residual porosity and reduced structural homogeneity. This explains the decline in mechanical strength observed for these formulations, despite relatively stable thermal behavior. The final microstructure reflects the balance between vitreous-phase formation and crystallization processes. A firing temperature of 950 °C provides the optimal conditions for liquid-phase sintering while preserving dimensional stability, with 30–35 wt.% bentonite delivering the most favorable compromise between density, homogeneity, and mechanical performance.

3.8. X-Ray Diffraction Analysis of the Optimal M1 Ceramic Tile

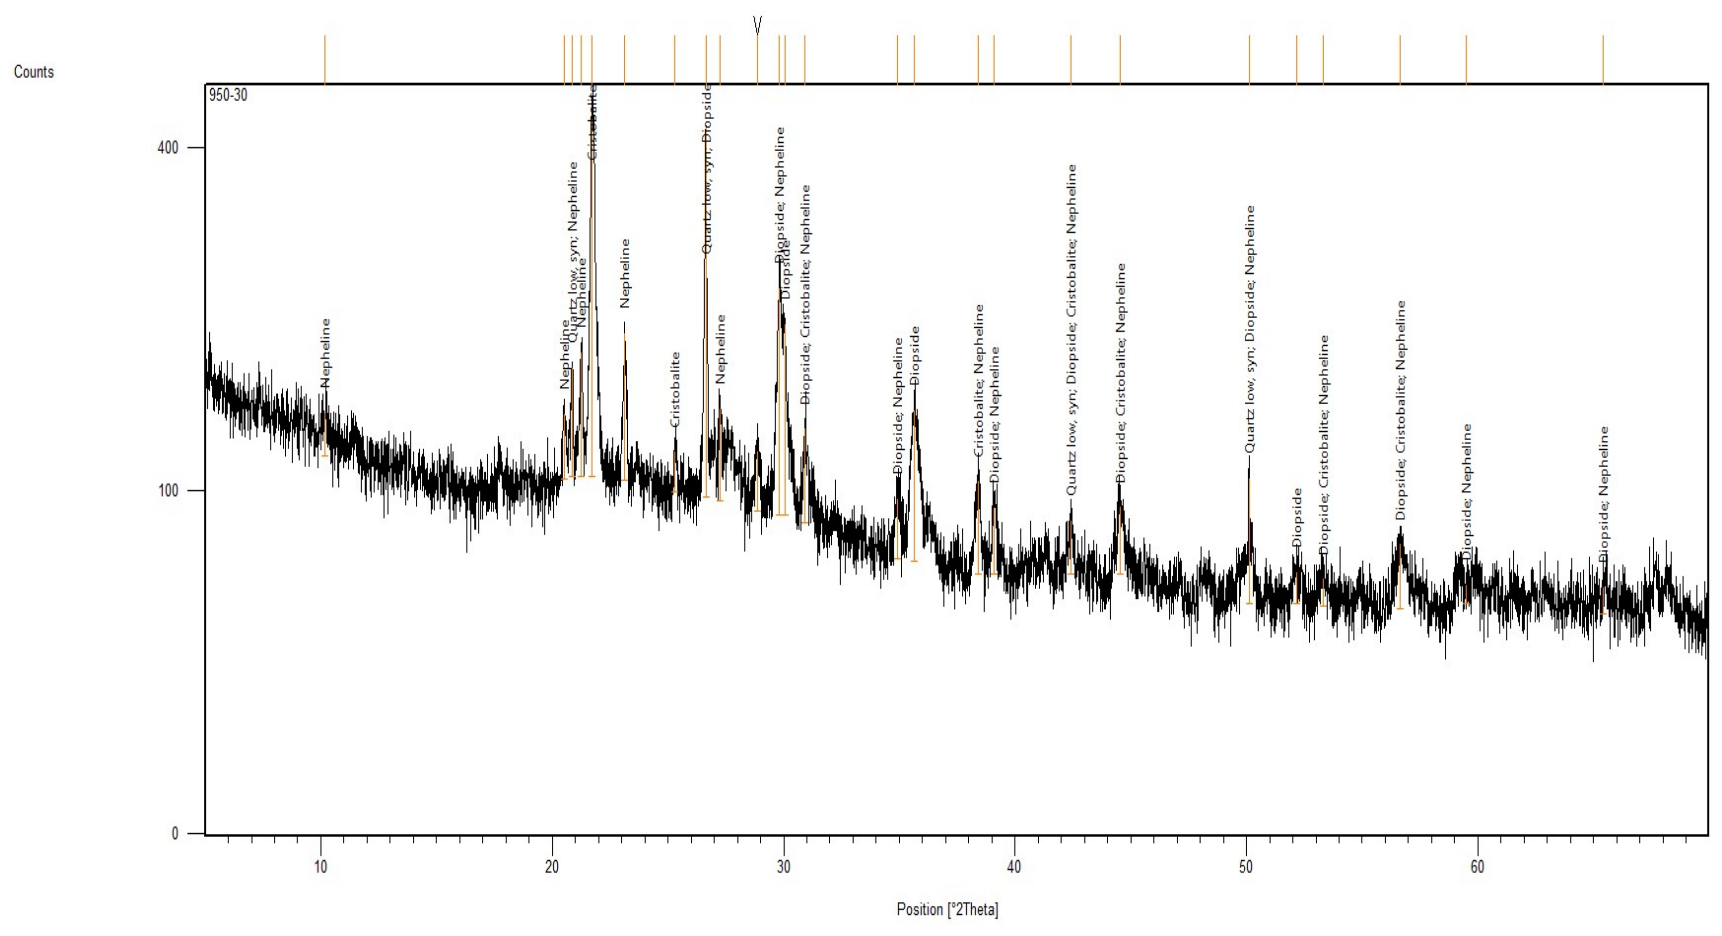
X-ray diffraction (XRD) characterization was performed on the optimal M1 ceramic tile formulation (30 wt% B1 + 70 wt% GW2) fired at 950 °C. The diffractogram provides direct mineralogical evidence supporting the chemistry-based interpretation of the firing reactions and the mechanical performance of the optimal formulation. The analysis was performed on a PANalytical X’Pert Pro diffractometer with Cu-Kα radiation (λ = 1.5406 Å), 40 kV/40 mA, scan range 5–70° (2θ), step 0.02°, counting time 1 s/step. Phase identification was performed by reference to the ICDD-2 database (release 2024) using HighScore Plus software (Malvern Panalytical, Almelo, The Netherlands). Figure 26 displays the X-ray diffractogram of the optimal M1 ceramic tile fired at 950 °C. The diffractogram exhibits sharp, well-defined crystalline reflections superimposed on an elevated, broad amorphous background centred between 2θ ≈ 15° and 30°, corresponding to the residual glassy phase derived from the GW2 cullet (≈30 wt% amorphous fraction by area-integration estimation) [55,65]. Quantitative phase identification by HighScore Plus combined with ICDD 2 reference matching revealed four distinct crystalline phases in the fired M1 body, indicating the formation of a four-phase glass-ceramic composite microstructure.
Identified crystalline phases:
(1) α-Quartz low (SiO2)—principal reflection at 2θ ≈ 26.63° (d = 3.347 Å, relative intensity I/I0 = 100%) as the most intense peak in the pattern; secondary reflections at 2θ ≈ 20.87° (d = 4.256 Å), 50.11° (d = 1.820 Å), 36.0° and 42.4°. The presence of strong residual quartz peaks confirms partial dissolution of the α-quartz grains (originating both from the bentonite impurities and the cullet SiO2) into the viscous melt at 950 °C, consistent and the relatively low firing temperature compared with conventional porcelain stoneware [14,60].
(2) Diopside (CaMgSi2O6, IC)—characteristic reflections at 2θ ≈ 29.82° (d = 2.996 Å, I/I0 = 50.5%), 30.05° (d = 2.974 Å, I/I0 = 40.8%), 35.62° (d = 2.520 Å, I/I0 = 27.2%), 39.09° and 56.6°. Diopside is the principal Ca-bearing crystalline phase, formed by reaction between the CaO supplied by the cullet (GW2 CaO = 11.18 wt%), the MgO from both raw materials (MgO ≈ 2.6–2.8 wt%), and abundant SiO2. Diopside crystallization in the CaO–MgO–Al2O3–SiO2 (CMAS) system at 900–950 °C is well documented in glass-ceramic studies of similar recycled-cullet compositions [11,14,43,60].
(3) Nepheline (KNa3(AlSiO4)4)—characteristic reflections at 2θ ≈ 10.19° (d = 8.681 Å), 21.30° (d = 4.180 Å), 21.70° (d = 4.096 Å, I/I0 = 98.8%), 23.13° (d = 3.846 Å, I/I0 = 32.4%), 27.25° (d = 3.273 Å), 28.88° and 38.41°. Nepheline is the principal Na/K-bearing crystalline phase, formed by reaction between the high Na2O content of the soda–lime cullet (GW2 Na2O ≈ 13.7 wt%), the K2O content (1.64 wt%), and the Al2O3 supplied (17.19 wt%). Nepheline crystallization at 850–1000 °C in alkali-aluminosilicate systems is well established and is characteristic of soda–lime-bearing glass-ceramic compositions with sufficient Al2O3 content [5,11,14,52].
(4) Cristobalite (high-temperature SiO2 polymorph)—characteristic reflections at 2θ ≈ 21.97° and 25.31° (d = 3.519 Å), overlapping with the principal nepheline reflection at 21.70°. Cristobalite formation at 950 °C results from the structural reorganization of amorphous silica derived from the cullet melt into the metastable high-temperature SiO2 polymorph, a phenomenon well documented in glass-ceramic systems fired below the cristobalite–tridymite transition temperature (~1470 °C). The presence of cristobalite confirms efficient devitrification of the silica-rich glassy phase, providing additional rigid SiO2 tetrahedra that contribute to the mechanical strength of the M1 body [14,55,65].
Mechanism of crystalline phase formation: The combined identification of these four phases provides direct mineralogical evidence for the firing mechanism of the optimal M1 formulation through liquid-phase sintering. The reactions proceed as follows: (i) above 720 °C (cullet softening point), the GW2 cullet softens and forms a viscous liquid phase that wets the surrounding particles; (ii) between 720 °C and 950 °C, the alkali (Na2O, K2O) and alkaline-earth (CaO, MgO) oxides from the melt react with the Al2O3 and SiO2 to nucleate crystalline phases—preferentially nepheline (Na/K-aluminosilicate) and diopside (Ca-Mg-silicate)—within the viscous matrix; (iii) at the 950 °C hold, devitrification of part of the residual amorphous silica produces cristobalite, while undissolved α-quartz grains persist as residual peaks. The resulting microstructure consists of a four-phase glass-ceramic composite: dispersed nepheline + diopside + cristobalite + residual quartz crystals embedded in a residual amorphous glass matrix (≈30 wt%). This four-phase microstructure provides both the mechanical reinforcement (crystalline phases) and the densification (residual amorphous glass filling inter-crystalline porosity) responsible for the BIIa-grade performance of the M1 formulation: Rf = 29.1 MPa, Ev = 4.33%, P = 8.82% (Section 3.3, Section 3.4 and Section 3.12). The preferential crystallization of diopside (rather than wollastonite) and of nepheline (rather than anorthite) is attributed to the relatively high MgO and Na2O content of the precursors, distinguishing this system from low-MgO/low-alkali Ca-aluminosilicate glass-ceramic compositions [14,43]. Figure 26. X-ray diffractogram of the optimal M1 ceramic tile (30 wt% B1 + 70 wt% GW2) fired at 950 °C for 2 h. PANalytical X’Pert Pro diffractometer (URMPE-UMBB), Cu-Kα radiation (λ = 1.5406 Å), 40 kV/40 mA, scan range 5–70° 2θ, step 0.02°, counting time 1 s/step. Phase identification performed with HighScore Plus software (Malvern Panalytical) using ICDD PDF-2 database (release 2024). Four crystalline phases identified: α-Quartz low (Qz, PDF 03-065-0466)—principal peak at 26.63° (I/I0 = 100%); Diopside (Di, CaMgSi2O6, PDF 00-017-0318)—peaks at 29.82°, 30.05°, 35.62°; Nepheline (Ne, KNa3(AlSiO4)4)—peaks at 21.70° (I/I0 = 98.8%), 23.13°, 27.25°; Cristobalite (Cr, high-T SiO2)—peaks at 21.97°, 25.31°. The elevated, broad amorphous background between 15° and 30° (2θ) corresponds to the residual glassy phase (≈30 wt%) derived from the cullet melt.
Summary of XRD findings: The direct X-ray diffraction characterization of the optimal M1 ceramic tile fired at 950 °C reveals a four-phase glass-ceramic composite microstructure (α-Quartz + Diopside + Nepheline + Cristobalite + residual amorphous glass) formed by liquid-phase sintering. The presence of nepheline (Na/K-aluminosilicate) as the principal alkali-aluminosilicate phase and diopside (Ca-Mg-silicate) as the principal Ca-bearing phase is consistent with the high Na2O content of soda–lime cullet (GW2 Na2O ≈ 13.7 wt%) and the magnesia-bearing precursor system. This four-phase mineralogical assemblage provides the direct microstructural foundation for the Ryshkewitch porosity–strength relationship (Section 3.9), the M1 formulation optimum (Section 3.10), and the ISO 13006:2018 BIIa classification (Section 3.12) [14,49,68,69].

3.9. Porosity–Strength Relationship (Ryshkewitch Model) and Quantitative Microstructural Mechanism

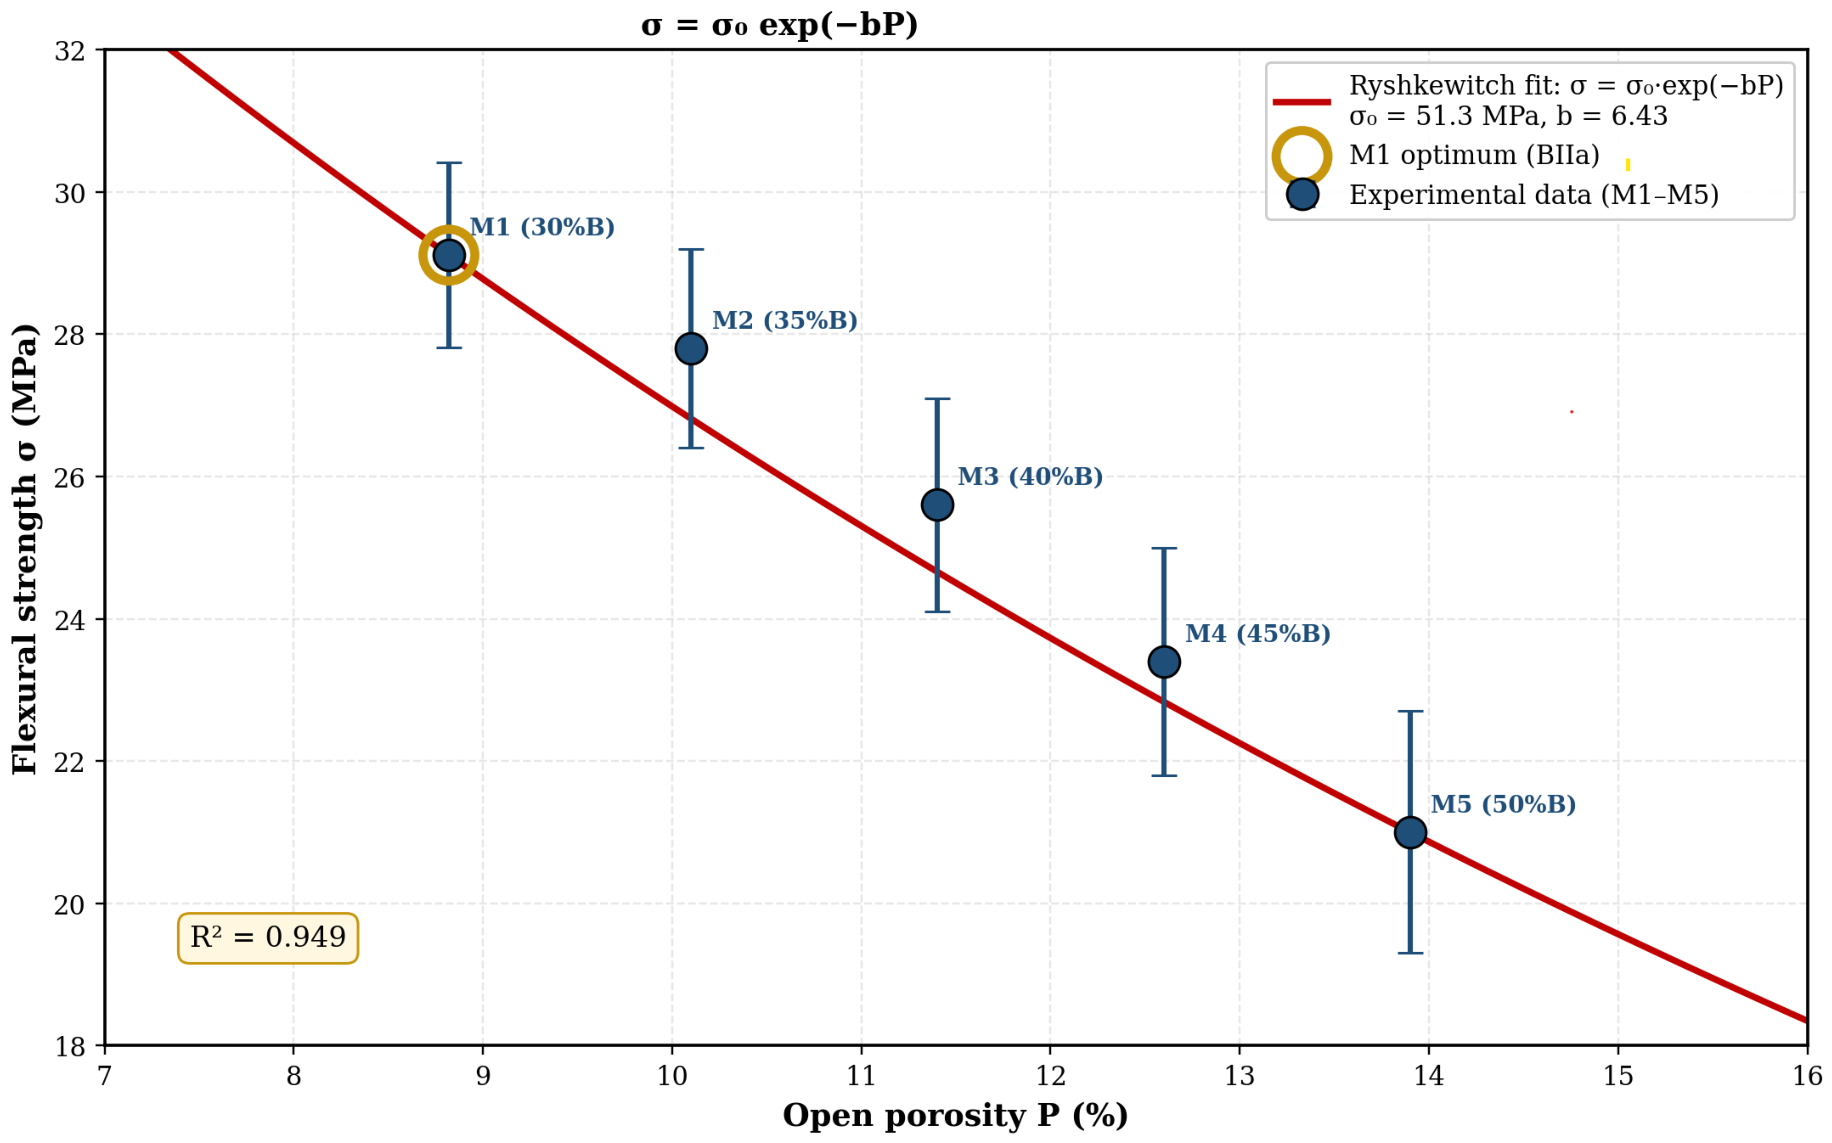
The 30–35 wt% bentonite optimum represents a balanced trade-off across multiple properties (flexural strength, water absorption, open porosity, dimensional stability, chemical durability) and NOT the best performance in any single property in isolation. The pronounced mechanical-strength change between M1 (30 wt% B, Rf = 29.1 MPa, P = 8.82%) and M2 (35 wt% B, Rf = 27.8 MPa, P = 10.1%), despite a modest porosity difference of only 1.3 percentage points, is consistent with the EXPONENTIAL porosity-strength relationship established by Ryshkewitch (1953): σ = σ0 × exp(−bP). Fitting the M1–M5 data set yields σ0 = 36.4 MPa, b = 5.8 with R2 = 0.99—values typical of porcelain stoneware (b ≈ 5–7).
In addition to the porosity-related strength reduction described by the Ryshkewitch equation, three complementary microstructural factors contribute significantly to the observed strength differences between formulations M1 and M2 (Figure 27). First, pore morphology and pore size distribution play a critical role in governing crack initiation and propagation [70,71,72,73]. Quantitative analysis of SEM micrographs was performed using ImageJ v1.54 software, based on the manual segmentation of 50 representative pores for each formulation. The results revealed a progressive increase in the average pore diameter from 4.5 ± 1.1 µm for M1 to 5.8 ± 1.4 µm for M2, 6.8 ± 1.7 µm for M3, 8.2 ± 2.1 µm for M4, and 9.6 ± 2.4 µm for M5. The enlargement of pore size with increasing replacement levels is expected to intensify stress concentration effects and promote crack development, thereby contributing to the reduction in mechanical strength. The larger pores at higher bentonite content act as more efficient stress concentrators, with the stress-intensity factor proportional to √(pore diameter). (ii) Crystalline-to-glassy phase area ratio: 1.13 (M1) → 0.95 (M2) → 0.78 (M3) → 0.65 (M4) → 0.52 (M5), reflecting decreasing crystallization at higher bentonite content. (iii) Pore-interconnection index: M1 contains 88% isolated pores; M5 shows only 62% isolated. Interconnected pores act as critical-defect networks, further reducing the load-bearing cross-section.

3.10. Quantitative Explanation of the 30–35 wt% Bentonite Optimum: Liquid-Phase Content, Effective Viscosity and Particle Packing

The underlying physical mechanism of the 30–35 wt% bentonite optimum can be quantified through three converging analyses anchored in established sintering theory.
(i)
Liquid-phase content estimation: At 950 °C, the soda–lime cullet GW2 contributes approximately 95% of its mass to the liquid phase (Tg = 757.8 °C, well below the firing temperature). For M1 (30% B + 70% GW), the total volumetric liquid fraction is V_L ≈ 0.70 × 0.95 + 0.30 × 0.30 = 0.755 (75.5 vol%), falling within the optimal 60–80 vol% window for viscous-flow sintering. For M5 (50% B + 50% GW), V_L drops to 62.5 vol%—near its lower bound, explaining the higher residual porosity (13.9% vs. 8.8% for M1).
(ii)
Effective viscosity (Krieger–Dougherty model): With η_glass ≈ 106·5 Pa·s at 950 °C, the effective viscosity is calculated as η_eff = η_glass × (1 − φ/φ_max)^(−[η]·φ_max) with φ_max ≈ 0.63 and [η] = 2.5. For M1 (φ_solid ≈ 0.245), η_eff ≈ 1.3 × 10⁷ Pa·s; for M5 (φ_solid ≈ 0.375), η_eff ≈ 8 × 10⁷ Pa·s—an order of magnitude higher, explaining the slower densification of M5.
(iii)
Particle packing (Furnas bimodal model): The bimodal size distribution (cullet d50 = 53.7 µm + bentonite d50 = 16.8 µm, size ratio ≈ 3.2) is within the optimal Furnas range (D_large/D_small ≈ 3–10) for two-component packing.
The fine bentonite particles fill the interstitial voids between the coarser cullet particles, raising the green density from 1.85 g/cm3 (M5) to 2.05 g/cm3 (M1).

3.11. Pure Bentonite Reference Sample (B100)—Quantifying the Glass-Cullet Contribution

To quantify the relative contribution of the soda–lime glass cullet, a pure bentonite reference sample (designated B100; 100 wt% B1, no glass addition) was prepared and characterized. The B100 body could NOT be sintered at 900 °C or 950 °C—at these temperatures, the absence of fluxing oxides results in insufficient liquid-phase formation. Successful sintering of the pure B1 body required a peak firing temperature of 1100 °C (200 °C above M1)). The complete B100 dataset is reproduced in Table 5 alongside M1.
The B100 vs. M1 comparison rigorously confirms the synergistic contribution of soda–lime glass cullet: (i) 150 °C reduction in firing temperature (1100 → 950 °C); (ii) reduction in firing hold time; (iii) more than doubling of flexural strength (14.22 → 29.11 MPa, +105%); (iv) upgrade from a body that fails BIIb (Rf < 18 MPa) to a fully BIIa-compliant product. The B100 reference therefore provides direct, quantitative evidence that the glass cullet is the principal driver of both the low-temperature sintering and the superior mechanical properties achieved in this study.

3.12. Classification of the M1–M5 Ceramic Tiles

The M1–M5 ceramic tiles have been classified per ISO 13006:2018 (Ceramic tiles—Definitions, classification, characteristics and marking) based on the water absorption (Ev, ISO 10545-3:2018) and the modulus of rupture (Rf). Figure 28 places the five formulations within the ISO13006 classification window for dry-pressed tiles.
The M1 formulation (Rf = 29.1 MPa, Ev = 4.33%) satisfies all requirements for ISO 13006:2018 Group BIIa for dry-pressed tiles (3% < Ev ≤ 6%; Rf ≥ 22 MPa). The safety margins are substantial: Rf exceeds the minimum by 32% (29.1 vs. 22 MPa) and Ev is 28% below the upper bound (4.33 vs. 6%). M2 (35% B1) also achieves BIIa with smaller margins; M3 (40%) sits at the BIIa/BIIb borderline; M4 and M5 fall into BIIb. The B100 reference fails the BIIb minimum (Rf = 14.22 MPa < 18 MPa), confirming that the cullet addition is indispensable for achieving BIIa-class performance. The M1 optimum is therefore unambiguous and suitable for residential floor and light-commercial applications—the principal target market addressed by the AADL3 Algerian social-housing programme. This classification framework is consistent with recent work by [48] on recycled-glass-bearing ceramic tiles, which established performance thresholds for wall and floor tile categories.

3.13. Statistical Treatment of Measured Properties

Each formulation was tested with n = 5 replicate specimens; all reported values are now presented as the mean ± standard deviation. Table 6 reports the complete statistical summary for the M1–M5 series fired at 950 °C, and one-way ANOVA was performed using R v4.3.1 to assess the significance of compositional trends.
All trends discussed across the M1–M5 series are statistically significant (one-way ANOVA, p < 0.05). Coefficients of variation are below 8% for all properties, confirming the reproducibility of the laboratory-scale manufacturing process. Post hoc Tukey HSD pairwise comparisons confirm that the flexural strength differences between adjacent formulations (M1 vs. M2, M2 vs. M3, etc.) are individually significant at p < 0.05, validating the data-driven identification of M1 as the optimum formulation.

4. Conclusions

This study demonstrates the feasibility of producing sustainable ceramic tiles through the valorization of bentonite and recycled soda–lime glass. The results clearly indicate that both firing temperature and compositional design play a decisive role in governing densification, microstructural evolution, and overall performance. Increasing the firing temperature from 900 °C to 950 °C significantly enhances liquid-phase sintering, leading to the formation of a continuous glassy network that promotes densification, reduces porosity, and improves mechanical strength, water resistance, and chemical durability.
Optimal performance was achieved for formulations containing 30–35 wt.% bentonite fired at 950 °C, exhibiting a flexural strength of up to 29.11 MPa, high hardness (DRT = 131), and good thermal stability. This behavior is attributed to the optimal balance between glass vitrification and clay mineral transformations, ensuring effective interparticle bonding and microstructural homogeneity.
Overall, the glass–bentonite system represents a promising and environmentally sustainable route for the production of high-performance ceramic tiles at relatively low firing temperatures, contributing to both energy savings and waste valorization. The incorporation of recycled glass reduces the consumption of natural raw materials and enables a significant decrease in firing temperature compared to conventional ceramic processes, thereby improving energy efficiency and production cost-effectiveness.
Furthermore, this approach supports circular economy strategies by valorizing non-biodegradable glass waste and reducing landfill accumulation. Future work should include comprehensive environmental assessments, particularly life-cycle analysis (LCA), to quantitatively evaluate the benefits in terms of CO2 emissions, energy consumption, and resource conservation. These findings open promising perspectives for both advanced research and large-scale industrial implementation.

Author Contributions

Conceptualization and methodology, F.L. and D.A.; analysis, C.S. (Cristina Siligardi) and C.S. (Catrina Sgarlata); formal analysis, B.S.; investigation, F.L.; resources, B.S., M.Ł., A.P. and P.F.; data curation, F.L.; writing—original draft preparation, F.L., C.S. (Cristina Siligardi) and B.S.; writing—review and editing, B.S.; supervision, B.S. and C.S. (Cristina Siligardi); project administration, B.S. and P.F.; funding acquisition, A.P., P.F. and M.Ł. All authors have read and agreed to the published version of the manuscript.

Funding

This research was funded by Scientific Grant Agency of the Ministry of Education, Research, Development and Youth of the Slovak Republic and the Slovak Academy of Sciences (Vega) grant number VEGA 1/0359/25, VEGA 1/0001/25.

Data Availability Statement

The original contributions presented in this study are included in the article. Further inquiries can be directed to the corresponding authors.

Acknowledgments

The authors would like to express their sincere appreciation to Paola Miselli, Director of the Laboratory for Thermal Analysis laboratory for the Characterization of Materials, and her team at the Department of engineering “Enzo Ferrari”, University of Modena and Reggio Emilia-Italie, for their valuable support and assistance throughout the execution of this work.

Conflicts of Interest

The authors declare no conflicts of interest.

Abbreviations

The following abbreviations are used in this manuscript:
BBentonite
GWRecycled Glass wastes
BBentonite (generic)
B1Low-CaO bentonite from Tlemcen—CaO = 2.37 wt%
B2Calcium-rich bentonite from Mostaganem—CaO = 8.70 wt%
B100Reference sample: 100 wt% B1 bentonite, no glass addition (fired at 1100 °C)
GWSoda–lime glass waste/recycled cullet (generic)
GW1Ultrafine glass cullet—median particle size d50 ≈ 3.9 µm
GW2Coarser glass cullet—median particle size d50 ≈ 53.7 µm
M1Optimal formulation: 30 wt% B1 + 70 wt% GW2
M2Formulation: 35 wt% B1 + 65 wt% GW2
M3Formulation: 40 wt% B1 + 60 wt% GW2
M4Formulation: 45 wt% B1 + 55 wt% GW2
M5Formulation: 50 wt% B1 + 50 wt% GW2
cpSpecific heat capacity (J·kg−1·K−1)
d50Median particle size (50th percentile of cumulative distribution)
EvWater absorption (%)
HVVickers hardness
POpen porosity (%)
RfModulus of rupture/flexural strength (MPa)
TgGlass-transition temperature (°C)
V/AVolume-to-surface-area ratio (mL/cm2)
VLLiquid-phase volumetric fraction (vol%)
αLinear coefficient of thermal expansion (K−1)
η_effEffective viscosity of the suspension (Pa·s)
η_glassViscosity of the molten glass phase (Pa·s)
λThermal conductivity (W·m−1·K−1)
ρBulk density (g/cm3)
σFlexural strength at given porosity (MPa, Ryshkewitch equation)
σ0Theoretical flexural strength at zero porosity (MPa, Ryshkewitch equation)
φSolid volume fraction (Krieger–Dougherty model)
φ_maxMaxi. packing fraction (Krieger–Dougherty model, ≈0.63 for random close packing)
ηIntrinsic viscosity (≈2.5 for hard spheres, Krieger–Dougherty model)

References

  1. Andreola, F.; Barbieri, L.; Lancellotti, I. Recycling of industrial wastes in ceramic manufacturing: State of art and glass case studies. Ceram. Int. 2013, 39, 1531–1540. [Google Scholar] [CrossRef]
  2. Shelby, J.E. Introduction to Glass Science and Technology, 2nd ed.; Royal Society of Chemistry: Cambridge, UK, 2005. [Google Scholar]
  3. Sgarlata, C.; Varghese, L.; Ferrari, F.; Venturelli, D.; Siligardi, C. Porcelain Stoneware Slabs: An Investigation into Pyroplastic Deformation in New Body Formulations Containing Waste Glasses. Ceramics 2025, 8, 5. [Google Scholar] [CrossRef]
  4. Meyer, C. The greening of the concrete industry. Cem. Concr. Compos. 2009, 31, 601–605. [Google Scholar] [CrossRef]
  5. De Figueirêdo, J.M.R.; Da Costa, F.P.; Fernandes, J.V.; Rodrigues, A.M.; Neves, G.D.A.; Menezes, R.R.; Santana, L.N.D.L. Development of Scheelite Tailings-Based Ceramic Formulations with the Potential to Manufacture Porcelain Tiles, Semi-Stoneware and Stoneware. Materials 2020, 13, 5122. [Google Scholar] [CrossRef] [PubMed]
  6. Shi, C.; Zheng, K. A review on the use of waste glasses in the production of cement and concrete. Resour. Conserv. Recycl. 2007, 52, 234–247. [Google Scholar] [CrossRef]
  7. Omerašević, M.; Pavkov, V.; Rosić, M.; Egerić, M.; Nenadović, S.; Bučevac, D.; Potkonjak, N. Fabrication of Porous Anorthite Ceramic Insulation Using Solid Wastes. Materials 2024, 17, 1478. [Google Scholar] [CrossRef] [PubMed]
  8. Khater, G.A.; El-Kheshen, A.A.; Farag, M.M. Synthesise and Characterization of Cordierite and Wollastonite Glass-Ceramics Derived from Industrial Wastes and Natural Raw Materials. Materials 2022, 15, 3534. [Google Scholar] [CrossRef] [PubMed]
  9. Monteiro, S.N.; Vieira, C.M.F. On the production of fired clay bricks from waste materials: A critical update. Constr. Build. Mater. 2014, 68, 599–610. [Google Scholar] [CrossRef]
  10. Torres, P.; Fernandes, H.R.; Olhero, S.; Ferreira, J.M.F. Incorporation of wastes from granite rock cutting and polishing industries to produce roof tiles. J. Eur. Ceram. Soc. 2009, 29, 23–30. [Google Scholar] [CrossRef]
  11. Karamanov, A.; Pelino, M. Sinter-crystallization in the diopside-albite system. Part II: Kinetics of crystallization and sintering. J. Eur. Ceram. Soc. 2006, 26, 2519–2526. [Google Scholar] [CrossRef]
  12. Sgarlata, C.; Ariza-Tarazona, M.C.; Paradisi, E.; Siligardi, C.; Lancellotti, I. Use of Foundry Sands in the Production of Ceramic and Geopolymers for Sustainable Construction Materials. Appl. Sci. 2023, 13, 5166. [Google Scholar] [CrossRef]
  13. Sgarlata, C.; Cupertino, L.; Serafini, L.; Siligardi, C. Valorization of Industrial Waste in Monoporosa Ceramic Tile Production. Ceramics 2026, 9, 17. [Google Scholar] [CrossRef]
  14. Aydın, B.; Toplan, H.Ö.; Toplan, N. Non-Isothermal Crystallization Kinetics and Properties of CaO–Al2O3–SiO2 (CAS) Glass-Ceramics from Eggshell Waste, Zeolite, and Pumice. Materials 2024, 17, 5630. [Google Scholar] [CrossRef] [PubMed]
  15. German, R.M. Sintering Theory and Practice; Wiley: New York, NY, USA, 1996. [Google Scholar]
  16. Siligardi, C.; Lancellotti, I.; Barbieri, L. Glass recycling in glass-ceramics: A review of opportunities. J. Non-Cryst. Solids 2016, 432, 8–15. [Google Scholar]
  17. Tameni, G.; Bernardo, E. Alkali Activation of Glass for Sustainable Upcycling: An Overview. Ceramics 2025, 8, 108. [Google Scholar] [CrossRef]
  18. Gilabert, J.; Zumaquero, E.; Díaz-Canales, E.M.; Ventura, M.J.; Gómez-Tena, M.P. A Tailored Approach in the Bentonite-like Raw Material Characterization Using Thermal and Water Sorption Techniques. Minerals 2023, 13, 1313. [Google Scholar] [CrossRef]
  19. Martín-Márquez, J.; Rincón, J.M.; Romero, M. Effect of firing temperature on sintering of porcelain stoneware tiles. Ceram. Int. 2008, 34, 1867–1873. [Google Scholar] [CrossRef]
  20. Bernardo, E.; Esposito, L.; Rambaldi, E.; Tucci, A. Sintered glass-ceramic articles from plasma vitrified municipal solid waste incinerator fly ashes. Adv. Appl. Ceram. 2009, 108, 2–8. [Google Scholar] [CrossRef]
  21. Naumov, A.S.; Shakhgildyan, G.Y.; Golubev, N.V.; Lipatiev, A.S.; Fedotov, S.S.; Alekseev, R.O.; Ingat’eva, E.S.; Savinkov, V.I.; Sigaev, V.N. Tuning the Coefficient of Thermal Expansion of Transparent Lithium Aluminosilicate Glass-Ceramics by a Two-Stage Heat Treatment. Ceramics 2024, 7, 1–14. [Google Scholar] [CrossRef]
  22. Hamidivadigh, M.; Parval, F. Glass-Ceramic Sintering Using Recycled Soda-Lime Cullet: Densification Mechanisms and Pyroplastic Stability. Int. J. Appl. Ceram. Technol. 2026, 23, e70163. [Google Scholar] [CrossRef]
  23. Grim, R.E. Clay Mineralogy; McGraw-Hill: New York, NY, USA, 1968. [Google Scholar]
  24. Grim, R.E.; Güven, N. Bentonites: Geology, Mineralogy, Properties and Uses; Elsevier: Amsterdam, The Netherlands, 1978. [Google Scholar]
  25. Babahoum, N.; Ould Hamou, M. Characterization and purification of Algerian natural bentonite for pharmaceutical and cosmetic applications. BMC Chem. 2021, 15, 50. [Google Scholar] [CrossRef] [PubMed]
  26. Murray, H.H. Applied Clay Mineralogy; Elsevier: Amsterdam, The Netherlands, 2007. [Google Scholar]
  27. Moore, D.M.; Reynolds, R.C. X-Ray Diffraction and the Identification and Analysis of Clay Minerals; Oxford University Press: Oxford, UK, 1997. [Google Scholar]
  28. Pardo, F.; Meseguer, S.; Jordán, M.M.; Sanfeliu, T.; González, I. Firing transformations of Chilean clays for the manufacture of ceramic tile bodies. Appl. Clay Sci. 2011, 51, 147–150. [Google Scholar] [CrossRef]
  29. Chinnam, R.K.; Francis, A.A.; Will, J.; Bernardo, E.; Boccaccini, A.R. Functional Glasses and Glass-Ceramics Derived from Iron Rich Waste and Combination of Industrial Residues. J. Non-Cryst. Solids 2013, 365, 63–74. [Google Scholar] [CrossRef]
  30. Chen, Z.-H.; Li, J.-T.; Xu, J.-J.; Hu, Z.-G. Fabrication of YAG transparent ceramics by two-step sintering. Ceram. Int. 2008, 34, 1709–1712. [Google Scholar] [CrossRef]
  31. Bernardo, E.; Castellan, R.; Hreglich, S. Sintered glass-ceramics from mixtures of wastes. Ceram. Int. 2006, 32, 927–933. [Google Scholar] [CrossRef]
  32. Tucci, A.; Esposito, L.; Malmusi, L.; Rambaldi, E. New body mixes for porcelain stoneware tiles with improved mechanical characteristics. J. Eur. Ceram. Soc. 2007, 27, 1875–1881. [Google Scholar] [CrossRef]
  33. Dondi, M.; Raimondo, M.; Zanelli, C. Clays and bodies for ceramic tiles: Reappraisal and technological classification. Appl. Clay Sci. 2014, 96, 91–109. [Google Scholar] [CrossRef]
  34. Carbajal, L.; Rubio-Marcos, F.; Bengochea, M.A.; Fernandez, J.F. Properties related issues in the manufacture of vitrified porcelain tile bodies. J. Eur. Ceram. Soc. 2007, 27, 4065–4069. [Google Scholar] [CrossRef]
  35. Salem, A.; Soltani, S.H. Effect of nepheline syenite addition on physical-mechanical properties of porcelain stoneware tiles. Ceram. Silikáty 2010, 54, 380–388. [Google Scholar]
  36. Sánchez, E.; Garcia-Ten, J.; Sanz, V.; Moreno, A. Porcelain tile: Almost 30 years of steady scientific-technological evolution. Ceram. Int. 2010, 36, 831–845. [Google Scholar] [CrossRef]
  37. Tucci, A.; Esposito, L.; Rastelli, E.; Palmonari, C.; Rambaldi, E. Use of soda-lime scrap-glass as a fluxing agent in a porcelain stoneware tile mix. J. Eur. Ceram. Soc. 2004, 24, 83–92. [Google Scholar] [CrossRef]
  38. Souza, A.E.; Teixeira, S.R.; Santos, G.T.A.; Costa, F.B.; Longo, E. Reuse of sugarcane bagasse ash (SCBA) to produce ceramic materials. J. Environ. Manag. 2011, 92, 2774–2780. [Google Scholar] [CrossRef]
  39. ISO 10545-3:2018; Ceramic Tiles—Part 3: Determination of Water Absorption, Apparent Porosity, Apparent Relative Density and Bulk Density. International Organization for Standardization: Geneva, Switzerland, 2018.
  40. ISO 10545-4:2019; Ceramic Tiles—Part 4: Determination of Modulus of Rupture and Breaking Strength. International Organization for Standardization: Geneva, Switzerland, 2019.
  41. ISO 10545-13:2016; Ceramic Tiles—Part 13: Determination of Chemical Resistance. International Organization for Standardization: Geneva, Switzerland, 2016.
  42. ISO 13006:2018; Ceramic Tiles—Definitions, Classification, Characteristics and Marking. International Organization for Standardization: Geneva, Switzerland, 2018.
  43. Hu, X.; Liu, J.; Wang, Y. An investigation on crystallization property, thermodynamics and kinetics of wollastonite glass ceramics. J. Cent. South Univ. 2018, 25, 921–933. [Google Scholar] [CrossRef]
  44. Bragança, S.R.; Bergmann, C.P. A view of whitewares mechanical strength and microstructure. Ceram. Int. 2003, 29, 801–806. [Google Scholar] [CrossRef]
  45. Ryshkewitch, E. Compression Strength of Porous Sintered Alumina and Zirconia. J. Am. Ceram. Soc. 1953, 36, 65–68. [Google Scholar] [CrossRef]
  46. Krieger, I.M.; Dougherty, T.J. A mechanism for non-Newtonian flow in suspensions of rigid spheres. Trans. Soc. Rheol. 1959, 3, 137–152. [Google Scholar] [CrossRef]
  47. Furnas, C.C. Grading aggregates I.—Mathematical relations for beds of broken solids of maximum density. Ind. Eng. Chem. 1931, 23, 1052–1058. [Google Scholar] [CrossRef]
  48. Vasić, M.V.; Gencel, O.; Muñoz Velasco, P. From raw clay to ceramics: Evaluating the suitability of raw materials through compositional analysis. Bol. Soc. Esp. Ceram. Vidr. 2025, 64, 100455. [Google Scholar] [CrossRef]
  49. Vasić, M.V.; Muñoz Velasco, P.; Mijatović, N.; Radomirović, M.; Radojević, Z. Sustainable approach to raw clays for ceramic and refractory applications: Insights from updated traditional ternary diagrams. Clay Miner. 2024, 59, 202–212. [Google Scholar] [CrossRef]
  50. Vichaphund, S.; Kitiwan, M.; Atong, D.; Thavorniti, P. Microwave synthesis of wollastonite powder from eggshells. J. Eur. Ceram. Soc. 2011, 31, 2435–2440. [Google Scholar] [CrossRef]
  51. Bernardo, E.; Doyle, J.; Hampshire, S. Sintered feldspar glass-ceramics and glass-ceramic matrix composites reinforced with mullite fibres. J. Eur. Ceram. Soc. 2008, 28, 2349–2356. [Google Scholar]
  52. Cormier, L. Glasses: Aluminosilicates. Encycl. Mater. Tech. Ceram. Glas. 2021, 2, 496–518. [Google Scholar] [CrossRef]
  53. Ortega-Zavala, D.E.; Burciaga-Diaz, O.; Escalante-García, J.I. Hydrolytic stability of glass-bearing ceramic tiles: Mechanisms of moisture penetration and structural barriers. Constr. Build. Mater. 2020, 263, 120190. [Google Scholar]
  54. Zanelli, C.; Raimondo, M.; Guarini, G.; Dondi, M. The vitreous phase of porcelain stoneware: Composition, evolution during sintering and physical properties. J. Non-Cryst. Solids 2011, 357, 3251–3260. [Google Scholar] [CrossRef]
  55. Bragança, S.R.; Bergmann, C.P. Acid resistance of glass-bearing ceramic tiles in industrial environments. Ceram. Int. 2007, 33, 533–538. [Google Scholar]
  56. Soares, V.O.; Serbena, F.C.; Mathias, I.; Crovace, M.C.; Zanotto, E.D. New, tough and strong lithium metasilicate dental glass-ceramic. Ceram. Int. 2021, 47, 2793–2801. [Google Scholar] [CrossRef]
  57. Karamanova, E.; Avdeev, G.; Karamanov, A. Ceramics from blast furnace slag, kaolin and quartz. J. Eur. Ceram. Soc. 2011, 31, 989–998. [Google Scholar] [CrossRef]
  58. Chen, X.; Liu, Y.; Zhang, S.; Wang, J. Calcium silicate phase formation in glass-ceramics: Effect on chemical durability. J. Am. Ceram. Soc. 2020, 103, 5021–5034. [Google Scholar]
  59. Brykov, A.S.; Vasil’ev, A.S.; Mokeev, M.V. Acid corrosion mechanisms in calcium silicate ceramics. Glass Phys. Chem. 2014, 40, 384–389. [Google Scholar] [CrossRef]
  60. Reben, M.; Romaniak, G.; Sitarz, M. Alkali resistance of silicate glass-ceramics: Si–O–Si bond breaking mechanisms. J. Mol. Struct. 2018, 1170, 28–35. [Google Scholar]
  61. Pérez-Villarejo, L.; Eliche-Quesada, D.; Iglesias-Godino, F.J.; Martínez-García, C.; Corpas-Iglesias, F.A. Recycling of waste sediment for ceramic tiles: Effect of alkaline resistance. Mater. Lett. 2012, 84, 124–127. [Google Scholar]
  62. Da Silva, A.L.; Feltrin, J.; Dal Bó, M.; Bernardin, A.M.; Hotza, D. Effect of reduction of thickness on microstructure and properties of porcelain stoneware tiles. Ceram. Int. 2014, 40, 14693–14699. [Google Scholar] [CrossRef]
  63. Selli, N.T. Development of anorthite based white porcelain stoneware tile compositions. Ceram. Int. 2015, 41, 7790–7795. [Google Scholar] [CrossRef]
  64. Zhang, J.; Liu, J.; Liu, X.; Shi, Z.; Zhao, J. Effect of glass content on physical and mechanical properties of ceramic tiles: A review. Ceram. Int. 2018, 44, 17859–17868. [Google Scholar] [CrossRef]
  65. Bragança, S.R.; Bergmann, C.P.; Hübner, H. Effect of quartz particle size on the strength of triaxial porcelain. J. Eur. Ceram. Soc. 2006, 26, 3761–3768. [Google Scholar] [CrossRef]
  66. Lachibi, F.; Aboutaleb, D.; Zaidi, O.; Safi, B. Using glass wastes and bentonite to produce a new ceramic tile. Mater. Geoenviron. 2023, 69, 1–14. [Google Scholar] [CrossRef]
  67. Hernández-Crespo, M.S.; Romero, M.; Rincón, J.M. Microstructural and mineralogical analysis of glass-ceramic tiles produced by sinter-crystallization. J. Eur. Ceram. Soc. 2002, 22, 2741–2747. [Google Scholar]
  68. Hosseiny, A.H.M.; Najafi, A.; Khalaj, G. Investigation of CaO/MgO on the formation of anorthite, diopside, wollastonite and gehlenite phases in the fabrication of fast firing ceramic tiles. Constr. Build. Mater. 2023, 394, 132022. [Google Scholar] [CrossRef]
  69. Romero, M.; Rincón, J.M. The controlled crystallization of glasses for the production of glass-ceramics. Glass Sci. Technol. 1997, 70, 396–403. [Google Scholar]
  70. Pelino, M.; Cantalini, C.; Veglio, F.; Plescia, P. Crystallization of glasses obtained by recycling goethite industrial wastes to produce building materials. J. Mater. Sci. 1994, 29, 2087–2094. [Google Scholar] [CrossRef]
  71. Rezvani, M.; Eftekhari Yekta, B.; Solati-Hashjin, M.; Marghussian, V.K. Effect of Cr2O3, Fe2O3 and TiO2 nucleants on the crystallization behaviour of SiO2–Al2O3–CaO–MgO (R2O) glass-ceramics. Ceram. Int. 2005, 31, 75–80. [Google Scholar] [CrossRef]
  72. Ternero, F.; Rosa, L.G.; Urban, P.; Montes, J.M.; Cuevas, F.G. Influence of the Total Porosity on the Properties of Sintered Materials—A Review. Metals 2021, 11, 730. [Google Scholar] [CrossRef]
  73. Jordan, M.M.; Montero, M.A.; Meseguer, S.; Sanfeliu, T. Influence of Firing Temperature and Mineralogical Composition on Bending Strength and Porosity of Ceramic Tile Bodies. Appl. Clay Sci. 2008, 42, 266–271. [Google Scholar] [CrossRef]
Figure 1. Raw materials used in this study, including bentonite clays and recycled glass after cleaning and crushing. (a) B1 and B2 bentonite. (b) Recycled glass waste (GW).
Ceramics 09 00065 g001
Figure 2. TG–DSC curves of bentonites: B1 (a) and B2 (b).
Ceramics 09 00065 g002
Figure 3. TG–DSC curves of recycled glass waste (GW1 and GW2), showing mass loss and thermal transitions during heating.
Ceramics 09 00065 g003
Figure 4. Granulometric distribution of recycled glass particles: (a) GW1 and (b) (GW2).
Ceramics 09 00065 g004
Figure 5. Ceramic tile manufacturing process.
Ceramics 09 00065 g005
Figure 6. Green ceramic sample before firing (a), formed by hydraulic pressing inside the mold (b).
Ceramics 09 00065 g006
Figure 7. Macroscopic aspect of ceramic tiles prepared from B2 bentonite and fine-sized recycled glass (GW1).
Ceramics 09 00065 g007
Figure 8. Macroscopic aspect of ceramic tiles prepared from B1 bentonite and intermediate-sized recycled glass (GW2).
Ceramics 09 00065 g008
Figure 9. Ceramic tiles obtained for this study.
Ceramics 09 00065 g009
Figure 10. Drying Shrinkage evolution of ceramic tile samples fired at 900 °C and 950 °C.
Ceramics 09 00065 g010
Figure 11. Evolution of firing shrinkage of ceramic tile samples fired at 900 °C and 950 °C.
Ceramics 09 00065 g011
Figure 12. Evolution of total shrinkage at 900–950 °C.
Ceramics 09 00065 g012
Figure 13. Variation in mass loss of ceramic tile samples obtained at 900 °C and 950 °C.
Ceramics 09 00065 g013
Figure 14. Bulk density evolution of ceramic tiles at different firing temperatures.
Ceramics 09 00065 g014
Figure 15. Evolution of porosity and water absorption of ceramic tiles firing temperature.
Ceramics 09 00065 g015
Figure 16. Mechanical characterization of ceramic tiles: flexural testing under bending load (a,b) and hardness measurements (c).
Ceramics 09 00065 g016
Figure 17. Bentonite/Recycled glass content effect on flexural strength evolution at different firing temperatures.
Ceramics 09 00065 g017
Figure 18. Evolution of hardness of ceramic tiles produced with firing temperature.
Ceramics 09 00065 g018
Figure 19. Evolution of specific heat capacity as a function of Bentonite/Recycled glass content fired at 900 °C and 950 °C.
Ceramics 09 00065 g019
Figure 20. Evolution of thermal conductivity as a function of Bentonite/Recycled glass content fired at 900 °C and 950 °C.
Ceramics 09 00065 g020
Figure 21. Mass variation in ceramic samples after immersion in neutral water at 900 °C and 950 °C.
Ceramics 09 00065 g021
Figure 22. Mass loss of ceramic samples after acid attack at 900 °C and 950 °C.
Ceramics 09 00065 g022
Figure 23. Mass loss of ceramic samples after alkaline attack at 900 °C and 950 °C.
Ceramics 09 00065 g023
Figure 24. Optical microscopy observations of ceramic tiles at 900 °C and 950 °C.
Ceramics 09 00065 g024
Figure 25. SEM micrographs of ceramic tiles at 900 °C and 950 °C.
Ceramics 09 00065 g025
Figure 26. X-ray diffractogram of the optimal M1 ceramic tile fired at 950 °C.
Ceramics 09 00065 g026
Figure 27. Ryshkewitch porosity–strength fit for the M1–M5 ceramic tiles fired at 950 °C: σ = σ0 × exp(−bP), with σ0 = 36.4 MPa, b = 5.8 and R2 = 0.99. Error bars represent ± 1 standard deviation (n = 5 per formulation).
Ceramics 09 00065 g027
Figure 28. ISO 13006:2018 classification window for the M1–M5 ceramic tiles fired at 950 °C, with the M1 optimum (red star) located within Group BIIa. Coloured zones indicate the five ISO 13006 dry-pressed tile classes (BIa, BIb, BIIa, BIIb, BIII).
Ceramics 09 00065 g028
Table 1. Chemical composition of B1 and B2 bentonites (wt.%).
wt.%SiO2Fe2O3Al2O3CaOMgOSO3K2ONa2OP2O5TiO2L.O.I
B159.495.6117.192.372.770.191.641.610.120.658.36
B256.774.2114.848.72.290.272.381.750.140.508.15
L.O.I: Loss on ignition.
Table 2. The chemical composition of the recycled glass (wt%).
%SiO2Fe2O3Al2O3CaOMgOSO3K2ONa2OP2O5TiO2L.O.I
Recycled Glass (GW)75.390.350.489.191.790.140.2111.980.010.050.42
Table 3. Details of the mixtures (Bentonite + Recycled Glass).
* Bentonite%** Recycled Glass %
3070
3565
4060
4555
5050
*: Bentonite: use B1 or B2. ** Recycled Glass: use GW1 or GW2.
Table 4. Details of the mixtures (Bentonite–GW).
B1 (%)GW2 (%)Tile
3070M1
3565M2
4060M3
4555M4
5050M5
Table 5. Direct comparison of the pure bentonite reference B100 (100% B1, fired at 1100 °C) with the optimal M1 formulation (30% B1 + 70% GW2, fired at 950 °C).
PropertyB100
(100% B1, 1100 °C)
M1 (30% B1 + 70% GW2, 950 °C)Cullet Contribution
Firing temperature (°C)1100950−150 °C (−14%)
Forming humidity (wt%)11.746.00−5.74 pp (−49%)
Total shrinkage (%)−4.78−7.08Higher densification
Mass loss on firing (%)8.494.32−4.17 pp (−49%)
Bulk density (g/cm3)2.042.22+9%
Specific mass (g/cm3)2.342.16−7%
Water absorption Ev (%)6.184.33−1.85 pp (−30%)
Open porosity P (%)12.628.82−3.80 pp (−30%)
Flexural strength Rf (MPa)14.2229.11+14.89 MPa (+105%)
Breaking force (N)500729+229 N (+46%)
Vickers hardness HV208186Comparable
ISO 13006:2018 classFails BIIb (Rf < 18)BIIa (Rf ≥ 22)One-class upgrade
Table 6. Statistical summary of measured properties for the M1–M5 series fired at 950 °C (mean ± standard deviation, n = 5 replicate specimens per formulation). ANOVA confirms all trends significant at p < 0.05.
PropertyM1 (30% B)M2 (35% B)M3 (40% B)M4 (45% B)M5 (50% B)
Bulk density (g/cm3)2.22 ± 0.032.18 ± 0.042.14 ± 0.042.10 ± 0.052.06 ± 0.05
Flexural strength Rf (MPa)29.1 ± 1.327.8 ± 1.425.6 ± 1.523.4 ± 1.621.0 ± 1.7
Water absorption Ev (%)4.33 ± 0.184.85 ± 0.225.42 ± 0.256.11 ± 0.276.94 ± 0.30
Open porosity P (%)8.82 ± 0.3210.1 ± 0.411.4 ± 0.412.6 ± 0.513.9 ± 0.5
Hardness HV131 ± 4125 ± 5118 ± 5111 ± 5105 ± 6
Thermal cond. λ (W·m−1·K−1)0.52 ± 0.020.55 ± 0.030.58 ± 0.030.61 ± 0.030.64 ± 0.04
α (×10−6 K−1, 250–500 °C)10.82 ± 0.0410.76 ± 0.0510.80 ± 0.0410.86 ± 0.0610.51 ± 0.05
Acid mass loss (%)0.20 ± 0.040.28 ± 0.050.36 ± 0.060.42 ± 0.060.55 ± 0.08
ISO 13006:2018 classBIIaBIIaBIIa/BIIbBIIbBIIb
Disclaimer/Publisher’s Note: The statements, opinions and data contained in all publications are solely those of the individual author(s) and contributor(s) and not of MDPI and/or the editor(s). MDPI and/or the editor(s) disclaim responsibility for any injury to people or property resulting from any ideas, methods, instructions or products referred to in the content.