Abstract
Barium strontium titanates (Ba1−xSrxTiO3, BST) with varying barium-to-strontium ratios were synthesized by the solid-state route (SSR) as well as by the sol–gel process (SGP). In the case of the SSR, the strontium amount x was varied from 0.0 to 0.25 in 0.05 steps, due to the enhanced synthetic effort, and in the case of the SGP, x was set only to 0.05, 0.15, and 0.25. The resulting properties after synthesis, calcination, and sintering, like particle size distribution, specific surface area, particle morphology, and crystalline phase were characterized. The expected tetragonal phase, free from any remarkable impurity, was found in all cases, and irrespective of the selected synthesis method. Pressed pellets were used for the measurement of the temperature and frequency-dependent relative permittivity enabling the estimation of the Curie temperatures of all synthesized BSTs. Irrespective of the selected synthesis method, the obtained Curie temperature drops with increasing strontium content to almost identical values, e.g., in the case of x = 0.15, a Curie temperature range 95–105 °C was measured. Thin BST films could be deposited on different substrate materials applying electrophoretic deposition in a good and reliable quality according to the Hamaker equation. The properties of the BSTs obtained by the simpler solid-state route are almost identical to the ones yielded by the more complex sol–gel process. In future, this result allows for a possible wider usage of BST perovskites for ferroelectric and piezoelectric devices due to the easy synthetic access by the solid-state route.
1. Introduction
Electroceramics with perovskite crystal structure have been investigated for many years regarding their outstanding ferroelectric and piezoelectric properties enabling a huge variety of different electronic devices like capacitors, sensors and actuators, energy harvesters, energy storage parts, smart wearables, and many more [1,2,3,4,5,6]. Some of the most important perovskites with prominent ferro- and piezoelectric properties contain lead, like PZT (lead zirconate titanate), which should not be used anymore due to environmental reasons. Therefore, a huge effort was made with respect to the substitution of lead-based perovskites by other suitable ceramics with comparable properties like barium titanate or the promising niobates [5,6,7,8,9]. Particularly in the case of the different niobates, the complex phase diagrams with the presence of a huge number of close lying different phases hinder a widespread technical application [7,8,9]. Consequently, the focus was set on barium titanate with a simpler phase behavior especially in the vicinity of the Curie temperature [10]. In addition, and due to the flexibility of the perovskite phase, doping or a partial substitution of the A2+ or B4+ position of the general ABO3 structure enables property tailoring like permittivity, piezoelectricity or Curie temperature adjustment, targeting special applications like capacitors, actuators, sensors or energy harvesters [11,12,13,14].
Of particular interest is the substitution of barium by strontium forming Ba1−xSrxTiO3 (BST) in the 0 ≤ x ≤ 1 range, tailoring the Curie temperature of BST regarding typical temperatures relevant for, e.g., consumer electronics [1]. In general, two main synthetic methods can be performed for the realization of BST ceramics: first, the solid-state route (SSR) starting with mixing the solid educts in the desired stoichiometry, followed by calcination, delivers the targeted perovskites in good quality [15,16,17,18,19,20,21,22,23,24]. Second, the sol–gel process (SGP), starting from metal–organic educts in solution and inorganic polycondensation (gelation) after, e.g., pH-variation, followed by precipitation and calcination, allows for the realization of very pure products [25,26,27,28,29,30]. Chilibon and Marat-Mendes examined different synthetic routes for the realization of ferroelectric ceramics [26]. They described SSR and SGP, but the comparison clearly shows the reduced effort in case of the SSR [26], also known as mixed oxide processing in contrast to the different SGP techniques [26]. The aim of this work is now to compare BSTs with different compositions synthesized by the solid-state route as well as by the sol-gel process regarding their different properties and thin film formation behavior using electrophoretic deposition. In general, the SSR is simpler from a chemical point of view and does not require comprehensive and in-depth knowledge about complex synthetic chemical methods according to the stable solid-state educts with their easy manageability [26]. In contrast and due to the usage of moisture-sensitive metal–organic educts and inflammable organic solvents, the SGP requires a more sophisticated and educated chemical experience. It is expected that scaling up from a few grams up to several 100 g per batch should be easier in case of SSR than in SGP. Consequently, the SSR should be less expensive than the SGP. In addition, and according to the literature listed in Section 3.1, the synthetic yield is much higher in SSR than in SGP. Therefore, within the frame of this work, it should be proved that, irrespective of the selected synthetic route, BST with different Ba-to-Sr ratios can be obtained with identical physical properties. This would simplify the effort for BST synthesis for different potential applications in the future as described for barium titanate by Buscaglia et al. [19].
2. Materials and Methods
2.1. BST Synthesis
2.1.1. Solid-State Reaction (SSR)
The established solid-state reaction follows the simple reaction at elevated temperatures of barium carbonate and strontium carbonate in the desired stoichiometric ratio with titanium(IV) oxide (1) [31]. The use of the carbonates instead of the oxides is favorable due to two different reasons: first, the related oxides BaO and SrO are hygroscopic substances forming the hydroxides, and second, the release of CO2 leads to an entropy increase, shifting the equilibrium to the product side according to the Gibbs–Helmholtz Equation (2) (G: Gibbs free energy, H: enthalpy, T: temperature, S: entropy).
Table 1 lists all used chemicals for the BST solid-state synthesis. Barium carbonate, strontium carbonate and titanium(IV) oxide were dried in an oven overnight at 120 °C to remove adsorbed surface water. After drying, the ceramics were mixed, suspended in a small amount of acetone and pestled in a mortar for 10 min to obtain a homogeneous mixture. With respect to the aspired different stoichiometries, the amount x of strontium carbonate was varied from 0.0 to 0.25 in 0.05 steps. Afterwards, all mixtures were placed in an oven for 30 min at 120 °C to remove the organic solvent followed by a calcination step at 1000 °C for two hours with a heating and cooling rate of 10 K/min. After the solid-state reaction, the solid mixture was dispersed in a 2 wt% solution of PMMA in acetone (ratio mass powder in g to volume PMMA/acetone solution in ml of 1:1), grinded in a mortar for 10 min and subsequently dried for 30 min at 120 °C. The PMMA acts as a binder for pellet pressing (1 g ceramic, pressure 0.3 GPa, diameter 10 mm, 25 °C) applying a Weber press PW 20, (P.O. Weber GmbH, Remshalden, Germany). The following temperature program was used for final pellet sintering:

Table 1.
Chemicals used for solid state synthesis of BST.
- 25 °C to 500 °C, 3 K/min heating rate
- 500 °C to 1300 °C, 10 K/min heating rate
- 1300 °C, 2 h holding time
- 1300 °C to 25 °C, 10 K/min cooling rate.
The first slow heating rate up to 500 °C is attributed to the desired complete removal of the PMMA binder.
2.1.2. Sol–Gel Process (SGP)
In general, the more complex sol–gel process delivers products with high chemical purity suitable for applications in microelectronics like capacitors or ferroelectric devices. The use of metal–organic precursors, dissolved in organic solvents, followed by chemical reaction and gelation enables the precipitation of highly pure, fine, and mostly spherical particles. The BST synthesis in acetic acid follows Equation (3), using the chemicals listed in Table 2. Due to the enhanced synthetic effort in contrast to the SSR reaction, a reduced number of different stoichiometries were prepared, the amount x of strontium acetate was varied with x = 0.05, 0.15, and 0.25. The synthesis follows the description given by Gatea et al. in [28]. Barium acetate, dissolved in acetic acid, was stirred in a flask equipped with a reflux condenser for 1 h at 70 °C, then the strontium acetate, also dissolved in acetic acid, was added dropwise and the temperature was raised to 110 °C.

Table 2.
Chemicals used for sol–gel synthesis of BST.
2-methoxyethanol and titanium isopropoxide were mixed at room temperature; then the solution of barium and strontium acetate in acetic acid was added dropwise. The pH of the mixture was adjusted to 4.5 with previously prepared ammonium acetate dissolved in acetic acid. Then, the temperature of the reaction mixture was increased to 100 °C. The initial brown color turned slowly to a whitish appearance. Finally, the reaction mixture was heated under reflux until a viscous gel was obtained. After the addition of distilled water, the mixture was stirred for one hour at 60 °C until the desired gel consistency was observed. The gel was dried at 200 °C for two hours and subsequently calcined at 700 °C for 2 h with a heating and cooling rate of 10 °K/min. The obtained powder was pressed to pellets as described earlier and sintered with a simplified temperature program with omission of the debinding step. Due to the expected finer particle size accompanied with larger specific surface area and hence enhanced sinter activity, a lower sinter temperature was selected according to the following [29]:
- 25 °C to 1000 °C, 5 K/min heating rate
- 1000 °C, 3 h holding time
- 1000 °C to 25 °C, 8 K /min cooling rate.
The final denomination of all synthesized BSTs can be found in Table 3.

Table 3.
Denomination for all synthesized BSTs (SSR and SGP).
2.2. Characterization
2.2.1. Thermal Analysis (TGA)
Thermogravimetric analysis (TGA) using a STA-409C (E. Netzsch B.V. & Co Holding KG, Selb, Germany), was applied to determine the mass loss during calcination and sintering.
2.2.2. Particle Characterization
Scanning Electron Microscopy (SEM) was used to determine the morphology of the ceramic powders. For preparing the samples, the powders were pestled for 10 min and dispersed in isopropanol in an ultrasonic bath (Sonorex Super RK103H, Bandelin electronic GmbH & Co KG, Berlin, Germany) for 15 min. After that, the suspensions were kept in the fume cupboard for 2 days followed by overnight storage at 60 °C in a laboratory oven. The powders prepared for SEM analysis were stuck on carbon tabs. A Tescan MAIA 3 (TESCAN GmbH, Dortmund, Germany) was used for SEM imaging. The acceleration voltage was set to 5 kV. The particle size distribution (PSD) was measured by dynamic light scattering applying a Beckmann Coulter LS-230 (Beckman Coulter Inc., Brea, CA, USA) analyzer. Approximately 0.1 g of the synthesized powders, which were pestled for 10 min after sintering, was suspended in 5 g isopropanol and stored in an ultrasonic bath (Sonorex Super RK103H, Bandelin electronic GmbH, Berlin, Germany) for 15 min. The specific surface area (SSA) was measured according to the Brunauer–Emmett–Teller adsorption (BET) method (Gemini VII 2390, Micromeritics Instr. Corp., Norcross, GA, USA).
2.2.3. X-Ray Diffraction (XRD)
All synthesized samples were analyzed after sintering with an X-ray diffractometer (XRD) for crystallographic phase determination. The X-ray diffractograms were measured using a Bruker D8 Discover diffractometer with Bragg–Brentano geometry and Cu-Kα (1.54 Å) radiation. All diffractograms were analyzed with DIFFRACT.EVA V5 (Bruker AXS, Ettlingen, Germany) and Match! (Crystal Impact, Bonn, Germany). Data from ICSD (Inorganic Crystal Structure Database) and ICDD (International Center for Diffraction Data) were used as a reference for phase analysis.
2.2.4. Dielectric Properties
The temperature dependent relative permittivity εr was estimated by capacitance measurements according to the well-known capacitor Equation (4) (C: measured capacity, d: distance between electrodes, respectively, dielectric sample thickness, ε0: vacuum permittivity, A: surface area). A total of 0.4 g of BST powder was pressed (25–30 kN) into 10 mm diameter pellets and sintered (Figure 1a). After sintering, the pellet was bonded between aluminum plates with conductive adhesive (Heraeus PC 3001 Thermosetting Polymer Silver Conductive Adhesive, (Hanau, Germany) (Figure 1b). The sample preparation is very sensitive to the presence of trapped air bubbles between the different interfaces of specimen-adhesive-aluminum electrode. The capacitance was measured at four different frequencies (100 Hz, 1000 Hz, 10,000 Hz, 100,000 Hz) with an LCR-meter (Fluke and Philips, the T8M Alliance, PM6304 Programmable automatic RCL-meter) at different temperatures between ambient conditions and 140 °C to estimate the Curie temperature. The sample temperature was adjusted in an oven.

Figure 1.
Dielectric property measurement of SSR-obtained specimen: (a) selected samples after sintering; (b) with aluminum sheet-contacted specimen.
2.2.5. Electrophoretic Deposition (EPD)
EPD was performed for BST powders synthesized by SSR as well as by SGP with subsequent calcination and sintering. The pestled SSR-pellets were additionally milled in isopropanol in a planetary mill (200 rpm, 8 h, PM 400, Retsch GmbH, Haan, Germany) prior to usage. The solvent was removed under reduced pressure, and the fine fraction of the resulting powder was sintered for 3 h at 1000 °C with a heating rate of 5 K/min and a cooling rate of 8 K/min (RHF 1400, Carbolite Gero GmbH & Co. KG, Neuhausen, Germany) to adjust the particle size. Suspensions were prepared containing approximately 1 vol% of the different BST powders in isopropanol and acetone (volume ratio of 65:35). 3,6,9-trioxadecanoic acid (1 wt% related to BST) was used as suitable dispersant preventing agglomeration and sedimentation (Table 4). Additionally, PMMA (75 wt% related to BST) was added as a binder, which was dissolved in acetone before (20 wt%). The whole mixture was stirred for at least 5 min under ambient conditions and further deagglomerated for another 5 min at 0 °C with an ultrasonic lance (70 % internal power, pulsed modem Digital Sonifier 450, Branson Ultrasonics Corp., Danbury, CT, USA).

Table 4.
Chemicals used for EPD.
The EPD process was conducted in a glass beaker using a self-constructed automated setup consisting of a power source, CNC controller, computer, and EPD dip coater. The different investigated deposition parameters are listed in Table 5. This setup allowed a variation in the applied voltage U and the deposition time t. The simultaneous deposition of the ceramic and PMMA was conducted on graphite (plate C59, Thielmann Graphite, Grolsheim, Germany) (SSR, SGP) as well as on stainless steel electrodes (SSR) with platinum as a counter electrode. The graphite electrodes were polished manually to a shiny surface appearance using sandpapers P320, P800, and P2500, subsequently cleaned in isopropanol and acetone in a supersonic bath (each 10 min) and finally dried overnight at 60 °C in a furnace. The graphite and the steel electrodes were partially protected with sticky tape; the open area was coated (26 × 26 mm2) and after deposition dried under ambient conditions. After that, light microscope images were recorded (Axioplan 2, Carl Zeiss AG, Oberkochen, Germany). The layer thickness of the deposited films for t > 90 s was determined using a white light interferometer (WLI, NewView 9000, Zygo Corp., Middlefield, CT, USA). Observed was a 3.2 × 2.4 mm2 large area at the edge of the deposited ceramic, so that both BST and electrode were recorded. The Gwyddion software (Petr Klapetek, David Nečas, Czech Metrology Institute, Brno, Czech Republic) was used to extract profiles of the BST ceramic as well as of the electrode. Finally, the layer thickness was obtained as the difference between the average height of the BST and the electrode. The values were calculated using Origin (OriginPro, Version 2021, OriginLab Corporation, Northampton, MA, USA). The experimental error was calculated according to (5).

Table 5.
EPD of BST obtained by SSR (BST-SSR-025) and SGP (BST-SGP-025). The operation voltage was 25 V (SSR) on steel and 25 V on graphite (SSR) and 100 V (SGP) on graphite, respectively.
3. Results and Discussion
As previously mentioned, a reduced set of compositions were realized applying the SGP in contrast to the SSR method due to the huge synthetic effort. Nevertheless, the authors are convinced that the following data and the property comparison enable a more general conclusion, that the simpler SSR delivers, with respect to potential applications, at least equivalent BST properties as the more complex SGP.
3.1. Synthesis
According to the procedures described in 2.1, the different BST compositions were synthesized. The reaction yields obtained are in an acceptable range between 51 and 95% (SSR) and between 76 and 84% for SGP. In the literature, it is almost impossible to find any information about the reaction yield. Shastri et al. [22] investigated the SSR for x = 0.5 and x = 0.7 with BaCl2 and SrCl2 as educts, unfortunately without any yield information. Wu et al. [32] performed the SSR using the carbonates as educts with conventional sintering as well as spark plasma sintering; in both cases no yield was listed. Sandi et al. [23] synthesized different BSTs with x = 0, x = 0.1, and x = 0.5 by SSR applying the carbonates; they did not mention the yield as well. Jamaluddin et al. [21] obtained different BSTs with x = 0.01 up to x = 0.05 with the SSR without any yield description, the same is valid for the work described by Maharsi et al. [24], Li et al. [20], Nayak et al. [15], and Deshpande et al. [33]. The SGP was performed according to the procedure described in [28], they investigated BSTs with x = 0.2, 0.3, 0.4, 0.5, and 0.6 without any information about the reaction yield. The same is true for Yin et al. [34], Khirade et al. [35], Shahid et al. [27], and Azim Araghi [29]. A comprehensive description and validation of different BST synthetic routes can be found in [36]; the author described an overall yield after calcination of the SGP between 15 and 30%.
3.1.1. Thermal Analysis
The calcination and sintering steps within the SSR and SGP were controlled by thermogravimetry. As described in Section 2.1.1, for better processing, PMMA (2 wt%) was added as a binder to support pellet pressing. Figure 2a shows the mass change with proceeding temperature treatment for SSR-synthesis. As expected, the decomposition of the added PMMA can be seen in the temperature range between 250 and 350 °C. A second mass loss around 800–900 °C up to 1.5 wt% can be observed, which can be attributed to an incomplete CO2 release during calcination according to the decomposition of the initial carbonates [37]. In the case of the SGP systems with increasing Sr content, an increasing mass loss can be observed, which can be attributed to the decomposition of strontium acetate (Tdec: 380 °C [38]) (Figure 2b). Only for the system with the highest barium acetate content, a small mass loss between 450 and 500 °C can be detected, which fits well to the decomposition temperature (450 °C) of barium acetate [39]. At low (150 °C) temperature, the acetates decompose to oxalates, which react at very high temperatures (800 °C) to carbonates and evolve CO2 [40].
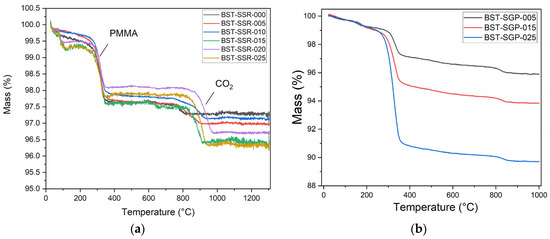
Figure 2.
Temperature-dependent weight loss during calcination and sintering: (a) SSR; (b) SGP.
3.1.2. Particle Characterization
Figure 3a shows the PSD for all SSR-synthesized compositions after calcination and sintering. In general, three main fractions around 0.2 µm, 2 µm, and between 6 and 20 µm can be seen. For better comparison, the average d50 values are collected in Table 6. Figure 3b displays the PSD for the SGP-synthesized systems; the principal distribution appearance is similar. In the case of SSR, Jamaluddin estimated the grain size by SEM photograph analysis; for x = 0.05, they found an average value of 243 nm [21].
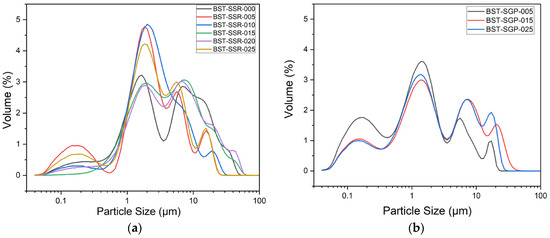
Figure 3.
Particle size distribution of all synthesized compositions: (a) SSR; (b) SGP.

Table 6.
Average particle size (APS) and specific surface area (SSA) of all synthesized BSTs.
In the case of SGP, Gatea et al. investigated the particle size via SEM photograph analysis as well and found, e.g., for x = 0.1 and 0.5 average grain sizes of 197 and 267 nm, respectively, after sintering [28]. In general, the analysis via a SEM image recognition system cannot be compared directly with classical dynamic light scattering, because the latter method also considers agglomerates. The measured SSA for all investigated compositions and different synthetic routes is depicted in Table 6 as well. In the case of the SSR-based ceramics, the SSA values are close together between 0.5 and 1.4 m2/g; a systematic trend with composition is not detectable. In the case of the SGP-derived system, the SSA values are between 2.7 and 5.9 m2/g. The measured SGP-SSA values are higher than the related SSR-SSA values.
With respect to further particle processing, the particle morphology is of particular interest. Figure 4 shows SEM powder images of the different BST SSR products after calcination and sintering at two different magnifications. As expected after a solid-state reaction, the particles show an irregular shape with the presence of large hard agglomerates and aggregates as well as small particles attached to the surface of the larger particles.
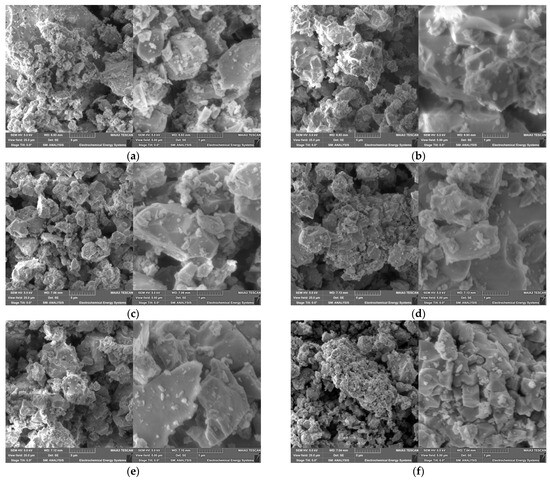
Figure 4.
SEM images at different magnifications of all SSR synthesized powders after calcination (1000 °C, 2 h) and sintering (1300 °C, 2 h): (a) x = 0; (b) x = 0.05; (c) x = 0.1.; (d) x = 0.15; (e) x = 0.2; (f) x = 0.25.
A systematic correlation between the Ba/Sr ratio on the particle’s morphology cannot be detected. For a system with x = 0.3 with a calcination temperature of 900 °C (5 h) and sintering at 1250 °C (6 h), a similar morphology is described by Nayak et al. [15]. The omission of the calcination step provides a finer morphology for different Sr-amounts [21,23,24]. A completely different morphology can be seen in the powder SEM images for the SGP-derived BSTs in Figure 5. In all three investigated compositions, a huge amount of small spherical particles attached to ones with a more irregular shape can be seen. Especially in the system with the highest strontium content, a pronounced presence of very fine particles can be observed, which coincides with the high number of small particles in the particle size distribution in Figure 3b and the larger SSA values. A similar morphology was described by Gatea and Naji under the same calcination and sintering conditions [28].
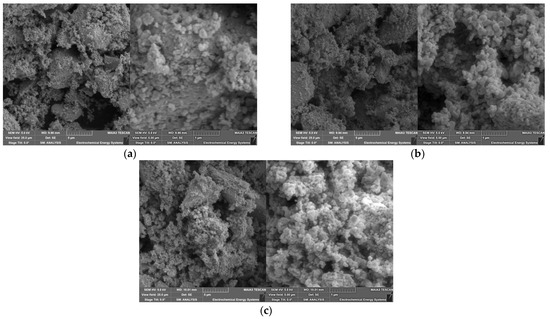
Figure 5.
SEM images at different magnifications of all powders synthesized via SGP after calcination (700 °C, 2 h) and sintering (1000 °C, 3 h): (a) x = 0.05; (b) x = 0.15; (c) x = 0.25.
3.2. Phase Analysis by XRD
With respect to the application, it is mandatory that the proper crystal lattice, here the perovskite phase, is formed after all processing steps with respect to both synthetic routes, calcination, and sintering. Figure 6a,b show an example of the XRD pattern for BaTiO3 (x = 0) and Ba0.95Sr0.05TiO3 (x = 0.05). In addition to the experimental reflexes, the reference values from [41] for BaTiO3 (ICSD 9083) and for Ba0.95Sr0.05TiO3 (ICSD 19777) are included in Figure 6a,b. As can be seen in the diffractograms, the number and position of reflexes match the reference data quite well; no additional reflexes can be seen, which is a strong hint that the desired products are pure and no residual reactants or other phases are present. All the samples show a tetragonal symmetry with space group P4mm. While BaTiO3 exhibits a tetragonal symmetry at room temperature, pure SrTiO3 (ICSD 23076) has an ideal cubic perovskite structure with the space group P. For all investigated Ba/Sr ratios the tetragonal symmetry was preserved, which can be seen by the direct comparison of all X-ray diffractograms of the SSR synthesized BST in Figure 6c. With an increasing strontium content, a slight shift in the reflexes to higher 2θ values is observed. To show this effect clearly, Figure 6d gives a more detailed view on the most intensive reflex in the 2θ range of 30–33°. There is a difference of about a half-degree between BaTiO3 and Ba0.75Sr0.25TiO3, which can be attributed to the size differences between Sr2+ ions (r = 0.113 nm) and Ba2+ ions (r = 0.135 nm) [27]. If barium is replaced by strontium, the lattice parameters become smaller and therefore the reflexes in the diffractogram are shifted to larger angles.
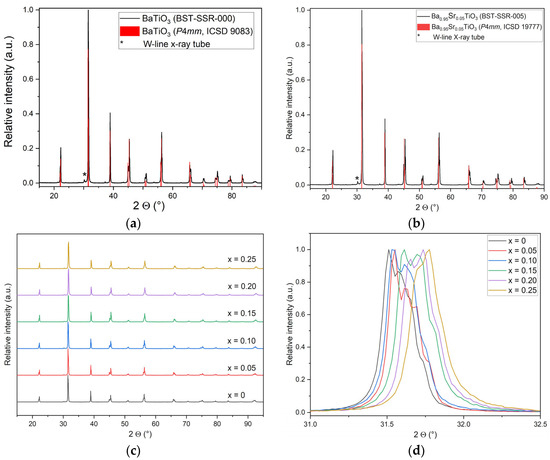
Figure 6.
XRD investigation of SSR samples: (a) XRD pattern for x = 0; (b) XRD pattern for x = 0.05; (c) complete pattern set of all investigated compositions; (d) peak shift with strontium content for the most intensive reflexes ((101) and (110)).
Figure 7 shows the related data for the SGP-based Ba1−xSrxTiO3 products. As an example, Figure 7a shows the XRD pattern for x = 0.05, and Figure 7b the direct comparison of all X-ray diffractograms of all SGP-synthesized BSTs. The desired products are obtained phase-pure; no remaining reactants or other phases are observed. All samples show a tetragonal symmetry at room temperature with space group P4mm. Again, with increasing strontium content, a slight shift in the reflexes to higher 2θ values can be detected (Figure 7c). From the results presented in Figure 6 and Figure 7, it can be derived that the purity of the different BSTs is identical irrespective of the applied synthetic route.

Figure 7.
XRD investigation of all SGP samples: (a) XRD pattern for x = 0.05 as an example; (b) complete pattern set of all investigated compositions; (c) peak shift with strontium content for the most intensive reflexes ((101) and (110)).
3.3. Dielectric Characterization
With respect to the application, e.g., as a capacitor, knowledge about the dependence of the relative permittivity with composition and temperature is important. Figure 8 presents the permittivity measurements for all SSR-derived BSTs. For better comparison, the range of the y-axis is identical. Various correlations and trends can be observed. As expected, with increasing measuring frequency, the relative permittivity values decrease. Increasing Sr content causes a relative permittivity drop as well. It is known from the literature that εr has its maximum value at the Curie temperature [1]. Table 7 summarizes the estimated range of the Curie temperature as a function of the strontium content for all SSR-derived BSTs, together with data taken from the literature.
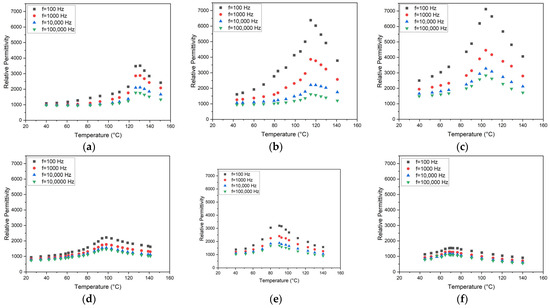
Figure 8.
Temperature and frequency-dependent relative permittivity for all SSR-derived compositions: (a) x = 0; (b) x = 0.05; (c) x = 0.1.; (d) x = 0.15; (e) x = 0.2; (f) x = 0.25.
As a general trend, the increasing presence of strontium causes a drop of the Curie temperature. The quality of the measured values suffered in some cases from the non-optimized sample preparation as described in Section 2.2.4. Especially, the attachment of the aluminum plates as electrodes with an adhesive tape was not as reliable as expected and therefore the source of errors, like signal scattering. Therefore, the absolute εr values may not be taken too seriously, but within one measurement series, the general trend of the change in the εr-values with temperature and hence the estimation of the Curie temperature is reliable. Sandi et al. [23] found εr data of 156 and 196 at 1 kHz for x = 0 and x = 1. These small values can be attributed to the nanosized particles with average values around 38 nm. Jamaluddin et al. measured a relative dielectric constant of 456 at 1 kHz and a grain size of 243 nm for x = 0.05 [21]. Maharsi et al. stated a relative dielectric constant of 465 at 1 kHz and an average particle size of 62 nm for x = 0.1 [24]. The influence of the sinter temperature on the dielectric properties was investigated for x = 0.25 by Li et al. [20]. They found relative permittivity values up to 18,000 at 1 MHz for particles in the lower µm range and sinter temperatures between 1250 and 1350 °C. They estimated the Curie temperature to be around 50–60 °C. For pure barium titanate, a dependence of the dielectric constant with particle or grain size is described in the literature [42]. Kinoshita and Yamaji showed that the reduction in the particle size is accompanied by a relative permittivity increase until a minimum size of 1 µm is reached [43]. Buscaglia and coworkers found an opposite behavior for grain sizes below 1.2 µm [44], which means that starting from nanoparticle sizes towards microparticle sizes, an increase in the relative permittivity can be measured. Consequently, around a 1 µm particle size, an εr maximum should be located. Figure 9 shows the change in the permittivity values at different frequencies and temperatures for the prepared SGP BST systems. For better comparison, the range of the y-axis is identical. Except for the signal at 100 Hz in the case of BST with x = 0.15, the general trend is as expected for all compositions, temperatures, and frequencies. Gatea and Naji found a Curie temperature of 73 °C (@ 1 kHz) for x = 0.2, which fits the results presented here quite well [28]. Ianculescu et al. measured Curie temperatures around 130 °C, 108 °C, 77 °C, and 39 °C for x = 0, 0.1, 0.2, and 0.3, respectively [45], which is consistent with the data shown here.


Table 7.
Estimated Curie temperatures for all BSTs derived from εr measurements.
Table 7.
Estimated Curie temperatures for all BSTs derived from εr measurements.
| Composition | Measured SSR Curie Temperature (°C) | SSR Curie Temperature (°C), Taken from the Literature | Measured SGP Curie Temperature (°C) | SGP Curie Temperature (°C), Taken from the Literature |
|---|---|---|---|---|
| BaTiO3 | 125–135 | 127 [46] | n.a. | 130 [45] |
| Ba0.95Sr0.05TiO3 | 115–125 | n.a. | 115–125 | n.a. |
| Ba0.90Sr0.1TiO3 | 100–110 | 112 [31] | n.a. | 108 [45] |
| Ba0.85Sr0.15TiO3 | 95–105 | 94 [31] | 95–105 | n.a. |
| Ba0.80Sr0.2TiO3 | 85–95 | 70 [46], 86 [31] | n.a. | 73 [28], 77 [45] |
| Ba0.75Sr0.25TiO3 | 65–75 | 78 [31] (Ba0.78Sr0.22TiO3) | 60–70 | n.a. |

Figure 9.
Temperature and frequency-dependent relative permittivity for all SGP-derived compositions: (a) x = 0.05; (b) x = 0.15; (c) x = 0.25.
3.4. Electrophoretic Deposition
Electrophoretic deposition has the major advantage compared to other ceramic shaping methods, like tape casting or ceramic injection molding, so that the shaping process is mostly independent from the slurry viscosity. Even the deposition of nano-sized particles like barium titanate allows for the generation of freestanding thin films after sintering with a small surface roughness [47]. BST-SSR-025 and BST-SGP-025 were selected for EPD. The dispersions freshly prepared according to the instructions described in Section 2.2.5 showed a further reduced d50 value of 1.27 µm (SSR) and 0.83 µm (SGP). According to the empirical Hamaker equation, increasing deposition time at constant applied voltage yields an increased amount of deposited ceramic particles (6) (m: deposited mass, a: constant, A: electrode surface, c: solid concentration, µ: electrophoretic mobility, E: electric field strength, t: deposition time) [48,49,50]. The Hamaker equation and its derivations described later do not consider changes in the particle concentration and some shielding effects due to the increasing deposited layer thickness causing some electrical resistivity changes at the surface [49,50]. Therefore, consequently, the Hamaker equation is only valid if a freshly prepared dispersion is used, otherwise particle precipitation or particle concentration depletion in case of multiple dispersion use may tamper the obtained deposited mass or, related to the covered area, the resulting film thickness.
Figure 10 shows the six SSR-based deposited films on steel substrates with increasing deposition time as listed in Table 5 (SSR-Steel 1–SSR-Steel 6, Figure 10a–f) after drying under ambient conditions. It must be noted, and as described above, that the films represent a co-deposition of BST and PMMA binder. At smaller deposition times as in Figure 10a–d, the dark background of the electrode can be adumbrated. In all cases, smooth surfaces without any visible defects could be obtained. In addition, a deposition on graphite electrodes was performed (SSR-Graphite 1–6, Figure 11). Graphite was selected because after deposition, careful combustion of the graphite enables the formation of free standing thin ceramic films [47]. As in the EPD on the steel substrate, for short deposition times below 120 s, the dark graphite substrate with a non-homogeneous surface coverage can be seen. In the case of very long deposition times over 150 s, a delamination at the substrate corners can be detected. Hence, a suitable deposition time should be around 120 s.

Figure 10.
Photographic images of deposited samples of BST-SSR-025 on steel substrates with different deposition time: (a) 30 s; (b) 60 s; (c) 90 s; (d) 120 s; (e) 150 s; (f) 180 s after drying.

Figure 11.
Photographic images of deposited samples of BST-SSR-025 on graphite substrates with different deposition time: (a) 30 s; (b) 60 s; (c) 90 s; (d) 120 s; (e) 150 s; (f) 180 s after drying under ambient conditions.
The validity of the empirical Hamaker equation can be seen in Figure 12. In Figure 12a, an increasing deposition time yields an almost linear increase in the deposited BST mass on the steel substrate. The Pearson coefficient possesses an acceptable value of 0.97 showing a reliable linear correlation between deposition time and deposited mass according to Equation (5). In Figure 12b, the corresponding behavior using the graphite substrate is depicted. As expected, an increasing deposition time delivers an increasing deposited mass, but with a pronounced scattering around the linear fit. With a value of 0.93, the Pearson coefficient is slightly reduced, but still acceptable. The deviation of the deposited mass with increasing deposition time from the linear fit can be explained by the reuse of the dispersion for all EPD experiments showing a proceeding concentration depletion.
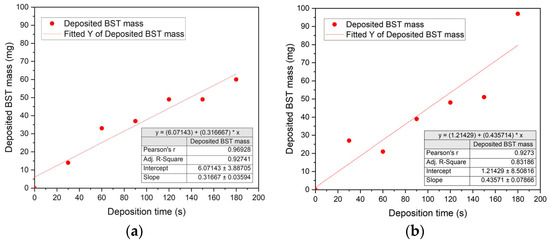
Figure 12.
Change in the deposited BST-SSR-025 mass with increasing deposition time: (a) on steel; (b) on graphite.
In case of the three SGP samples on graphite substrates SGP-Graphite 1–3 (Table 5), 121 mg, 144 mg, and 132 mg were deposited, respectively, which is, due to the four times larger deposition voltage and longer deposition time, significantly higher than in the SSR EPD experiments. Due to the very long deposition time (especially for SGP-Graphite 3), the ceramic powder started to sediment in the dispersion, causing a concentration depletion leading to a reduced ceramic filler deposition. Nevertheless, in all cases very smooth surfaces without any visible defects could be obtained after drying for 2 min at 200 °C and keeping them under ambient conditions for 3 days (Figure 13a–f).

Figure 13.
Deposited SGP samples of Ba0.75Sr0.25TiO3 with different deposition times: (a) 180 s; (b) 240 s; (c) 300 s; (d–f) microscopic images of the surfaces of depositions (a–c).
The surface quality and film thickness of the deposited BST layers can be seen in Figure 14 exemplary for the EPD on graphite. Figure 14a,b show a surface scan and the related profiles (layer and electrode) for the SSR-obtained dispersion. Figure 14c,d present the related images for the SGP-based dispersion. Both systems were deposited for 180 s but with different applied voltages. In all cases, smooth surfaces can be observed. The elevated structure at the transition from the layer to the naked electrode substrate is due to the removed sticky tape, which covered the electrode preventing any deposition. Table 8 summarizes for all deposited layers with homogeneous surface the obtained layer thicknesses. The denomination is based on the EPD parameters listed in Table 5 in Section 2.2.5.
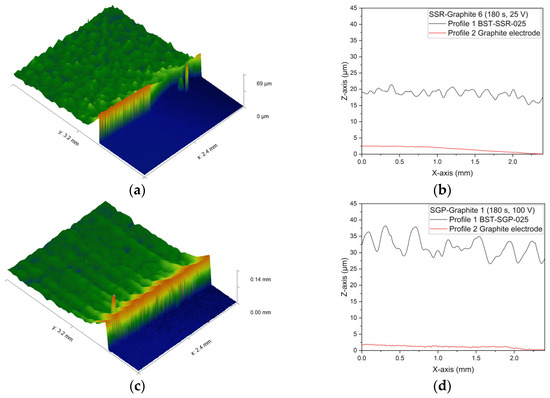
Figure 14.
Surface characterization of deposited BST via WLI: (a) surface topography of SSR-Graphite 6 (25 V, 180 s); (b) surface profiles of SSR-Graphite 6; (c) surface topography of SGP Graphite 1 (100 V, 180 s); (d) surface profiles of SGP Graphite 1.

Table 8.
Measured layer thickness of all EPD samples possessing a homogenous layer thickness.
4. Conclusions
In this work, different BST compositions synthesized via solid-state reaction and sol–gel process were characterized comprehensively via SEM, X-ray diffraction as well as temperature and frequency-dependent relative permittivity measurements targeting a Curie temperature range estimation. In good agreement with the data from the literature, both synthetic methods deliver phase pure BST compositions and confirmed Curie temperature values. Finally, fine particles, obtained from both synthetic routes, were deposited via electrophoretic deposition on graphite and steel substrates for thin film formation, e.g., for suitable applications as ferroelectric devices. In general, it was found that almost identical properties were measured irrespective of the applied synthetic method. The solid-state route requires less effort, especially avoiding elaborate wet-chemistry methods and opens the favorable possibility to use a simple method for preparing ferroelectric ceramics of the perovskite type.
Author Contributions
Conceptualization, T.H. and M.W.; methodology, T.H., M.A., K.H. and I.K.; validation, T.H., K.H. and I.K.; formal analysis, T.H.; investigation, M.A., E.C., J.S. and K.H.; resources, T.H.; data curation, T.H.; writing—original draft preparation, T.H.; writing—review and editing, T.H.; visualization, T.H., I.K. and K.H.; supervision, T.H.; project administration, T.H. and K.H.; funding acquisition, T.H. and M.W. All authors have read and agreed to the published version of the manuscript.
Funding
This research was funded by Deutsche Forschungsgemeinschaft (DFG, German Research Foundation) under the grant numbers HA 1924/27-1 and WA 4555/2-1. The APC was funded by the Open Access Publication Fund of the University of Freiburg.
Data Availability Statement
The original data presented in the study are openly available in KITOpen Repository at https://doi.org/10.35097/k6rpcqwqqmu7hf02.
Acknowledgments
We kindly acknowledge support from M. Raab at IAM-ESS at the Karlsruhe Institute for Technology for the BET measurements, E. Cruz Ortiz at IMTEK-EES for the SEM recordings, C. Mueller from IMTEK for technical support during the relative permittivity measurements, and M. Daub and T. Ludwig, Institute for Inorganic and Analytical Chemistry at the University of Freiburg.
Conflicts of Interest
The authors declare no conflicts of interest.
References
- Moulson, A.J.; Herbert, J.M. Electroceramics, 2nd ed.; John Wiley & Sons Ltd.: Chichester, UK, 2003. [Google Scholar]
- Pandiyan, A.; Veeramuthu, L.; Yan, Z.L.; Lin, Y.C.; Tsai, C.H.; Chang, S.T.; Chiang, W.H.; Xu, S.; Zhou, T.; Kuo, C.C. A comprehensive review on perovskite and its functional composites in smart textiles: Progress, challenges, opportunities, and future directions. Prog. Mater. Sci. 2023, 140, 101206. [Google Scholar] [CrossRef]
- Pradeesh, E.L.; Udhayakumar, S.; Vasundhara, M.G.; Kalavathi, G.K. A review on piezoelectric energy harvesting. Microsyst. Technol. 2022, 28, 1797–1830. [Google Scholar] [CrossRef]
- Zou, K.; Dan, Y.; Xu, H.; Zhang, Q.; Lu, Y.; Huang, H.; He, Y. Recent advances in lead-free dielectric materials for energy storage. Mat. Res. Bull. 2019, 113, 190–201. [Google Scholar] [CrossRef]
- Acosta, M.; Novak, N.; Rojas, V.; Patel, S.; Vaish, R.; Koruza, J.; Rossetti, G.A.; Rödel, J. BaTiO3-based piezoelectrics: Fundamentals, current status, and perspectives. Appl. Phys. Rev. 2017, 4, 041305. [Google Scholar] [CrossRef]
- Rödel, J.; Webber, K.G.; Dittmer, R.; Jo, W.; Kimura, M.; Damjanovic, D. Transferring lead-free piezoelectric ceramics into application. J. Eur. Ceram. Soc. 2015, 35, 1659–1681. [Google Scholar] [CrossRef]
- Li, J.F.; Wang, K.; Zhu, F.Y.; Cheng, L.Q.; Yao, F.Z.; Green, D.J. (K,Na)NbO3-Based Lead-Free Piezoceramics: Fundamental Aspects, Processing Technologies, and Remaining Challenges. J. Am. Ceram. Soc. 2013, 96, 3677–3696. [Google Scholar] [CrossRef]
- Coondoo, I.; Panwar, N.; Kholkin, A. Lead-free piezoelectrics: Current status and perspectives. J. Adv. Dielectr. 2013, 3, 1330002. [Google Scholar] [CrossRef]
- Ruf, T.; Mauck, M.; Megnin, C.; Winkler, M.; Hillebrecht, H.; Hanemann, T. The influence on sintering and properties of sodium niobate (NaNbO3) ceramics by “non-stoichiometric” precursor compositions. Mater. Chem. Phys. 2019, 229, 437–447. [Google Scholar] [CrossRef]
- Buscaglia, V.; Randall, C.A. Size and scaling effects in barium titanate. An overview. J. Eur. Ceram. Soc. 2020, 11, 3744–3758. [Google Scholar] [CrossRef]
- Wang, B.; Liu, W.; Zhao, T.; Peng, W.; Ci, P.; Dong, S. Promising Lead-Free BiFeO3-BaTiO3 Ferroelectric Ceramics: Optimization Strategies and Diverse Device Applications. Prog. Mater Sci. 2024, 146, 101333. [Google Scholar] [CrossRef]
- Varade, P.; Pandey, A.H.; Selvamani, R.; Venkataramani, N.; Kulkarni, A.R. Tuning structural, dielectric, and ferroelectric properties of BTO-based ceramics through dual-site substitution. Mater. Chem. Phys. 2024, 319, 129381. [Google Scholar] [CrossRef]
- Coondoo, I.; Pullar, R.C.; Miranda, G. Multifunctional lead-free piezoelectric (Ba,Ca)(Zr,Ti)O3 compounds: From energy harvesting to electrocaloric cooling and energy storage applications. Mater. Res. Bull. 2024, 179, 112924. [Google Scholar] [CrossRef]
- Li, Z.; Yu, J.; Hao, S.; Janolin, P.E. Enhancing properties of lead-free ferroelectric BaTiO3 through doping. J. Eur. Ceram. Soc. 2002, 42, 4396–4701. [Google Scholar] [CrossRef]
- Nayak, R.; Miglani, Y.; Bhardwaj, S. Synthesis and characterization of ferroelectric Barium strontium titanate Ceramics. Mater. Today Proc. 2023, 78, 839–841. [Google Scholar] [CrossRef]
- Costa, L.C.; Aoujgal, A.; Graça, M.P.F.; Hadik, N.; Achour, M.E.; Tachafine, A.; Carru, J.C.; Oueriagli, A.; Outzourit, A. Microwave dielectric properties of the system Ba1−xSrxTiO3. Phys. B Condens. Matter 2010, 405, 3741–3744. [Google Scholar] [CrossRef]
- Jeon, J.H. Effect of SrTiO3 concentration and sintering temperature on microstructure and dielectric constant of Ba1−xSrxTiO3. J. Eur. Ceram. Soc. 2004, 24, 1045–1048. [Google Scholar] [CrossRef]
- Dobal, P.S.; Dixit, A.; Katiyar, R.S.; Garcia, D.; Guo, R.; Bhalla, A.S. Phase Transitions in Ba1− xSrxTiO3 Ceramics. Ferroelectr. Lett. Sect. 2002, 29, 1–10. [Google Scholar] [CrossRef]
- Buscaglia, M.T.; Bassoli, M.; Buscaglia, V.; Vormberg, R. Solid-State Synthesis of Nanocrystalline BaTiO3: Reaction Kinetics and Powder Properties. J. Am. Ceram. Soc. 2008, 91, 2862–2869. [Google Scholar] [CrossRef]
- Li, J.; Jin, D.; Zhou, L.; Cheng, J. Dielectric properties of Barium Strontium Titanate (BST) ceramics synthesized by using mixed-phase powders calcined at varied temperatures. Mater. Lett. 2012, 76, 100–102. [Google Scholar] [CrossRef]
- Jamaluddin, A.; Suwarni, A.; Supriyanto, A.; Iriani, Y. Properties of strontium doped barium titanate powder prepared by solid state reaction. J. Phys. Conf. Ser. 2016, 776, 012052. [Google Scholar] [CrossRef]
- Shastri, N.M.; Joshi, K.J.; Mangrola, M.H.; Joshi, V.G. Characterization of barium strontium titanate BaxSr1−xTiO3 (with x = 0.5 and x = 0.7) synthesized by a solid-state reaction method. AIP Conf. Proc. 2020, 2220, 020094. [Google Scholar] [CrossRef]
- Sandi, D.K.; Supriyanto, A.; Jamaluddin, A.; Iriani, Y. The influences of mole composition of strontium (x) on properties of barium strontium titanate (Ba1−xSrxTiO3) prepared by solid state reaction method. AIP Conf. Proc. 2016, 1710, 030006. [Google Scholar] [CrossRef]
- Maharsi, R.; Jamaluddin, A.; Supriyanto, A.; Iriani, Y. Crystalline Characterization and Dielectric Constant of Barium Strontium Titanates Prepared by Solid State Reaction. Adv. Mater Res. 2015, 1123, 123–126. [Google Scholar] [CrossRef]
- Wright, J.D.; Sommerijk, N.A.J.M. Sol-Gel Materials: Chemistry and Applications, 1st ed.; Taylor & Francis Group: London, UK, 2000. [Google Scholar] [CrossRef]
- Chilibon, I.; Marat-Mendes, J.N. Ferroelectric ceramics by sol–gel methods and applications: A review. J. Sol-Gel Sci. Technol. 2012, 64, 571–611. [Google Scholar] [CrossRef]
- Shahid, M.Y.; Anwar, A.; Malik, F.; Asghar, M.; Warsi, M.F.; Ilyas, S.Z. Effect of Sr-Doping on Ferroelectric and Dielectric Properties of Sol-gel Synthesized BaTiO3 Thin Films. Dig. J. Nanomater. Biostruct. 2017, 12, 669–677. [Google Scholar]
- Gatea, H.A.; Naji, I.S. The effect of Ba/Sr ratio on the Curie temperature for ferroelectric barium strontium titanate ceramics. J. Adv. Dielectr. 2020, 10, 2050021. [Google Scholar] [CrossRef]
- Azim Araghi, M.E.; Shaban, N.; Bahar, M. Synthesis and characterization of nanocrystalline barium strontium titanate powder by a modified sol-gel processing. Mater. Sci.-Pol. 2016, 34, 63–68. [Google Scholar] [CrossRef]
- Bokov, D.; Turki Jalil, A.; Chupradit, S.; Suksatan, W.; Javed Ansari, M.; Shewael, I.H.; Valiev, G.H.; Kianfar, E.; Wang, Z. Nanomaterial by Sol-Gel Method: Synthesis and Application. Adv. Mater. Sci. Eng. 2021, 1, 5102014. [Google Scholar] [CrossRef]
- Kathait, G.S.; Rohilla, V.; Thapliyal, P.; Biswas, D.; Singh, S. Effect of different strontium content on dielectric properties of barium strontium titanate ceramic. Int. J. Latest Technol. Eng. Manag. Appl. Sci. 2017, 6, 75–79. [Google Scholar]
- Wu, Y.J.; Huang, Y.H.; Wang, N.; Li, J.; Fu, M.S.; Chen, X.M. Effects of phase constitution and microstructure on energy storage properties of barium strontium titanate ceramics. J. Eur. Ceram. Soc. 2017, 37, 2099–2104. [Google Scholar] [CrossRef]
- Deshpande, S.B.; Khollam, Y.B.; Potdar, H.S. Microwave-Hydrothermal (MH) Synthesis of Ba1−xSrxTiO3 (BST). Ferroelectrics 2005, 327, 39–43. [Google Scholar] [CrossRef]
- Yin, L.; Jiang, F.; Feng, G.; Wu, C.; Tan, J.; Wu, Q.; Zhang, Q.; Hu, Q.; Liu, J.; Jiang, W. Effects of raw materials on nonhydrolytic sol-gel synthesis of Ba0.6Sr0.4TiO3. Ceram. Intern. 2022, 48, 25681–25688. [Google Scholar] [CrossRef]
- Khirade, P.P.; Vinayak, V.; Kharat, P.B.; Chavan, A.R. Green Synthesis of Ba1−xSrxTiO3 ceramic nanopowders by sol-gel combustion method using lemon juice as a fuel: Tailoring of Microstructure, ferroelectric, dielectric and electrical properties. Opt. Mater. 2021, 111, 110664. [Google Scholar] [CrossRef]
- Paul, F. Dotierte Ba0,6Sr0,4TiO3-Dickschichten als Steuerbare Dielektrika: Pulversynthese und Dielektrische Eigenschaften. Ph.D. Thesis, University of Freiburg, Freiburg, Germany, 6 July 2006. (In German). [Google Scholar]
- Uddin, S.; Hameed, S.; Ali, N.; Althubeiti, K.; Zaman, A.; Alrobei, H.; Mushtaq, M.; Ali, A.; Sultana, F. Effect of Sr2+doping on the phase transition of BaTiO3 lead-free ferroelectric ceramics. Mater. Res. Exp. 2021, 8, 096101. [Google Scholar] [CrossRef]
- Das Periodensystem der Elemente Online. Strontiumacetat, Sr(CH3COO)2. Available online: https://www.periodensystem-online.de/index.php?el=38&id=compound&cpid=1473 (accessed on 13 July 2025).
- Das Periodensystem der Elemente Online. Bariumacetat, Ba(CH3COO)2. Available online: https://www.periodensystem-online.de/index.php?el=56&id=compound&cpid=1182 (accessed on 13 July 2025).
- Hwang, U.Y.; Park, H.S.; Koo, K.K. Behavior of Barium Acetate and Titanium Isopropoxide during the Formation of Crystalline Barium Titanate. Ind. Eng. Chem. Res. 2004, 43, 728–734. [Google Scholar] [CrossRef]
- ICSD Web. Available online: https://icsd.fiz-karlsruhe.de/display/list.xhtml (accessed on 20 March 2025).
- Schumacher, B.; Geßwein, H.; Haußelt, J.; Hanemann, T. Temperature treatment of nano-scaled barium titanate filler to improve the dielectric properties of high-k polymer-based composites. Microelectr. Eng. 2010, 87, 1978–1983. [Google Scholar] [CrossRef]
- Kinoshita, K.; Yamaji, A. Grain-size effects on dielectric properties in barium titanate ceramics. J. Appl. Phys. 1976, 47, 371–373. [Google Scholar] [CrossRef]
- Buscaglia, V.; Buscaglia, M.T.; Viviani, M.; Mitoseriu, L.; Nanni, P.; Trefiletti, V.; Piaggio, P.; Gregora, I.; Ostapchuk, T.; Pokorny, J.; et al. Grain size and grain boundary-related effects on the properties of nanocrystalline barium titanate ceramics. J. Eur. Ceram. Soc. 2006, 26, 2889–2898. [Google Scholar] [CrossRef]
- Ianculescu, A.; Pintilie, I.; Vasilescu, C.A.; Botea, M.; Iuga, A.; Melinescu, A.; Drăgan, N.; Pintilie, L. Intrinsic pyroelectric properties of thick, coarse grained Ba1−xSrxTiO3 ceramics. Ceram. Int. 2016, 42, 10338–10348. [Google Scholar] [CrossRef]
- Maity, S.; Sasmal, A.; Sen, S. Comprehensive characterization of Ba1−xSrxTiO3: Correlation between structural and multifunctional properties. J. Alloys Comp. 2021, 884, 161072. [Google Scholar] [CrossRef]
- Ketterer, I.; Yang, C.K.; Frey, M.; Wapler, M.; Hanemann, T. Lead-free barium titanate piezoceramics prepared by electrophoretic deposition on graphite electrodes. In Proceedings of the MikroSystemTechnik Kongress, Ludwigsburg, Germany, 8–10 November 2021; pp. 388–391. [Google Scholar]
- Hamaker, H.C. Formation of a Deposit by Electrophoresis. Trans. Faraday Soc. 1940, 36, 279–287. [Google Scholar] [CrossRef]
- Besra, L.; Liu, M. A review on fundamentals and applications of electrophoretic deposition (EPD). Prog. Mater. Sci. 2007, 52, 1–61. [Google Scholar] [CrossRef]
- Sarkar, P.; Nicholson, P.S. Electrophoretic Deposition (EPD): Mechanisms, Kinetics, and Application to Ceramics. J. Am. Ceram. Soc. 1996, 79, 1987–2002. [Google Scholar] [CrossRef]
Disclaimer/Publisher’s Note: The statements, opinions and data contained in all publications are solely those of the individual author(s) and contributor(s) and not of MDPI and/or the editor(s). MDPI and/or the editor(s) disclaim responsibility for any injury to people or property resulting from any ideas, methods, instructions or products referred to in the content. |
© 2025 by the authors. Licensee MDPI, Basel, Switzerland. This article is an open access article distributed under the terms and conditions of the Creative Commons Attribution (CC BY) license (https://creativecommons.org/licenses/by/4.0/).