Abstract
The stability of ceramic suspensions is a key factor in the preparation and shaping of ceramic bodies. The presented work offers an experimental determination of ceramics suspensions stability using the LUMiSizer analytical centrifuge, focusing on kinetic behaviour using transmission profiles and instability indexes. Multiple ceramic systems comprising corundum, metakaolin, and zirconia suspensions were experimentally examined under varying solid contents, dispersant dosages, and additive concentrations. Results showed that highly loaded corundum suspensions with dispersant (Dolapix CE64) achieved excellent stability, with an instability index below 0.05. Compared to classical sedimentation tests, which are time-consuming and not highly sensitive, LUMiSizer offers a suitable alternative by guaranteeing correct kinetic data and instability indexes indicating suspension behaviour using centrifugal force. Comparisons of the LUMiSizer results and data obtained using the modified Stokes law confirmed increased terminal velocities in experiments with metakaolin suspensions, indicating the sensitivity of the centrifuge to the effect of dispersion medium shape. The influence of porogen (waste coffee grounds) on the stability of corundum suspensions was also investigated, followed by slip casting to create and characterize a ceramic body, confirming the possibility of shaping based on stability results. Furthermore, instability indices are suggested as a rapid, quantitative method for comparing system stability and as an auxiliary criterion to the rheological measurements. Optimal dispersant concentration for zirconia-based photocurable suspensions was identified as 8.5 wt.%, which minimized viscosity and, at the same time, assured maximal kinetic stability. Integrating the LUMiSizer analytical centrifuge with standard methods, including sedimentation tests and rheological measurements, highlights its value as a powerful tool for characterizing and optimizing ceramic suspensions.
1. Introduction
In the field of ceramic manufacturing methods, such as slip casting [1], injection moulding [2], isostatic pressing [3], or additive manufacturing (AM) [4], the evaluation of the physical properties of suspensions is a crucial factor in the successful shaping of ceramic bodies and achieving the required mechanical properties. The basic quantity evaluated for most applications is dynamic viscosity, which is influenced by multiple factors, such as solid content [5,6,7], particle diameter [8], the type of dispersant used [9], and the measurement conditions, e.g., the measuring temperature or shear rate [10,11]. The obtained dynamic viscosity values are essential for methods such as DLP (Digital Light Processing) additive manufacturing, where a ceramic photocurable suspension is treated with a light of a specific wavelength (usually in the UV or UV/blue range) layerwise on the base printing platform [12]. For this modern style of ceramic shaping, the suspension needs to have the lowest possible dynamic viscosity for successful AM processing [13,14]. For injection moulding technology, the correct viscosity range is also essential for predicting the mouldability of ceramic slurry [15]. However, rheological measurements present several challenges. For suspensions with a rapid sedimentation rate (e.g., suspensions with quartz [16]), it is necessary to consider a certain degree of variability in the measurement due to the rapid sedimentation of particles to the bottom of the cylinder when using a concentric cylinder system. The selection of higher shear rates can partially prevent this phenomenon, but a new inaccuracy arises: Taylor–Couette flows [17], creating unwanted patterns and vortices.
For all of the abovementioned applications, as well as for the rheological measurements themselves, it is crucial to determine the stability of the prepared suspensions. A traditional method of measuring the stability and sedimentation of prepared suspensions in laboratory conditions is the sedimentation test in a graduated cylinder [16,18], where the subsidence of particles to the bottom of the cylinder is monitored over a selected time. As reported by Camargo et al. [19], the disadvantage of these measurements is the non-standardized length of the experiment for different suspension concentrations and non-standardized measurement time intervals. A more accurate laboratory method of measurement involves the Andreasen pipette [20]. The device consists of a graduated glass cylinder and a pipette with a stopcock valve affixed to the cylinder at a fixed depth near the bottom. A homogenized suspension is loaded into the cylinder, then allowed to settle under gravity in a thermostatic bath. At given sampling intervals, a fixed volume is withdrawn via the pipette at a defined depth. Particles larger than the corresponding Stokes diameter have already settled below the pipette tip; smaller particles remain suspended and are sampled [21].
Initially, the prevailing assumption was that in ceramic suspensions, the sedimentation curve, representing the height of the sedimented surface as a function of time, would show a linear character up to the moment of particle compression. This fundamental assumption is called Kynch’s theory, which has a purely kinematic basis [22]. Kynch assumed that the speed of movement of solid particles in suspension depends only on the local concentration, and the influence of the container walls was not considered [23]. The research of Tiller [24] and Fitch [25] extends the validity of the theory for compressible suspensions with their mathematical models. However, more advanced models also consider particle orientation, filler content, or sedimentation height. With these models, the shape of the sedimentation curves is not unambiguous [26,27].
Svedberg [28] was the first to characterize sedimentation processes using a centrifugal field in an analytical centrifuge for direct observation of sedimentation during centrifugation. A more complex approach to describing the stability in the centrifugal field and using light scattering of ceramic suspensions has been developed over the years. Research by Burgos-Montes and Moreno [29] utilizes multiple light scattering with a Turbiscan device. The given technique analyses the effect of the radiation of the light source through the sample, while the reflected and scattered light allows the obtaining of information about agglomeration processes, sedimentation, or aggregation of particles (coalescence and flocculation).
This work provides an insight into the scientific utilization of the LUMiSizer analytical centrifuge, demonstrated on 4 types of powders in ceramic suspensions. The work presents a method for rapidly characterizing the suitability of the dispersion media, optimizing the surfactant concentration, and assessing the effect of additives on the stability of ceramic suspensions. Furthermore, the analyses are supplemented by conventional rheological measurements and classical sedimentation tests in a cylinder, both to validate the presented approach and to demonstrate the complementarity of the analytical centrifuge with traditional techniques.
2. Materials and Methods
2.1. Introduction to Stability Analysis and Instability Indexes
For the creation of representative images, a water-based suspension consisting of 15 vol.% fine silica sand Dorsilit with d50 = 6.0 µm (Chejn spol., s.r.o., Sušice, Czech Republic) was prepared. Silica sand was mixed with water without the use of any stabilizer. The suspension was homogenized for 20 min at 1500 RPM using a centrifugal planetary mixer Thinky ARE 312 (Donau Lab, Belgrade, Serbia). The prepared suspension was subjected to stability analysis using a LUMiSizer analytical centrifuge (LUM GmbH, Berlin, Germany) at 300 RPM, with PA 134-XY cuvettes (LUM GmbH, Berlin, Germany) at a wavelength of 865 nm and a light factor 1. During this analysis, 200 profiles were recorded over a 10 s time interval. Each of the samples was analysed 3 times.
To introduce the concept of instability indexes, suspensions containing corundum Nabalox NO 115 TC with d50 = 4.0 μm (Nabaltec AG, Schwandorf, Germany), 2 wt.% aqueous solution of carboxymethylcellulose (CMC) (Sigma Aldrich, St. Louis, MO, USA, Mw = 70,000), and dispersant Dolapix CE64 were created (see Table 1). The suspensions were homogenized on the Thinky ARE 312 planetary mixer (Donau Lab, Belgrade, Serbia) for 45 min at 1800 RPM, followed by defoaming mode at 2400 RPM for 30 s. The prepared suspension was subjected to stability analysis using a LUMiSizer analytical centrifuge (LUM GmbH, Berlin, Germany) at 3000 RPM, with Lumicell PA 134-XY cuvettes at a wavelength of 865 nm and a light factor 1 at 25 °C. During this analysis, 300 profiles were recorded over a 10 s time interval. Each suspension was analysed 3 times.

Table 1.
Composition of corundum suspensions and their designation.
2.2. Evaluation of Stability Using Different Dispersion Media
For the analysis of the influence of the dispersion environment, 4 wt.% suspensions containing metakaolin Mefisto with d50 = 3.0 μm (České Lupkové Závody, a.s., Nové Strašecí, Czech Republic) were prepared. The composition and labelling of the samples are presented in Table 2. As a dispersion medium, a solution of 2 wt.% carboxymethylcellulose (Sigma Aldrich, St. Louis, MO, USA, Mw = 70,000) and 2 wt.% solution of polyvinylalcohol Mowiol (Sigma Aldrich, St. Louis, MO, USA, Mw = 61,000, 99%+ hydrolysed) was used. The suspensions were homogenised on the Thinky ARE 312 planetary mixer for 20 min at 1200 RPM, followed by defoaming mode at 2400 RPM for 30 s. The prepared suspension was subjected to stability analysis using a LUMiSizer analytical centrifuge at 300 RPM, with Lumicell PA 134-XY cuvettes at a wavelength of 865 nm and a light factor 1 at 25 °C. During this analysis, 200 profiles were recorded over a 5 s time interval. Each suspension was analysed 3 times.

Table 2.
Composition of metakaolin suspensions and their designation.
2.3. Evaluation of Stability Using Additives
For the analysis of the influence of the amount of porogens to create porous ceramics, aqueous suspensions containing 55 wt.% of corundum particles Nabalox NO 625-30 (Nabaltec AG, Schwandorf, Germany) with d50 = 3.0 µm were prepared. As a combustible additive, waste coffee grounds-based (WCG) porogen was used to replace 0–15% of corundum powder. The coffee grounds were collected from the regular operation of a café. The collected waste coffee grounds (WCG) were dried in a laboratory oven at 80 °C for five days. Subsequently, the oil components were extracted from the grounds using supercritical extraction with carbon dioxide. WCG was then milled at 500 RPM for 30 min on the planetary mill Pulverisette (Fritsch, Weimar, Germany). Particle size distributions (shown in Figure 1) of corundum and waste coffee grounds in their 0.1 wt.% aqueous suspensions were determined by dynamic light scattering using Zetasizer Advance Ultra Red (Malvern Panalytical Ltd., Malvern, UK). The composition and labelling of the samples are presented in Table 3. The suspensions were homogenized on the Thinky ARE 312 planetary mixer for 30 min at 500 RPM, followed by defoaming mode at 2400 RPM for 30 s. The prepared suspension was subjected to stability analysis using a LUMiSizer analytical centrifuge at 1000 RPM, with Lumicell PA 134-XY cuvettes at a wavelength of 865 nm and a light factor 1 at 25 °C. During this analysis, 200 profiles were recorded over a 10 s time interval. Each suspension was analysed 3 times. Rheological properties were obtained using a rheometer Discovery HR–2 (TA Instruments, New Castle, DE, USA), where the sample was tempered at 25 °C with a soak time of two minutes and pre-shear at a shear rate of 100 s−1. Subsequently, a flow curve was performed from a shear rate of 100 s−1 to 0.1 s−1, collecting 18 points.
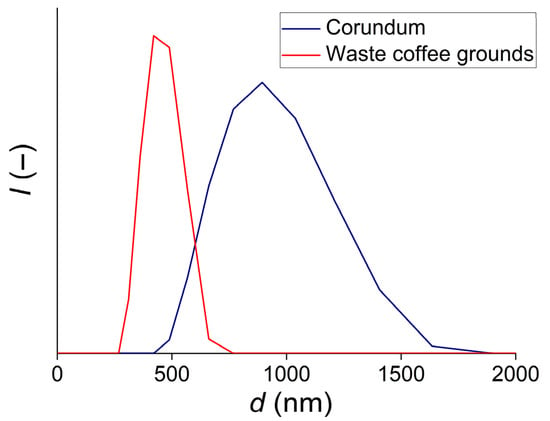
Figure 1.
Particle size distribution of corundum and waste coffee grounds.

Table 3.
Composition of corundum suspensions for porous ceramics preparation and their designation.
2.4. Optimization of Surfactant Concentration
To optimize the concentration of the dispersant, photocurable suspensions were created consisting of acrylic resin Anycubic (Shenzhen Anycubic Technology Co., Ltd. (Shenzhen, China) with dynamic viscosity 247 mPa∙s at 25 °C), 30 vol.% of zirconia nanoparticles doped with 3 mol.% of yttria with d50 = 25 nm (Skyspring Nanomaterials, Houston, TX, USA), and dispersant Disperbyk-103 (BYK-Chemie GmbH, Wesel, Germany) using 7.0, 7.5, 8.0, 8.5, 9.0, 9.5, and 10.0 wt.% of dispersant with respect to the weight of the powder. First, the resin and dispersant were mixed on the Thinky ARE 312 planetary mixer for 10 min at 500 RPM. Subsequently, zirconia grinding media (approximately 25% of the total mixture weight) and zirconia nanoparticles were added, and the mixture was mixed for 45 min at 1800 RPM. Homogenization was followed by defoaming mode at 2400 RPM for 30 s.
The prepared suspension was subjected to stability analysis using a LUMiSizer analytical centrifuge (LUM GmbH, Berlin, Germany) at 3000 RPM, with Lumicell PA 134-XY cuvettes at a wavelength of 865 nm and a light factor 1 at 25 °C. During this analysis, 200 profiles were recorded over a 10 s time interval. Each sample was analysed 3 times. Rheological measurements were performed on a Discovery HR-2 rheometer (TA Instruments, New Castle, DE, USA) using concentric cylinders (989,938 geometry). The sample was tempered for 5 min at 25 °C, using a Peltier device rheometer (TA Instruments, New Castle, DE, USA) connected to a lower geometry, and a pre-shear was then performed at a shear rate of 50 s−1 for 30 s. Subsequently, the tempered sample was subjected to a flow peak hold for 120 s at a 50 s−1 with a sampling interval of 5 s.
2.5. Additional Materials Characterization
The chemical composition of the used powders was obtained by an electron microscope JSM 7600–F (JEOL, Peabody, MA, USA) using Energy-dispersive X-ray spectroscopy (Oxford Ultim Max 100 mm2, (JEOL, Peabody, MA, USA)), with an accelerating voltage of 20 kV, while all the spectrum was composed of 10,000,000 counts per spectrum, with a dead time of 50%. Silica sand Dorsilit contains 56.8 wt.% of O, 42.4 wt.% of Si, and 0.6 wt.% of Al. Corundum powder consists of 52.4 wt.% of O and 47.6 wt.% of Al. Metakaolin powder consists of 55.6 wt.% of O, 21.2 wt.% of Si, 18.5 wt.% of Al, 2.6 wt.% of Fe, and 1.0 wt.% of K. Finally, zirconia powder consists of 63.3 wt.% of Zr, 33.1 wt.% of O, and 3.6 wt.% of Y.
The thermal analysis (TA), including mass and heat change of the milled coffee waste, was measured using the STA 449 F3 Jupiter instrument (Netzsch, Selb, Germany). The powdered sample of approx. 50 mg was weighed into a corundum crucible, heated to 1000 °C with 5 °C/min in an air atmosphere to determine the final temperature of coffee decomposition for a suitable further sintering process. Figure 2 shows three curves as a result of heating the powdered coffee waste sample to 1000 °C in an air atmosphere. The black solid and the black dotted curve represent thermogravimetric (TG) and derived thermogravimetry (dTG) results, respectively. The blue solid line represents the differential thermal analysis (DTA), where the peaks pointed upwards correspond to exothermic processes and peaks pointed downwards to endothermic processes. The first step in the order of approx. 4.6% mass decrease is shown at 150 °C and matches the drying of the sample (water loss). The DTA curve in this temperature interval is endothermic, which verifies our predictions. At higher temperatures up to about 600 °C, the exothermic process of coffee waste combustion is observed. The total mass loss in these stages is 91.1%. The sample mass does not change further when heated to 1000 °C.
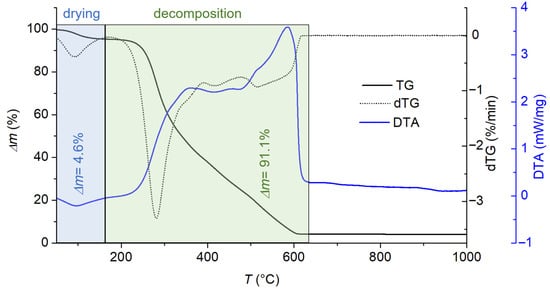
Figure 2.
Thermal analysis of waste coffee grounds, where the black solid line represents the mass change (TG), the black dotted curve the derived thermogravimetry (dTG), and the blue solid line the signal of the differential thermal analysis (DTA) heated to 1000 °C.
3. Results and Discussion
3.1. Introduction to Stability Analysis and Instability Indexes
The dispersion analyser LUMiSizer was selected for the experimental verification of stability and instability phenomena. Near-infrared light with a wavelength of 865 nm is transmitted through the polyamide cell, and the transmitted light is detected by 2087 sensors of the charge-coupled device line detector. The analytical centrifuge contains up to 12 measuring positions and can develop a centrifugal force of up to 2300× g [30,31]. The LUMiSizer analytical centrifuge measures the time and space-resolved transmission profiles of a sample placed in a cuvette subjected to a defined accelerated centrifugal force. It records the movement through a cuvette and evaluates the amount of dispersed phases, providing quantitative information on stability. The main output of stability analysis is a transmission profile—a graph of the dependence of transmittance on the position of the cuvette, which changes over time as the centrifuged particles travel towards the bottom of the cuvette.
In Figure 3, the schematic graphic output from the LUMiSizer centrifuge is shown, depicting the dependence of light transmission on the position within the cuvette, where the position in the cuvette corresponds to the distance from the axis of rotation of the centrifuge. After the application of a centrifugal field, the initially homogenous suspension undergoes centrifugally driven sedimentation, which simulates the accelerated process of conventional sedimentation under the Earth’s gravity. The centrifugal force causes the particles to move towards the bottom of the cuvette. The earliest transmittance profiles, recorded at the beginning of the experiment, are depicted in red. As the sedimentation proceeds under the applied centrifugal field, subsequent profiles are continually acquired and shown in time-resolved mode, and the final profiles are displayed in green. The first zone in the graphic representation shown in Figure 3, with a transmission rate of approximately 90%, corresponds to the air present above the sample in the cuvette. The key zones describing the progress of sedimentation and reflecting the suspension stability are zones two and three. In zone two, the initially well-dispersed suspension reflects a constantly low transmittance (below 10% in our graphical illustration). As the sedimentation proceeds and particles migrate towards the bottom of cuvette, the transmittance gradually increases (mainly on the left side of zone two in Figure 3), marking the transition of particles into zone three. In this third zone, kinetic phenomena induced by the centrifugation occur. Within this region, the LUMiSizer enables the study of phenomena such as flocculation [32], creaming [30], or sedimentation [33]. The fourth zone shows the bottom of the cuvette. If the prepared suspension is highly stable, no sedimentation profile will be formed in the third zone over time, or it will remain minimal.
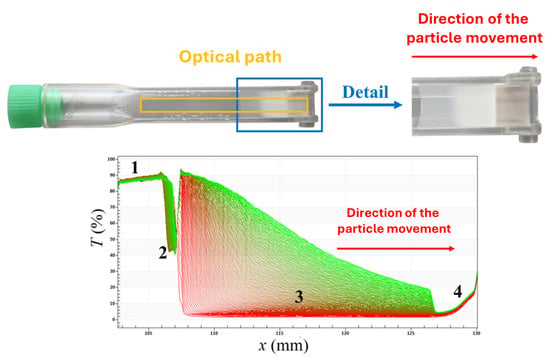
Figure 3.
Representative transmission profile of fine silica sand suspension with a cuvette photograph explaining the centrifugation process.
The instability index (II) is a number between 0 and 1, where zero corresponds to complete stability of the suspension and one corresponds to complete separation of particles from the dispersion medium [34], calculated by measuring the change in the transmission profile over time during the centrifugation process. Detloff et al. [35] introduced the instability index as a clarification at given time, which is divided by the maximum possible clarification. The “clarification at given time” is the observed change in transmission/extinction at a set separation time within the experimental run and the “maximum clarification” is the most achievable possible transmission change (i.e., total separation). The higher the instability index value, the lower the kinetic stability of the suspension. According to Ma et al. [36], the instability index below 0.05 indicates exceptional stability of the prepared mixture. In our work, stability analysis was performed on two corundum suspensions, one with the use of a dispersing agent (Dolapix CE64) and the other without it. It was found that the instability indices for suspensions with surfactant decreased with increasing volume filling of the ceramic. The given phenomenon is related to the electrostatic stabilization of the suspension [37], where the dispersant Dolapix protects the particle surface and prevents flocculation. As shown in Figure 4b, the sample containing 40 vol.% corundum achieved exceptional stability with an instability index of 0.004. Thanks to the increased viscosity of the suspension due to the high volumetric filling, which is a well-known rheological phenomenon [11,38], and at the same time, the perfect protection of the corundum particles, it is not possible to see the separation of the particles at the given centrifugal speed on the transmission profile. For these types of stabilized suspensions (shown in Figure 4b), the transmission profiles remain essentially constant throughout the entire LUMiSizer centrifugation experiment, with no visible changes within the previously described sedimentation zones.
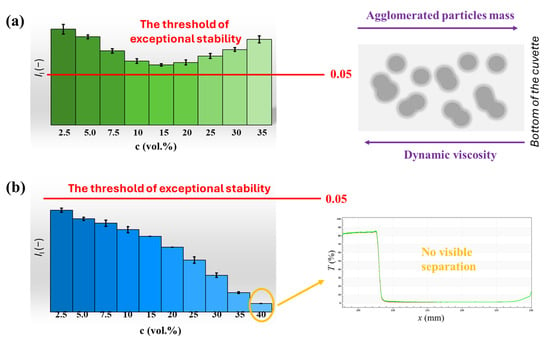
Figure 4.
Instability indexes for: (a) corundum suspensions without Dolapix surfactant, (b) corundum suspensions with Dolapix surfactant.
Without the use of a dispersant, the instability index decreased until the volumetric loading of the corundum powder has reached the value of 15 vol.%. Subsequently, it increased due to the formation of agglomerates. Without the surface protection, it is not possible to counteract the attractive interactions arising from van der Waals and steric forces [39]. Additionally, the values of the instability index reached higher values than for the samples with surfactant, due to the inevitable interactions of the particles, which caused them to be dragged to the bottom of the cuvette faster due to attractive forces. At the same time, the increased dynamic viscosity of the suspension counteracts the higher mass of the agglomerated particles, so the instability index did not increase significantly, as shown in Figure 4a. Therefore, the instability index not only predicts the long-term stability of suspensions but also serves as an indicator of the dispersant effectiveness, or, in the absence of dispersant, as an indicator of undesired steric phenomena (aggregation, agglomeration…).
3.2. Selection of Dispersion Media
Three types of metakaolin suspensions were created using different dispersion media: aqueous, a 2 wt.% aqueous solution of carboxymethylcellulose, and a 2 wt.% aqueous solution of polyvinyl alcohol. Evaluation of the stability of metakaolin suspensions is crucial for various technological applications, including its use as a precursor to geopolymers [40], in the construction industry [41], or as a supplementary cementitious material that can be added to concrete to enhance its strength, durability, and workability [42,43]. However, aqueous suspensions with metakaolin do not form a sharp sedimentation interface. In sedimentation governed by water accumulation, the process proceeds slowly, and the supernatant remains turbid for days or even weeks [44]. For such types of suspensions (well-dispersed, with low concentration), it is not possible to use Kynch theory [22] because the Kynch sedimentation front is not well developed. This type of sedimentation does not lead to the formation of a distinct phase boundary between the sediment and the dispersion medium. Geng et al. [45] investigated the sedimentation of an aqueous metakaolin suspension in a vessel, measuring the amount of clarified water in millilitres per unit time. However, using this simple technique cannot determine the terminal velocity with high accuracy or exclude the presence of fine particles from the formed water level, as the suspension remains turbid. Thanks to the gradual evaluation of the transition profiles over time, the LUMiSizer device can provide detailed information on the process of separation of solid particles from the dispersion medium, as well as comprehensive information on the suspension stability. It is also possible to calculate the terminal velocity of metakaolin particles.
In Figure 5, the sedimentation of three types of metakaolin suspensions is visible. For measurement accuracy, the same volume of metakaolin slurry and the same container were used for the experiment. The fastest separation occurred in the aqueous environment, where the presence of aqueous solutions of PVA and CMC stabilized the particles in the solution through the formation of a polymer network. Samples MK(2%PVA) and MK(2%CMC) showed very similar behaviour visually.
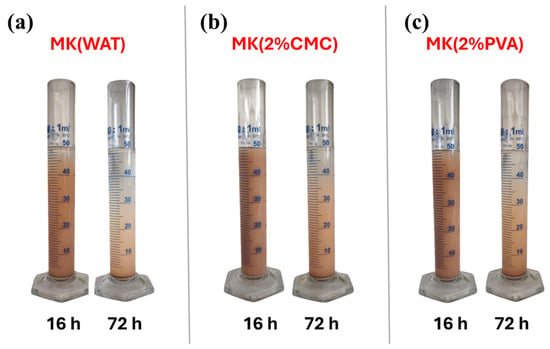
Figure 5.
Sedimentation test in cylinder for samples (a) MK(WAT), (b) MK(2%CMC), (c) MK(2%PVA).
The terminal velocity of particles using the LUMiSizer centrifuge should be expressed as [46]
where A is an experimentally obtained constant (Table 4), and RCF refers to the Relative Centrifugal Force, which is calculated as [47]
where is the radius position distance, and RPM means Revolutions per Minute.

Table 4.
Constants A from the LUMiSizer analytical centrifuge and terminal velocities obtained by the LUMiSizer and modified Stokes law for metakaolin suspensions.
Modified Stokes’ law [47] can also be used in calculating the terminal velocity. However, there are several non-negligible problems in the calculation. Jalaal et al. [48] have shown that a decrease in the sphericity has no influence on the initial acceleration for zero initial velocity but produces a reduction in the settling time. On the other hand, Big-Alabo et al. [49] show that sphericity affects the initial acceleration when the initial velocity is non-zero. Additionally, the drag laws derived based on orientation and other shape factors are algebraically complex and not computationally suitable for particle motion analysis [49]. Another complication in the mechanical calculation of terminal velocity is the Basset force—the force arising due to the delayed development of the boundary layer resulting from the changing relative velocity (acceleration) of bodies moving through a fluid. However, the formed layer does not instantly adjust to changes in the particle’s motion [50]. Modified Stokes’ law allows determining the terminal velocity as
where r is a particle Stokes radius, is a particle density, is a dispersing media density, is the dynamic viscosity of the medium, g is a gravitational acceleration, and is a hindrance function, calculated as [51]
where is volume filling (4 wt.% of metakaolin is equal 1.68 vol.%) and represents the dynamic viscosity of the suspension (in this case, 1.03 Pa∙s).
Terminal velocities obtained from the LUMiSizer analytical centrifuge and from the modified Stokes law can be seen in Table 4:
Both methods confirmed the visual observation that the fastest sedimentation of particles occurs in an aqueous environment. According to both methods, aqueous solutions of PVA and CMC are approximately three times more effective in slowing down the sedimentation of metakaolin particles.
It is also possible to compare the effectiveness of selected dispersion media using transmission profiles and instability indices obtained by the LUMiSizer analytical centrifuge, allowing rapid verification of their suitability without the need to wait for the results of conventional, yet highly time-consuming, cylinder sedimentation tests. As shown in Figure 6, metakaolin particles separated more intensively over time in aqueous environments than in environments with a polymer stabilizer. This difference between samples is clearly evident from the time-dependent shift of the transmittance profiles acquired using LUMiSizer, particularly in zone two of the sedimentation profile. The sample of metakaolin dispersed in water (without polymer stabilizer) exhibits pronounced changes in transmittance over time, mainly on the left side of zone two in acquired profiles. In contrast, the sedimentation process, connected with an increase in transmittance on the left side of zone two, is significantly slowed for the samples containing polymer stabilizers (Figure 6b,c). Naturally, this fact was reflected in a decrease in the instability index of the suspensions in the presence of PVA or CMC. As shown in Table 4, the MK(2%CMC) sample exhibits a slightly lower sedimentation rate than the MK(2%PVA) sample, a finding confirmed by transmission profiles and instability index values.
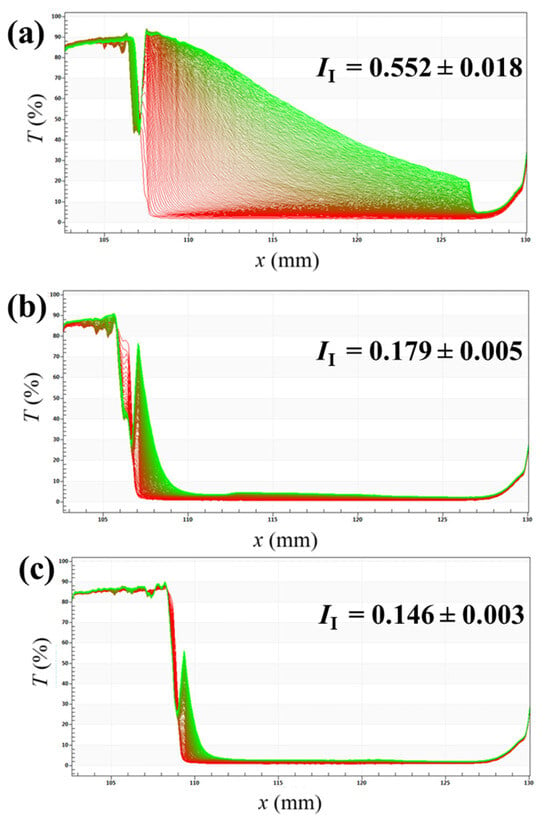
Figure 6.
Transmission profiles with instability index values for (a) MK(WAT), (b) MK(2%PVA), (c) MK(2%CMC).
3.3. Determining the Effect of the Additive on Suspension Stability
Currently, the study of various porogens to produce porous alumina ceramics is gaining popularity. Cornstarch is a widely used and effective porogen, as noted in multiple scientific publications [52,53,54]. In today’s modern era, where the use of secondary raw materials is increasing in importance due to ecological concerns, alternative porogens are being sought. One such promising alternative is the utilization of waste coffee grounds [55].
The conventional method for characterizing prepared alumina suspensions is rheological measurement, which allows access to information about shaping options, such as slip casting [55] or semi-dry pressing [56]. But rheological measurement alone cannot guarantee stability during green body formation.
In our model experiment, water was chosen as the appropriate dispersion medium from the considered water or ethanol media. The reason is straightforward, due to the lower viscosity of ethanol, the particles were centrifuged faster towards the bottom of the cuvette, and their instability increased, as shown in Figure 7. Changes in the transmittance profile at the cuvette position of approximately 107–118 mm, which are manifested by oscillations in transmittance values between 45–60%, are caused by the so-called “Drafting–Kissing–Tumbling” phenomenon [57], where particles settling faster may overtake slower ones, causing temporary clustering or stringing—this changes local particle density and transiently affects transmission. Please note the difference in the photos between the green bodies of the aqueous and ethanol samples. The LUMiSizer analytical centrifuge can predict the difference in stability of these two suspensions. However, factors such as the rate of ethanol evaporation in air cannot be detected by LUMiSizer. Although instability indices provide similar values (for water suspension II = 0.224 ± 0.019; for ethanol suspension, a slightly higher value of II = 0.257 ± 0.024 due to lower dynamic viscosity), the difference in the photos of the green body after drying of water is obvious. Sazhin [58] reported that ethanol has a higher vapor pressure and thus evaporates faster than water under the same conditions. Therefore, it is sometimes appropriate to combine stability analysis with additional analyses or preparation of samples, in this case, mould casting.
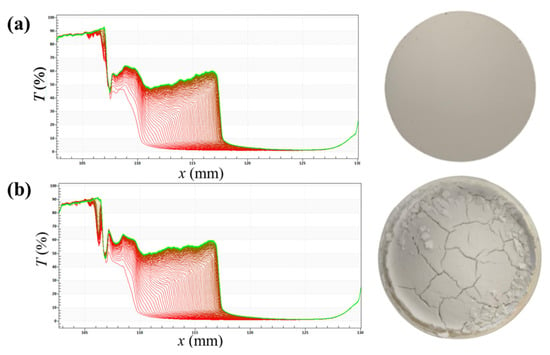
Figure 7.
Transmission profiles and photographs of green bodies for 55 wt.% corundum suspensions prepared in (a) water and (b) ethanol.
The stability of suspensions can be significantly enhanced by bimodal/multimodal particle size distribution, which is the case of prepared suspensions (see Figure 1). To increase packing density and decrease free liquid that would otherwise permit larger particles to flow and settle, the addition of the smaller particles, which occupy the interstitial spaces between larger particles, can significantly increase suspension stability [59]. Also, as stated by Guazzelli and Morris [60], the sedimentation velocity of a particle increases with the square of its diameter. The incorporation of smaller particles increases the density of the continuous phase and restricts the movement of larger ones, thereby reducing the rate of sedimentation. This fact is also evident in Figure 8, where the nascent peak caused by centrifugal force decreases with increasing waste coffee content. As described in the previous sections, this reduced shift of transmittance profiles over time, together with lower detected transmittance values on the left side of zone two in the transmittance profile, provides clear evidence of the enhanced sample stability. The increasing stability is related, in addition to the factors mentioned above, to the rising dynamic viscosity of the suspension, as shown in Figure 8 and Figure 9. After fitting the flow curves by the Cross model [61], all suspensions showed pseudoplastic behaviour. It has been demonstrated that an increase in hydrodynamic resistance is caused by disturbances in the flow field resulting from the presence of particles of different sizes. The interaction results in non-linear increases in viscosity, with the level of solids content having a significant impact on the resulting increase [60].
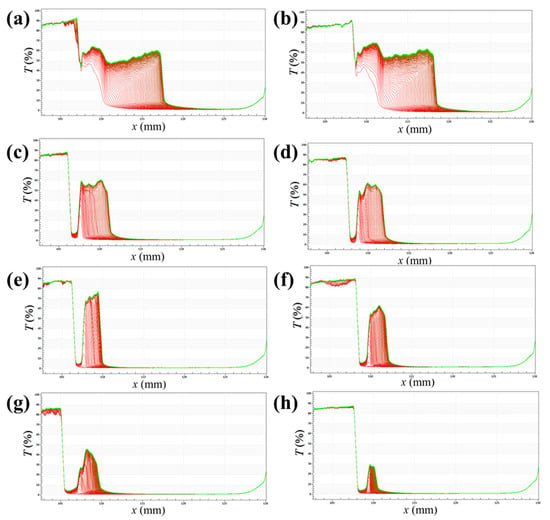
Figure 8.
Transmission profiles for samples: (a) COR(55)COF(0); (b) COR(54)COF(1); (c) COR(52.5)COF(2.5); (d) COR(50)COF(5); (e) COR(47.5)COF(7.5); (f) COR(45)COF(10); (g) COR(42.5)COF(12.5); (h) COR(50)COF(15).
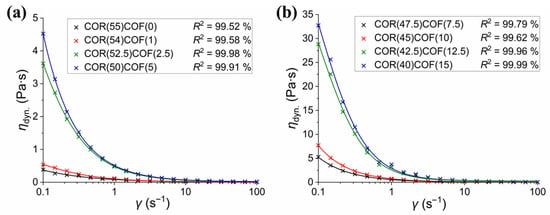
Figure 9.
Flow curves for corundum suspensions: (a) samples COR(55)COF(0)–COR(50)COF(5); (b) COR(47.5)COF(7.5)–COR(40)COF(15).
3.4. Optimizing Dispersant Concentration for 3D Printing Purposes
DLP printing is a modern 3D printing method that requires optimization of the dispersant concentration. If the dispersant concentration is insufficient, unwanted agglomeration of particles occurs, which not only increases the dynamic viscosity value [62,63] but also accelerates sedimentation towards the bottom of the printing tank, potentially resulting in the layer not being properly cured on the platform and thus damaging the entire printout. Additionally, it increases instability due to the inability to prevent Brownian motion [64]. On the other hand, if an excessive amount of dispersant is used, an undesired rheological phenomenon occurs—depletion flocculation—where the surfactant polymer chains form tangles, thus increasing the dynamic viscosity and instability of the suspension [64].
Optimization should be performed whenever a new composition is suggested for the AM process. The required amount of surfactant depends on the specific surface, type of ceramic powder, dispersing media, or particle shape. The traditional method of optimization involves measuring the dynamic viscosity of a given suspension at a specific shear rate using rheological measurements. With increasing agent concentration, the dynamic viscosity value decreases as all particles are gradually coated, reaching a minimum. This is typically followed by an increase in dynamic viscosity due to an excessive amount of dispersant, causing depletion flocculation. Additionally, the introduction of the LUMiSizer analytical centrifuge in our model study (data shown in Figure 10) enabled the analysis of representative transmission profiles, which helped to indicate that the lowest particle separation occurs at an optimal dispersant concentration of 8.5 wt.%. Figure 10a shows a graph of the dynamic viscosity versus dispersant concentration for a photocurable suspension containing zirconia nanoparticles. The optimal dispersant concentration is 8.5% by weight of the powder. A faster complementary method to determine the optimal concentration is to evaluate the instability indices by using the LUMiSizer analytical centrifuge. When increasing the concentration from 7 wt.%, there is a gradual protection of the particles. Above 8.5 wt.% of dispersing agent, the movement of excess dispersant becomes evident in LUMiSizer data, and the instability index increases, as shown in Figure 10b. All the prepared photocurable suspensions were highly stable, as their instability indexes were below 0.05.
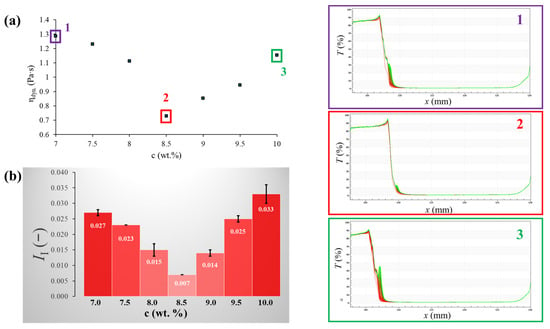
Figure 10.
(a) dependence of dynamic viscosity on surfactant concentration with representative transmission profiles; (b) instability indexes of zirconia samples for different surfactant concentrations.
4. Conclusions
In this work, the kinetic stability of ceramic suspensions was investigated and characterized using a prospective method based on real-time transmission profiles measurement with a LUMiSizer analytical centrifuge. The main conclusions can be summarized as follows:
- (1)
- Using centrifugal force in an analytical centrifuge, it is possible to monitor the sedimentation process over time and evaluate kinetic stability using the values of the so-called instability index.
- (2)
- The instability index value can be used to determine the optimal volumetric concentration of the suspension at which no particle agglomeration occurs, even without the addition of a stabilizing agent. Corundum suspensions in a 2 wt.% water solution of CMC were analysed, and the LUMiSizer centrifuge proved that it is possible to homogenize suspensions up to 15 vol.% of particles without agglomeration. Suspensions with used dispersant showed exceptional kinetic stability, while their instability indexes reached values below 0.05.
- (3)
- It has been demonstrated that the optimal dispersion environment, which minimizes particle sedimentation, can be identified without the necessity of using time-consuming and inaccurate cylinder-based sedimentation tests. From the analysis of metakaolin suspensions examined in three different environments, it was confirmed that the graphical output and the corresponding II values obtained using the LUMiSizer centrifuge confirmed that sedimentation is significantly reduced in the medium containing the polymer stabilizer compared to the purely aqueous environment.
- (4)
- The incorporation of porogens in the formation of porous ceramics increased the suspension stability, and the analytical centrifuge provides an opportunity for assessment of the effect of different additives on suspension stability. In particular, the stability of the prepared corundum suspensions increased with increasing waste coffee grounds content, which can be attributed to the corresponding increase in the dynamic viscosity values of the suspensions.
- (5)
- The instability index value proved to be a valuable complementary parameter for verifying the accuracy of conventional rheological measurements when optimizing the dispersant concentration, thereby preventing the occurrence of depletion flocculation or undesirable particle agglomeration. For a photocurable system containing zirconia particles, the optimal dispersant concentration (8.5 wt.%) was evaluated, with the corresponding instability indices exhibiting an excellent correlation with rheological data.
The presented work provides valuable insight into the analysis of the stability of suspensions under centrifugal field and brings possibilities for fast and accurate evaluation of kinetic stability. In addition to the demonstrable complementarity to conventional rheological measurements, this promising method in the field of ceramic technology opens up a broad scope for further analyses, including potential correlations with parameters such as zeta potential or behavior of multimodal systems.
Author Contributions
Conceptualization, P.S., P.V. and T.S.; methodology, P.S., M.K. and T.S.; validation, P.S., P.P., P.Š. and J.B.; formal analysis, P.S. and T.S.; investigation, P.S., T.S. and M.K.; resources, P.P. and P.Š.; data curation, P.S., T.S. and J.B.; writing—original draft preparation, P.S. and T.S.; writing—review and editing, P.Š., M.K., J.B., P.V. and P.P.; visualization, P.S., P.P. and T.S.; supervision, P.P. and P.Š.; funding acquisition, P.S. and P.P. All authors have read and agreed to the published version of the manuscript.
Funding
This research was funded by a project of Specific Research of the Ministry of Education, Youth and Sports of the Czech Republic, FCH-S-25-8836.
Institutional Review Board Statement
Not applicable.
Informed Consent Statement
Not applicable.
Data Availability Statement
The original contributions presented in this study are included in the article. Further inquiries can be directed to the corresponding author.
Conflicts of Interest
The authors declare no conflicts of interest.
References
- Łada, P.; Falkowski, P.; Miazga, A.; Konopka, K.; Szafran, M. Fabrication of ZrO2-Ti Composites by Slip Casting Method. Arch. Metall. Mater. 2016, 61, 1095–1100. [Google Scholar] [CrossRef]
- Wong, T.L.; Li, R.K.Y.; Wu, C.M.L. Injection Moulding of Sicw/Al2O3 Composites. J. Mater. Process. Technol. 1997, 63, 399–404. [Google Scholar] [CrossRef]
- Zhang, X.; Jin, Y.; Li, D.; Xiong, Y. A Review on Recent Advances in Micro-Tubular Solid Oxide Fuel Cells. J. Power Sources 2021, 506, 230135. [Google Scholar] [CrossRef]
- Fabuel, C.; Gómez-Tena, M.P.; Moreno, A.; González-Juárez, F.; Rico-Pérez, V.; Balcells, J. Binder Jetting for Functional Testing of Ceramic Sanitaryware. Ceramics 2025, 8, 58. [Google Scholar] [CrossRef]
- De Noni, A., Jr.; Garcia, D.E.; Hotza, D. A Modified Model for the Viscosity of Ceramic Suspensions. Ceram. Int. 2002, 28, 731–735. [Google Scholar] [CrossRef]
- Tanurdjaja, S.; Tallon, C.; Scales, P.J.; Franks, G.V. Influence of Dispersant Size on Rheology of Non-Aqueous Ceramic Particle Suspensions. Adv. Powder Technol. 2011, 22, 476–481. [Google Scholar] [CrossRef]
- Wilms, P.; Hinrichs, J.; Kohlus, R. Macroscopic Rheology of Non-Brownian Suspensions at High Shear Rates: The Influence of Solid Volume Fraction and Non-Newtonian Behaviour of the Liquid Phase. Rheol. Acta 2021, 61, 123–138. [Google Scholar] [CrossRef]
- Lin, L.; Wu, H.; Li, Y.; Wang, J.; Wu, S. Effect of Particle Size on Rheology, Curing Kinetics, and Corresponding Mechanical and Thermal Properties of Aluminum Nitride (AlN) Ceramic by Digital Light Processing (DLP)-Based Vat Photopolymerization. J. Eur. Ceram. Soc. 2024, 44, 184–192. [Google Scholar] [CrossRef]
- Chargui, F.; Hamidouche, M.; Louahdi, R.; Fantozzi, G. Rheological Behavior of an Algerian Natural Kaolin: Effect of Dispersant. Ceramics 2024, 7, 1159–1171. [Google Scholar] [CrossRef]
- Ahlhelm, M.; Werner, D.; Kaube, N.; Maier, J.; Abel, J.; Behnisch, T.; Moritz, T.; Michaelis, A.; Gude, M. Deriving Principles of the Freeze-Foaming Process by Nondestructive Ct Macrostructure Analyses on Hydroxyapatite Foams. Ceramics 2018, 1, 65–82. [Google Scholar] [CrossRef]
- Horri, B.A.; Ranganathan, P.; Selomulya, C.; Wang, H. A New Empirical Viscosity Model for Ceramic Suspensions. Chem. Eng. Sci. 2011, 66, 2798–2806. [Google Scholar] [CrossRef]
- Komissarenko, D.A.; Sokolov, P.S.; Evstigneeva, A.D.; Slyusar, I.V.; Nartov, A.S.; Volkov, P.A.; Lyskov, N.V.; Evdokimov, P.V.; Putlayev, V.I.; Dosovitsky, A.E. DLP 3D Printing of Scandia-Stabilized Zirconia Ceramics. J. Eur. Ceram. Soc. 2021, 41, 684–690. [Google Scholar] [CrossRef]
- Sun, Y.; Wang, C.; Zhao, Z. ZTA Ceramic Materials for DLP 3D Printing. IOP Conf. Ser. Mater. Sci. Eng. 2019, 678, 012020. [Google Scholar] [CrossRef]
- Liu, Y.; Liu, Y.; She, W.; Cao, Y.; Zeng, Q.; Dong, N. Effect of Reactive Diluent Concentration on Rheological and Curing Behavior of Zirconia Ceramic Slurry for DLP Printing. Int. J. Appl. Ceram. Technol. 2023, 21, 62–75. [Google Scholar] [CrossRef]
- Edirisinghe, M.J.; Evans, J.R.G. Properties of Ceramic Injection Moulding Formulations: Part 1 Melt Rheology. Int. J. Mater. Sci. 1987, 22, 269–277. [Google Scholar] [CrossRef]
- Durgut, E.; Cinar, M.; Terzi, M.; Kursun Unver, I.; Yildirim, Y.; Ozdemir, O. Evaluation of Different Dispersants on the Dispersion/Sedimentation Behavior of Halloysite, Kaolinite, and Quartz Suspensions in the Enrichment of Halloysite Ore by Mechanical Dispersion. Minerals 2022, 12, 1426. [Google Scholar] [CrossRef]
- Lueptow, R.M.; Hollerbach, R.; Serre, E. Taylor–Couette and Related Flows on the Centennial of Taylor’s seminal Philosophical Transactions paper: Part 1. Philos. Trans. R. Soc. A 2023, 381, 20220140. [Google Scholar] [CrossRef]
- Xu, X.; Zhou, S.; Wu, J.; Liu, S.; Ma, S.; Cheng, T. Study of Alumina Ceramic Parts Fabricated Via DLP Stereolithography Using Powders with Different Sizes and Morphologies. Int. J. Appl. Ceram. Technol. 2022, 20, 1167–1193. [Google Scholar] [CrossRef]
- de Camargo, I.L.; Morais, M.M.; Fortulan, C.A.; Branciforti, M.C. A Review on the Rheological Behavior and Formulations of Ceramic Suspensions for Vat Photopolymerization. Ceram. Int. 2021, 47, 11906–11921. [Google Scholar] [CrossRef]
- Guldner, K.; Dahmann, D.; Mattenklott, T.; Fricke, H.H.; Steinig, O.; Böhm, J. Development of conversion factors for results of early gravimetric dust measurements. Gefahrstoffe—Reinhalt. Luft. 2011, 75, 191–198. [Google Scholar]
- Ulusoy, U.; Yekeler, M.; Biçer, C.; Gülsoy, Z. Combination of the Particle Size Distributions of Some Industrial Minerals Measured by Andreasen Pipette and Sieving Techniques. Particle 2006, 23, 448–456. [Google Scholar] [CrossRef]
- Ding, G.; He, R.; Zhang, K.; Xia, M.; Feng, C.; Fang, D. Dispersion and Stability of SiC Ceramic Slurry for Stereolithography. Ceram. Int. 2020, 46, 4720–4729. [Google Scholar] [CrossRef]
- Concha, F.; Bustos, M.C. A Modification of the Kynch Theory of Sedimentation. AIChE J. 1987, 33, 312–315. [Google Scholar] [CrossRef]
- Tiller, F.M. Revision of Kynch Sedimentation Theory. AIChE J. 1981, 27, 823–829. [Google Scholar] [CrossRef]
- Fitch, B. Kynch Theory and Compression Zones. AIChE J. 1983, 29, 940–947. [Google Scholar] [CrossRef]
- Fatimi, A.; Tassin, J.-F.; Axelos, M.A.V.; Weiss, P. The Stability Mechanisms of An Injectable Calcium Phosphate Ceramic Suspension. Mater. Sci. Mater. Med. 2010, 21, 1799–1809. [Google Scholar] [CrossRef] [PubMed]
- Maude, A.D.; Whitmore, R.L. A Generalized Theory of Sedimentation. Br. J. Appl. Phys. 1958, 9, 477–482. [Google Scholar] [CrossRef]
- Svedberg, T. Sedimentation Constants, Molecular Weights, and Isoelectric Points of the Respiratory Proteins. J. Biol. Chem. 1933, 103, 311–325. [Google Scholar] [CrossRef]
- Burgos-Montes, O.; Moreno, R. Stability of Concentrated Suspensions of Al2O3–SiO2 Measured by Multiple Light Scattering. J. Eur. Ceram. Soc. 2009, 29, 603–610. [Google Scholar] [CrossRef]
- Zielińska, A.; Martins-Gomes, C.; Ferreira, N.R.; Silva, A.M.; Nowak, I.; Souto, E.B. Anti-Inflammatory and Anti-Cancer Activity of Citral: Optimization of Citral-Loaded Solid Lipid Nanoparticles (SLN) Using Experimental Factorial Design and Lumisizer®. Int. J. Pharm. 2018, 553, 428–440. [Google Scholar] [CrossRef] [PubMed]
- Caddeo, C.; Manconi, M.; Fadda, A.M.; Lai, F.; Lampis, S.; Diez-Sales, O.; Sinico, C. Nanocarriers for Antioxidant Resveratrol: Formulation Approach, Vesicle Self-Assembly and Stability Evaluation. Colloids Surf. B Biointerfaces 2013, 111, 327–332. [Google Scholar] [CrossRef]
- Zhang, W.; Hao, J.; Yuan, Y.; Xu, D. Influence of Carboxymethyl Cellulose on the Stability, Rheological Property, and In-Vitro Digestion of Soy Protein Isolate (Spi)-Stabilized Rice Bran Oil Emulsion. Front. Nutr. 2022, 9, 878725. [Google Scholar] [CrossRef]
- Zhai, O.; Baust, H.; Gleiß, M.; Nirschl, H. Model-Based Scale Up of Solid Bowl Centrifuges Using Experimentally Determined Material Functions. Chem. Ing. Tech. 2022, 95, 189–198. [Google Scholar] [CrossRef]
- Kleinubing, S.A.; Outuki, P.M.; Hoscheid, J.; Pelegrini, B.L.; Antonio da Silva, E.; Renata de Almeida Canoff, J.; Miriam de Souza Lima, M.; Carvalho Cardoso, M.L. Hyaluronic Acid Incorporation into Nanoemulsions Containing Pterodon Pubescens Benth. Fruit Oil for Topical Drug Delivery. Biocatal. Agric. Biotechnol. 2021, 32, 101939. [Google Scholar] [CrossRef]
- Detloff, T.; Sobisch, T.; Lerche, D. Instability Index. Dispersion Letters Technical T4. 2013, pp. 1–4. Available online: https://www.dispersion-letters.com/technical-notes/instability-index (accessed on 21 August 2025).
- Ma, L.; Liu, D.; Li, X.; Zou, L.; Wang, Q.; Liu, W. Glycerol-Regulated Water Content in Dha Algal Oil Emulsions: Effects on Emulsion Stability and Oxidative Stability of Dha Algal Oil. J. Food Sci. 2025, 90, e70308. [Google Scholar] [CrossRef]
- Koltay, J.A.; Feke, D.L. Preparation of Continuous Fiber Ceramic Composites Using A Combination of Steric-Stabilization and Depletion-Flocculation Phenomena. Compos. Part A Appl. Sci. Manuf. 1999, 30, 231–237. [Google Scholar] [CrossRef]
- Mitkus, R.; Sinapius, M. Piezoelectric Ceramic/Photopolymer Composites Curable with UV Light: Viscosity, Curing Depth, and Dielectric Properties. J. Compos. Sci. 2022, 6, 212. [Google Scholar] [CrossRef]
- Li, Y.; Sheng, P.; Lin, L.; Wang, L.; Lu, D.; Lin, K.; Wu, H.; Wu, S. Vat Photopolymerization Versus Conventional Colloidal Processing Methods in Structural Ceramics: Progress, Challenges, and Future Perspectives. Addit. Manuf. Front. 2024, 3, 200110. [Google Scholar] [CrossRef]
- Liu, H.; Wang, Z.; Tian, Z.; Bu, J.; Qiu, J. Effect and Mechanism of Metakaolin Powder (MP) on Rheological and Mechanical Properties of Cementitious Suspension. Materials 2022, 15, 5797. [Google Scholar] [CrossRef]
- Malta, J.O.; Oliveira, L.V.S.; Ueki, M.M.; Barreto, L.S. Characterization and Stabilization of Nano-Metakaolin Colloidal Suspensions. Powder Technol. 2021, 383, 43–55. [Google Scholar] [CrossRef]
- Kocak, Y. Effects of Metakaolin on the Hydration Development of Portland–Composite Cement. J. Build. Eng. 2020, 31, 101419. [Google Scholar] [CrossRef]
- Ismail, M.K.; Hassan, A.A.A. Use of Metakaolin on Enhancing the Mechanical Properties of Self-Consolidating Concrete Containing High Percentages of Crumb Rubber. J. Clean. Prod. 2016, 125, 282–295. [Google Scholar] [CrossRef]
- Xu, X.; Oliveira, M.; Ferreira, J.M.F. Effect of Solvent Composition on Dispersing Ability of Reaction Sialon Suspensions. J. Colloid Interface Sci. 2003, 259, 391–397. [Google Scholar] [CrossRef] [PubMed]
- Geng, H.; Chen, W.; Li, Q.; Shui, Z.; Yuan, B. Effect of Pre-Dispersing Metakaolin in Water on the Properties, Hydration, and Metakaolin Distribution in Mortar. Front. Mater. 2019, 6, 99. [Google Scholar] [CrossRef]
- Lerche, D.; Sobisch, T. Direct and Accelerated Characterization of Formulation Stability. J. Disper. Sci. Technol. 2011, 32, 1799–1811. [Google Scholar] [CrossRef]
- Felipe, L.d.O.; Bicas, J.L.; Changwatchai, T.; Abah, E.O.; Nakajima, M.; Neves, M.A. Physical Stability of A-Terpineol-Based Nanoemulsions Assessed by Direct and Accelerated Tests Using Photo Centrifuge Analysis. LWT 2024, 205, 116513. [Google Scholar] [CrossRef]
- Jalaal, M.; Ganji, D.D.; Ahmadi, G. An Analytical Study on Settling of Non-Spherical Particles. Asia Pac. J. Chem. Eng. 2010, 7, 63–72. [Google Scholar] [CrossRef]
- Big-Alabo, A.; Ebieto, C.E.; Ofodu, J.C.; Ossia, C.V. on the Gravitational Fall of A Non-Spherical Particle in A Quiescent Fluid Medium. Powder Technol. 2023, 430, 119017. [Google Scholar] [CrossRef]
- Thomas, P.J. On the Influence of the Basset History Force on the Motion of A Particle Through A Fluid. Phys. Fluids A 1992, 4, 2090–2093. [Google Scholar] [CrossRef]
- Lerche, D. Comprehensive Characterization of Nano- and Microparticles by In-Situ Visualization of Particle Movement Using Advanced Sedimentation Techniques. KONA Powder Part. J. 2019, 36, 156–186. [Google Scholar] [CrossRef]
- Khattab, R.M.; Wahsh, M.M.S.; Khalil, N.M. Preparation and Characterization of Porous Alumina Ceramics Through Starch Consolidation Casting Technique. Ceram. Int. 2012, 38, 4723–4728. [Google Scholar] [CrossRef]
- Alag, H.K.; Zamel, R.S. Studying the Properties of Porous Alumina Using Starch as A Binder. J. Al-Nahrain Univ. Sci. 2018, 21, 112–118. [Google Scholar] [CrossRef]
- Gregorová, E.; Pabst, W. Process Control and Optimized Preparation of Porous Alumina Ceramics by Starch Consolidation Casting. J. Eur. Ceram. Soc. 2011, 31, 2073–2081. [Google Scholar] [CrossRef]
- Kerolli Mustafa, M.; Gabelica, I.; Mandić, V.; Veseli, R.; Ćurković, L. Reusing Waste Coffee Grounds in the Preparation of Porous Alumina Ceramics. Sustainability 2022, 14, 14244. [Google Scholar] [CrossRef]
- Smirnov, A.D.; Kholodkova, A.A.; Rybalchenko, V.V.; Tarasovskii, V.P. Porous Alumina-Bentonite Ceramics: Effects of Fillers and Molding Technique. Ceramics 2023, 6, 132–145. [Google Scholar] [CrossRef]
- Zhang, X.; Tahmasebi, P. Drafting, Kissing and Tumbling Process of Two Particles: The Effect of Morphology. Int. J. Multiph. Flow 2023, 160, 104379. [Google Scholar] [CrossRef]
- Sazhin, S. Droplets and Spray; Springer: London, UK, 2014; ISBN 978-1-4471-6385-5. [Google Scholar]
- Abu-Lebdeh, T.M.; Damptey, R.; Ungureanu, L.M.; Petrescu, F.I.T. A Ternary Model for Particle Packing Optimization. J. Compos. Sci. 2022, 6, 113. [Google Scholar] [CrossRef]
- Guazzelli, E.; Morris, J.F. A Physical Introduction to Suspension Dynamics; Cambridge University Press: Cambridge, UK, 2012; ISBN 978-0-521-19319-1. [Google Scholar]
- Shapiro, A.P.; Probstein, R.F. Random Packings of Spheres and Fluidity Limits of Monodisperse and Bidisperse Suspensions. Phys. Rev. Lett. 1992, 68, 1422–1425. [Google Scholar] [CrossRef]
- Baum, M.; Anders, D.; Reinicke, T. Enhancing Injection Molding Simulation Accuracy: A Comparative Evaluation of Rheological Model Performance. Appl. Sci. 2024, 14, 8468. [Google Scholar] [CrossRef]
- Wang, D.; Chen, T.; Zeng, Y.; Chen, X.; Xing, W.; Fan, Y.; Qiao, X. Optimization of UV-Curable Alumina Suspension for Digital Light Processing of Ceramic Membranes. J. Membr. Sci. 2022, 643, 120066. [Google Scholar] [CrossRef]
- Trembecka-Wójciga, K.; Ortyl, J. Enhancing 3D Printed Ceramic Components: The Function of Dispersants, Adhesion Promoters, and Surface-Active Agents in Photopolymerization-Based Additive Manufacturing. Adv. Colloid Interface Sci. 2024, 332, 103251. [Google Scholar] [CrossRef] [PubMed]
Disclaimer/Publisher’s Note: The statements, opinions and data contained in all publications are solely those of the individual author(s) and contributor(s) and not of MDPI and/or the editor(s). MDPI and/or the editor(s) disclaim responsibility for any injury to people or property resulting from any ideas, methods, instructions or products referred to in the content. |
© 2025 by the authors. Licensee MDPI, Basel, Switzerland. This article is an open access article distributed under the terms and conditions of the Creative Commons Attribution (CC BY) license (https://creativecommons.org/licenses/by/4.0/).