Article

Luminescence of (YxGd3−x)(AlyGa5−y)O12:Ce and (LuxGd3−x)(AlyGa5−y)O12:Ce Radiation-Synthesized Ceramics

by
Aida Tulegenova
1,2,*,
Victor Lisitsyn
3,
Gulnur Nogaibekova
1,2,
Renata Nemkayeva
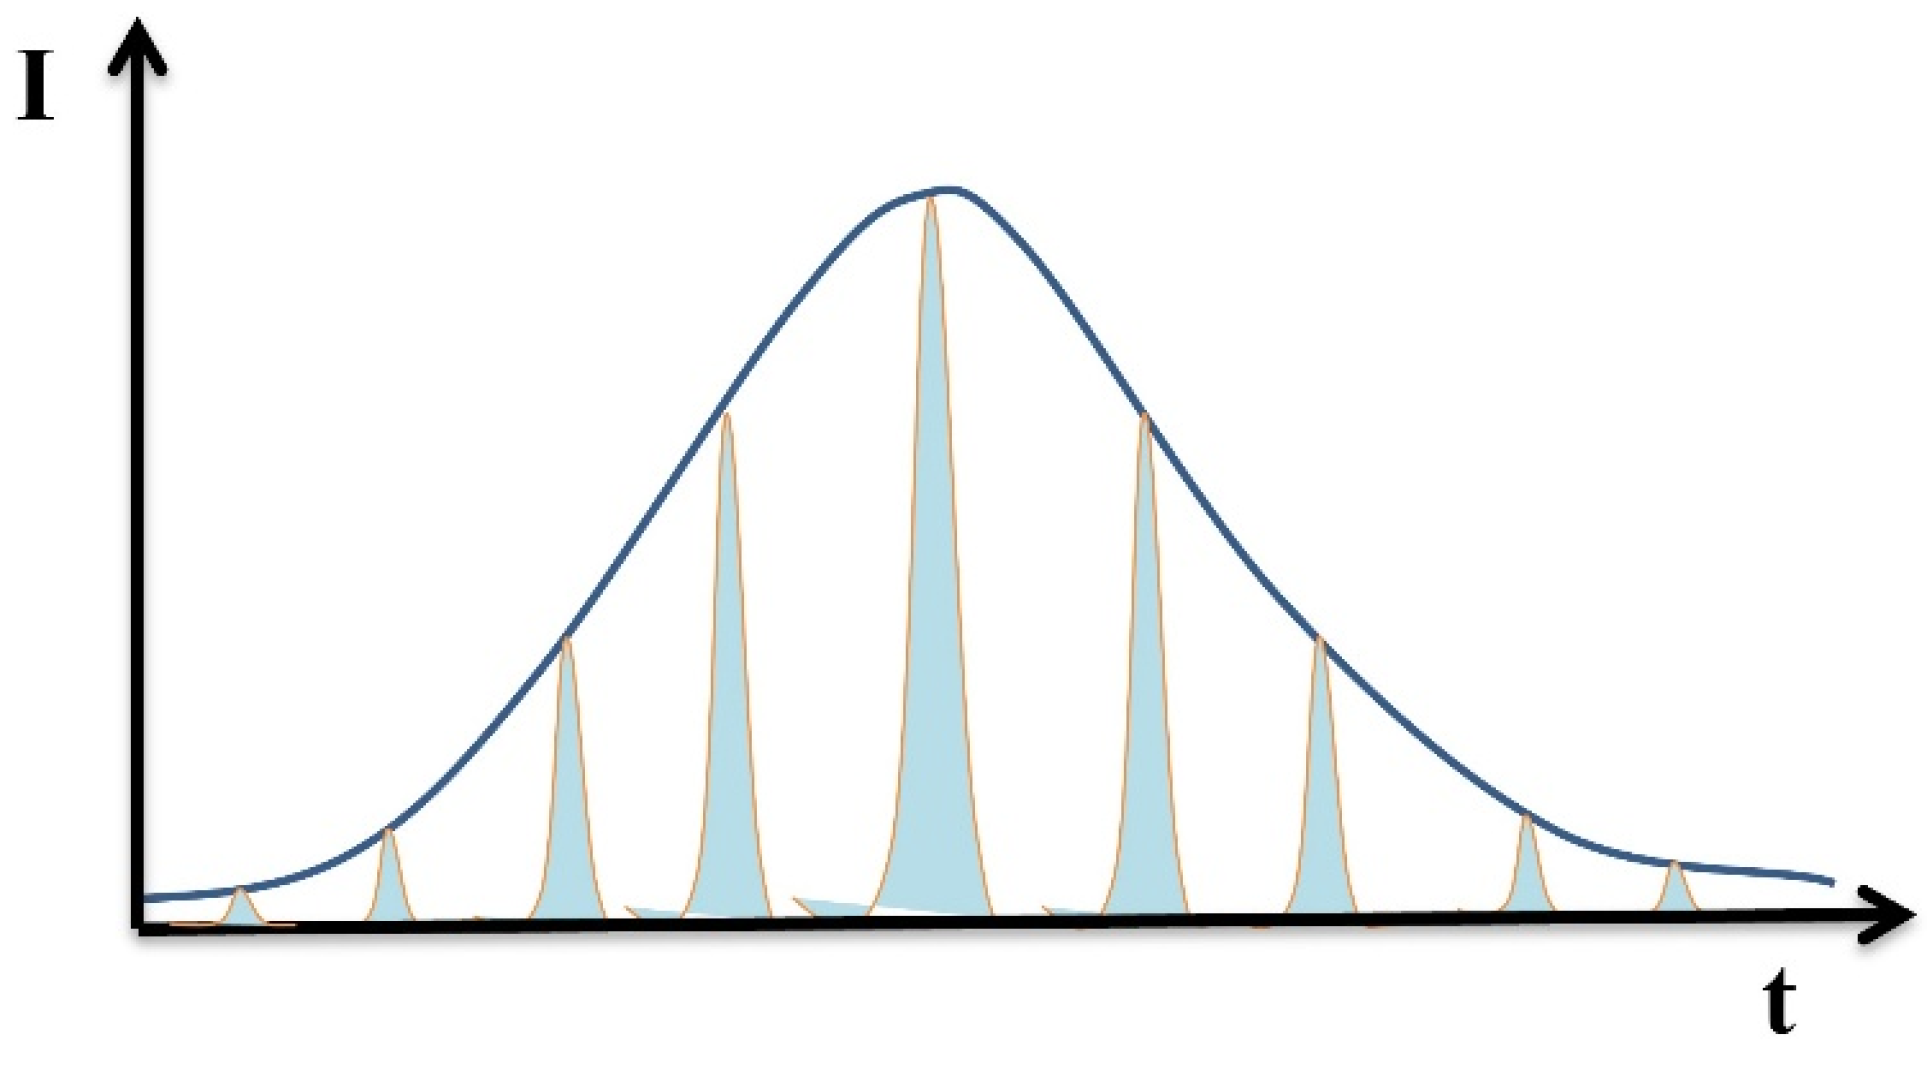
2 and
Aiymkul Markhabayeva
1,2
1
Institute of Applied Sciences & Information Technologies, Almaty 050042, Kazakhstan
2
Department of Solid State Physics and New Materials Technology, Al-Farabi Kazakh National University, Almaty 050040, Kazakhstan
3
Department of Materials Science, Engineering School, National Research Tomsk Polytechnic University, Tomsk 634050, Russia
*
Author to whom correspondence should be addressed.
Ceramics 2025, 8(3), 112; https://doi.org/10.3390/ceramics8030112
Submission received: 13 June 2025 / Revised: 28 August 2025 / Accepted: 28 August 2025 / Published: 5 September 2025

Abstract

(YxGd3−x)(AlyGa5−y)O12:Ce and (LuxGd3−x)(AlyGa5−y)O12:Ce ceramics were synthesized for the first time by direct exposure of a powerful electron flux to a mixture of the corresponding oxide components. Five-component ceramics were obtained from oxide powders of Y2O3, Lu2O3, Gd2O3, Al2O3, Ga2O3, and Ce2O3 in less than 1 s, without the use of any additional reagents or process stimulants. The average productivity of the synthesis process was approximately 5 g/s. The reaction yield, defined as the mass ratio of the synthesized ceramic to the initial mixture, ranged from 94% to 99%. The synthesized ceramics exhibit photoluminescence when excited by radiation in the 340–450 nm spectral range. The position of the luminescence bands depends on the specific composition, with the emission maxima located within the 525–560 nm range. It is suggested that under high radiation power density, the element exchange rate between the particles of the initial materials is governed by the formation of an ion–electron plasma.

1. Introduction

Luminescent materials have found wide applications in lighting [1], photonics [2], high-energy radiation detection [3], information recording, etc. [4]. These materials are often used under extreme energy loads and in aggressive environments. Therefore, metal oxides and fluorides are predominantly employed as the host matrices due to their high chemical and thermal stability. Considerable attention has been devoted to the study of energy transfer processes occurring in these materials under various excitation conditions [5]. Luminescent materials are typically complex in both composition and structure. The range of compositions continues to expand rapidly to meet the growing demand for diverse functional properties and applications. Multicomponent systems, comprising five or even six constituents, have already been proposed [6,7,8,9,10]. The optimization of synthesis processes for such multicomponent, high-entropy materials—based on refractory compounds such as metal oxides and fluorides—is a highly relevant and pressing challenge. Efficient host lattices such as Y3Al5O12 (YAG), Lu3Al5O12 (LuAG), and Gd3Al2Ga3O12 (GAGG) serve as excellent matrices for ion activators like Ce3+, Cr3+, Cr4+, and Eu2+. These systems are capable of effectively converting ultraviolet radiation into visible light. By varying the composition of the host matrix, introducing modifiers, and selecting appropriate activator ions, it is possible to tailor the emission spectrum to meet specific application requirements [11,12,13,14,15].
The main challenge in optimizing the synthesis of high-entropy refractory materials to enhance their functional properties lies in the complexity and labor-intensiveness of existing methods. In thermal synthesis, the significant differences in melting temperatures of the precursor components require multiple sintering and annealing steps to obtain the desired phase composition [16]. To enhance the efficiency of elemental diffusion between components in the initial mixture, solid-phase reactions are often converted into liquid- phase reactions through the addition of auxiliary substances with lower melting points. Alternative approaches such as sol–gel synthesis [17], co-precipitation, combustion synthesis [18], and solution combustion synthesis (SCS) [19] involve the use of such additional reagents, which are often difficult to completely remove from the final product. For the first time, the feasibility of synthesizing ceramics via radiation-induced methods was demonstrated in [20,21]. Subsequent studies [22,23,24] showed the possibility of rapid (within 1 s) synthesis of oxide-based ceramics by direct exposure of stoichiometric mixtures to high-energy electron beams, achieving efficiencies of up to 90–97%. This process does not require additional reagents or external thermal input, making it a highly energy-efficient method. Radiation synthesis has been successfully applied to luminescent ceramics based on relatively simple binary systems such as YAG, spinel, and tungstates. However, a key open question remains: is radiation-induced synthesis applicable to multicomponent high-entropy systems, which are known to exhibit superior functional characteristics? Specifically, can the elemental exchange between simple oxide particles be effectively realized within the short timescale of radiation exposure to form complex high-entropy phases?
The present study aims to investigate the feasibility of ceramic synthesis based on multicomponent compositions of the type (YxGd3−x)(AlyGa5−y)O12:Ce and (LuxGd3−x)(AlyGa5−y)O12:Ce, which are considered promising for practical applications. The complex crystal lattice of these materials enables the incorporation of a sufficient amount of desired activator ions. The high rate and efficiency of radiation-assisted synthesis offer opportunities for optimizing the fabrication process and identifying advanced material compositions.

2. Materials and Methods

Ceramic Synthesis

To investigate the feasibility of radiation-induced synthesis of high-entropy ceramics, we selected materials composed of the following groups of oxides: Y, Lu, Gd, Al, and Ga. The elements within these groups differ in their preferential occupancy of sites in the garnet crystal lattice. Among the many possible compositional variants, we chose those that, in our view, could provide insight into the relationship between chemical composition and luminescent properties. The selected oxides included Y2O3, Lu2O3, Gd2O3, Al2O3, and Ga2O3. For the synthesis, powder mixtures of the selected oxides were prepared in stoichiometric ratios. To activate luminescence, Ce2O3 was added in an amount corresponding to 0.5 wt.% of the total mixture. All initial powders were supplied by Hebei Suoyi New Material Technology Co., Ltd. (Handan, China). The compositions of the prepared mixtures are listed in Table 1. The sample numbers in the table correspond to the internal numbering system adopted by the authors.

3. Results

The efficiency of radiation synthesis depends on the dispersity of the initial powders used [25]. In this study, the particle size distribution of the initial powders was analyzed by laser diffraction using a Shimadzu SALD-7101 laser particle size analyzer (Kyoto, Japan). The results of the dispersity measurements, conducted in the 0.01–50 μm range, are presented in Figure 1.
The obtained results demonstrate that all the initial powders contain two distinct groups of particles: fine particles with sizes ranging from 10 to 500 nm, and coarse particles ranging from 1 to 40 µm. It should be noted that fine particles are significantly more numerous than coarse ones in all samples. However, in terms of volume (or mass), coarse particles predominate. As a result, the outcome of the synthesis is primarily governed by the larger particles. Accordingly, particle size distribution is provided based on particle volume.
Ceramics with the composition (Y, Gd, Lu)3 (Al, Ga)5O12:Ce were synthesized using a high-energy electron beam with an energy of 1.4 MeV, generated by the ELV-6 accelerator at the UNU facility of the Institute of Nuclear Physics, Siberian Branch of the Russian Academy of Sciences (INPh SB RAS). The ratios of Y, Gd, and Lu, as well as Al and Ga in the matrix, were varied to obtain different compositions. The electron beam was introduced into the open atmosphere through a differential pumping system and had a Gaussian spatial distribution. In our experiments, the output beam diameter on the target was approximately 1 cm. Depending on the experimental objectives, ceramic synthesis was carried out in two modes: “without scanning” and “with scanning”. In the without scanning mode, a crucible with dimensions of 10 × 5 cm2, filled with the initial powder mixture, was translated under the stationary beam at a speed of 1 cm/s. As a result, a continuous ceramic strip was formed along the length of the crucible. To obtain larger-area samples, the scanning mode was employed. In this configuration, the electron beam was scanned transversely across the 5 cm width of the crucible at a frequency of 50 Hz, while the crucible was simultaneously moved longitudinally at a speed of 1 cm/s. This method yielded ceramic plates with surface dimensions corresponding to the full area of the crucible. In both modes, the total irradiation time per surface area was 10 s. The resulting synthesis outcome was governed by the radiation dose, i.e., the energy flux delivered to the material. To ensure comparable energy transfer to the mixture in both modes, the power density in the without scanning mode was deliberately set to be five times lower than in the with scanning mode, compensating for the absence of beam movement. Ceramic formation was achieved solely through the energy input from the radiation flux, utilizing only the initial powder mixture without any sintering aids or additional components to facilitate the synthesis process.
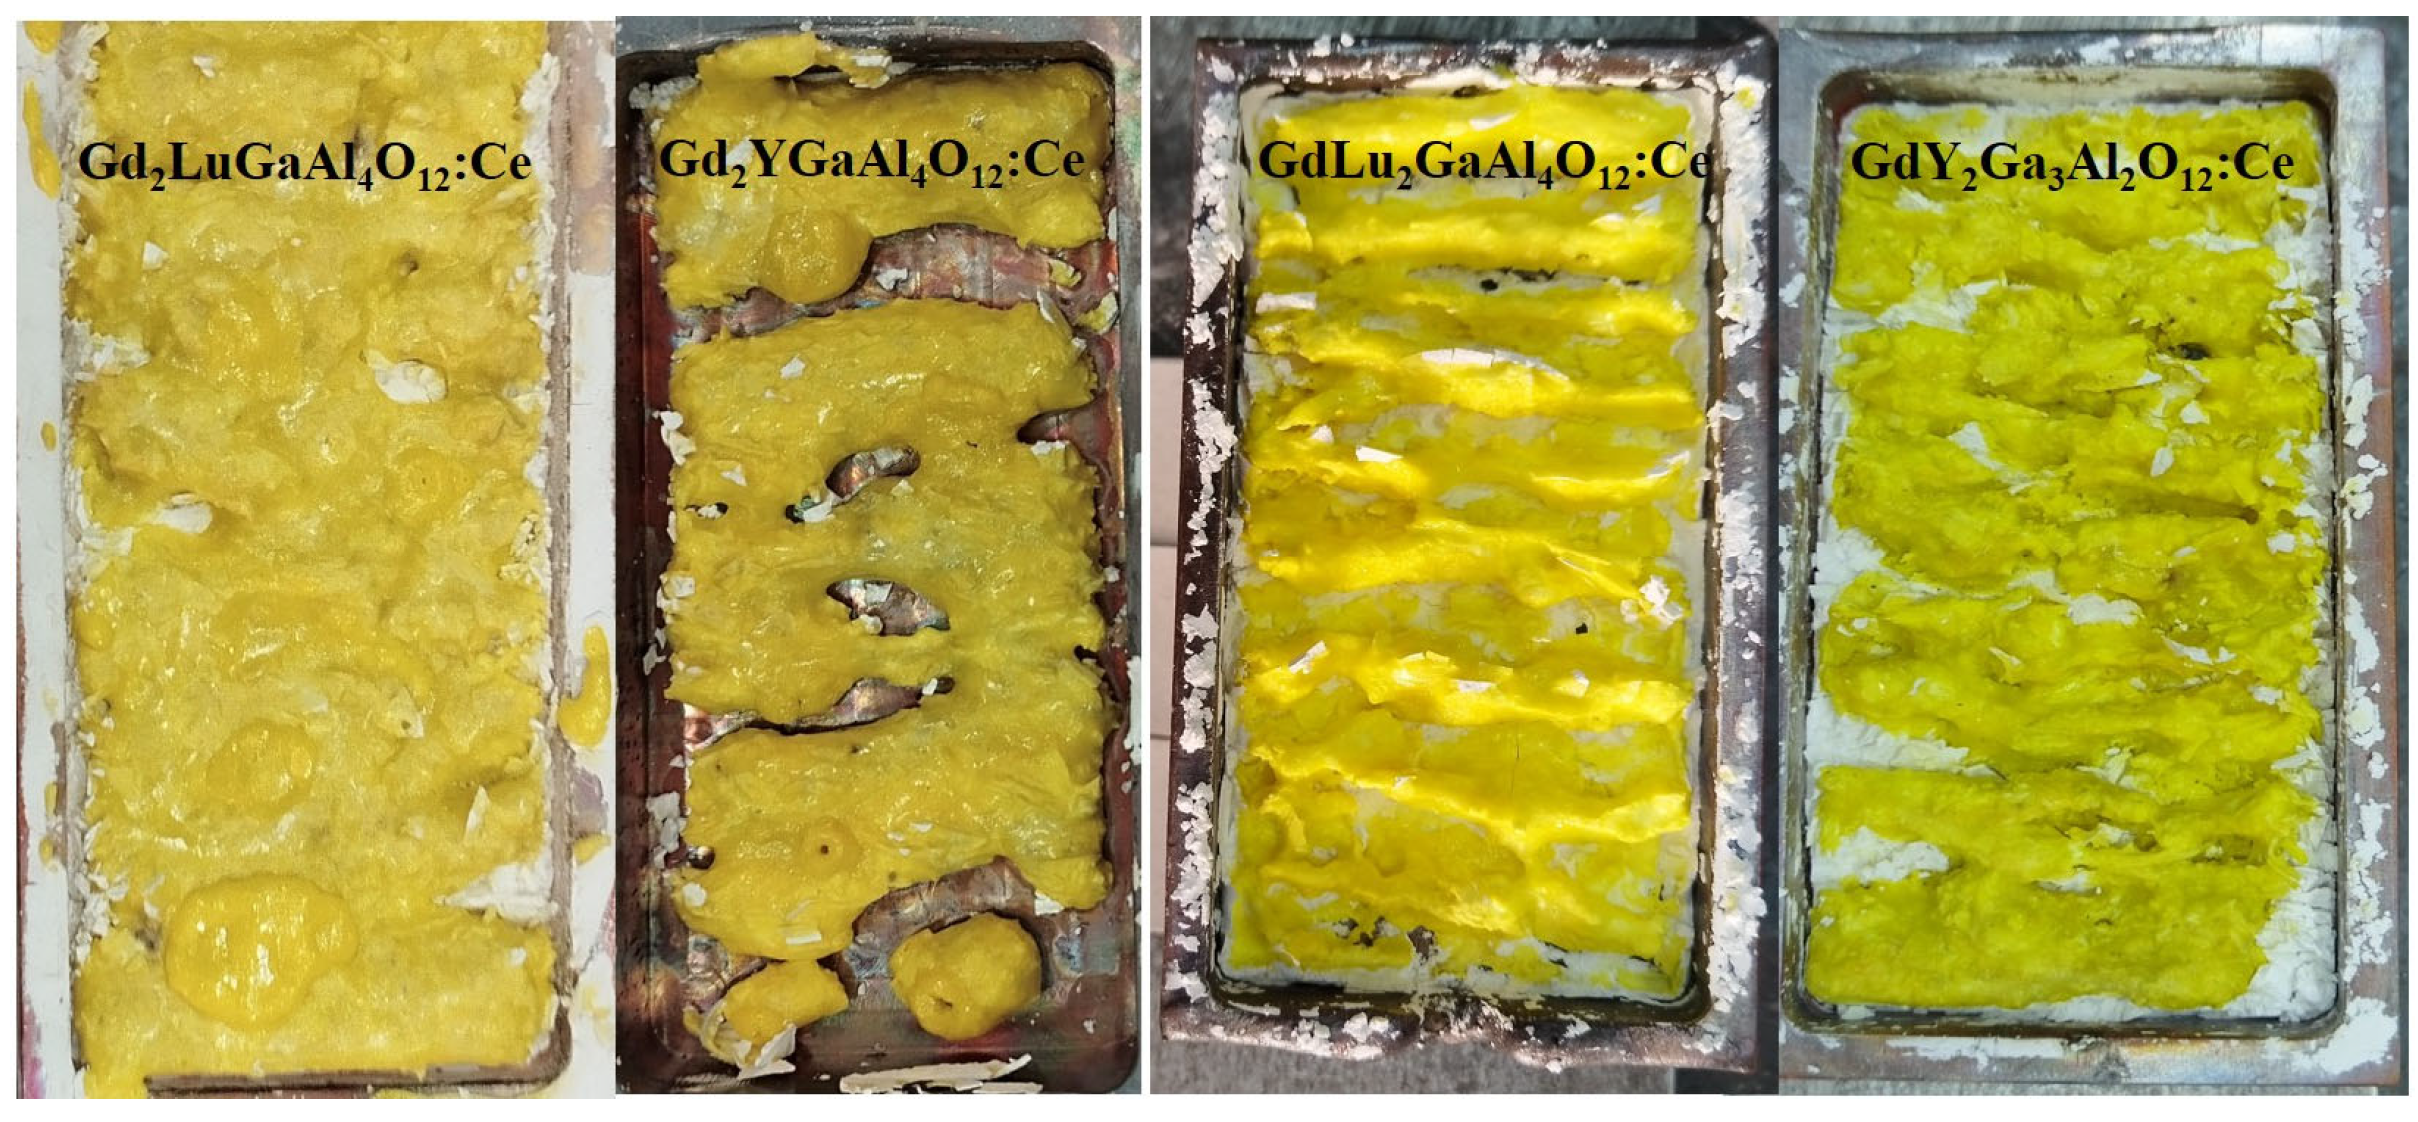
The results of the synthesis are presented in Figure 2 as photographs of the samples, which have dimensions of up to 50 × 100 mm2. All samples are plate-shaped with a thickness of 3–4 mm, exhibit internal porosity, and have a mass ranging from 35 to 60 g.
The synthesis yield, the ratio of the obtained sample mass to the initial mixture mass, as well as the synthesis conditions and the power density of the electron beam, are presented in Table 1. As seen from the table, the ceramics synthesized under the selected initial compositions and processing modes demonstrate a high yield. The high efficiency of radiation-induced synthesis indicates that the optimal particle size range for the initial mixtures lies between 1 and 10 μm.
The efficiency of radiation-induced synthesis is inherently dependent on the power density of the electron flux during processing, as demonstrated in [22,23]. It is evident that there exists a threshold power density below which synthesis does not occur. Determining this threshold is crucial not only for optimizing processing parameters but also for gaining insight into the fundamental mechanisms taking place within the mixture of initial powders that ultimately lead to ceramic formation. Evaluating synthesis thresholds may help elucidate the respective roles of thermal and ionization processes in the development of the ceramic microstructure.
We investigated the dependence of synthesis efficiency on power density for two high-entropy ceramic compositions—GdLu2Ga3Al2O12:Ce, GdLu2Ga2Al3O12:Ce—as well as for the ternary composition Gd3Al5O12:Ce. The two high-entropy mixtures differed in their Ga/Al ratios, while the third composition lacked both Lu and Ga. All samples contained the same Ce2O3 concentration of 0.5%. Synthesis was performed in the “without scanning” mode [22,23], in which the crucible containing the mixture was translated relative to the stationary electron beam over a 10-s exposure.
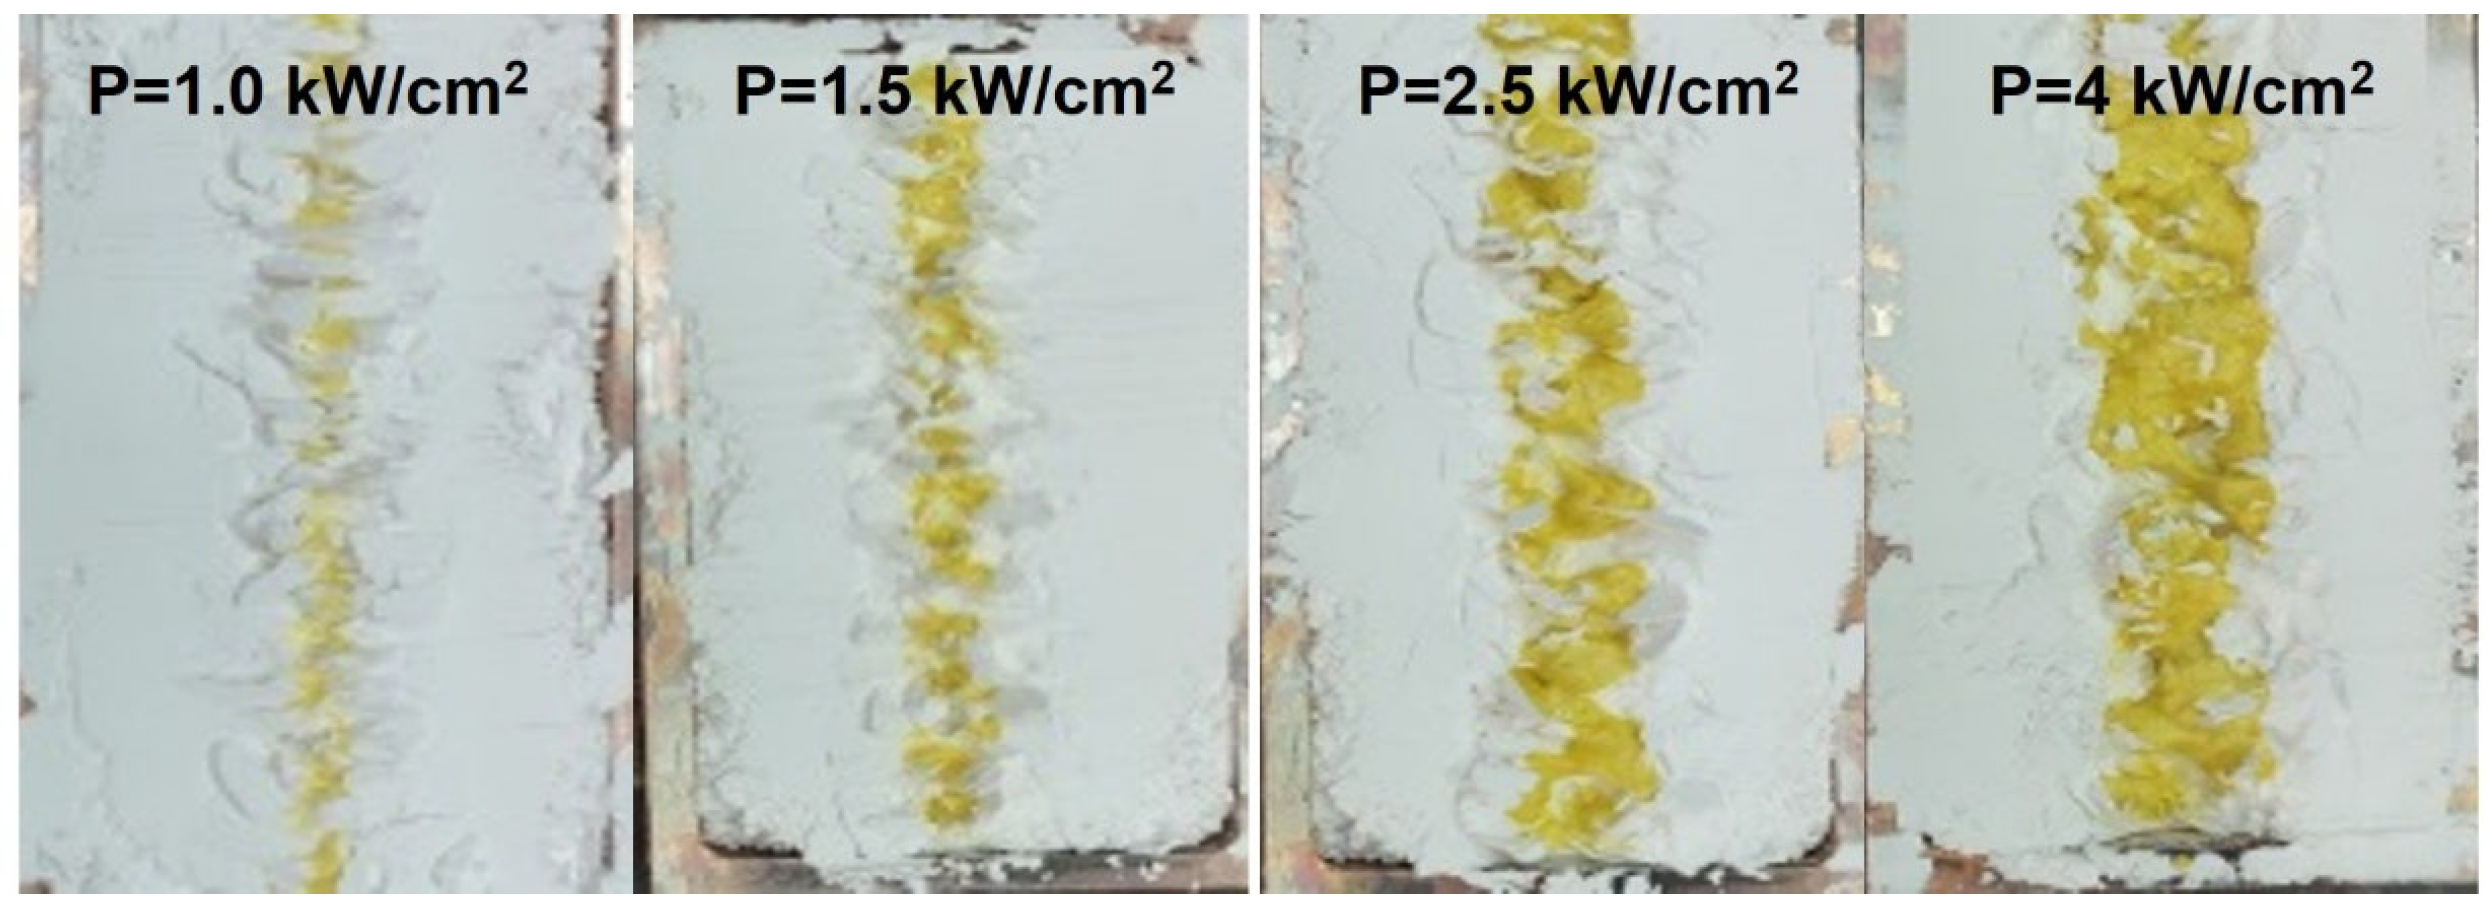
The experimental procedure was as follows. A crucible containing the mixture was placed under an electron beam with an energy of 1.4 MeV at a specified power density. As a result of the irradiation, ceramic strips were synthesized along the length of the crucible. The synthesized ceramic material was then removed, and the crucible was refilled with a fresh mixture. The irradiation process was repeated with a different power density of the electron beam. Representative photographs of the crucibles with the resulting ceramic samples obtained under various treatment conditions are presented in Figure 3. It is clearly observed that increasing the power density leads to an increase in both the width and depth of the synthesized ceramic structure.
The synthesis efficiency under such processing conditions is most appropriately evaluated by the mass of the resulting sample obtained under specified radiation exposure parameters. The dependencies of the synthesis efficiency on the radiation flux power density for high-entropy ceramics GdLu2Ga3Al2O12:Ce, GdLu2Ga2Al3O12:Ce, as well as for the ternary compound Gd3Al5O12:Ce, are presented in Table 2 and Figure 4.
As demonstrated by the obtained results, synthesis occurs only when the radiation processing power density exceeds 0.5 kW/cm2. At a power density of P = 1.0 kW/cm2, a distinct strip of formed ceramic material becomes clearly visible on the surface of the powder mixture. This ceramic strip consists of a chain of separate ceramic fragments, each approximately 3–5 mm in size. As the power density increases further, the strip transforms into a continuous body and can be extracted from the mixture as a solid rod. Both the depth and width of the synthesized sample increase proportionally with the power density. This behavior can be attributed to the non-uniform distribution of energy losses within the volume of the synthesized material. As the power density increases, the volume of material in which the electron beam energy loss exceeds the threshold required for synthesis also increases. It should be noted that the initial materials used for the ceramics’ synthesis have close melting temperatures: Al2O3 (2044 °C), Y2O3 (2410 °C), Ga2O3 (1725 °C), Lu2O3 (2490 °C), Gd2O3 (2420 °C), and Ce2O3 (2177 °C).
In the studies described above, the power density was defined as the average energy flux, Pc, calculated as the ratio of the total beam power to the irradiated surface area. The actual distribution of the beam energy on the surface has a Gaussian shape (Figure 5).
The power density is maximum along the beam axis and decreases according to the Gaussian law with distance from the center. Let us call the actual power density on an elementary section of the beam cross-section on the surface of the mixture the specific power density PL. Thus, the average power density Pc is equal to the integral of the specific power density PL over the entire beam cross-section. The maximum value of the specific power density PL is proportional to the average power density Pc. Therefore, the dependence of the synthesis efficiency on the average power density, Pc, can be correctly used for a qualitative analysis of the synthesis results. The beam diameter is understood as its width, at the boundaries of which the intensity is “e” times lower than the maximum. In our experiments, the beam width is 12 mm, and the beam area is 110 mm2.
Obviously, the ceramics realization process formation under the radiation effect of synthesis is possible when the threshold power density Pf is exceeded. With decreasing average power density Pc, the synthesis will be realized as long as PL exceeds Pf—the bandwidth of synthesized ceramics in the “without scanning” mode—decreases. This effect is shown in Figure 5.

3.1. Ceramic Luminescence

Photoluminescence (PL) and excitation spectra were recorded using a Cary Eclipse Spectrofluorimeter (Agilent). Based on preliminary investigations and available literature, it was established that all cerium-activated ceramics synthesized via radiation-induced processes exhibit broad-band luminescence with an emission maximum centered at 555 nm. Consequently, excitation spectra corresponding to the 555 nm emission were measured for all synthesized ceramic samples, as shown in Figure 6.
Luminescence is observed upon excitation in the spectral ranges of 320–360 nm and 400–500 nm for all samples. The excitation bands exhibit maxima at 340–350 nm and 430–480 nm. The luminescence intensity under excitation in the short-wavelength region is several times lower than that in the long-wavelength region. Both the positions and the shapes of the excitation bands vary depending on the composition of the samples. Two excitation bands at λex = 460 and 340 nm are due to the transitions 4F5/2→5D0, 5D1 of the Ce3+ ion; some shift is due to the influence of the local matrix structure on the energy structure of the luminescence center. The luminescence is also excited by radiation with λex ≤ 230 nm.
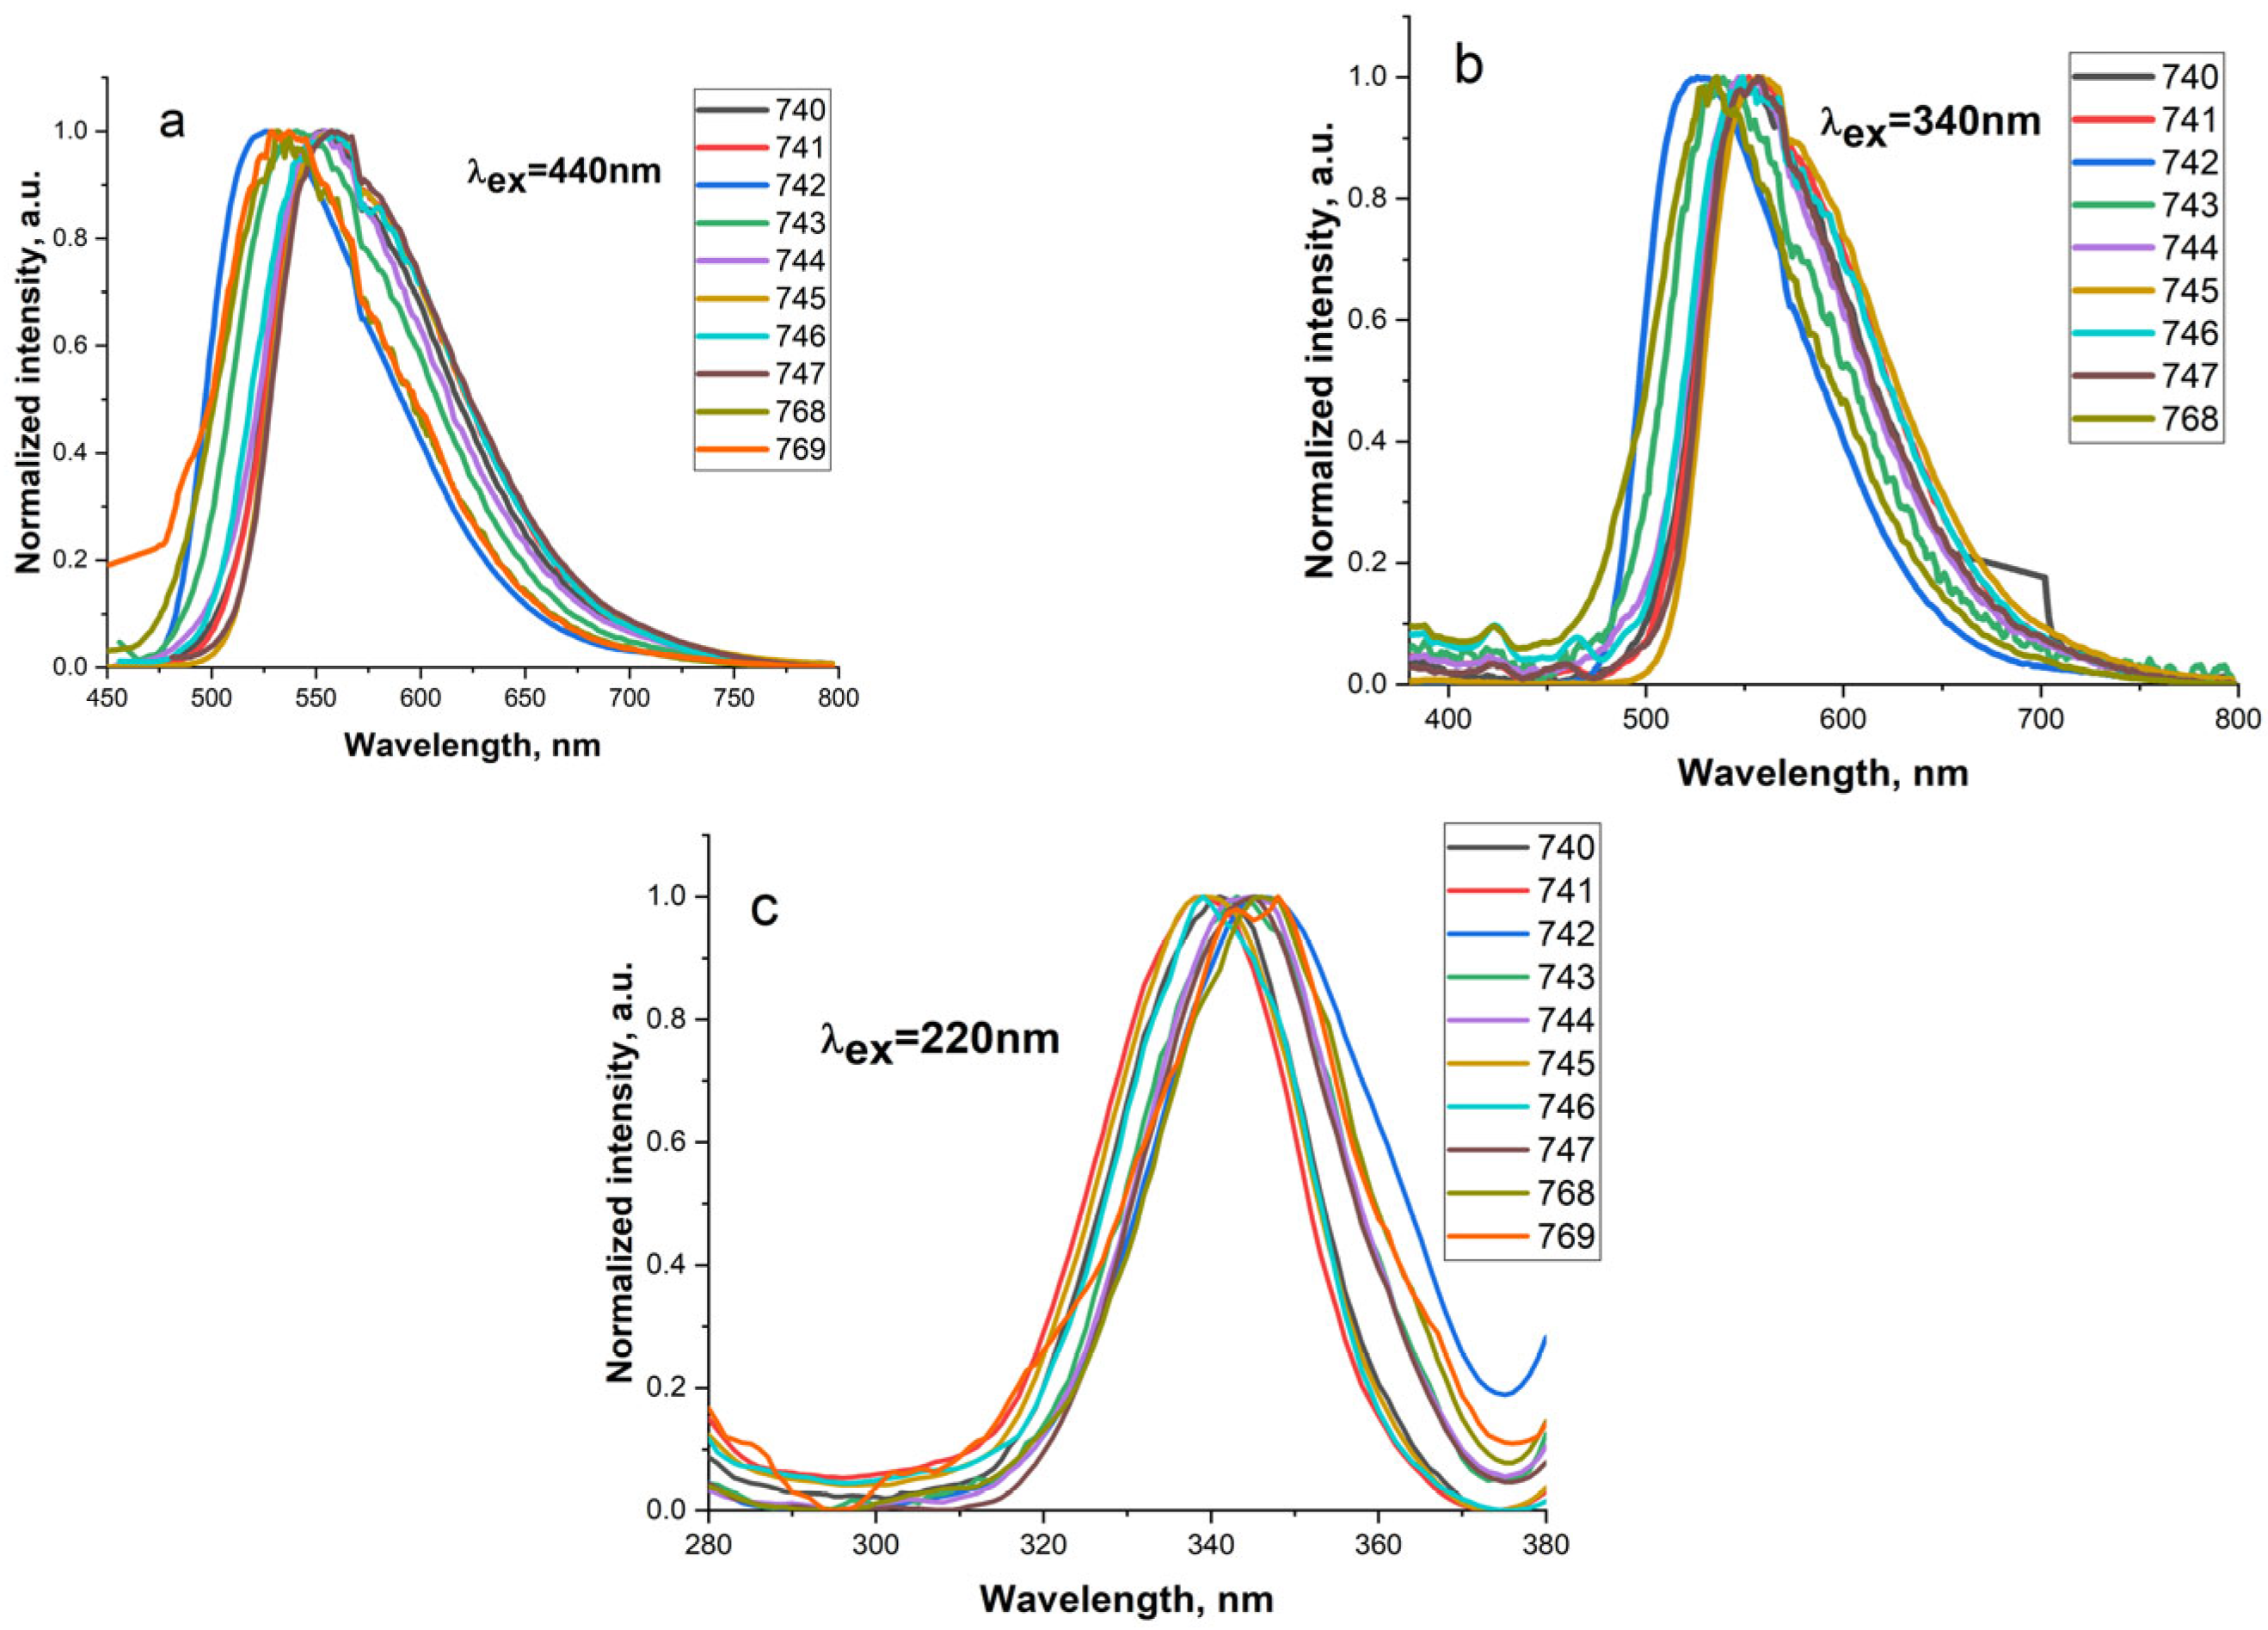
Figure 7 shows the luminescence spectra of the samples under excitation in the 420–445, 340–345, and 220 nm regions.
From the results of the luminescence spectra of the samples of different compositions presented in Figure 7 and Table 3, it can be seen that the positions of the bands under excitation in the region of 420–445, 340–345, and 220 nm are close. The luminescence in sample N766 under excitation at λex = 460 nm and in samples N766 and N769 under excitation at λex = 340 nm have low intensity. The luminescence spectral characteristics of the ceramics synthesized under radiation exposure are generally consistent with those reported for samples obtained by conventional thermal synthesis [26,27].
The primary potential application of the investigated materials lies in the conversion of ultraviolet and ionizing (hard) radiation into visible light, particularly for use in LED technologies. Quantitative evaluations of conversion efficiency were performed by measuring the brightness of luminescence under excitation by radiation of a chip with λ = 450 nm. Brightness is defined as the radiant flux emitted from a unit area of the emitting surface into a unit solid angle. The luminescence brightness of a phosphor depends on the excitation conditions and the measurement geometry. However, if the relative positions of the excitation source, sample, and brightness detector remain fixed, and the excitation parameters are kept constant, it becomes possible to compare the relative brightness across a series of samples.
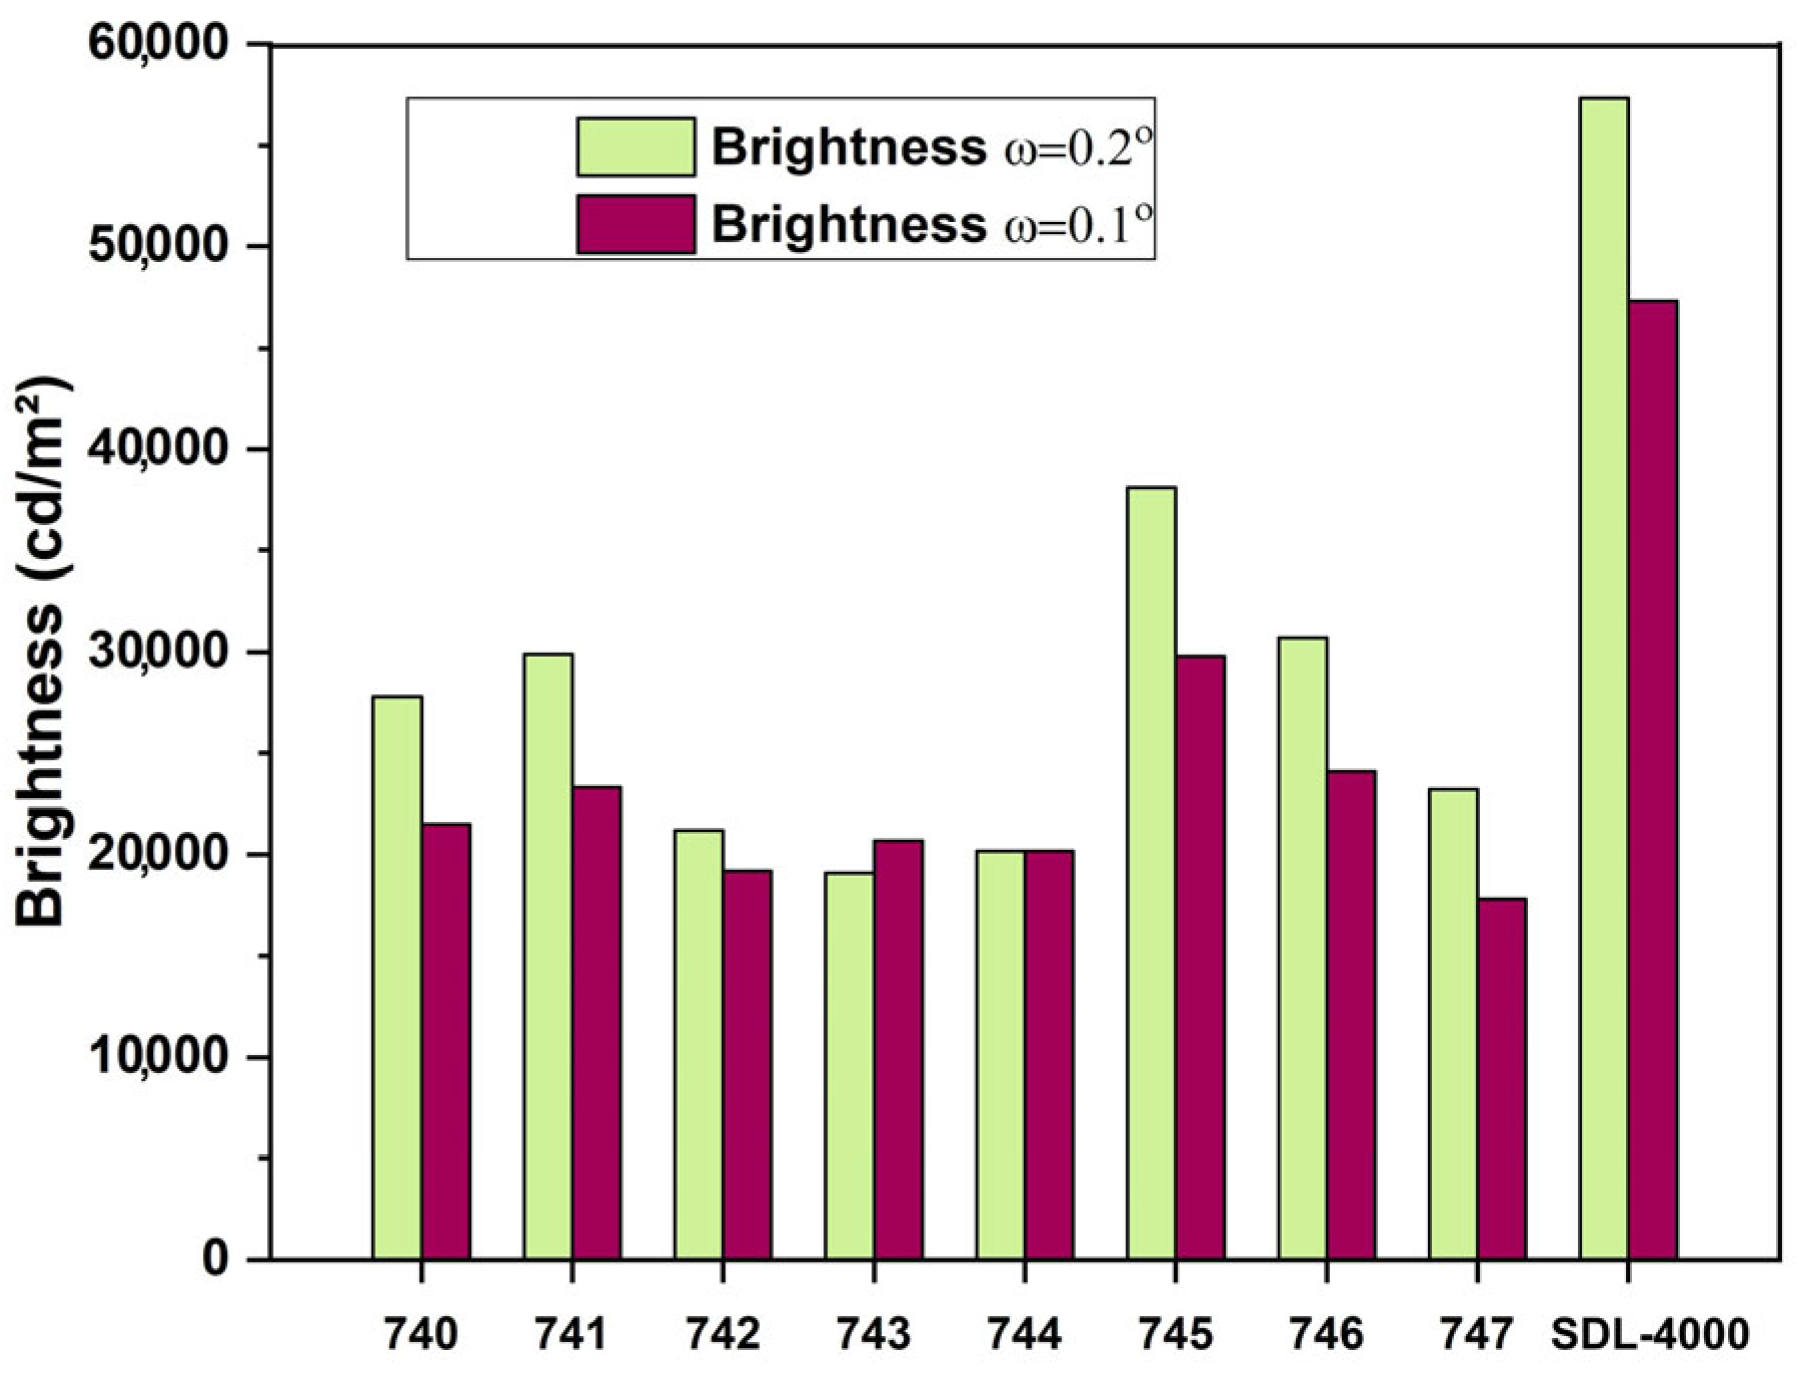
To measure relative brightness values, a custom setup was developed based on a CS-200 luminance meter, with a fixed spatial arrangement of all components. Ceramic samples in powdered form were placed into cuvettes, which were securely mounted in the measurement chamber using a sample holder. The brightness measurements were carried out with periodic calibration against the reference phosphor SDL-4000 (NPO PLATAN), which served as a standard. Measurements were performed at two solid angles, ω = 0.2° and ω = 1.0°, corresponding to luminescence areas of approximately S ≈ 1 mm2 and S ≈ 17 mm2, respectively. The measured brightness values for both the ceramic samples and the reference are presented in Table 4 and illustrated in histogram form in Figure 8. The table also includes the chromaticity coordinates of the sample luminescence in the CIE color diagram.
As follows from the presented results, the luminance of the synthesized samples lies within the range of 20,000–30,000 cd/m2. Some variability in luminance measurements at different solid angles can be attributed to the use of a narrowly focused excitation beam. Nevertheless, this variation does not significantly affect the overall trend of the observed dependence. The highest luminance was recorded for the Gd2LuGaAl4O12:Ce sample, reaching approximately 63% of the brightness level of the industrial reference standard. This outcome is considered highly promising, especially given that it represents the first sample obtained via the radiation synthesis method. It is noteworthy that the luminance of the earliest commercially produced LEDs did not exceed this level. Further improvement in the optical performance is expected through optimization of the synthesis procedure—specifically, by selecting suitable precursor materials, fine-tuning the radiation processing parameters, and applying post-synthesis treatments such as annealing.

3.2. X-Ray Diffraction of the Ceramics

The ceramic structure was examined using a Rigaku MiniFlex 600 diffractometer. The diffraction patterns of the samples are presented in Figure 9. The analysis confirmed the presence of a single LuAG and GAG phase, indicating a garnet-type crystal structure for each composition. Nevertheless, most of the samples were found to be polyphasic. All diffraction peaks observed in the studied ceramics match the reference data from the corresponding crystallographic database. For qualitative phase analysis and reliable diffraction pattern indexing, the ICDD database (PDF-2 Release 2016 RDB) was employed, with specific reference to PDF Card No.: 00-063-0291 “Yttrium Gadolinium Aluminum Garnet (Y2GdAl5O12)”, PDF Card No.: 01-075-0555, and PDF Card No.: 01-075-2852, which ensured the accuracy of phase identification. A shift of certain diffraction peaks toward either higher or lower diffraction angles was detected in some samples, which can be attributed to variations in the ionic radii of the constituent elements.
The calculated crystallinity for the main phases in all cases exceeds 97%, reaching 100% for several compositions, which confirms the efficiency of the synthesis route and the stability of the garnet phase under the applied processing conditions.
The lattice parameters of the primary garnet phases vary within the range of approximately 12.02–12.20 Å, reflecting compositional differences due to cation substitution by Gd3+, Y3+, Lu3+, Ga3+, and Al3+. Corresponding unit cell volumes range from ~1738 to ~1815 Å3, with densities spanning from about 5.0 to 6.5 g/cm3 depending on the ionic radii and mass of the substituents. Average crystallite sizes are in the submicrometer domain, typically between 800 and 1250 Å.

4. Discussion

(YxGd3−x)(AlyGa5−y)O12:Ce and (LuxGd3−x)(AlyGa5−y)O12:Ce ceramics were synthesized for the first time via direct exposure of a precursor mixture to a high-energy electron beam. The syntheses of these five-component ceramics from oxide powders of Y2O3, Lu2O3, Gd2O3, Al2O3, Ga2O3, and C2O3 were achieved in under 1 s, without the addition of any auxiliary reagents, at an average yield rate of approximately 5 g/s. The conversion efficiency, defined as the mass ratio of the obtained ceramic to the initial powder mixture, was found to be 94–99%. The efficiency of ceramic synthesis does not depend on radiation treatment modes.
The synthesized ceramics exhibited luminescence under excitation at wavelengths of 220, 340, and 450 nm. The position of the luminescence bands, ranging from 525 to 560 nm, was found to vary with the material composition. In general, the spectral properties of the ceramics produced via radiation synthesis were comparable to those reported for materials fabricated by conventional techniques [28,29,30].
These findings demonstrate the feasibility of synthesizing complex oxide ceramics using a radiation-based method, with key advantages such as high speed, process efficiency, simplicity, elimination of additional reagents, and the potential for compositional optimization.
During the radiation-induced synthesis, an extremely efficient exchange of elements between the particles of the five components of the mixture is realized. It is postulated that ionization processes play a critical role in the formation of the ceramic phase. Useful information on the rate of exchange processes can be obtained from studies of synthesis in the “with scanning” mode. In this mode, each elementary section of the mixture is exposed to a series of pulses of scanning electron flux with a frequency of 50 Hz. The pulse intensity increases as the beam approaches a given point and decreases as it moves away due to crucible displacement. A schematic representation of the pulse sequence for an individual segment of the mixture is shown in Figure 10.
At a crucible displacement rate of 1 cm/s, a beam diameter of 1 cm, and a scanning frequency of 50 Hz, each elementary section of the mixture is exposed to radiation 100 times. The beam has a Gaussian shape; hence, the magnitude of the radiation flux acting on the elementary section increases, reaches a maximum, and then decreases in accordance with the Gaussian distribution. At a scanning amplitude of 5 cm, each section is irradiated by pulses with a duration of 2 ms and a repetition period of 10 ms, resulting in 100 exposures per cycle.
A high rate of element exchange is possible in an ion–electron plasma. It is known that relaxation times have a value of about 1–10 μs [31]. It may be assumed that, under conditions of high excitation density in dielectric powders, large concentrations of highly reactive radicals are formed. These radicals can facilitate the formation of new phases corresponding to a predefined stoichiometric composition.

5. Conclusions

Radiation-stimulated processes, including ionization, relaxation of electronic excitations, and their conversion into structural defects (such as radical formation), are completed within less than 10−9 s. Subsequent processes associated with the relaxation of radiation-induced defects and radical transformations, leading to the formation of new spatial structures, also occur on the timescale of ~10−9 s [31,32]. Relaxation of electronic excitations, primary structural radiation defects, and their transformation into stable forms for the creation of new structural phases are accompanied by energy transfer to the substance, heating. Heating from the region of radiation exposure during synthesis is transferred to the entire volume of the substance. The velocity of the thermal front induced by a short energy pulse is governed by the thermal conductivity, heat capacity, and density of the material. In dielectric powder materials, the thermal front propagates over a distance of approximately 0.3 mm within 1 s—nearly an order of magnitude slower than in metals and several times slower than in crystalline dielectrics. Therefore, it is unlikely that heating of the irradiated regions will significantly affect phase transformations in regions not yet exposed to radiation. As a result, heat-stimulated diffusion processes involving elemental exchange during radiation treatment are improbable.

Author Contributions

Conceptualization, V.L. and A.T.; methodology, V.L. and A.T.; software, A.M.; validation, R.N., A.M. and G.N.; formal analysis, A.T.; investigation, V.L. and A.T.; resources, A.T.; data curation, A.T.; writing—original draft preparation, V.L. and A.T.; writing—review and editing, A.T.; visualization, R.N.; supervision, V.L. and A.T.; project administration, V.L. and A.T.; funding acquisition, A.T. All authors have read and agreed to the published version of the manuscript.

Funding

This research was funded by the Science Committee of the Ministry of Science and Higher Education of the Republic of Kazakhstan (Grant No. AP 19577213). This research was funded by the Russian Science Foundation of the Russian Federation. (Grant No. 23-73-00108).

Informed Consent Statement

Not applicable.

Data Availability Statement

The data presented in this study are available on request from the corresponding author.

Acknowledgments

We acknowledge the Budker Institute of Nuclear Physics, Siberian Branch of the Russian Academy of Sciences, and the professors of Tomsk Polytechnic University (TPU) for the provision of experimental facilities.

Conflicts of Interest

The authors declare that they have no known competing financial interests or personal relationships that could have appeared to influence the work reported in this paper.

References

  1. Wu, J.L.; Gundiah, G.; Cheetham, A. Structure–Property Correlations in Ce-Doped Garnet Phosphors for Use in Solid State Lighting. Chem. Phys. Lett. 2007, 441, 250–254. [Google Scholar] [CrossRef]
  2. Xia, Z.; Meijerink, A. Ce3+-doped garnet phosphors: Composition modification, luminescence properties and applications. Chem. Soc. Rev. 2017, 46, 275–299. [Google Scholar] [CrossRef] [PubMed]
  3. Zhu, D.; Nikl, M.; Chewpraditkul, W.; Li, J. Development and prospects of garnet ceramic scintillators: A review. J. Adv. Ceram. 2022, 11, 1825–1848. [Google Scholar] [CrossRef]
  4. Eeckhout, K.V.D.; Poelman, D.; Smet, P.F. Persistent Luminescence in Non-Eu2+-Doped Compounds: A Review. Materials 2013, 6, 2789–2818. [Google Scholar] [CrossRef]
  5. Ueda, J.; Tanabe, S. (INVITED) Review of luminescent properties of Ce3+-doped garnet phosphors: New insight into the effect of crystal and electronic structure. Opt. Mater. X 2019, 1, 100018. [Google Scholar] [CrossRef]
  6. Kamada, K.; Endo, T.; Tsutumi, K.; Yanagida, T.; Fujimoto, Y.; Fukabori, A.; Yoshikawa, A.; Pejchal, J.; Nikl, M. Composition Engineering in Cerium-Doped (Lu,Gd)3(Ga,Al)5O12 Single-Crystal Scintillators. Cryst. Growth Des. 2011, 11, 4484–4490. [Google Scholar] [CrossRef]
  7. Kamada, K.; Yanagida, T.; Pejchal, J.; Nikl, M.; Endo, T.; Tsutumi, K.; Fujimoto, Y.; Fukabori, A.; Yoshikawa, A. Scintillator-oriented combinatorial search in Ce-doped (Y,Gd)3(Ga,Al)5O12 multicomponent garnet compounds. J. Phys. D Appl. Phys. 2011, 44, 505104. [Google Scholar] [CrossRef]
  8. Bartosiewicz, K.; Babin, V.; Kamada, K.; Yoshikawa, A.; Kurosawa, S.; Beitlerova, A.; Kucerkova, R.; Nikl, M.; Zorenko, Y. Ga for Al substitution effects on the garnet phase stability and luminescence properties of Gd3GaxAl5-xO12:Ce single crystals. J. Lumin. 2019, 216, 116724. [Google Scholar] [CrossRef]
  9. Peng, G.; Zou, Z.; Li, J.; Liao, J.; Wen, H. (Gd1-xTbx)3(Al1-yGay)5O12 green phosphors with high quantum yield and low thermal quenching via modulation the Ga3+ admixture. J. Lumin. 2021, 236, 118066. [Google Scholar] [CrossRef]
  10. Ermakova, L.V.; Smyslova, V.G.; Dubov, V.V.; Kuznetsova, D.E.; Malozovskaya, M.S.; Saifutyarov, R.R.; Karpyuk, P.V.; Sokolov, P.S.; Komendo, I.Y.; Bondarau, A.G.; et al. Effect of a Phosphorus Additive on Luminescent and Scintillation Properties of Ceramics GYAGG:Ce. Ceramics 2023, 6, 1478–1489. [Google Scholar] [CrossRef]
  11. Zorenko, T.; Gorbenko, V.; Witkiewicz-Lukaszek, S.; Zorenko, Y. Luminescent properties of (La,Lu,Gd)3(Al,Sc,Ga)5O12:Ce mixed garnets under synchrotron radiation excitation. J. Lumin. 2018, 199, 483–487. [Google Scholar] [CrossRef]
  12. Fasoli, M.; Vedda, A.; Nikl, M.; Jiang, C.; Uberuaga, B.P.; Andersson, D.A.; McClellan, K.J.; Stanek, C.R. Band-gap engineering for removing shallow traps in rare-earth Lu3Al5O12 garnet scintillators using Ga3+ doping. Phys. Rev. B Condens. Matter. 2011, 84, 081102. [Google Scholar] [CrossRef]
  13. Khanin, V.; Venevtsev, I.; Chernenko, K.; Pankratov, V.; Klementiev, K.; van Swieten, T.; van Bunningen, A.J.; Vrubel, I.; Shendrik, R.; Ronda, C.; et al. Exciton interaction with Ce3+ and Ce4+ ions in (LuGd)3(Ga,Al)5O12 ceramics. J. Lumin. 2021, 237, 118150. [Google Scholar] [CrossRef]
  14. Ding, S.; Ren, H.; Zou, Y.; Liu, W.; Zhang, Q. Single crystal growth and property investigation of Dy3+ and Tb3+ co-doped Gd3Sc2Al3O12 (GSAG): Multiple applications for GaN blue LD pumped all-solid-state yellow lasers and UV or blue light chip excited solid-state lighting. J. Mater. Chem. C 2021, 9, 9532–9538. [Google Scholar] [CrossRef]
  15. Xu, Y.-N.; Ching, W.Y.; Brickeen, B.K. Electronic structure and bonding in garnet crystals. Phys. Rev. B 2000, 61, 1817–1824. [Google Scholar] [CrossRef]
  16. Sarukura, N.; Nawata, T.; Ishibashi, H.; Ishii, M.; Fukuda, T. 4—Czochralski Growth of Oxides and Fluorides. In Handbook of Crystal Growth, 2nd ed.; Rudolph, P., Ed.; Elsevier: Boston, MA, USA, 2015; pp. 131–168. [Google Scholar] [CrossRef]
  17. Grazenaite, E.; Garskaite, E.; Stankeviciute, Z.; Raudonyte-Svirbutaviciene, E.; Zarkov, A.; Kareiva, A. Ga-Substituted Cobalt-Chromium Spinels as Ceramic Pigments Produced by Sol–Gel Synthesis. Crystals 2020, 10, 1078. [Google Scholar] [CrossRef]
  18. McDonald, K.A.; Schweitzer, G.K. Synthesis of GAGG:Ce3+ powder for ceramics using mechanochemical and solution combustion methods. J. Am. Ceram. Soc. 2018, 101, 3741. [Google Scholar] [CrossRef]
  19. Wu, J.; Wu, X.; Gao, Y.; Yan, Z. Innovations in Electric Current-Assisted Sintering for SOFC: A Review of Advances in Flash Sintering and Ultrafast High-Temperature Sintering. Appl. Sci. 2024, 14, 3953. [Google Scholar] [CrossRef]
  20. Lisitsyn, V.M.; Golkovsky, M.G.; A Musakhanov, D.; Tulegenova, A.T.; Abdullin, K.A.; Aitzhanov, M.B. YAG based phosphors, synthesized in a field of radiation. J. Phys. Conf. Ser. 2018, 1115, 052007. [Google Scholar] [CrossRef]
  21. Lisitsyn, V.; Lisitsyna, L.; Dauletbekova, A.; Golkovskii, M.; Karipbayev, Z.; Musakhanov, D.; Akilbekov, A.; Zdorovets, M.; Kozlovskiy, A.; Polisadova, E. Luminescence of the tungsten-activated MgF2 ceramics synthesized under the electron beam. Nucl. Instrum. Methods Phys. Res. Sect. B Beam Interact. Mater. At. 2018, 435, 263–267. [Google Scholar] [CrossRef]
  22. Lisitsyn, V.; Tulegenova, A.; Kaneva, E.; Mussakhanov, D.; Gritsenko, B. Express Synthesis of YAG:Ce Ceramics in the High-Energy Electrons Flow Field. Materials 2023, 16, 1057. [Google Scholar] [CrossRef]
  23. Lisitsyn, V.; Mussakhanov, D.; Tulegenova, A.; Kaneva, E.; Lisitsyna, L.; Golkovski, M.; Zhunusbekov, A. The Optimization of Radiation Synthesis Modes for YAG:Ce Ceramics. Materials 2023, 16, 3158. [Google Scholar] [CrossRef] [PubMed]
  24. Lisitsyn, V.; Tulegenova, A.; Golkovski, M.; Polisadova, E.; Lisitsyna, L.; Mussakhanov, D.; Alpyssova, G. Radiation Synthesis of High-Temperature Wide-Bandgap Ceramics. Micromachines 2023, 14, 2193. [Google Scholar] [CrossRef] [PubMed]
  25. Lisitsyn, V.M.; Karipbayev, Z.T.; Zhilgildinov, Z.S.; Zhunusbekov, A.M.; Tulegenova, A.T.; Golkovski, M.G. Effect of Precursor Prehistory on the Efficiency of Radiation-Assisted Synthesis and Luminescence of YAG:Ce Ceramics. Photonics 2023, 10, 494. [Google Scholar] [CrossRef]
  26. Bárta, J.; Pestovich, K.; Valdez, J.; Wiggins, B.; Richards, C.; Smith, E.; Clayton, J.; Smalley, D.; McClellan, K. Compositional screening of Ce-doped (Gd,Lu,Y)3(Al,Ga)5O12 ceramics prepared by quenching from melt and their luminescence properties. J. Alloy. Compd. 2021, 889, 161687. [Google Scholar] [CrossRef]
  27. Bárta, J.; Müllerová, E.; Kuzár, M.; Procházková, L.; Kučerková, R.; Jakubec, I.; Čuba, V. Photochemical synthesis and characterization of multi-component (Lu,Gd)3(Al,Ga)5O12:Ce garnet powders. Radiat. Meas. 2019, 124, 98–102. [Google Scholar] [CrossRef]
  28. Zorenko, Y.; Gorbenko, V.; Vasylkiv, J.; Strzyżewski, T.; Fedorov, A.; Kucerkova, R.; Mares, J.; Nikl, M.; Bilski, P.; Twardak, A. Growth and luminescent properties of scintillators based on the single crystalline films of (Lu,Gd)3(Al,Ga)5O12:Ce garnets. J. Lumin. 2016, 169, 828–837. [Google Scholar] [CrossRef]
  29. Dai, P.; Ji, C.; Shen, L.; Qian, Q.; Guo, G.; Zhang, X.; Bao, N. Photoluminescence properties of YAG:Ce3+,Pr3+ nano-sized phosphors synthesized by a modified co-precipitation method. J. Rare Earths 2017, 35, 341–346. [Google Scholar] [CrossRef]
  30. Zhou, X.; Zhou, K.; Li, Y.; Wang, Z.; Feng, Q. Luminescent properties and energy transfer of Y3Al5O12:Ce3+, Ln3+ (Ln = Tb, Pr) prepared by polymer-assisted sol–gel method. J. Lumin. 2012, 132, 3004–3009. [Google Scholar] [CrossRef]
  31. Cremers, D.A.; Radziemski, L.J. Handbook of Laser-Induced Breakdown Spectroscopy, 2nd ed.; Wiley: Chichester, UK, 2013. [Google Scholar]
  32. Lisitsyn, V.M.; Korepanov, V.I.; Yakovlev, V.Y. Evolution of primary radiation defects in ionic crystals. Russ. Phys. J. 1996, 39, 1009–1028. [Google Scholar] [CrossRef]
Figure 1. Results of dispersibility study of Y2O3, Gd2O3, Lu2O3, Al2O3, Ga2O3 in the range of 0.01–50 μm.
Ceramics 08 00112 g001
Figure 2. Photographs of samples Gd2YGaAl4O12:Ce, GdY2Ga3Al2O12:Ce, Gd2LuGaAl4O12:Ce, and GdLu2GaAl4O12:Ce.
Ceramics 08 00112 g002
Figure 3. Photographs of crucibles with obtained ceramics (GdLu2Ga3Al2O12:Ce) after treatment with electron flux with power densities of 1.0, 1.5, 2.5, and 4.0 kW/cm2.
Ceramics 08 00112 g003
Figure 4. Dependence of ceramic synthesis efficiency on radiation flux power density.
Ceramics 08 00112 g004
Figure 5. Distribution of specific beam power density on the mixture surface.
Ceramics 08 00112 g005
Figure 6. Luminescence excitation spectra at λem = 555 nm of synthesized ceramic samples.
Ceramics 08 00112 g006
Figure 7. Luminescence spectra of the synthesized samples under excitation in the region of 420–445 (a), 340–345 (b), and 220 nm (c).
Ceramics 08 00112 g007
Figure 8. Brightness of ceramic samples compared with the reference standard.
Ceramics 08 00112 g008
Figure 9. X-ray diffraction patterns of ceramic samples: (a) full spectrum in the 2θ range of 0–90°; (b) enlarged view of the 25–40° region showing peak shifts.
Ceramics 08 00112 g009
Figure 10. Schematic representation of the radiation flux pulses’ impact on an elementary section of the mixture surface when using the “with scanning” mode.
Ceramics 08 00112 g010
Table 1. Composition of synthesized ceramics.
NSample, DescriptionPower Density, kW/cm2Yield, %
Weight Mm/Mo
740GdY2 GaAl4O12:Ce (Gd10.257, Y2 0.32) (Ga10.133,Al4 0.29) O12: Ce2O3 (0.5%) 1897.0
741Gd2YGaAl4O12:Ce (Gd20.469, Y10.145) (Ga10.121,Al40.264) O12: Ce2O3 (0.5%)1899.2
742GdY2Ga3Al2O12:Ce (Gd10.229, Y20.286) (Ga30.356,Al20.129) O12: Ce2O3 (0.5%) 1895.7
743GdY2Ga2Al3O12:Ce (Gd10.242, Y20.302) (Ga20.251,Al30.205) O12: Ce2O3 (0.5%) 1898.2
744GdLu2 GaAl4O12:Ce (Gd1 0.206, Lu2 0.32) (Ga10.107,Al4 0.232) O12: Ce2O3 (0.5%)1896.6
745Gd2LuGaAl4O12:Ce (Gd20.422, Lu10.232) (Ga10.109,Al40.237) O12: Ce2O3 (0.5%)1899.5
Table 2. Efficiency of ceramics synthesis.
Power Density P, kW/cm2Weight Gd3Al5O12:Ce,
g
Weight GdLu2Ga3Al2O12:Ce,
g
Weight GdLu2Ga2Al3O12:Ce,
g
0.5000
14.532.181.74
1.57.144.514.22
2.511.17109.03
4 17.9316.85
Table 3. Positions of luminescence bands of samples at excitation of 420–445, 340–345, and 220 nm region.
N SampleLuminescence Band Maximum Position λem, nm
λex = 450 nmλex = 340 nmλex = 230 nm
740553548530
741555552555
742525525525
743540536540
744555552555
745557558555
746560548555
747557556555
766--530
768532529530
769537-540
Table 4. Luminescence brightnesses and emission color coordinates of ceramics and phosphors.
N SampleSDL-4000740741742743744745746747
Brightness at ω = 0.2° (S ≈ 1 mm2)57,30027,80029,90021,20019,10021,30038,10030,70023,200
Brightness at ω = 1.0° (S ≈ 17 mm2)47,30021,50023,30019,20020,70020,20029,80024,10017,800
Color coordinates (x; y)0.4274
0.5462
0.4430
0.5327
0.4650
0.5165
0.3684
0.5549
0.4044
0.5118
0.4344
0.5310
0.4685
0.5109
0.4653
0.5135
0.4388
0.5337
Disclaimer/Publisher’s Note: The statements, opinions and data contained in all publications are solely those of the individual author(s) and contributor(s) and not of MDPI and/or the editor(s). MDPI and/or the editor(s) disclaim responsibility for any injury to people or property resulting from any ideas, methods, instructions or products referred to in the content.