Article

Effect of NiO and ZnO Sintering Aids on Sinterability and Electrochemical Performance of BCZY Electrolyte

CSIRO Energy, Private Bag 10, Clayton South, VIC 3169, Australia
*
Authors to whom correspondence should be addressed.
Ceramics 2025, 8(2), 78; https://doi.org/10.3390/ceramics8020078
Submission received: 29 April 2025 / Revised: 10 June 2025 / Accepted: 12 June 2025 / Published: 19 June 2025

Abstract

Proton-conducting ceramics have gained significant attention in various applications. Yttrium-doped barium cerium zirconate (BaCexZr1−x−yYyO3–δ) is the state-of-the-art proton-conducting electrolyte but poses a major challenge because of its high sintering temperature. Sintering aids have been found to substantially reduce the sintering temperature of BaCexZr1−x−yYyO3–δ. This work evaluates, for the first time, the impact of NiO and ZnO addition in three different loadings (1, 3, 5 mol%), via wet mechanical mixing, on the sintering and electrical properties of a low cerium-containing composition, BaCe0.2Zr0.7Y0.1O3–δ (BCZY). The sintering temperature remarkably dropped from 1600 °C (for pure BCZY) to 1350 °C (for NiOBCZY and ZnOBCZY) while achieving > 95% densification. In general, ZnO gave higher densification than NiO, the highest being 99% for 5 mol% ZnOBCZY. Dilatometric studies revealed that ZnOBCZY attained complete shrinkage at temperatures lower than NiOBCZY. Up to 650 °C, ZnO showed higher conductivity compared to NiO for the same loading, mostly due to a higher extent of Zn incorporation inside the BCZY lattice as seen from the BCZY peak shift to a lower Bragg’s angle in X-ray diffractograms, and the bigger grain sizes of ZnO samples compared to NiO captured in scanning electron microscopy. At any temperature, the variation in conductivity as a function of sintering aid concentration followed the orders 1 mol% > 3 mol% > 5 mol% (for ZnO) and 1 mol% < 3 mol%~5 mol% (for NiO). This difference in conductivity trends has been attributed to the fact that Zn fully dissolves into the BCZY matrix, unlike NiO which mostly accumulates at the grain boundaries. At 600 °C, 1 mol% ZnOBCZY showed the highest conductivity of 5.02 mS/cm, which is, by far, higher than what has been reported in the literature for a Ce/Zr molar ratio <1. This makes ZnO a better sintering aid than NiO (in the range of 1 to 5 mol% addition) in terms of higher densification at a sintering temperature as low as 1350 °C, and higher conductivity.

Graphical Abstract

1. Introduction

Proton-conducting ceramics have drawn attention since Iwahara et al. [1] discovered in 1981 that doped strontium cerate sintered between 1300 and 1450 °C was an almost pure protonic conductor in a hydrogen-containing atmosphere. The advantage of proton-conducting electrolytes is their intermediate temperature operation (400 to 700 °C) which broadens the choice of materials that can be used as electrodes, and also the scope of application of proton-conducting electrolyte systems.
So far, barium- and strontium-based perovskites have been studied in-depth and shown promise as proton-conducting electrolytes. Barium cerates (BaCeO3) exhibit high protonic conductivity, but they are not stable at low temperatures and are prone to reaction with steam and CO2. On the other hand, barium zirconates (BaZrO3) are chemically stable, but exhibit lower protonic conductivity, and require very high sintering temperatures (above 1600 °C) and a long sintering duration for sufficient densification to prevent gas crossover. To strike a balance, BaZr1xCexO3δ-based ceramics have been studied in-depth, and have shown promise in terms of conductivity and stability, but the sintering temperature is still around 1550 °C. Further research revealed that doping BaZr1−xCexO3−δ with aliovalent rare earth elements like Y, Sm, Gd and Dy brings down the sintering temperature to 1500 °C. An amount of 10–20 mol% Y-doped BaZr1−xCexO3−δ (commonly BCZY) has shown the highest conductivity in dry air (2.5 × 10−2 S cm−1) and wet air (2.1 × 10−3 S cm−1) atmospheres at 600 °C [2,3,4] that makes it the most widely used proton-conducting electrolyte [5,6], although proton conductivity depends on dominant charge carriers under different conditions. However, 1500 °C is still a considerably high sintering temperature [7,8,9] that promotes metal evaporation from the electrode(s) and inter-diffusion into the electrolyte.
Sintering aids, which are mostly oxides of transition metals, have been found useful in enhancing the sinterability of BCZY by reducing the sintering temperature and enlarging the grain size. The metal cation partially replaces the B-site cation in the BCZY lattice, introducing oxygen vacancies and electron–hole pairs to compensate for charge neutrality [10]. This, in turn, alters the proton conductivity of BCZY. Another concept [11] states that the sintering aids melt at the grain boundaries of the parent perovskite and aid grain growth to attain higher densification at lower temperatures, a process typically known as liquid phase sintering (LPS). Such structural distortions in the grain boundary region can alter the proton mobility or protonic defect concentration, thus affecting proton conductivity currents [10].
In the literature, different sintering aids like NiO, CuO, ZnO, Fe2O3 and CoO have been reported, the most common ones being NiO and ZnO [10,11,12,13,14,15]. In general, wet chemistry techniques like the sol–gel method, wet impregnation using metal nitrate solution, the Pechini method, etc., have been used to ensure (1) sintering aid cation incorporation into BCZY lattice and (2) bigger grain size with lesser grain boundaries to minimize grain boundary resistance to proton transport. For example, 4 mol% Ni incorporation via sol–gel method rendered a conductivity of 6.3 mS/cm at 600 °C (in 3% humidified H2) for BaZr0.1Ce0.66Ni0.04Y0.2O3−δ [16], which was higher than the parent perovskite or when NiO was added using mechanical mixing. Nasani et al. [17] obtained conductivities of 1.11 mS/cm and 0.91 mS/cm at 500 °C with 1 wt% NiO added BaCe0.3Zr0.55Y0.15O3−δ and 1 wt% ZnO added BaCe0.3Zr0.55Y0.15O3−δ, respectively, all in 3% humidified H2. In this case, NiO and ZnO were added via the citrate–nitrate combustion method. However, in certain instances mechanical mixing has outperformed wet synthesis. Tao and Irvine [14] reported 97% densification at 1325 °C with 1 wt% ZnO added to BaCe0.5Zr0.3Y0.16Zn0.04O3−δ via ball-milling and that a total conductivity of 3.14 mS/cm was obtained at 400 °C and over 10 mS/cm above 600 °C in 5% humidified H2. Viechineski et al. [18] synthesized BaCe0.2Zr0.7Y0.1O3−δ by the Pechini method and added 4 wt% ZnO to it via ball-milling followed by sintering at 1500°C for 4 h to achieve 8.64 mS/cm at 600°C in humid N2. Wang et al. [19] added 4 mol% ZnO to BaCe0.5Zr0.3Y0.2O2.9 and reported higher conductivity with mechanical mixing (13.5 mS/cm at 600 °C in 5% humidified H2) than wet synthesis (11.2 mS/cm at 600 °C in 5% humidified H2) using zinc nitrate in ethanol. In another work, 2 wt% of ZnO addition to BaCe0.35Zr0.5Y0.15O3−δ (BCZY) by sol–gel method exhibited the lowest sintering temperature of 1100 °C, but the overall conductivity was halved (8 mS/cm for BCZY sintered at 1600 °C versus 4.02 mS/cm for BCZY-ZnO sintered at 1100 °C) at 700 °C in humidified H2 [13]. Thus, it cannot be conclusively said that sintering aid addition by wet chemistry techniques renders higher conductivity than mechanical mixing, especially when such techniques are costly, complicated and time-consuming. However, it can be concluded that wet synthesis guarantees better sintering aid dispersion compared to dry mixing. Recently, Matsuda et al. [20] adopted a wet mechanical mixing technique (using ethanol solvent) to add 0.1 to 3 wt% ZnO to BaCe0.8Zr0.1Y0.1O3−δ and achieved 13 mS/cm at 600°C (3.0% H2O, 19.4% H2, and 77.6% N2). This work evaluates a further modified wet mechanical mixing where the sintering aid is ball-milled with the BCZY powder, but in the presence of a binder and solvent to ensure uniform mixing.
It is also to be noted that, in the examples cited above, synthesis technique is not the only distinguishing factor, but there are other variables, like sintering aid concentration, sintering temperature as well as sintering duration, that play a pivotal role in determining the overall conductivity of NiO or ZnO added to BCZY. A plethora of literature is available on individual sintering aids, and how their concentration affects BCZY conductivity, but only limited research is available on the comparison of NiOBCZY and ZnOBCZY synthesized by identical processing conditions. Moreover, there was a general notion that ZnO is an excellent sintering aid in terms of densification, but not as great as NiO when it comes to conductivity [11]. Only recently, Tao et al. [14] and a few others have reported that ZnO improves perovskite conductivity, but only when added in small quantities. This work aims to study the effects of NiO and ZnO on the structural and electrical properties of BCZY when added in equal concentration under identical processing conditions.
In this study, 1, 3 and 5 mol% NiO and ZnO were added to BaCe0.2Zr0.7Y0.1O3−δ using a wet mechanical mixing process, and their influence on the phase structure, morphology, sinterability and conductivity of BCZY have been systematically evaluated. Since Zn and Ni are hardly soluble in BCZY [20,21], the sintering aid concentration was intentionally kept low (1–5 mol%) to avoid accumulation at grain boundaries, leading to any unwanted electron conduction across the electrolyte, as has been previously reported with higher concentrations [21,22]. A further comparison has also been made between pure BZCY and the sintering-aid-modified BCZY in terms of sinterability and conductivity.

2. Experimental Details

2.1. Fabrication of Electrolyte Discs/Bars

Electrolyte discs were prepared for density and conductivity measurements. At first, nickel oxide (NiO) powder (Fuel Cell Materials) and barium cerium yttrium zirconate (BaCe0.2Zr0.7Y0.1O3−δ) powder (Fuel Cell Materials) were mixed in appropriate ratio to achieve 1, 3 and 5 mol% NiO loading. Next, 2 wt% alcohol soluble binder (CERDEC) was added to the mixture followed by the addition of enough ethanol to completely submerge the powder. This mixture was ball milled (Across International Planetary Ball Mill) at 350 rpm for a total span of 2 h to ensure uniform mixing. The well-mixed slurry was kept at 30 °C overnight for solvent evaporation, followed by crushing in a mortar and pestle, and sieving to obtain a fine powder. The same procedure was repeated to synthesize 1, 3 and 5 mol% ZnO added to BCZY powders. Next, standard discs were then pressed in a uniaxial press (MTI Corporation, Richmond, CA, USA) at 8 bars of pressure, followed by further pressing in an isostatic press (Avure Technologies, Inc., Middletown, OH, USA) at 170 MPa. These discs were then sintered at 1350 °C in static air for 2 h. They were placed on and surrounded by BCZY powder to compensate for barium oxide (BaO) evaporation. As-prepared sintered discs were 20 mm in diameter and 1.55 mm thick. For shrinkage studies, bars were fabricated using the same method, their final dimensions being 42.1 mm × 4.3 mm × 3.0 mm. Structural properties of BCZY powder before and after milling have been provided in Supplementary Sections S1 and S2.

2.2. Conductivity Measurement

As-prepared NiOBCZY and ZnOBCZY discs were coated on either side with Ag paste spanning over an area of ~0.78 cm2, followed by drying in an oven at 80 °C and sintering in a binder burn-off furnace (Tetlow, Melbourne, Australia) at 825 °C in static air for 2 h. Next, the samples were mounted on a fixture and snugly placed between two Pt mesh pieces connected to Pt wires for current collection. The fixture was inserted into a tubular furnace. A K-type thermocouple was positioned very close to the cell to accurately monitor actual cell temperature and the actual cell temperature varied within ±3 °C of furnace set temperature at all times. Conductivity tests were done in the temperature range of 350 to 700 °C while purging 5% humidified H2/N2 (5:95 v/v) mixture into the furnace at 38.5 mL/min under isothermal conditions for 30 min. The electrochemical impedance spectra were recorded (in the frequency range of 1 MHz to 100 mHz with an amplitude of 10 mV) using Versastat (Princeton Applied Research, Oak Ridge, TN, USA) under open circuit voltage (OCV) using four probes to avoid wire losses.

2.3. Archimedes’ Density Measurement

Density measurements were carried out following ASTM standard C830. First, samples were heated to 110 °C to remove any surface-bound moisture and then weighed (dry weight, D). Next, samples were fully immersed in boiling water for 2 h. After the boiling period, samples were cooled down to room temperature while still completely covered with water. Samples were suspended in an in-house loop or halter of AWG Gage 22 (0.643-mm) aluminum wire hung from one arm of a weighing balance and immersed into a beaker of water. The balance was previously tared with the wire in place and immersed in water to the same depth as is used when the specimens are in place. This gives the suspended weight (S) of the samples. Next, samples were blotted lightly with a moistened cotton cloth to remove all drops of water from the surface and determine the saturated weight (W). Care must be taken to avoid excessive blotting that would otherwise induce error by withdrawing water from the pores of the sample. The bulk density ( ρ , g · cm−3) can be determined using the formula:
ρ = D W S

2.4. Dilatometer Shrinkage Studies

Dilatometry of pure BCZY, 1, 3 and 5 mol% NiO added BCZY bars, and 1, 3 and 5 mol% ZnO added BCZY bars were recorded under static air in the temperature range of 45 °C to 1550 °C at a heating rate of 2 °C/min using DIL 402 Expedis Classic Netzsch (Waldkraiburg, Germany). Green bars were cut into identical lengths of 25 mm and the total shrinkage, and the shrinkage rates were measured along the axial direction under a static force of 0.2 N.

2.5. XRD and SEM Characterization

For bulk phase analysis, all samples were ground in a boron carbide mortar and pestle followed by loading into zero-background sample holders. A Bruker D8 Advance A25 X-ray Diffractometer (Billerica, MA, USA) operating under CuKα radiation (40 kV, 40 mA) equipped with a Lynx Eye XE-T detector was employed to obtain the X-ray diffractogram. All samples were scanned over the 2θ range 5° to 90° with a step size of 0.02° and a count time of 1.6 s per step, and were spun at 15 RPM during data collection. Crystalline phases were identified using the ICDD-JCPDS powder diffraction database. Rietveld analyses were performed on the data using the Bruker TOPAS™ (Version 7) program to determine phase wt% and lattice parameter values. Background signal was described using a combination of the Chebyshev polynomial linear interpolation function and 1/x function. Cell parameters, vertical sample displacement, peak full width at half maximum, scale factor and preferred orientation were all refined. Error ranges were calculated on the basis of three estimated standard deviations as calculated by TOPAS. Crystallite sizes were calculated using the Scherrer equation:
D = K λ β c o s θ
where D is the mean size of the ordered (crystalline) domains, also referred to as crystallite size, K is a dimensionless shape factor, typically 0.89, λ is the X-ray wavelength in nm, β is the line broadening at half the maximum intensity (FWHM) in radians, and θ is the Bragg’s angle.
The microstructure of fresh samples was imaged using a Merlin Benchtop scanning electron microscope (SEM) from Zeiss, Oberkochen, Germany. Samples were mounted onto stubs and coated with Ir for 30 sec. Next, they were subjected to imaging under secondary electron diffraction (SED) mode under 20,000× magnification.

3. Results and Discussion

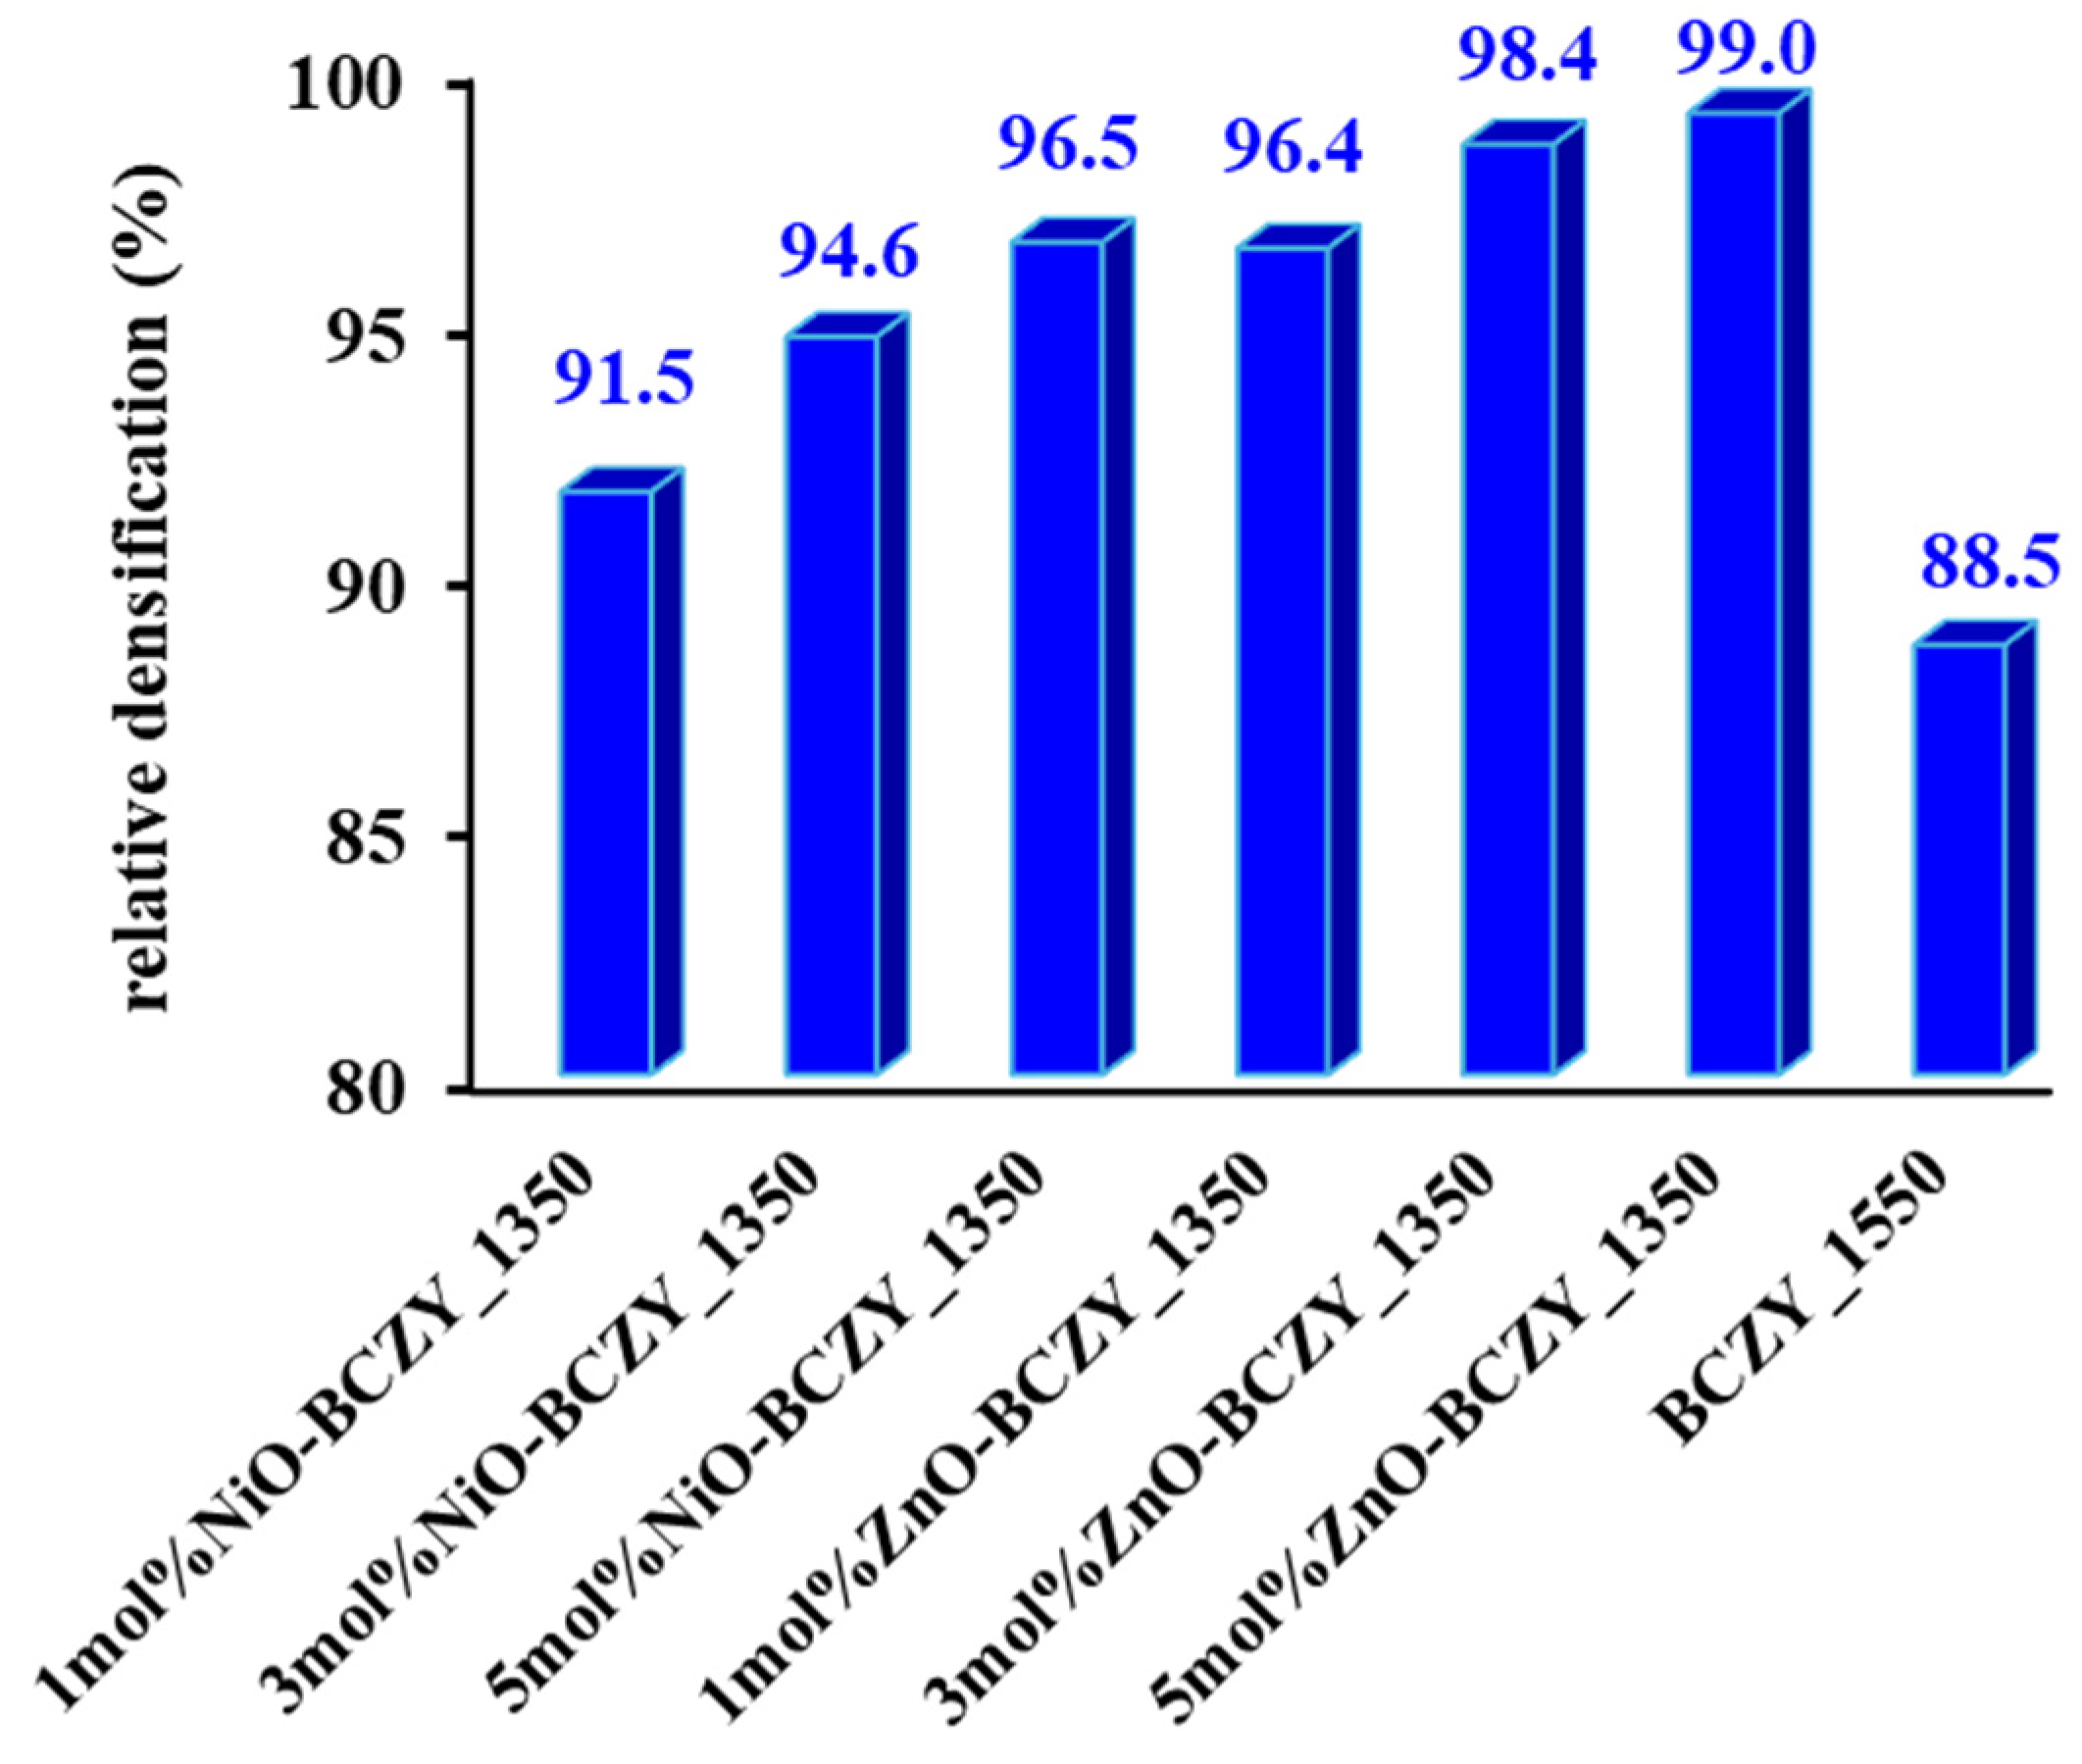
3.1. Density Measurements and Shrinkage Studies

NiOBCZY and ZnOBCZY samples sintered at 1350 °C were subjected to Archimedes’ density measurement tests as described in Section 2.3. The as-obtained relative densities (ρrel) are shown in Figure 1. Both sintering aids in all three molar concentrations succeeded in achieving higher densification compared to pure BCZY sintered at 1550 °C (ρrel 88.5%) for 2 h. Clearly, NiO and ZnO improved the sinterability of BCZY, giving ρrel > 90% at a sintering temperature of just 1350 °C.
As expected, ρrel increased monotonically with sintering aid concentration. For example, 1 mol% NiOBCZY had a ρrel value of 91.5% that increased to 96.5% upon increasing NiO content to 5 mol%. As is widely reported in the literature, higher sintering aid concentration promotes grain growth, leading to attenuation of pores, and, finally, enhanced densification. Figure 2 shows the dilatometer test results of NiOBCZY and ZnOBCZY.
To do this, green compact bars of 1, 3, and 5 mol% NiOBCZY and ZnOBCZY, together with a pure BCZY bar as a control sample, were subjected to the shrinkage measurement study. As illustrated in Figure 2A, pure BCZY only shrunk to 12% at 1550 °C while all the other bars with sintering aids surpassed this value significantly. In addition to increasing the densification, the sintering additives decreased the sintering temperature as is clearly visible in Figure 2A,B. Complete densification could be realized at the temperature where the inflection point of the plateau is almost formed in the derivative curves (Figure 2B), which are 1385 °C,1350 °C, 1347 °C, 1327 °C, 1283 °C, and 1230 °C for 5 mol% NiOBCZY, 1 mol% ZnOBCZY, 1 mol% NiOBCZY, 3 mol% NiOBCZY, 3 mol% ZnOBCZY, and 5 mol% ZnOBCZY, respectively. Moreover, the densification degrees of the bars are in good agreement with the Archimedes measurements. It is to be noted that BCZY showed slight shrinkage starting at 150 °C and then major shrinkage around 1100 °C. In contrast, doped samples started shrinking at ~900 °C onwards. Such different behavior of BCZY and doped BCZY can be attributed to the presence of a sintering aid, since all samples were milled under identical conditions with equal amounts of binder and pressed into bars using the same equipment and die under identical pressure.

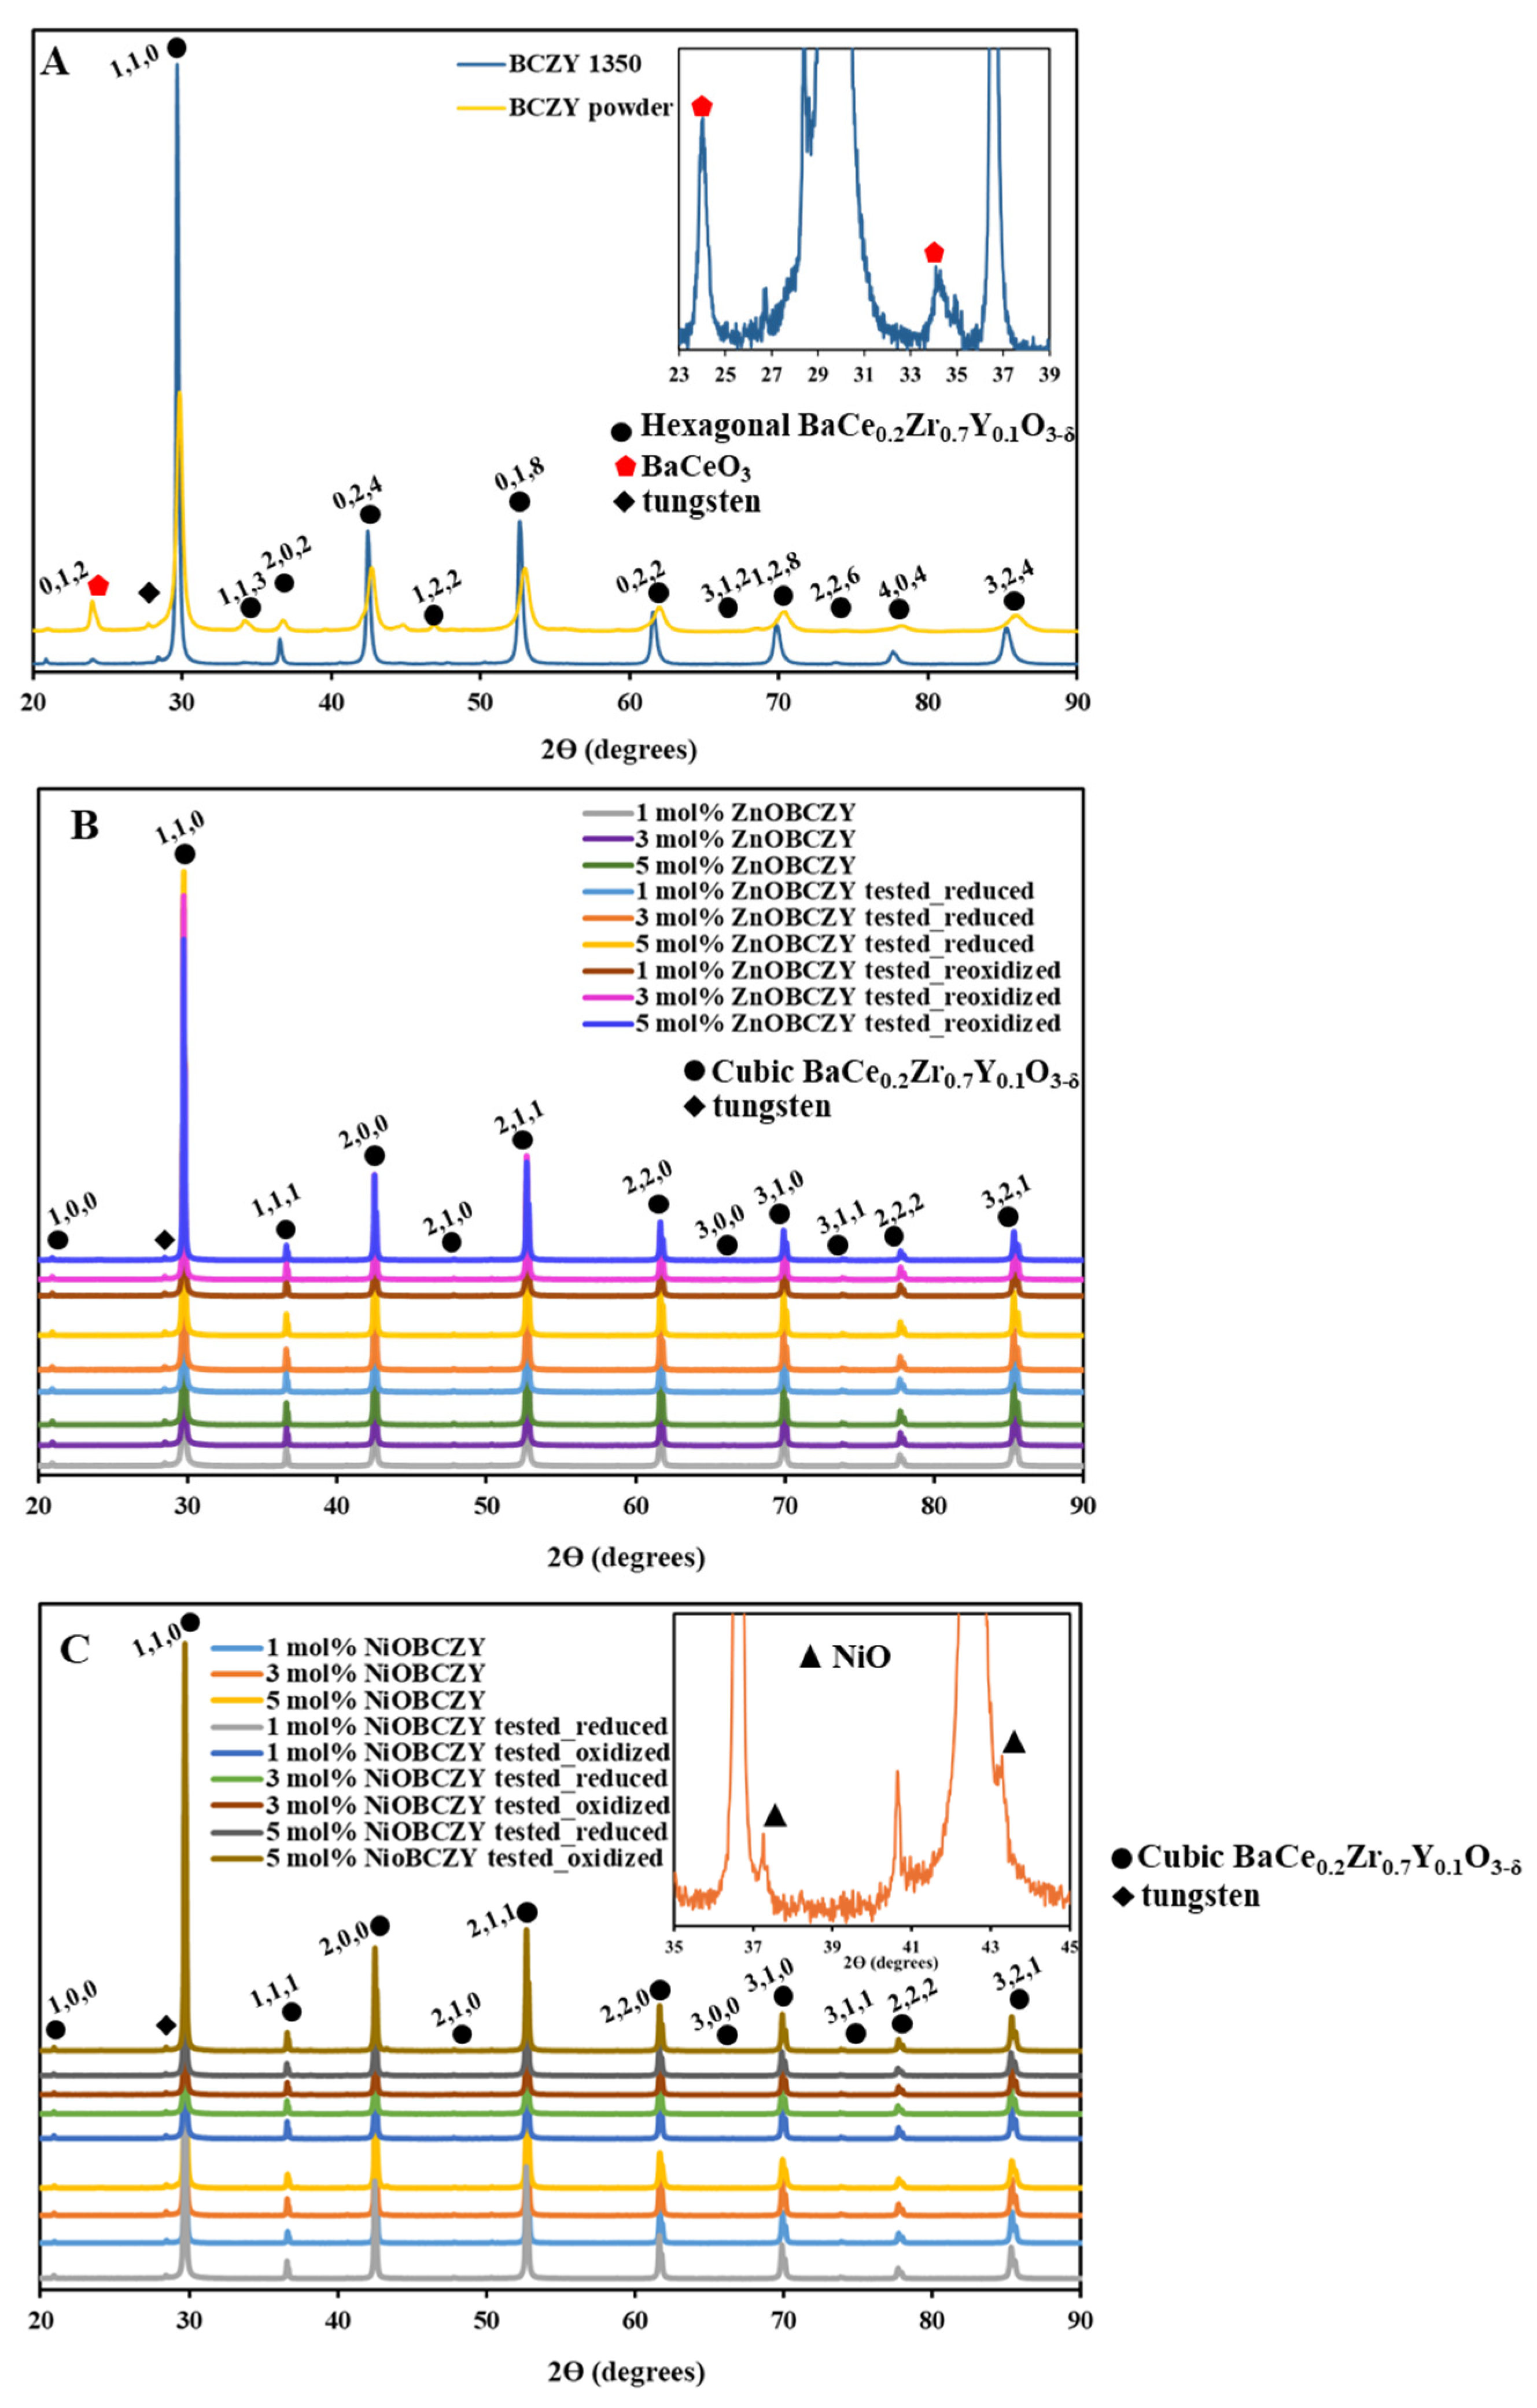
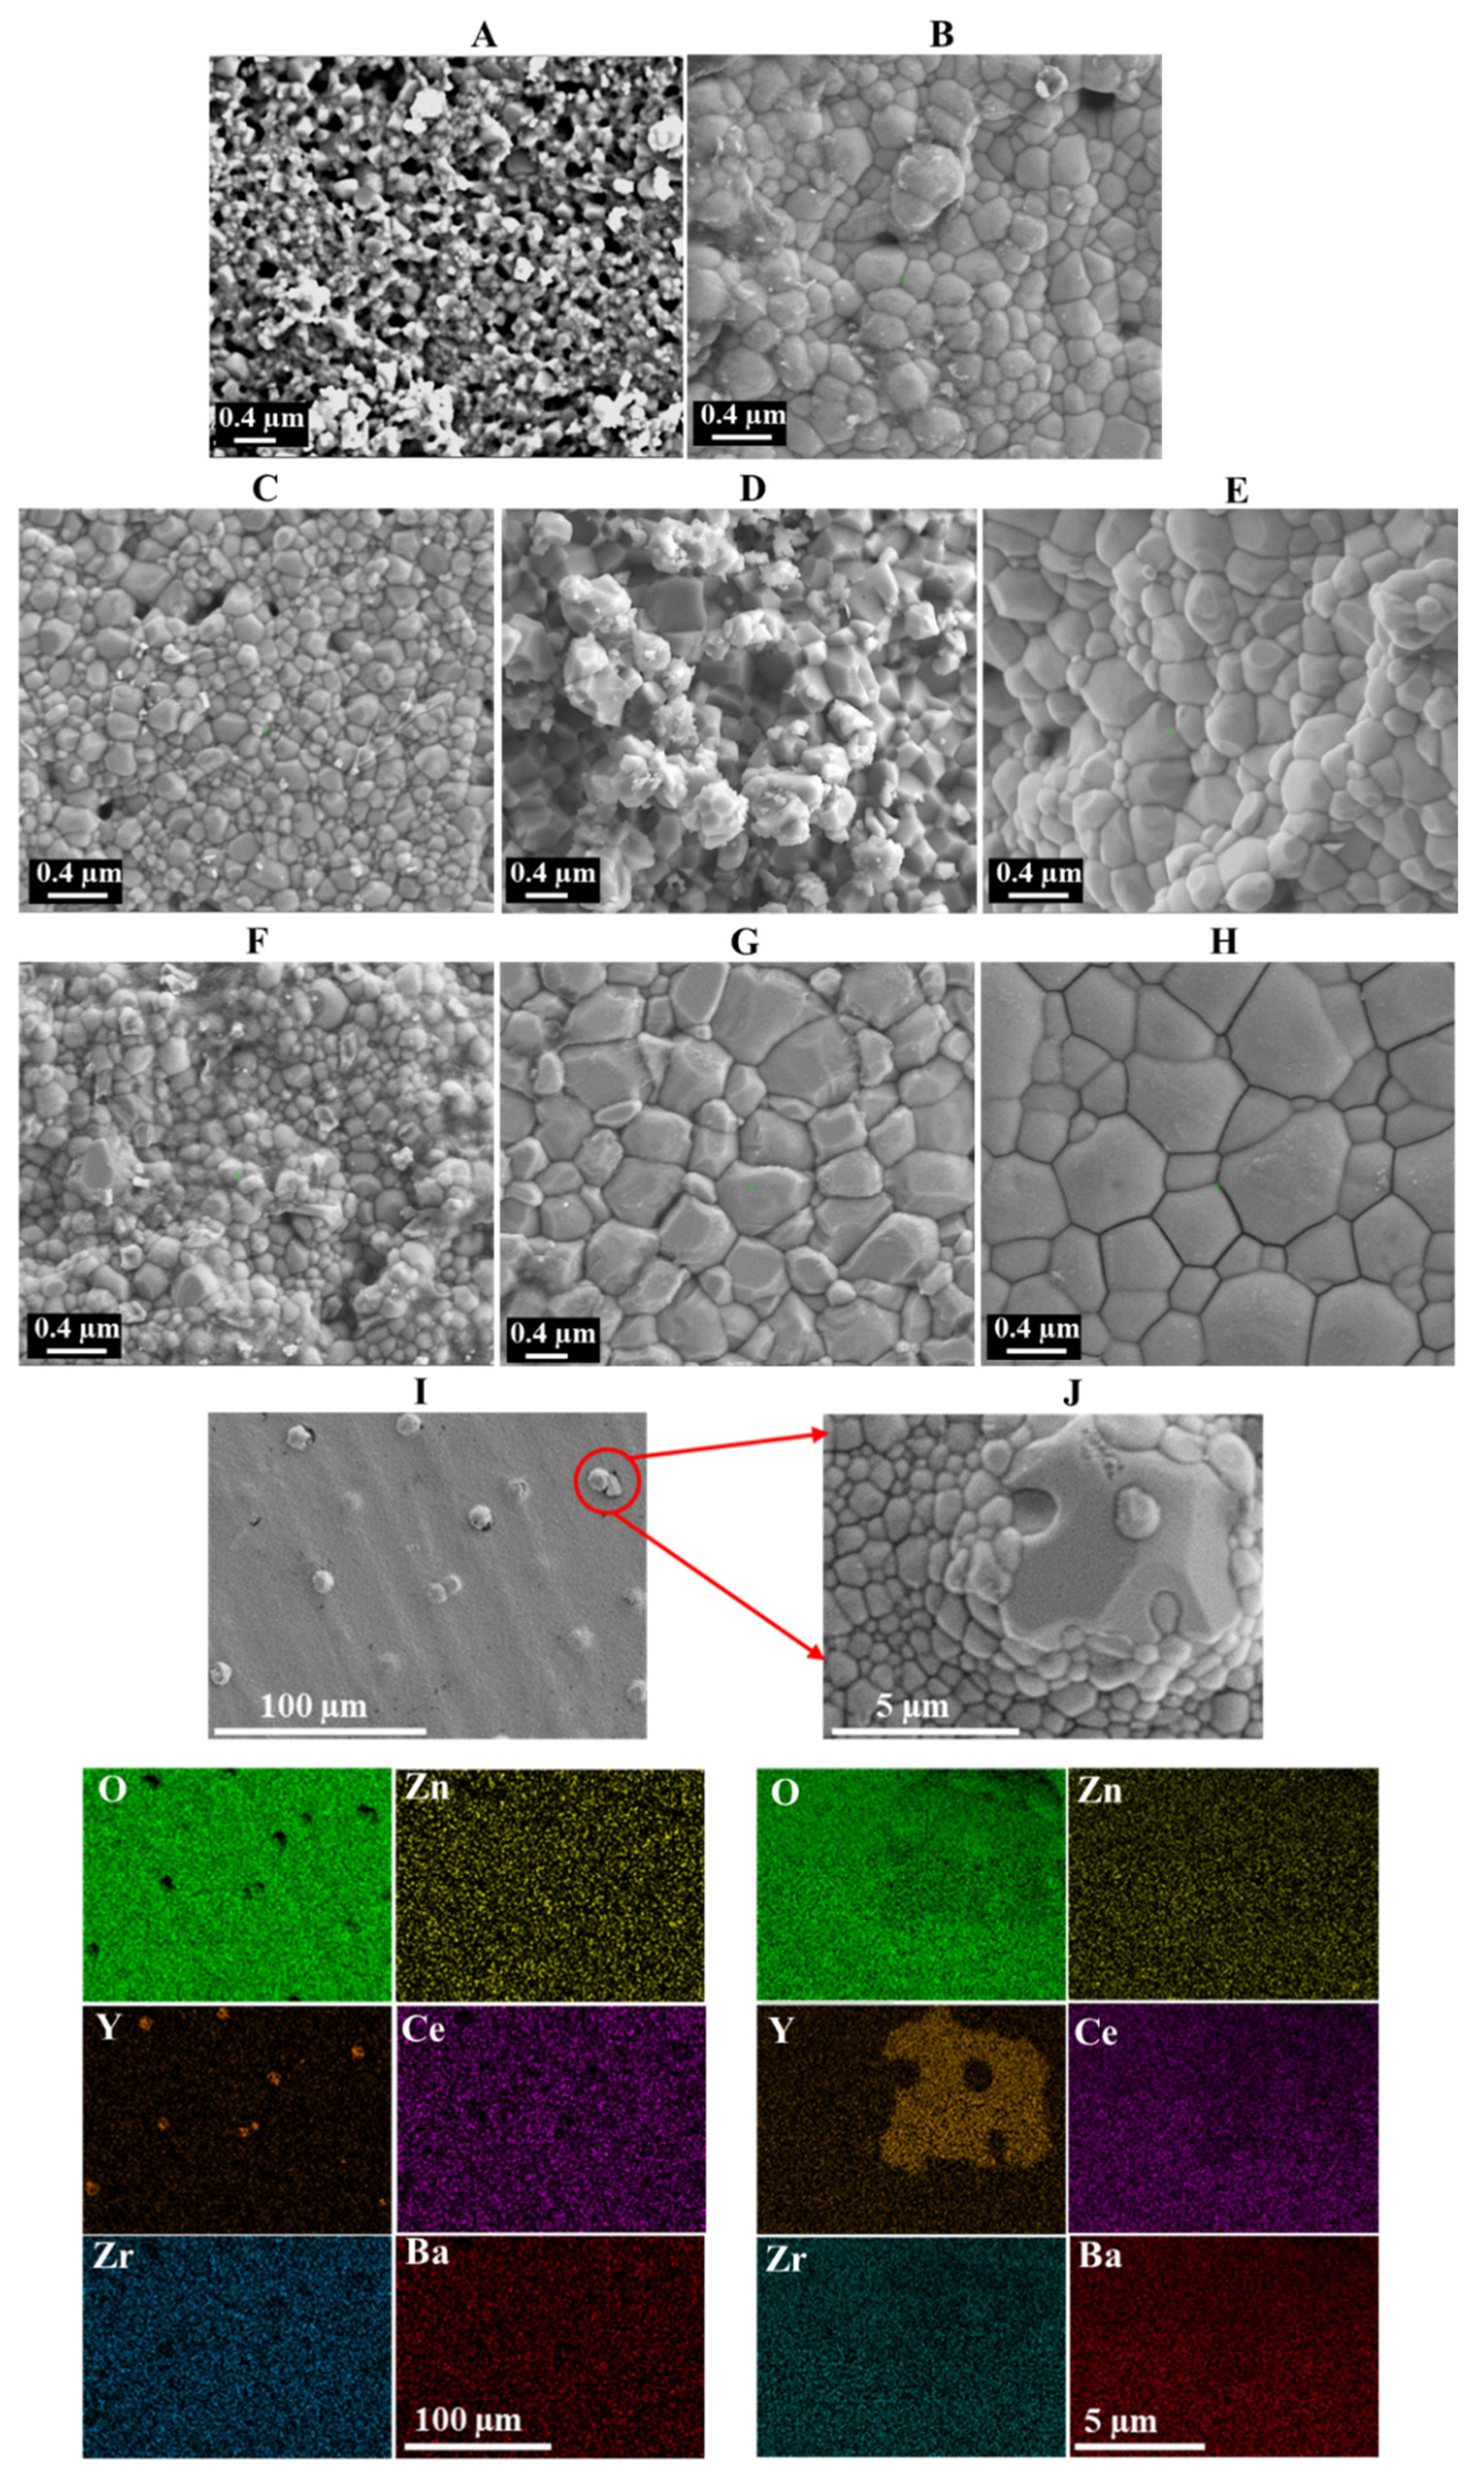
3.2. XRD and SEM Characterization Results

One objective was to see the different phases present in the NiOBCZY and ZnOBCZY samples and check the redox stability of these materials. Thus, X-ray diffractograms have been provided and discussed in-depth in this section for (1) fresh samples, (2) samples tested in a reducing environment in the temperature range of 350 to 700 °C (denoted as tested_reduced), and (3) samples tested in a reducing environment in the temperature range of 350 to 700 °C followed by oxidation in static air at 800 °C (denoted as tested_reoxidized).
As-purchased BCZY powder, as well as pure BCZY sintered at 1350 °C, showed a hexagonal BaCe0.2Zr0.7Y0.1O3−δ (PDF 04-011-7317) phase (Figure 3A) along with little witherite (BaCO3, PDF 01-085-0720) that showed major reflection at 24° (Figure 3A inset). Ba lost during sintering reacts with atmospheric O2 forming BaO that then reacts with atmospheric CO2, resulting in the formation of BaCO3 [23,24,25]. All three ZnOBCZY samples exhibited cubic BaCe0.2Zr0.7Y0.1O3−δ (PDF 04-011-7317) as the major phase with no additional diffraction peaks from ZnO (Figure 3B). According to the literature [26,27,28], Zn enters the lattice structure, promotes solid solution, and favors the formation of a single-phase BCZY. Very similar findings have been reported by Viechineski et al. [18] who synthesized BaCe0.2Zr0.7Y0.1O3−δ by Pechini method and added 4 wt% ZnO to it followed by sintering at 1500 °C for 4 h. In the present work, there was no change in the lattice structure or the lattice parameter of the ZnOBCZY samples upon testing in a steam/H2/N2 environment. However, only 5 mol% ZnOBCZY showed ~0.5 wt% Y2O3 (PDF 04-002-5376) as an impurity phase in both fresh and tested samples, which may be related to the loss of Ba during sintering at elevated temperatures [18]. It is to be noted here that minor reflections observed between 20–30°, 40–55° and 70–80° correspond to BCZY (PDF 04-011-7317). However, an additional peak at around ~28.5° appeared from tungsten radiation. In XRD equipment, a tungsten filament acts as the cathode. When heated, it emits electrons that are then accelerated towards the copper anode; tungsten from the cathode slowly evaporates and deposits in the copper anode over its lifetime and can create X-ray characteristics of tungsten upon collision with electrons from the cathode. The peak splitting of BCZY, especially at a higher Bragg’s angle, can be attributed to the presence of a trace amount of rhombohedral BCZY. Similar peak splitting due to the co-existence of two phases has been previously reported in the literature [29,30,31]. The lattice parameters and phase details of each ZnOBCZY fresh and tested sample have been provided in Table 1.
In contrast to ZnOBCZY that depicted no peaks for ZnO, a cubic bunsenite (NiO, PDF 01-090-8811) phase was detected for all 3 and 5 mol% NiOBCZY samples (Figure 3C inset). As expected, NiO content was higher for 5 mol% loading compared to 3 mol%. There was no change in the lattice structure or the lattice parameter of the samples upon testing in a humidified H2/N2 environment. Also, no changes were observed upon reoxidizing the tested samples (Figure 3C). However, NiO content decreased upon testing samples in a reducing environment and then again increased upon reoxidizing such reduced samples. This can be attributed to the partial reduction of NiO into metallic Ni (Ni0) during testing in a humidified H2/N2 environment, and subsequent Ni0 NiO during reoxidation. The 3 and 5 mol% NiOBCZY samples showed trace amount of BaCO3 as an impurity phase that, again, can be related to Ba loss [18,28]. The lattice parameters and phase details of each fresh and tested NiOBCZY sample have been provided in Table 2.
As seen in Table 1 and Table 2, the lattice parameter of BCZY was very consistent and varied from 0.4253 to 0.4255 nm. More interestingly, for any particular mol% sintering aid addition, the lattice parameter remained unaltered for fresh and tested_reduced samples. For example, 3 mol% ZnOBCZY fresh and tested_reduced samples had lattice parameters of 0.4254 nm (Table 1). Similarly, 3 mol% NiOBCZY fresh and tested_reduced samples also had lattice parameters of 0.4254 nm (Table 2). The value corresponding to the fourth decimal dropped slightly upon reoxidizing the tested_reduced samples. For example, 3 mol% ZnOBCZY tested_reduced and tested_reoxidized samples had lattice parameters of 0.4254 and 0.4253 nm, respectively (Table 1). NiOBCZY samples also mirrored the same trend. This can be attributed to negligible peak shift after one full redox cycle. It is to be noted that peak indexes and lattice parameters for impurity phases like BaCO3 and Y2O3, present in very trace amounts, are probably not useful, as all of the major peaks are overlaps from multiple peaks. For example, in the case of BaCO3 (Figure 3A), the first witherite peak at ~24° is due to both the (1 1 1) and (0 2 1) sets of planes, the small shoulder peak at ~27.7° is due to the (0 0 2) set of planes, and the next major peak at ~34.2° is due to an overlap of the (2 0 0), (1 1 2), (0 2 2) and (1 3 0) sets of planes. Thus, these two peaks have not been indexed in Figure 3 and their lattice parameters have not been provided in either Table 1 or Table 2.
It is to be noted that crystallite sizes of BCZY calculated from the Scherrer equation were greater than 200 nm and have thus been excluded from Table 1 and Table 2. This is because the Scherrer equation is generally not considered valid for calculating crystallite sizes significantly larger than 100 to 200 nm [32]. Its accuracy decreases significantly when dealing with larger crystallites due to the diminishing effect of diffraction peak broadening with increasing crystallite size.
For all samples, crystallite sizes as determined using Scherrer equation (Equation (2)) were >0.2 µm. This is similar to the grain size of samples containing 1 mol% sintering aid (as seen from SEM images discussed later); however, with increasing sintering aid concentration, the average grain sizes monotonically exceeded 0.2 µm. This is because crystallite and grain sizes are affected by nucleation and growth kinetics during sintering. Upon increasing the sintering temperature, smaller grains merge into larger ones, thus each big grain now comprises more than one single crystal leading to an average grain size larger than the average crystallite size.
It is to be noted in Table 1 and Table 2 that all samples having sintering aid showed a cubic BCZY phase, whereas pure BCZY sintered at the same temperature (1350 °C) showed a hexagonal BCZY phase. As seen in Figure 4, both ZnO- (Figure 4A) and NiO- (Figure 4B) added samples reflected a peak shift of the most prominent BCZY reflection from 29.7° to a higher Bragg’s angle, indicating lattice contraction. This slight peak shift can be the reason for the systematic decrease in the lattice parameter of BCZY from 0.4255 nm (with 1 mol% ZnO) to 0.4253 nm (with 5 mol% ZnO). Similarly, the lattice parameter dropped from 0.4254 nm for 1 mol% NiO to 0.4252 nm for 5 mol% NiO. It has been observed [15] that divalent ions like Ni2+ and Zn2+ partially replace tetravalent ions like Ce4+ and Zr4+ in BCZY lattice. Since the ionic radii of Ni2+ (0.069 nm) and Zn2+ (0.074 nm) are less than that of Ce4+ (0.097 nm) and Zr4+ (0.079 nm), any B-site substitution leads to a slight lattice contraction. Such contraction might be the reason for the BCZY phase transition from hexagonal (in the absence of any sintering aid) to cubic (in the presence of sintering aid). Replacement of Ce4+ and Zr4+ by Zn2+ or Ni2+ can also be a reason for the peak split of sintering aid-added BCZY samples observed in Figure 4. Similar findings have been reported by others [16,33,34] as well. The substitution of Zr4+ with Zn2+/Ni2+ would introduce oxygen vacancies to maintain charge neutrality, which should also contribute to lattice contraction. In fact, such oxygen vacancy generation is a possible reason for enhanced proton hopping, resulting in a higher ionic conductivity envisaged in this work as well as by others [13,16,33,34]. It is possible that there is a mixed phase having BaCeZrYO3−δ along with BaCeMYO3−δ or BaMZrYO3−δ or BaCeZrMYO3−δ, where M is Ni- or Zn-based on the added sintering aid. However, further verification through characterizations like XPS or Raman spectroscopy is needed for any conclusive remarks on this observed peak split.
Figure 5 shows the SEM images of BCZY and the sintering aid-added BCZY at a magnification of 20,000. While pure BCZY sintered at 1350 °C showed a highly porous structure with under-developed grains (Figure 5A), that sintered at 1550 °C was densified (Figure 5B), albeit featuring the presence of few sporadic pores, with grains ranging in size from 0.1 to 0.3 µm. As expected, addition of NiO (Figure 5C–E) and ZnO (Figure 5F–H) sintering aids rendered a highly dense structure at just 1350 °C with grain sizes almost double that of pure BCZY sintered at 1350 °C. Although 1 mol% NiOBCZY reflected some sporadic pinholes, all other NiO and ZnO compositions showed fully dense morphology. Interestingly, the grain size monotonically increased with increasing sintering aid content for both NiO and ZnO. In general, ZnO showed bigger grain size compared to NiO for 3 and 5 mol% concentrations. For example, for 5 mol% concentration, grain size varied from 0.2 to 0.8 µm for ZnO, whereas it varied from 0.1 to 0.4 µm for NiO.
EDS mapping (Figure 5I,J) of 5 mol% ZnOBCZY showed an uneven distribution of Y2O3 as uniformly sized spheres (~ 10 µm diameter) on the sample surface. This is in good agreement with XRD results that depicted trace amounts of Y2O3 for 5 mol% ZnO. In a recent work on BaCe0.6Zr0.2(Y,Gd)0.2O3−δ with 4 mol% of Zn, Zamudio-García et al. [35] have shown for the very first time the presence of impurity phase BaGd2ZnO5 with an orthorhombic symmetry. This phase was confirmed through HAADF-STEM/EDS and XRD and has a lattice parameter very similar to Y2O3. Thus, purely based on XRD, it is difficult to assign phases, especially for similar lattice parameters. However, in the current work, the SEM-EDS maps clearly confirm the presence of Y2O3.
While it is hard to establish the sintering mechanism of NiO- and ZnO-added BCZY without in situ characterization like in situ high-temperature XRD, we surmise that there are two possible ways of explaining the enhanced sinterability of BCZY in the presence of a sintering aid. The first possibility is the commonly accepted theory based on liquid phase melting [20,36,37,38] Eutectic mixtures of BaO and ZnO melt around 1100°C, whereas mixtures of BaO and NiO melt around 1080°C. Their liquid phase reacts with excess Y component in the perovskite forming BaY2MO5 (M = Ni or Zn), and this complex liquid phase enhances the densification of the doped perovskite. The phase is unstable at temperatures exceeding 1200 °C and is thus not detected in XRD [20,36,37,38]. This explanation aligns well with our dilatometer studies (Figure 2A) that reflect how NiO- and ZnO-added samples start shrinking between 900 and 1000 °C, whereas pure BCZY starts shrinking only around 1200 °C. The second possibility could be volatilization of ZnO and enhancing sinterability via vapor-phase transport. This could also be the reason for detecting no ZnO in XRD. However, volatilization is affected by various parameters like temperature, gas environment, and vaporization thermodynamics of different mixed-oxide systems. While volatilization of ZnO in ZnAl2O4–2Al2O3 [39] and ZnO–SnO2 [40] systems has been reported, there is no literature available on ZnO-BCZY- or NiO-BCZY-based systems.

3.3. Conductivity Studies

Figure 6 shows the Nyquist representation of impedance results of the six different samples. As seen from Figure 6A–F, 1 and 5 mol% NiO added samples showed three distinct arcs, whereas 3 mol% NiO (Figure 6B) and all ZnO samples (Figure 7A–C) depicted two clear arcs. According to the literature [38,41,42], the first semicircle at higher frequency is due to bulk grain resistance, the second semicircle at mid-frequency represents grain boundary resistance, and the third low-frequency semicircle can be attributed to electrode polarization. At elevated temperatures, the arcs related to bulk grain and the grain boundary are merged together into one semicircle, indicating a decrease in grain resistance [43]. Thus, the higher-frequency intercept at the x-axis provided the values of ohmic resistance (Rohm) that were used to calculate the total conductivity of the samples. As expected, Rohm gradually decreased with temperature for all NiOBCZY and ZnOBCZY samples since ionic conductivity increases with temperature [20,44,45]. At any particular temperature, Rohm increased with increasing sintering aid content. As seen from the SEM images (Figure 5), the grain sizes became bigger with higher sintering aid content. Although bigger grains reduce the number of grain boundaries and thus the grain boundary resistance [16], they increase the bulk grain resistance since the ions (protons in this case) now have to travel a longer path across the grain itself. This can lead to a higher Rohm as envisaged here. It is also observed that the low-frequency semicircle shrank in size with temperature, indicating Ag electrode activation. Such activation encompasses (1) improved mass transfer processes like gas diffusion and adsorption/desorption, as well as (2) improved charge transfer processes at the gas–ion–electron triple phase boundary (TPB). However, trends depicted by electrode polarization are not a major concern for studies involving the determination of ionic conductivities of ceramic electrolyte materials.
Recent studies reported that proton-conducting solid oxide cells possess large impedances (~106 Hz) due to slow proton transfer at the electrolyte–electrode–gas triple phase boundary (TPB) [46,47,48,49]. Thus, it is possible that Rohm encompasses some resistive contribution from the TPB in addition to the total resistance of the electrolyte. However, it is assumed that such ohmic contribution from TPB would be similar for all ZnOBCZY and NiOBCZY samples, thus giving a correct representation of the comparison of their conductivities. Absolute values of total, bulk and grain boundary conductivities can be determined using equivalent circuit fitting.
For comparison, the conductivities of all samples, along with BCZY sintered at 1350 °C, have been shown in Figure 8A. Clearly, both sintering aids significantly improved the proton conductivity of BCZY. In fact, above 500 °C, the increase was more than an order of magnitude. During the sintering [15], the metal oxide (MO) decomposition and bulk diffusion of metal into BCZY perovskites cause a commensurate increase in the bulk oxygen vacancy concentration as follows [50]:
M O M Z r + V O . . + O O x
The higher oxygen vacancy concentration could further promote bulk diffusion and enhance sintering.

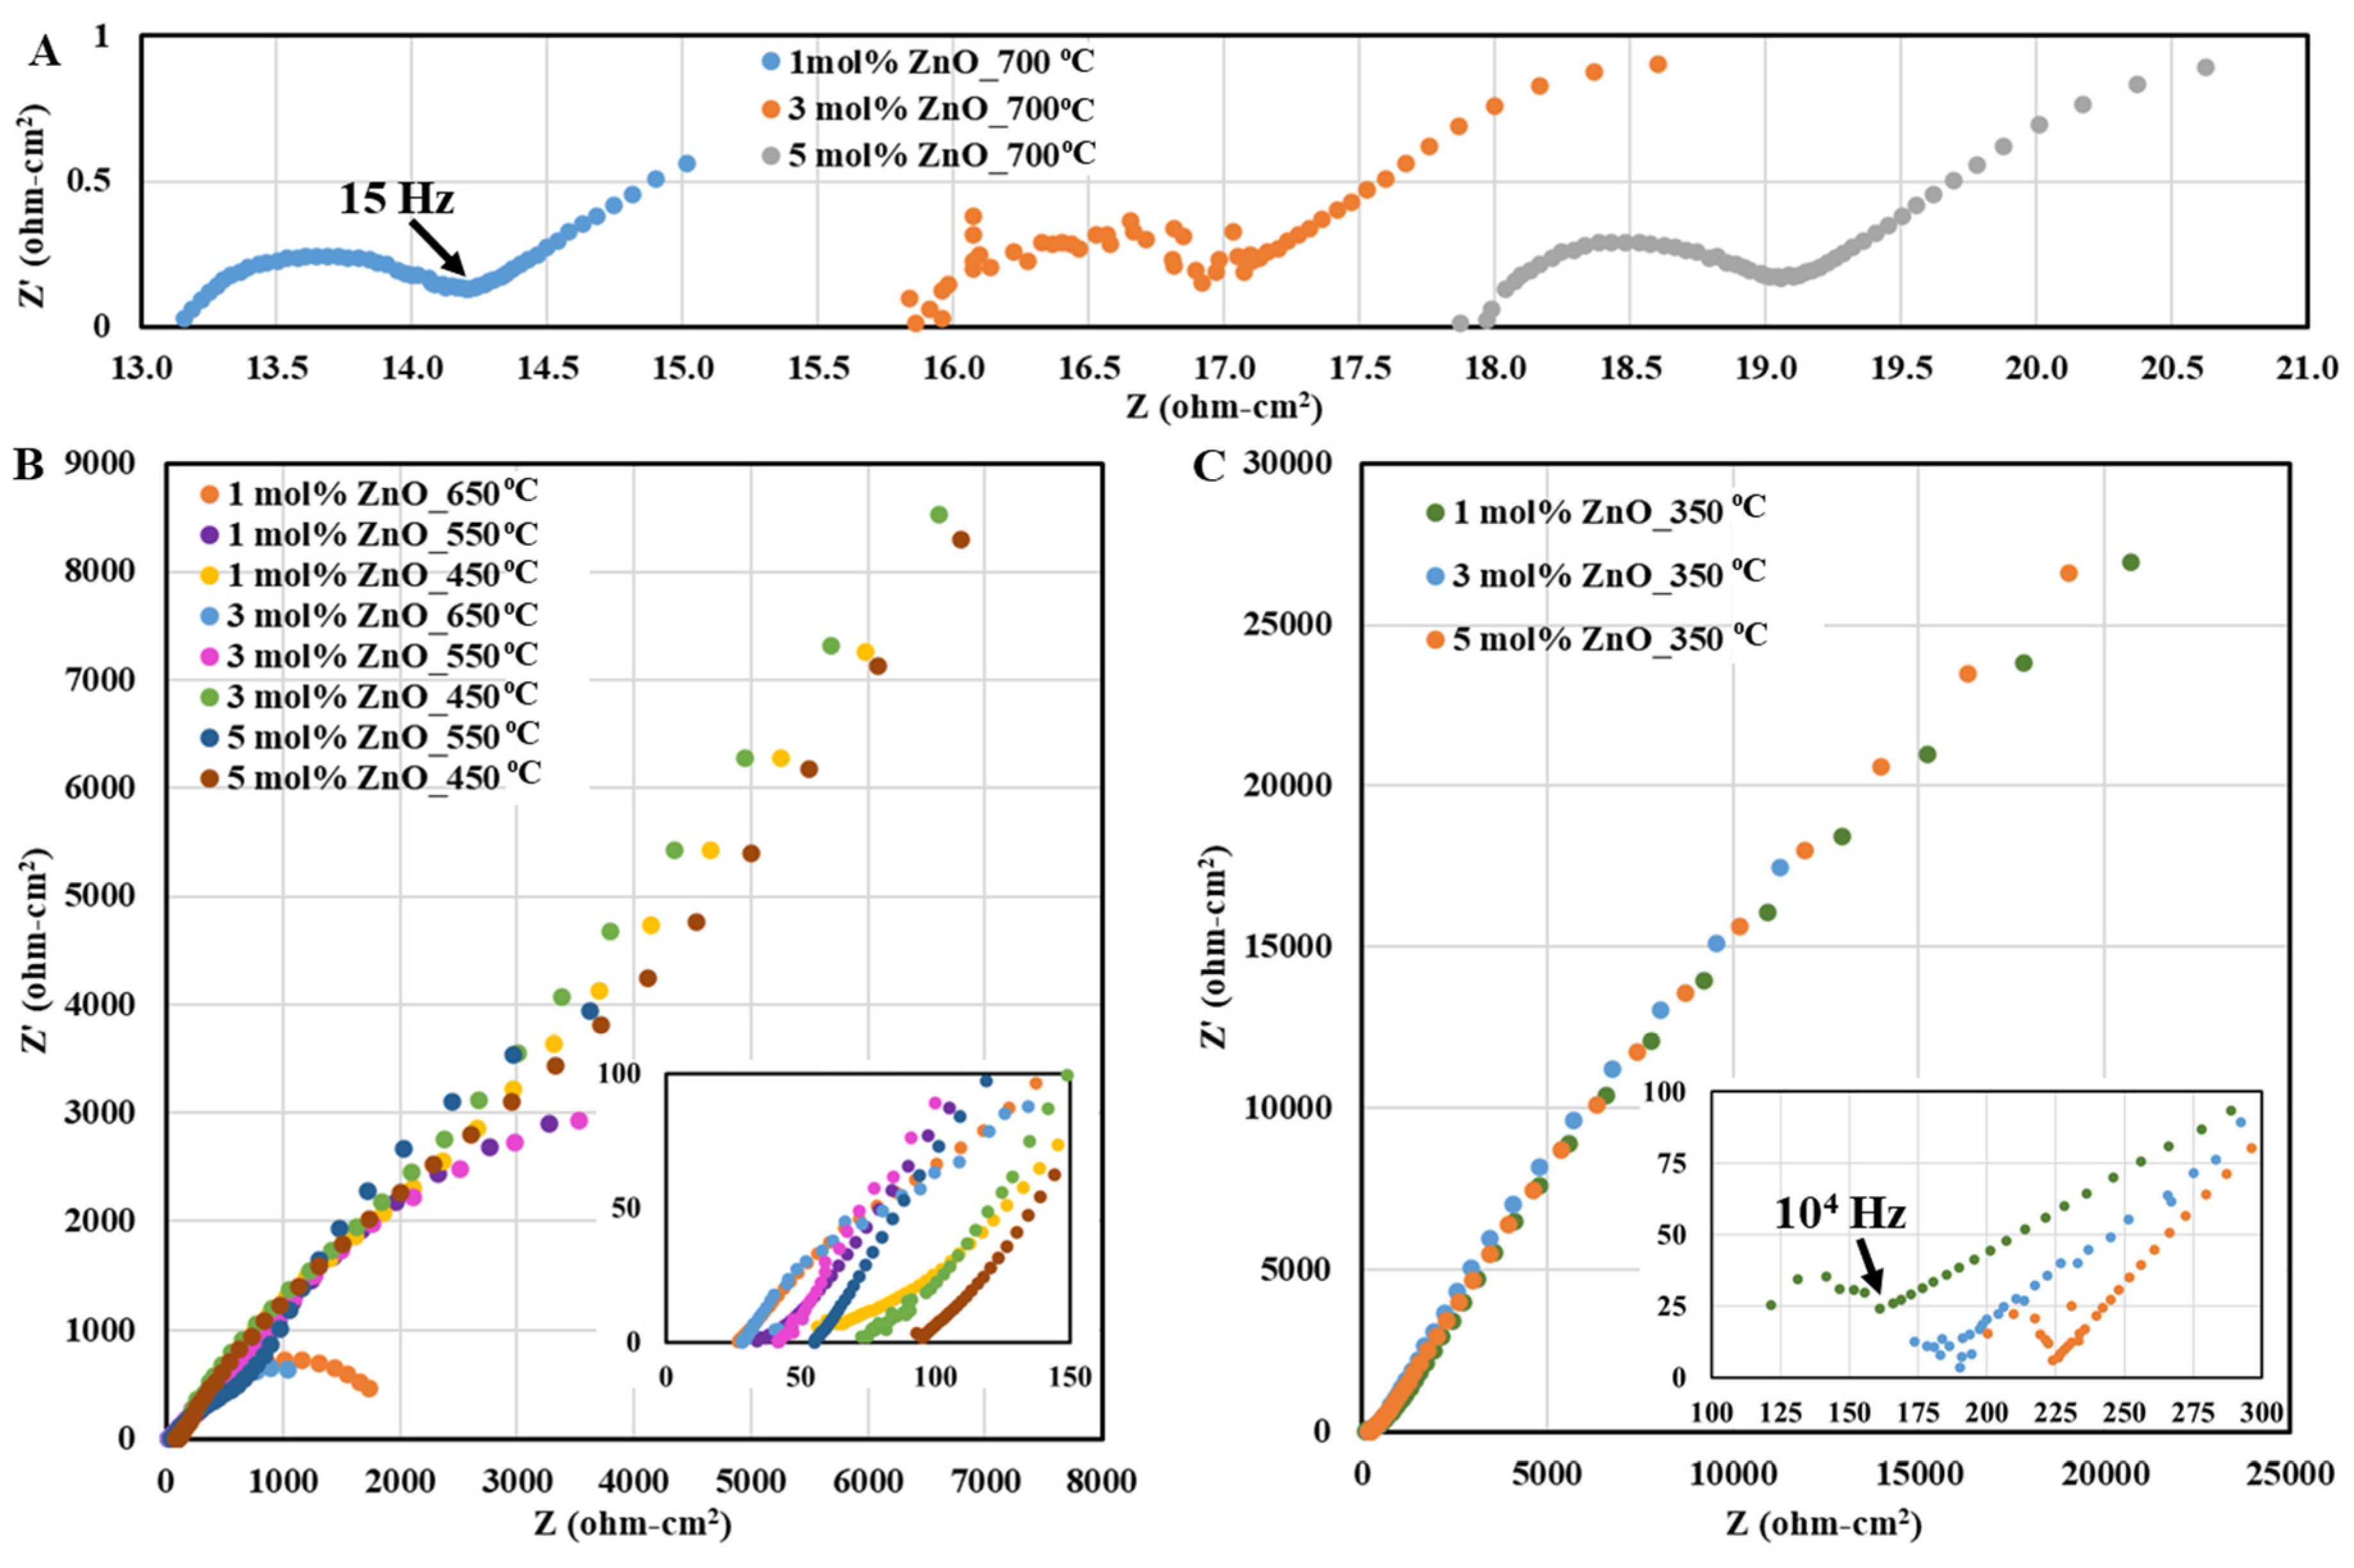
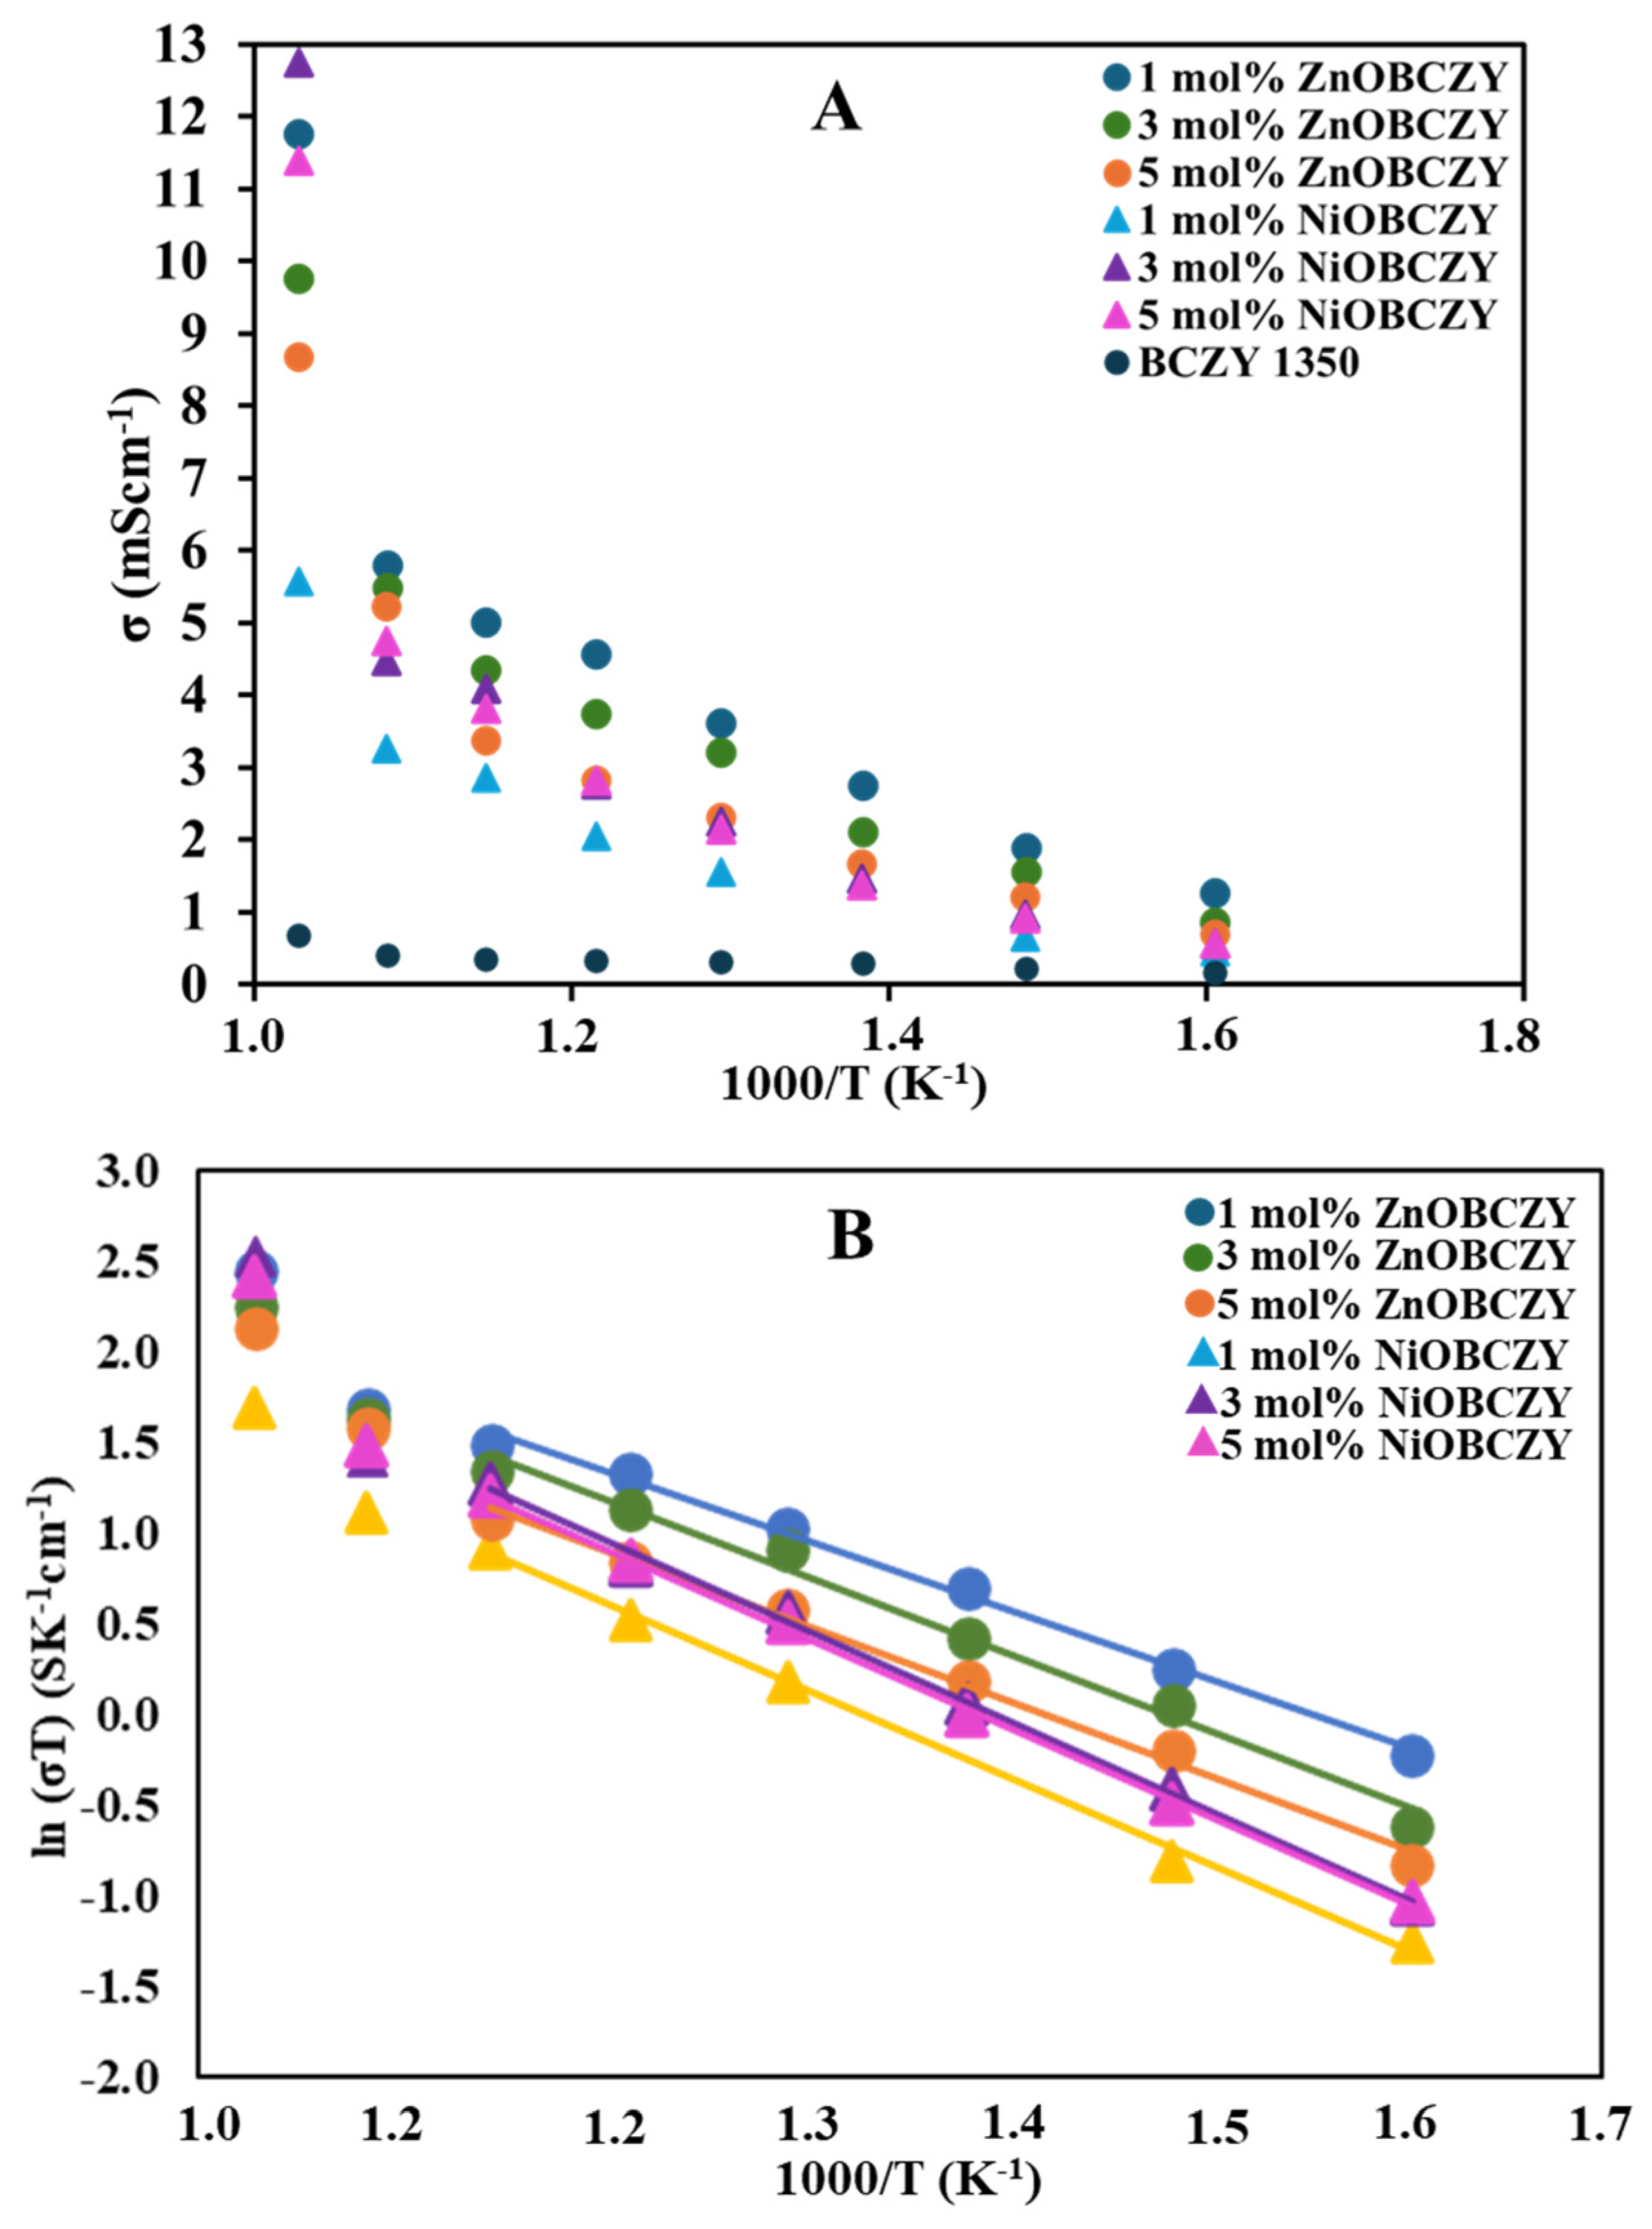
3.3.1. Analysis of ZnOBCZY Conductivity Trends

Out of the three ZnO concentrations, 1 mol% ZnO has shown the highest conductivity of 5.02 mS/cm at 600 °C, although the highest density had been obtained with 5 mol% ZnO. It is to be noted that 5 mol% ZnO showed the presence of secondary phase Y2O3 and the accumulation of such phases at the ends of grain boundaries caused increased grain boundary resistances. So far, the highest reported conductivity at 600 °C is 7.4 mS/cm, but with higher cerium content (70 mol%) in the electrolyte. According to the literature, proton activation energy increases with a decrease in Ce content due to the difference in the electronegativity of Zr4+ and Ce4+ ions occupying the perovskite B-site and higher repulsive interactions between Zr and H than Ce and H. Another reason could be that, in a reducing atmosphere, Ce4+ gets reduced to Ce3+, creating oxygen vacancies that contribute some oxide ion conductivity, especially under wet conditions. In fact, some research studies [43,51,52] have clearly indicated that a higher Ce/Zr ratio gives higher conductivity, but a much lower proton transference number. The highest conductivity reported so far with Ce/Zr ratio <1 is 4.02 mS/cm at 700 °C with 2 wt% ZnO (sintered at 1100 °C) (6) and 4.80 mS/cm at 600 °C with 4 mol% NiO (sintered at 1400 °C) [37]. We have achieved 5.02 mS/cm at 600 °C with just 20 mol% cerium content and 1 mol% ZnO addition.

3.3.2. Analysis of NiOBCZY Conductivity Trends

The conductivity trend of NiOBCZY samples can be explained in light of the size of grains, number of grain boundaries, and presence of NiO at the grain boundaries. Increasing NiO concentration from 1 to 3 mol% tripled the grain size, thus decreasing the number of grain boundaries. This is expected to improve grain boundary conductivity with a commensurate increase in total conductivity [16]. However, with a further increase in NiO concentration from 3 to 5 mol%, the grain size increased marginally, (Figure 5), and additional NiO accumulated at the grain boundaries, as can be seen from XRD (Table 2), that might have led to the slight dip in total conductivity compared to 3 mol% NiO. Previous research [15,53] has also shown that excess sintering accumulation at grain boundaries causes a decline in conductivity. For example, Lee et al. [15] fabricated BaCe0.6Zr0.2Y0.2O3−δ (BCZY) electrolyte using 1, 3 and 5 wt% NiO sintering aid (co-sintered with anode at 1500 °C for 10 h) and obtained power densities (800 °C in 3% humidified hydrogen) of ~75 mW/cm2, ~110 mW/cm2 and 65 mW/cm2 with 1, 3 and 5 wt% NiO addition, respectively. The drop in performance from 3 to 5 wt% was attributed to lower electrolyte conductivity resulting from NiO aggregation at grain boundaries.

3.3.3. Comparison of NiOBCZY and ZnOBCZY Conductivity Trends

In the present study, up to 650 °C, the conductivity of ZnOBCZY samples followed the general trend 1 mol% > 3 mol% > 5 mol%. In contrast, NiOBCZY samples followed the trend 1 mol% < 3 mol% > 5 mol%. This anomaly can be explained in light of XRD phase analysis and SEM-assisted microstructural analysis. As already mentioned before, XRD of ZnOBCZY samples showed no ZnO phase but a slight yet gradual peak shift of BCZY to a higher Bragg’s angle (Figure 4), indicating complete Zn incorporation into the BCZY lattice. A higher ZnO concentration means more Zn incorporation into the BCZY lattice, which, according to some previous works [17,54,55], leads to a greater extent of oxygen vacancy formation and, hence, enhanced proton trapping. This reduces the bulk conductivity, with gradually increasing ZnO concentration that gets manifested as an overall lower total conductivity, as well. NiOBCZY samples also showed a slight BCZY peak shift; however, unlike ZnO, NiO was detected as a secondary phase in 3 and 5 mol% NiOBCZY samples, indicating its presence at the grain boundaries. That ZnO completely dissolved into lattice unlike NiO is also evident from the grain sizes, as captured in SEM. Grain sizes were 0.1, 0.3 and 0.4 µm for 1, 3 and 5 mol% NiO, respectively. While 1 mol% ZnO also had a grain size of ~0.1 µm, 3 and 5 mol% had grain sizes of 0.4 and 0.8 µm, respectively. It is generally believed that sintering aid dissolution into the perovskite lattice results in more developed grains compared to when the sintering aid is present at the grain boundaries. For example, Wang et al. [16] used 4 mol% NiO as a dopant for BaZr0.1Ce0.7Y0.2O3−δ and the synthesis was done via internal addition (sol–gel method, denoted as BCZNY) and external addition (mechanical mixing, denoted as BCZYNi). BCZNY showed evidence of Ni dissolution into the BCZY lattice in XRD and, interestingly, its grains were more developed (~10 µm) than BCZYNi (3 µm). The crux is that, in this work, while all Zn dissolves into the lattice (for 1 to 5 mol% addition), Ni goes inside the lattice as well as accumulating at the grain boundaries. Thus, in the case of ZnO, there is only one phenomenon happening (dissolution into lattice with a commensurate increase in proton trapping), whereas for NiO two phenomena are happening (dissolution into the lattice as well as accumulation at the grain boundaries). A second important thing is the activation energies associated with proton hopping. According to a recent DFT study (26), a proton is unable to migrate until it has passed two energy barriers: energy needed for the proton to hop from one oxygen vacancy to another and energy needed for the proton to spin. The first energy barrier is highly affected by the BCZY microstructure (grain size, number of grain boundaries and presence of pinholes).
It is also noteworthy that ZnO has shown higher conductivity compared to NiO for equal mol% concentration. From morphological interpretation, one reason could be a bigger grain size of ZnO (for 3 and 5 mol%) compared to NiO (Figure 5C–H), leading to lesser grain boundary resistance and improved overall conductivity [28]. For 1 mol% loading, the grain sizes were similar for both NiO and ZnO; however, NiO contained some pinholes. Such pinholes and closed pores have been previously reported to increase bulk resistivity [16,17]. Another possibility from phase analysis could be the complete Zn incorporation inside the BCZY lattice, as seen from XRD (Figure 3B), leaving no traces of any Zn-containing secondary phases at the grain boundaries. According to the literature, the absence of secondary oxide phases improves proton conductivity. Nonetheless, it is still ambiguous as to how such negligibly small amounts of sintering aid can affect the electrical properties of BCZY. At 700 °C, however, 1 and 3 mol% NiO outperformed ZnO, possibly due to higher contribution from hole conduction for NiO [41]. Table 3 shows a comparison of electrolyte conductivity achieved in this work with the other relevant literature.
Figure 8B shows the Arrhenius plots of the bulk conductivities of the ZnOBCZY and NiOBCZY samples. For all samples, points up to 600 °C could be fitted with a perfectly straight line with a regression value (R2) > 0.99. However, beyond 600 °C the trend was non-linear. This is in good compliance with the literature and can be explained in light of partial conductivities.
Total conductivity (σtotal) is the sum of proton (σH+), oxygen vacancy (σVo) and hole (σh) conductivities (Equation (4)) that depend on the concentration of charge and mobility (µ) of the charge carrier (Equation (5)).
σ t o t a l = σ H + + σ V o + σ h
σ t o t a l = ( μ h h + 2 μ V o V O + μ H + H + ) e N A V m
where μi is the mobility of the charge carrier i, e is the electron charge, NA is Avogadro’s number, and Vm is the molar volume of BCZY. In reducing atmospheres, σH+ dominates; however, σVo and σh dominate at higher temperatures, irrespective of oxygen partial pressure [41,58]. In a detailed study, Lim et al. [58] showed that above 700 °C the major charge carriers shift from protons to holes and/or oxygen vacancies, resulting in a spike in total conductivity. Similar findings have been reported by Lybye et al. [59] while investigating the ionic conductivity of doped LaScO3. This explains the sudden rise in total conductivity (by ~ a factor of 2) above 650 °C envisaged in this work. However, the exact reason for such transition from σH+ to σh is still unclear. In general, two mechanisms have been proposed for water/steam uptake in proton-conducting ceramics. According to the first one (M1) [60], steam is dissolved onto an oxygen vacancy to create two protons (Equation (6)). The second mechanism (M2) [61] states that steam incorporation takes place with the simultaneous consumption of two holes, leading to the formation of two protons (Equation (7)).
H 2 O g + V O = 2 H + + O O
H 2 O g + 2 h = 2 H + + 0.5 O 2
Although the number of protons generated are the same for both mechanisms, the number of holes is suppressed in the latter (M2), resulting in the domination of σH+ (Equation (5)) [43]. It is possible that the steam uptake mechanism switches from M2 to M1 at and above 700 °C, marking the transition from protonic to hole conductivity dominance. In fact, Lybye et al. [59] have reported that at higher temperatures steam gets absorbed by oxygen vacancies, resulting in low σH+. They also mentioned that variation of protonic defect concentrations with temperature caused bending of the Arrhenius curves, as has been observed in this work. Thus, based on the literature, it can be concluded that the change in slope of Arrhenius plots above 600 °C is due to variation in proton concentration and possible transition from protonic to hole conductivity. For the linear part of the plots (up to 600 °C), 1 mol% ZnO gave the lowest activation energy of 0.33 eV followed by 5 mol% (0.36 eV) and 3 mol% (0.37 eV). These values were lower than NiO, which followed the order 1 mol% (0.41 eV) < 3 mol% (0.42 eV) < 5 mol% (0.43 eV).

4. Conclusions

Yttrium-doped barium cerium zirconate (BaCexZr1−x−yYyO3−δ) has been one of the most widely reported proton-conducting electrolytes for intermediate-temperature solid oxide fuel cell or electrolysis operation. The major challenge of this material is its high sintering temperature (>1500 °C) that limits the choice of electrode materials, especially under co-sintering scenarios.
This work evaluates the effect of NiO and ZnO addition in three different loadings (1, 3, 5 mol%) on the sintering and electrical properties of BaCe0.2Zr0.7Y0.1O3−δ. This BCZY composition with a Ce/Zr molar ratio <1 was selected intentionally to avoid any chances of hole conduction, as is reported in the literature. Sintering aids were added using a wet ball-milling technique to achieve more uniform distribution than dry milling, but at a faster pace and with lesser complexity than other wet chemistry techniques like the sol–gel method, Pechini method, citrate–nitrate combustion method or wet impregnation methods.
The sintering temperature dropped from 1600 °C (for pure BCZY) to 1350 °C upon sintering aid addition while achieving >95% densification. In general, ZnO showed higher densification than NiO for equal loading, the highest being 99% for 5 mol% ZnO loading. Such higher densification for ZnO can be attributed to ZnOBCZY samples attaining complete shrinkage at temperatures lower than NiOBCZY. Up to 650 °C in 5% humidified H2/N2 (5:95 v/v), ZnO showed higher conductivity compared to NiO for equal loading. This has been related to a higher extent of Zn incorporation inside the BCZY lattice, as seen from the X-ray diffractogram.
At 600 °C, 1 mol% ZnOBCZY showed the highest conductivity of 5.02 mS/cm, which is, in fact, higher than what has been reported so far in the literature for a Ce/Zr molar ratio <1. At 700 °C, however, 3 mol% NiO outperformed ZnO and exhibited a conductivity of 12.76 mS/cm, possibly due to higher hole conduction. The Arrhenius plots for all samples showed linear and non-linear trends up to and beyond 600 °C, respectively. This indicates a shift from purely proton-dominated to a mixed (proton + oxide ion + hole) conduction, possibly due to a transition in the steam uptake and proton conduction mechanism [58,59,62,63]. Oxide ion conduction at higher temperatures can be attributed to in situ Ce4+→Ce3+ conversion accompanied by oxygen vacancy generation in partially reducing atmospheres. Nonetheless, in this work, for the linear part of the Arrhenius plots (up to 600 °C), ZnO showed lower activation energy than NiO, with the lowest being 0.33 eV for 1 mol% ZnO.
Based on the above findings, it can be concluded that ZnO is a better option than NiO in terms of both densification (guarantees no gas-crossover) and conductivity (guarantees higher cell performance) in the intermediate temperature range of 400 to 600 °C, with 1 mol% ZnO looking to be the most promising candidate. However, further research is in progress to investigate the effect of sintering duration on the grain growth and thus the conductivities of NiOBCZY and ZnOBCZY. Moreover, further work based on varying the steam partial pressures in a concentration cell is needed to accurately determine protonic conductivity for a better understanding of the ion transport mechanism in both NiOBCZY and ZnOBCZY synthesized under identical conditions.

Supplementary Materials

The following supporting information can be downloaded at: https://www.mdpi.com/article/10.3390/ceramics8020078/s1, Figure S1: SEM image of BCZY powder before and after 2 h ball-milling at 350 rpm; Figure S2: Incremental volume percentage as a function of particle diameter of BCZY powder before and after 2 h ball-milling at 350 rpm.

Author Contributions

Conceptualization, S.B. and G.K.; Methodology, S.B.; Investigation, S.V. and A.S.; Resources, G.K. and S.G.; Data curation, S.B.; Writing—original draft, S.B. and S.G.; Writing—review & editing, G.K.; Supervision, S.G. All authors have read and agreed to the published version of the manuscript.

Funding

This research received no external funding.

Data Availability Statement

The original contributions presented in this study are included in the article/Supplementary Material. Further inquiries can be directed to the corresponding authors.

Acknowledgments

The authors would like to acknowledge the financial support provided to the project by Future Science Platform, CSIRO. The authors appreciate Sathia Aruliah, David Vella and Gabriel Machado Silva’s help with pressing samples. The authors also acknowledge the assistance of Mark Greaves (CSIRO Manufacturing) with scanning electron microscopic imaging.

Conflicts of Interest

The authors declare no conflict of interest.

References

  1. Iwahara, H.; Esaka, T.; Uchida, H.; Maeda, N. Proton conduction in sintered oxides and its application to steam electrolysis for hydrogen production. Solid State Ion. 1981, 3, 359–363. [Google Scholar] [CrossRef]
  2. Sailaja, J.M.; Murali, N.; Babu, K.V.; Veeraiah, V. Effect of Strontium the phase structure of Ba1−xSrxCe0.65Zr0.2Y0.15O3−δ (0≤ x ≤ 0.25) proton conductor by citrate–EDTA complexing sol–gel method. J. Asian Ceram. Soc. 2017, 5, 18–30. [Google Scholar] [CrossRef]
  3. Lv, J.; Wang, L.; Lei, D.; Guo, H.; Kumar, R. Sintering, chemical stability and electrical conductivity of the perovskite proton conductors BaCe0.45Zr0.45M0.1O3−δ (M = In, Y, Gd, Sm). J. Alloys Compd. 2009, 467, 376–382. [Google Scholar] [CrossRef]
  4. Lyagaeva, J.; Antonov, B.; Dunyushkina, L.; Kuimov, V.; Medvedev, D.; Demin, A.; Tsiakaras, P. Acceptor doping effects on microstructure, thermal and electrical properties of proton-conducting BaCe0.5Zr0.3Ln0.2O3−δ (Ln = Yb, Gd, Sm, Nd, La or Y) ceramics for solid oxide fuel cell applications. Electrochim. Acta 2016, 192, 80–88. [Google Scholar] [CrossRef]
  5. Lin, B.; Zhang, S.; Zhang, L.; Bi, L.; Ding, H.; Liu, X.; Gao, J.; Meng, G. Prontonic ceramic membrane fuel cells with layered GdBaCO2O5+x cathode prepared by gel-casting and suspension spray. J. Power Sources 2008, 177, 330–333. [Google Scholar] [CrossRef]
  6. Rashid, N.L.R.M.; Samat, A.A.; Jais, A.A.; Somalu, M.R.; Muchtar, A.; Baharuddin, N.A.; Isahak, W.N.R.W. Review on zirconate-cerate-based electrolytes for proton-conducting solid oxide fuel cell. Ceram. Int. 2019, 45, 6605–6615. [Google Scholar] [CrossRef]
  7. Choi, S.M.; Lee, J.H.; An, H.; Hong, J.; Kim, H.; Yoon, K.J.; Son, J.W.; Kim, B.K.; Lee, H.W.; Lee, J.H. Fabrication of anode-supported protonic ceramic fuel cell with Ba(Zr0.85Y0.15)O3−δ–Ba(Ce0.9Y0.1)O3−δ dual-layer electrolyte. Int. J. Hydrogen Energy 2014, 39, 12812–12818. [Google Scholar] [CrossRef]
  8. He, F.; Song, D.; Peng, R.; Meng, G.; Yang, S. Electrode performance and analysis of reversible solid oxide fuel cells with proton conducting electrolyte of BaCe0.5Zr0.3Y0.2O3−δ. J. Power Sources 2010, 195, 3359–3364. [Google Scholar] [CrossRef]
  9. Nasani, N.; Ramasamy, D.; Mikhalev, S.; Kovalevsky, A.V.; Fagg, D.P. Fabrication and electrochemical performance of a stable, anode supported thin BaCe0.4Zr0.4Y0.2O3−δ electrolyte Protonic Ceramic Fuel Cell. J. Power Sources 2015, 278, 582–589. [Google Scholar] [CrossRef]
  10. Liu, Z.; Chen, M.; Zhou, M.; Cao, D.; Liu, P.; Wang, W.; Liu, M.; Huang, J.; Shao, J.; Liu, J. Multiple effects of iron and nickel additives on the properties of proton conducting yttrium-doped barium cerate-zirconate electrolytes for high-performance solid oxide fuel cells. ACS Appl. Mater. Interfaces 2020, 12, 50433–50445. [Google Scholar] [CrossRef]
  11. Babar, Z.U.D.; Hanif, M.B.; Gao, J.-T.; Li, C.-J.; Li, C.-X. Sintering behavior of BaCe0.7Zr0.1Y0.2O3−δ electrolyte at 1150 °C with the utilization of CuO and Bi2O3 as sintering aids and its electrical performance. Int. J. Hydrogen Energy 2022, 47, 7403–7414. [Google Scholar] [CrossRef]
  12. Yoo, Y.; Lim, N. Performance and stability of proton conducting solid oxide fuel cells based on yttrium-doped barium cerate-zirconate thin-film electrolyte. J. Power Sources 2013, 229, 48–57. [Google Scholar] [CrossRef]
  13. Baral, A.K. Reduction in sintering temperature of stable proton conductor BaCe0.35Zr0.5Y0.15O3−δ prepared by sol–gel method and its transport properties. Solid State Ion. 2015, 272, 107–111. [Google Scholar] [CrossRef]
  14. Tao, S.; Irvine, J.T. A stable, easily sintered proton-conducting oxide electrolyte for moderate-temperature fuel cells and electrolyzers. Adv. Mater. 2006, 18, 1581–1584. [Google Scholar] [CrossRef]
  15. Lee, K.R.; Tseng, C.J.; Jang, S.C.; Lin, J.C.; Wang, K.W.; Chang, J.K.; Chen, T.C.; Lee, S.W. Fabrication of anode-supported thin BCZY electrolyte protonic fuel cells using NiO sintering aid. Int. J. Hydrogen Energy 2019, 44, 23784–23792. [Google Scholar] [CrossRef]
  16. Wang, B.; Bi, L.; Zhao, X.S. Exploring the role of NiO as a sintering aid in BaZr0.1Ce0.7Y0.2O3−δ electrolyte for proton-conducting solid oxide fuel cells. J. Power Sources 2018, 399, 207–214. [Google Scholar] [CrossRef]
  17. Nasani, N.; Shakel, Z.; Loureiro, F.J.; Panigrahi, B.B.; Kale, B.B.; Fagg, D.P. Exploring the impact of sintering additives on the densification and conductivity of BaCe0.3Zr0.55Y0.15O3−δ electrolyte for protonic ceramic fuel cells. J. Alloys Compd. 2021, 862, 158640. [Google Scholar] [CrossRef]
  18. Viechineski, F.N.; Ramos, K.; Chinelatto, A.L.; Chinelatto, A.S.A. Optimizing the densification of BaCe0.2Zr0.7Y0.1O3−δ proton conducting electrolyte using Fe2O3, Mn2O3 and ZnO sintering aids. J. Mater. Sci. Mater. Electron. 2023, 34, 2165. [Google Scholar] [CrossRef]
  19. Wang, H.; Peng, R.; Wu, X.; Hu, J.; Xia, C. Sintering behavior and conductivity study of yttrium-doped BaCeO3–BaZrO3 solid solutions using ZnO additives. J. Am. Ceram. Soc. 2009, 92, 2623–2629. [Google Scholar] [CrossRef]
  20. Matsuda, R.M.; Nakamura, K.; Mori, M.; Dailly, J. Sintering mechanism and electrical conductivity of ZnO added BaCe0.8Zr0.1Y0.1O3−δ proton conducting perovskites. Solid State Ion. 2023, 403, 116407. [Google Scholar] [CrossRef]
  21. Peng, C.; Zhao, B.; Meng, X.; Ye, X.; Luo, T.; Xin, X.; Wen, Z. Effect of NiO Addition on the Sintering and Electrochemical Properties of BaCe0.55Zr0.35Y0.1O3−δ Proton-Conducting Ceramic Electrolyte. Membranes 2024, 14, 61. [Google Scholar] [CrossRef] [PubMed]
  22. Huang, Y.; Yu, J.; Tian, N.; Zheng, J.; Qu, Y.; Tan, W.; Luo, Y. Performance of BaCe0.8Y0.2O3−δ Proton Electrolyte Materials for Solid Oxide Fuel Cells by Compositing the Transition Metal Oxide NiO. Coatings 2022, 12, 1692. [Google Scholar] [CrossRef]
  23. Ge, L.; Jiao, J.; Zhang, Q.; Zheng, Y.; Chen, H.; Guo, L. A facile method to fabricate proton-conducting BaZr0.85Y0.15O3−δ electrolyte with a large grain size and high conductivity. Ceram. Int. 2019, 45, 24946–24952. [Google Scholar] [CrossRef]
  24. Hakim, M.; Joo, J.H.; Yoo, C.-Y.; Kim, B.-K.; Yu, J.H. Enhanced chemical stability and sinterability of refined proton-conducting perovskite: Case study of BaCe0.5Zr0.3Y0.2O3−δ. J. Eur. Ceram. Soc. 2015, 35, 1855–1863. [Google Scholar] [CrossRef]
  25. Chien, R.; Tu, C.-S.; Schmidt, V.H.; Lee, S.-C.; Huang, C.-C. Synthesis and characterization of proton-conducting Ba(Zr0.8−xCexY0.2)O2.9 ceramics. Solid State Ion. 2010, 181, 1251–1257. [Google Scholar] [CrossRef]
  26. Amsif, M.; Marrero-López, D.; Ruiz-Morales, J.; Savvin, S.; Núñez, P. The effect of Zn addition on the structure and transport properties of BaCe0.9−xZrxY0.1O3−δ. J. Eur. Ceram. Soc. 2014, 34, 1553–1562. [Google Scholar] [CrossRef]
  27. Hagy, L.; Ramos, K.; Gelfuso, M.; Chinelatto, A.; Chinelatto, A. Effects of ZnO addition and microwave sintering on the properties of BaCe0.2Zr0.7Y0.1O3−δ proton conductor electrolyte. Ceram. Int. 2023, 49, 17261–17270. [Google Scholar] [CrossRef]
  28. Reddy, G.S.; Bauri, R. A novel route to enhance the sinterability and its effect on microstructure, conductivity and chemical stability of BaCe0.4Zr0.4Y0.2O3−δ proton conductors. Mater. Chem. Phys. 2018, 216, 250–259. [Google Scholar] [CrossRef]
  29. Azad, A.K.; Savaniu, C.; Tao, S.; Duval, S.; Holtappels, P.; Ibberson, R.M.; Irvine, J.T. Structural origins of the differing grain conductivity values in BaZr0.9Y0.1O2.95 and indication of novel approach to counter defect association. J. Mater. Chem. 2008, 18, 3414–3418. [Google Scholar] [CrossRef]
  30. Han, D.; Otani, Y.; Noda, Y.; Onishi, T.; Majima, M.; Uda, T. Strategy to improve phase compatibility between proton conductive BaZr0.8Y0.2O3−δ and nickel oxide. RSC Adv. 2016, 6, 19288–19297. [Google Scholar] [CrossRef]
  31. Loureiro, F.J.; Nasani, N.; Reddy, G.S.; Munirathnam, N.; Fagg, D.P. A review on sintering technology of proton conducting BaCeO3-BaZrO3 perovskite oxide materials for Protonic Ceramic Fuel Cells. J. Power Sources 2019, 438, 226991. [Google Scholar] [CrossRef]
  32. Rabiei, M.; Palevicius, A.; Monshi, A.; Nasiri, S.; Vilkauskas, A.; Janusas, G. Comparing methods for calculating nano crystal size of natural hydroxyapatite using X-Ray diffraction. Nanomaterials 2020, 10, 1627. [Google Scholar] [CrossRef] [PubMed]
  33. Chen, M.; Zhou, M.; Liu, Z.; Liu, J. A comparative investigation on protonic ceramic fuel cell electrolytes BaZr0.8Y0.2O3−δ and BaZr0.1Ce0.7Y0.2O3−δ with NiO as sintering aid. Ceram. Int. 2022, 48, 17208–17216. [Google Scholar] [CrossRef]
  34. Liu, Z.; Wang, X.; Liu, M.; Liu, J. Enhancing sinterability and electrochemical properties of Ba(Zr0.1Ce0.7Y0.2)O3−δ proton conducting electrolyte for solid oxide fuel cells by addition of NiO. Int. J. Hydrogen Energy 2018, 43, 13501–13511. [Google Scholar] [CrossRef]
  35. Zamudio-García, J.; Porras-Vázquez, J.M.; dos Santos-Gómez, L.; Losilla, E.R.; Marrero-López, D. Effect of Zn addition on the structure and electrochemical properties of co-doped BaCe0.6Zr0.2Ln0.2O3−δ (Ln = Y, Gd, Yb) proton conductors. Ceram. Int. 2018, 44, 14113–14121. [Google Scholar] [CrossRef]
  36. Huang, Y. Proton Conducting Electrolytes for Ceramic Fuel Cells. Doctoral Dissertation, University of Stuttgart, Stuttgart, Germany, 2020. [Google Scholar]
  37. An, H.; Shin, D.; Ji, H.-I. Effect of nickel addition on sintering behavior and electrical conductivity of BaCe0.35Zr0.5Y0.15O3−δ. J. Korean Ceram. Soc. 2019, 56, 91–97. [Google Scholar] [CrossRef]
  38. Tong, J.; Clark, D.; Bernau, L.; Sanders, M.; O’Hayre, R. Solid-state reactive sintering mechanism for large-grained yttrium-doped barium zirconate proton conducting ceramics. J. Mater. Chem. 2010, 20, 6333–6341. [Google Scholar] [CrossRef]
  39. Xu, P.; Wang, H.; Zheng, K.; Chen, B.; Yang, M.; Chen, Q.; Wang, B.; Tu, B.; Wang, W.; Fu, Z. Novel transparent ZnO·3Al2O3 ceramics prepared by reactive hot isostatic pressing. J. Eur. Ceram. Soc. 2022, 42, 724–728. [Google Scholar] [CrossRef]
  40. Gribchenkova, N.A.; Steblevsky, A.V.; Alikhanyan, A.S. Vaporization thermodynamics of the ZnO–SnO2 system. J. Chem. Thermodyn. 2014, 70, 203–206. [Google Scholar] [CrossRef]
  41. Ji, H.-I.; Kim, B.-K.; Son, J.-W.; Yoon, K.J.; Lee, J.-H. Influence of sintering activators on electrical property of BaZr0.85Y0.15O3−δ proton-conducting electrolyte. J. Power Sources 2021, 507, 230296. [Google Scholar] [CrossRef]
  42. Bi, L.; Shafi, S.P.; Traversa, E. Y-doped BaZrO3 as a chemically stable electrolyte for proton-conducting solid oxide electrolysis cells (SOECs). J. Mater. Chem. A 2015, 3, 5815–5819. [Google Scholar] [CrossRef]
  43. Zhao, L.; Tan, W.; Zhong, Q. The chemical stability and conductivity improvement of protonic conductor BaCe0.8−xZrxY0.2O3−δ. Ionics 2013, 19, 1745–1750. [Google Scholar] [CrossRef]
  44. Chen, G.; Zhang, X.; Luo, Y.; He, Y.; Liu, H.; Geng, S.; Yu, K.; Dong, Y. Ionic conduction mechanism of a nanostructured BCY electrolyte for low-temperature SOFC. Int. J. Hydrogen Energy 2020, 45, 24108–24115. [Google Scholar] [CrossRef]
  45. Liang, K.; Nowick, A. High-temperature protonic conduction in mixed perovskite ceramics. Solid State Ion. 1993, 61, 77–81. [Google Scholar] [CrossRef]
  46. He, F.; Wu, T.; Peng, R.; Xia, C. Cathode reaction models and performance analysis of Sm0.5Sr0.5CoO3−δ–BaCe0.8Sm0.2O3−δ composite cathode for solid oxide fuel cells with proton conducting electrolyte. J. Power Sources 2009, 194, 263–268. [Google Scholar] [CrossRef]
  47. Wu, T.; Zhao, Y.; Peng, R.; Xia, C. Nano-sized Sm0.5Sr0.5CoO3−δ as the cathode for solid oxide fuel cells with proton-conducting electrolytes of BaCe0.8Sm0.2O2.9. Electrochim. Acta 2009, 54, 4888–4892. [Google Scholar] [CrossRef]
  48. Dailly, J.; Mauvy, F.; Marrony, M.; Pouchard, M.; Grenier, J.-C. Electrochemical properties of perovskite and A2MO4-type oxides used as cathodes in protonic ceramic half cells. J. Solid State Electrochem. 2011, 15, 245–251. [Google Scholar] [CrossRef]
  49. Toriumi, H.; Jeong, S.; Kitano, S.; Habazaki, H.; Aoki, Y. Enhanced performance of protonic solid oxide steam electrolysis cell of Zr-rich side BaZr0.6Ce0.2Y0.2O3−δ electrolyte with an anode functional layer. ACS Omega 2022, 7, 9944–9950. [Google Scholar] [CrossRef]
  50. Nikodemski, S.; Tong, J.; O’Hayre, R. Solid-state reactive sintering mechanism for proton conducting ceramics. Solid State Ion. 2013, 253, 201–210. [Google Scholar] [CrossRef]
  51. Sawant, P.; Varma, S.; Wani, B.; Bharadwaj, S. Synthesis, stability and conductivity of BaCe0.8−xZrxY0.2O33−δ as electrolyte for proton conducting SOFC. Int. J. Hydrogen Energy 2012, 37, 3848–3856. [Google Scholar] [CrossRef]
  52. Ricote, S.; Bonanos, N.; Manerbino, A.; Coors, W.G. Conductivity study of dense BaCexZr(0.9−x)Y0.1O(3−δ) prepared by solid state reactive sintering at 1500 °C. Int. J. Hydrogen Energy 2012, 37, 7954–7961. [Google Scholar] [CrossRef]
  53. Guo, Y.; Ran, R.; Shao, Z. A novel way to improve performance of proton-conducting solid-oxide fuel cells through enhanced chemical interaction of anode components. Int. J. Hydrogen Energy 2011, 36, 1683–1691. [Google Scholar] [CrossRef]
  54. Nasani, N.; Pukazhselvan, D.; Kovalevsky, A.V.; Shaula, A.L.; Fagg, D.P. Conductivity recovery by redox cycling of yttrium doped barium zirconate proton conductors and exsolution of Ni-based sintering additives. J. Power Sources 2017, 339, 93–102. [Google Scholar] [CrossRef]
  55. Tao, S.; Irvine, J.T. Conductivity studies of dense yttrium-doped BaZrO3 sintered at 1325 °C. J. Solid State Chem. 2007, 180, 3493–3503. [Google Scholar] [CrossRef]
  56. Lin, B.; Hu, M.; Ma, J.; Jiang, Y.; Tao, S.; Meng, G. Stable, easily sintered BaCe0.5Zr0.3Y0.16Zn0.04O3−δ electrolyte-based protonic ceramic membrane fuel cells with Ba0.5Sr0.5Zn0.2Fe0.8O3−δ perovskite cathode. J. Power Sources 2008, 183, 479–484. [Google Scholar] [CrossRef]
  57. Khan, K.; Qayyum, S.; Hanif, M.B.; Rauf, S.; Sultan, A.; Mosiałek, M.; Motola, M.; Lin, B. Design of efficient and durable symmetrical protonic ceramic fuel cells at intermediate temperatures via B-site doping of Ni in BaCe0.56Zr0.2Ni0.04Y0.2O3−δ. Ceram. Int. 2023, 49, 16826–16835. [Google Scholar] [CrossRef]
  58. Lim, D.-K.; Park, C.-J.; Choi, M.-B.; Park, C.-N.; Song, S.-J. Partial conductivities of mixed conducting BaCe0.65Zr0.2Y0.15O3–δ. Int. J. Hydrogen Energy 2010, 35, 10624–10629. [Google Scholar] [CrossRef]
  59. Lybye, D.; Bonanos, N. Proton and oxide ion conductivity of doped LaScO3. Solid State Ion. 1999, 125, 339–344. [Google Scholar] [CrossRef]
  60. Bonanos, N. Transport properties and conduction mechanism in high-temperature protonic conductors. Solid State Ion. 1992, 53, 967–974. [Google Scholar] [CrossRef]
  61. Uchida, H.; Maeda, N.; Iwahara, H. Relation between proton and hole conduction in SrCeO3-based solid electrolytes under water-containing atmospheres at high temperatures. Solid State Ion. 1983, 11, 117–124. [Google Scholar] [CrossRef]
  62. Basbus, J.F.; Arce, M.D.; Napolitano, F.R.; Troiani, H.E.; Alonso, J.A.; Saleta, M.E.; Gonzaález, M.A.; Cuello, G.J.; Fernaá;ndez-Díaz, M.T.; Sainz, M.P.; et al. Revisiting the crystal structure of BaCe0.4Zr0.4Y0.2O3−δ proton conducting perovskite and its correlation with transport properties. ACS Appl. Energy Mater. 2020, 3, 2881–2892. [Google Scholar] [CrossRef]
  63. Azimova, M.A.; McIntosh, S. Transport properties and stability of cobalt doped proton conducting oxides. Solid State Ion. 2009, 180, 160–167. [Google Scholar] [CrossRef]
Figure 1. Relative densities of pure BCZY sintered at 1550°C as well as 1, 3, 5 mol% NiOBCZY and 1, 3, 5 mol% ZnOBCZY sintered at 1350 °C.
Ceramics 08 00078 g001
Figure 2. Dilatometer results of pure BCZY together with 1, 3, and 5 mol% NiOBCZY and ZnOBCZY (A) sintering profile and (B) shrinkage rate as a function of temperature obtained by dilatometer in air.
Ceramics 08 00078 g002
Figure 3. X-ray diffractograms of pure BCZY powder and BCZY sintered at 1350 °C (A) with inset showing BaCO3 phase, (B) 1, 3 and 5 mol% ZnOBCZY bars, all sintered at 1350 °C and (C) 1, 3 and 5 mol% NiOBCZY bars, all sintered at 1350 °C. Inset in (C) shows a zoomed-in view of 3 mol% NiOBCZY in the 2ϴ range of 35.0 to 45°. Here, tested_reduced means samples tested in a reducing environment in the temperature range of 350 to 700 °C, and tested_oxidized means samples first tested in a reducing environment in the temperature range of 350 to 700 °C followed by oxidation in static air at 800 °C.
Ceramics 08 00078 g003
Figure 4. X-ray diffractograms in the 2ϴ range of 29.5 to 30.0°, showing BCZY peak shift for (A) 1, 3 and 5 mol% ZnOBCZY sintered at 1350 °C and (B) 1, 3 and 5 mol% ZnOBCZY sintered at 1350 °C.
Ceramics 08 00078 g004
Figure 5. SEM images captured at 20,000 magnification for pure BCZY sintered at (A) 1350 °C and (B) 1550 °C; SEM images captured at 20,000 magnification for (C) 1 mol% NiOBCZY, (D) 3 mol% NiOBCZY, (E) 5 mol% NiOBCZY, (F) 1 mol% ZnOBCZY, (G) 3 mol% ZnOBCZY and (H) 5 mol% ZnOBCZY, all sintered at 1350 °C; (I,J) EDS maps of the 5 mol% ZnOBCZY sample.
Ceramics 08 00078 g005
Figure 6. Electrochemical impedance recorded with (A) 1 mol% NiOBCZY, (B) 3 mol% NiOBCZY and (C) 5 mol% NiOBCZY between 400 and 650 °C. Electrochemical impedance recorded with 1, 3 and 5 mol% NiOBCZY at (D,E) 700 °C and (F) 350 °C. For all tests, the fuel environment was 5% humidified H2/N2 (5:95 v/v) at 38.5 mL/min.
Ceramics 08 00078 g006
Figure 7. Electrochemical impedance recorded with 1, 3 and 5 mol% NiOBCZY at (A) 700 °C, (B) between 400 and 650 °C and (C) 350 °C. Inset in (B) shows zoomed-in view of the spectra in the high frequency range. Inset in (C) shows zoomed-in view of the spectra in the high frequency range. For all tests, the fuel environment was 5% humidified H2/N2 (5:95 v/v) at 38.5 mL/min.
Ceramics 08 00078 g007
Figure 8. (A) Ionic conductivity calculated for pure BCZY, 1, 3, 5 mol% NiOBCZY and 1, 3, 5 mol% ZnOBCZY in the temperature range of 700 to 350 °C in % humidified H2/N2 (5:95 v/v). (B) Arrhenius plots for 1, 3, 5 mol% NiOBCZY and 1, 3, 5 mol% ZnOBCZY calculated based on total conductivity.
Ceramics 08 00078 g008
Table 1. X-ray diffractogram characterization of different ZnOBCZY samples.
SamplePhasesLattice StructureLattice Parameter (nm)
1 mol% ZnOBCZYBaCe0.2Zr0.7Y0.1O2.95cubic0.4255
3 mol% ZnOBCZYBaCe0.2Zr0.7Y0.1O2.95cubic0.4254
5 mol% ZnOBCZY99.5% BaCe0.2Zr0.7Y0.1O2.95cubic0.4253
0.5% Y2O3cubicN/A
1 mol% ZnOBCZY tested_reduced *BaCe0.2Zr0.7Y0.1O2.95cubic0.4255
3 mol% ZnOBCZY tested_reduced *BaCe0.2Zr0.7Y0.1O2.95cubic0.4254
5 mol% ZnOBCZY tested_reduced *99.6% BaCe0.2Zr0.7Y0.1O2.95cubic0.4253
0.4% Y2O3cubicN/A
1 mol% ZnOBCZY tested_oxidized **BaCe0.2Zr0.7Y0.1O2.95cubic0.4254
3 mol% ZnOBCZY tested_oxidized **BaCe0.2Zr0.7Y0.1O2.95cubic0.4253
5 mol% ZnOBCZY tested_oxidized **99.6% BaCe0.2Zr0.7Y0.1O2.95cubic0.4252
0.4% Y2O3cubicN/A
BCZY sintered at 1350 °C98% BaCe0.2Zr0.7Y0.1O2.95hexagonal0.6025, 1.4715
2% BaCO3orthorhombicN/A
* tested_reduced means samples tested in a reducing environment in the temperature range of 350 to 700 °C. ** tested_oxidized means samples first tested in a reducing environment in the temperature range of 350 to 700 °C followed by oxidation in static air at 800 °C. N/A stands for not available.
Table 2. X-ray diffractogram characterization of different NiOBCZY samples.
SamplePhasesLattice StructureLattice Parameter (nm)
1 mol% NiOBCZYBaCe0.2Zr0.7Y0.1O2.95cubic0.4255
3 mol% NiOBCZYBaCe0.2Zr0.7Y0.1O2.95cubic0.4254
0.9% NiOcubicN/A
0.3% BaCO3orthorhombicN/A
5 mol% NiOBCZY99.5% BaCe0.2Zr0.7Y0.1O2.95cubic0.4253
1.6% NiOcubicN/A
0.5% BaCO3orthorhombicN/A
1 mol% NiOBCZY tested_reduced *BaCe0.2Zr0.7Y0.1O2.95cubic0.4255
3 mol% NiOBCZY tested_reduced *BaCe0.2Zr0.7Y0.1O2.95cubic0.4254
0.5% NiOcubicN/A
0.2% BaCO3orthorhombicN/A
5 mol% NiOBCZY tested_reduced *99.6% BaCe0.2Zr0.7Y0.1O2.95cubic0.4253
1.3% NiOcubicN/A
0.3% BaCO3orthorhombicN/A
1 mol% NiOBCZY tested_oxidized **BaCe0.2Zr0.7Y0.1O2.95cubic0.4255
3 mol% NiOBCZY tested_oxidized **BaCe0.2Zr0.7Y0.1O2.95Cubic0.4253
0.6% NiOcubicN/A
0.1% BaCO3orthorhombicN/A
5 mol% NiOBCZY tested_oxidized **99.6% BaCe0.2Zr0.7Y0.1O2.95cubic0.4252
1.7% NiOcubicN/A
0.3% BaCO3orthorhombicN/A
BCZY sintered at 1350 °C98% BaCe0.2Zr0.7Y0.1O2.95hexagonal0.6025, 1.4715
2% BaCO3orthorhombicN/A
* tested_reduced means samples tested in a reducing environment in the temperature range of 350 to 700 °C. ** tested_oxidized means samples first tested in a reducing environment in the temperature range of 350 to 700 °C followed by oxidation in static air at 800 °C. N/A stands for not available.
Table 3. Comparison of electrolyte conductivity achieved in this work with the other relevant literature.
Electrolyte CompositionSintering Aid/Incorporation MethodSintering Temperature (°C), Duration (h)Total Conductivity (mS/cm)
BaCe0.3Zr0.55Y0.15O3−δ [17]1 wt% NiO, citrate–nitrate combustion method1400, 80.91 (500 °C)
BaCe0.3Zr0.55Y0.15O3−δ [17]1 wt% ZnO, citrate–nitrate combustion method1400, 81.11(500 °C)
BaZr0.1Ce0.66Ni0.04Y0.2O3−δ [16]4 mol% NiO, sol–gel method1400, 56.30 (600 °C)
BaCe0.5Zr0.3Y0.16Zn0.04O3−δ [14]1 wt% ZnO, ball-milling1325, 1010 (600 °C)
BaCe0.2Zr0.7Y0.1O3−δ [18]4 wt% ZnO, ball-milling1500, 48.64 (600 °C)
BaCe0.5Zr0.3Y0.2O2.9 [19]4 mol% ZnO, ball-millingNA13.5 (600 °C)
4 mol% ZnO, wet impregnation11.2 (600 °C)
BaCe0.35Zr0.5Y0.15O3−δ [13]2 wt% ZnO, sol–gel method1100, 44.02 (700 °C)
BaCe0.7Zr0.1Y0.2O3−δ [10]2 mol % Ni0.5Fe0.5, ball-milling1400, 53.80 (600 °C)
BaCe0.5Zr0.3Y0.16Zn0.04O3−δ [56]2 wt% ZnO, sol–gel method1200, 52.73 (700 °C)
BaCe0.5Zr0.3Y0.2O2.9 [19]4 mol% ZnO, solid state reaction1300, 1013.50 (600 °C)
BaZr0.6Ce0.2Y0.2O3−δ [49]Zn(NO3)2 to get Zn/Ba molar ratio 0.03, solid state reaction1400, 123.00 (600 °C)
BaCe0.6Zr0.2Y0.2O3−δ [15]3 wt% NiO, ball-milling1500, 101.4 (600 °C)
BaCe0.56Zr0.2Ni0.04Y0.2O3−δ [57]4 mol% NiO, combustion method1300, NA11.00 (650 °C)
BaCe0.35Zr0.5Y0.15O3−δ [37]4 mol% NiO, solid state reaction1400, 62.00 (600 °C)
4 mol% NiO, ball-milling1400, 64.80 (600 °C)
BaCe0.8Zr0.1Y0.1O3−δ [20]0.1 wt% ZnO, ball-milling1400, 613.00 (600 °C)
This work1 mol% ZnO, wet ball-milling1350, 25.02 (600 °C)
This work3 mol% NiO, wet ball-milling1350, 24.08 (600 °C)
This work1 mol% ZnO, wet ball-milling1350, 211.78 (700 °C)
This work3 mol% NiO, wet ball-milling1350, 212.76 (700 °C)
Disclaimer/Publisher’s Note: The statements, opinions and data contained in all publications are solely those of the individual author(s) and contributor(s) and not of MDPI and/or the editor(s). MDPI and/or the editor(s) disclaim responsibility for any injury to people or property resulting from any ideas, methods, instructions or products referred to in the content.

