Abstract
Recent archaeological sites dating to the late 19th and early 20th centuries have rarely been studied to date. Among the 500 “glassy” beads excavated from Dohouan (Côte d’Ivoire), elemental analyses reveal that fewer than half contain abnormally high alumina contents, associated with a soda–potash–lime flux (three compositional groups). The remaining beads are typical lead-based glass. The Raman spectra of the alumina-rich beads are quite complex due to their glass–ceramic nature, combining features similar to the vitreous phase of porcelain glaze with the presence of various crystalline phases (quartz, wollastonite, calcium phosphate, calcite). Organic residues are also observed. Colors are primarily produced by transition metal ions, although some specific pigments have also been identified. These characteristics suggest that the alumina-rich beads were manufactured by pressing followed by sintering, as described in patents by Richard Prosser (1840, UK) and Jean Félix Bapterosse (1844, France). A comparison is made with beads from scrap piles at the site of the former Bapterosse factory in Briare, France. This process represents one of the earliest examples of replacing traditional glassmaking with a ceramic process to enhance productivity and reduce costs.
1. Introduction
Glass beads and semi-precious gemstones used to decorate clothing, necklaces, or bracelets, and also serving as currency, have been used for millennia [1,2]. They were a key component of long-distance trade, particularly along the East African coast of the Indian Ocean, where Swahili trading posts played a central role [2,3,4,5,6,7], in North Africa via the trans-Saharan Arab trade routes [8], and along the Atlantic West African coast through Portuguese, Dutch, English, and French trading posts [9]. Similarly, glass beads provide valuable information regarding the establishment of European trading posts in native American territories [1].
These beads, produced in various sizes and colors, were exchanged since antiquity for gold, ivory, plant products, and even slaves [2,7]. Manufactured almost exclusively outside Africa, their provenance can often be inferred from characteristics such as shape, color, composition, and the nature of coloring and opacifying agents, which evolved owing to technological advances [2,3,6,10]. However, in response to “customer” preferences, some producers imitated the visual characteristics of competing sources early on [6,11], making detailed analyses essential for accurate differentiation [4,6,10]. Compositional heterogeneity is often linked to local reprocessing [9,11,12].
Glass beads from southern African sites and Swahili trading posts have been extensively studied over recent decades using a combination of elemental and spectroscopic techniques [2,4,5,10,11,13,14,15]. More recently, research has focused on the western African coast [6,8,9,16]. To date, most studied beads come from sites occupied before the 19th and 20th centuries [6,13].
In this study, we investigate 19th–20th century beads from Dohouan, a coastal site in Côte d’Ivoire documented since the late 18th century but primarily active during the 19th and 20th centuries [17]. A preliminary study identified some beads with unexpected compositions [18], suggesting a synthesis route distinct from traditional glass production methods. An in-depth study was thus conducted, involving visual characterization (color, dimensions, shape), determination of average compositions via LA-ICP-MS, and identification of the crystalline and amorphous phases constituting the material of the beads using Raman microspectroscopy.
A comparison is made with beads collected by the Musée Itinérant de la Perle Ancienne-France [19] from the waste heaps of the former Bapterosse factory in Briare (France) [20], as well as with relevant patents concerning that production.
2. Materials and Methods
2.1. Materials
The beads (Table S1) originate from three excavation campaigns conducted in 2017 (two campaigns) and 2023 (one campaign) near the present-day village of Dohouan [20]. Intensive settlement of the N’Zéma Advoulè people on the banks of the Tendo-Ehy lagoons, especially near what is now Dohouan, occurred after the reign of Kakou Aka (1832–1851), the king of Begnini in present-day Ghana [18]. This coastal area thrived through trade between local populations and European merchants. Archaeological evidence of this exchange includes smoking pipes, synthetic beads, liquor bottles, and porcelain of non-local origin found at the site [18,21].
The ancient village of Dohouan was abandoned before 1922, the birth year of the current land chief of the modern village [18]. It lies approximately 3 km from the present settlement, which is still inhabited by the same community.
Almost all the beads appear synthetic, except for a few carnelian examples, and the total collection numbers 551 beads, which have been described in detail in a separate study [22]. Figure 1 presents a selection of the beads and their color distribution, mainly green and white. Beads presumed to have been manufactured by pressing (based on their uniform shape and size) are listed in Table S1 along with their main characteristics and the analyses conducted.
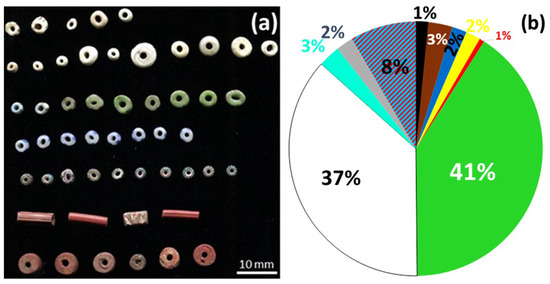
Figure 1.
Examples of Dohouan “glassy” beads (a) and relative proportions of different colors among all beads from the site (b): green (41%), white (37%), two-tone (8%), brown (3%), turquoise chevrons (3%), blue (2%), yellow (2%), colorless (2%), black (1%), and red (1%).
A comparative batch of beads (labelled Colxx) was also analyzed. These were collected from the manufacturing waste site of the former J.F. Bapterosse factory and loaned by the Musée Itinérant de la Perle Ancienne-France [19]. Figure 2 shows a representative selection of these Briare beads (Table S2) and their diameters.
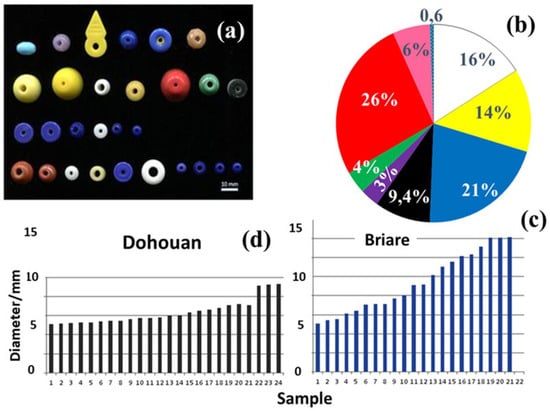
Figure 2.
View of a selection of Briare beads (a); color distribution (b): red (26%), blue (21%), white (16%), yellow (14%), black (9.4%), rose (6%), green (4%), purple (3%), and two-tone (0.6%); distribution (c) of selected bead diameters collected from Briare scrap piles (Authorization to study the beads and publish these images was granted by G. Maurette and M. de Castro (Collection Mots Perlés, Le Tréport, France); see Table S2 for details); (d) distribution of bead diameter from the Dohouan site.
2.2. Methods
Elemental composition was determined using laser ablation–inductively coupled plasma–mass spectrometry (LA-ICP-MS), following procedures described in earlier studies [18,23]. The analysis was conducted on 39 beads from Dohouan (with 44 analyzed spots, Table S3) and 22 from Briare (with 26 analyzed spots, Table S4). Some Dohouan beads were not analyzed due to suspicion of surface corrosion. Analyzed Briare beads were preferentially chosen from those of small diameter, a priori more similar to those found in the Dohouan excavation. Of the 58 elements measurable by LA-ICP-MS, 25 were selected for study, including major and minor glass and ceramic constituents, as well as coloring elements and associated trace elements.
Analyses were performed directly on the bead surfaces (ablation spot diameter: 40–150 µm), with a 20-s pre-ablation phase to remove potentially altered surface layers. NIST standard SRM 610 and Corning standards (B, C, D), along with archaeological reference glasses of known composition, were used to monitor instrument performance. Visual and optical microscopy confirmed the absence of corrosion, consistent with the beads’ highly lustrous surfaces.
Raman spectroscopic analysis was performed on 28 Dohouan beads and 21 Briare beads using a Labram HR800 Raman spectrometer (HORIBA Scientific Jobin-Yvon, Palaiseau, France) equipped with an Ar+ ion plasma laser (Innova I90C 6UV, Coherent Inc., Santa Clara, CA, USA). Excitation was performed using the 457.9 nm and 514.5 nm laser lines. Illumination power ranged from ~0.5 mW (dark beads) to 10 mW (light-colored beads) for the blue line and 0.2 to 2 mW for the green line.
Micro-Raman analysis was conducted using Olympus long-working-distance (LWD) 50× and 100× objectives, providing spot sizes of approximately 5 × 5 and 2 × 2 µm2, respectively. The depth of laser penetration was about double for colorless glazes but significantly reduced for dark-colored areas. Spectra were collected across the 50–4000 cm−1 range, with counting times varying from a few to several tens of minutes. At least three accumulations were made per spectrum to eliminate cosmic ray artefacts. Use of the blue laser helped minimize fluorescence from bio-organic residues present in surface microcracks and roughness of the beads accumulated during burial.
3. Results
3.1. Elemental Compositions of Beads Excavated from the Dohouan Site
The size distribution of the beads from the Dohouan excavations falls into two groups. Most of the beads have diameters close to 5–7 mm, while a minority are larger, measuring around 9 mm (Figure 2).
Figure 3 presents the distribution of compositions in the conventional silica–alumina–flux ternary diagram used for classifying ceramics and glasses. Characteristic oxide compositions are shown in Table 1. Here, “flux” is broadly defined to include Na2O, K2O, and CaO; Li2O and B2O3 are not considered, as they are expected to be present only in negligible amounts. PbO will be considered after.
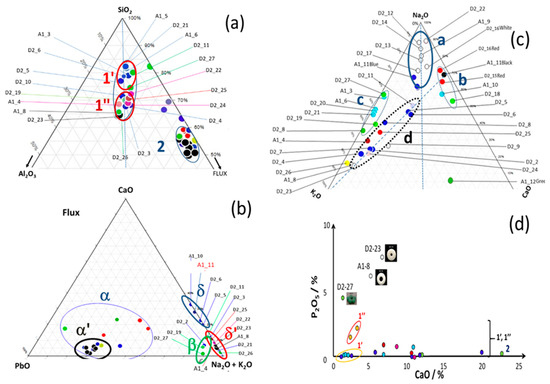
Figure 3.
Classification of Dohouan beads in the ternary silica–alumina–flux diagram (a) and flux-type diagrams (b,c): lime, lead, and soda-potash. Elemental compositions are provided in Table S3 (Supplementary Materials); (d) P2O5 plotted against CaO, along with an image of P-rich beads. Dot colors generally correspond to the bead colors, except in (a,b), where black dots represent white beads.

Table 1.
Characteristic oxide compositions of Dohouan beads. Values corresponding to potential coloring agents are shown in bold. See Supplementary Materials, Table S3, for the full list of oxide compositions.
Some beads display high alumina levels, with compositions centered around SiO2 65 wt%, Al2O3 15 wt%, and flux 15 wt%, which is comparable to that of porcelain glazes [24,25]. The remaining beads have alumina contents equal to or below 5 wt%, as typically observed in glass beads made from medium-purity sand [10]. These alumina-rich beads can be further divided into two subgroups, referred to here as Alumina-rich Group 1′ and Alumina-rich Group 1″. The second group, referred to as Glass Group 2, aligns with standard glass compositions in the SiO2–Al2O3–flux ternary diagram. A few beads (e.g., A62 [red] and A70 [green]) do not belong to either of these main groups.
A CaO-PbO-[Na2O + K2O] diagram comparing the proportions of fluxing oxides confirms the existence of two main groups: one containing PbO (subgroups α and α′of Group 2), and two others that are lead-free (subgroups δ and δ′), as well as a few beads with minor lead contents (Group β: D2-2 [black], D2-4 [blue], D2-19 [green], D2-27 [green], and A1-4 [black]). The alumina-rich compositions are lead-free and correspond to the δ and δ′ groups.
The compositions of Alumina-rich Group 1′ and 1″ do not match those reported in earlier studies on glass beads produced before the 20th century [6,10]. The Na2O-K2O-CaO ternary diagram separates the beads into four groups: Group a, characterized by a K2O/CaO ratio of 1; Group b, which is nearly potassium-free; calcium-poor Group d; and calcium-free Group c. Some beads contain several wt% of P2O5. Beads A1_8 and D2_23, with concentrations greater than 0.5 wt% P2O5, belong to Alumina-rich Group 1″.
3.2. Coloring Agents of Beads Excavated from the Dohouan Site
Table 1 compares the main compositional parameters of alumina-rich beads of various colors. Full data are provided in Tables S3 and S4.
For the primary blue, turquoise, and red colors, the respective Co2+, Cu2+, and Fe3+ ion coloring agents correspond to “standard” coloration techniques used since antiquity [10,26], involving the dissolution of metal ions into the glassy silicate network. The oxide contents of these elements fall within expected ranges, with the exception of the D2-8 and D2-10 blue beads, where CoO levels are low. However, the ZnO content in these beads is roughly twice that of CoO, suggesting the use of a Zn-Co spinel pigment as the coloring agent. The high coloring efficiency of this pigment allows for reduced cobalt usage, thereby lowering production costs.
High levels of chromium (in green beads D2_11 and D2_27) and uranium (in yellow beads A1_7 and D2_26) are typical of pigments introduced at the end of the 19th century and beginning of the 20th century [27]. Chromium, often combined with copper, was used to achieve green and yellow-green hues, potentially indicating the use of chromium-based pigments like Victoria green, first synthesized during Queen Victoria’s reign.
In some beads, white opacification is associated with elevated phosphorus and calcium levels (Figure 3d), suggesting the precipitation of calcium phosphate, a technique used since the Middle Ages (bone ash opacification) [27]. Conversely, high calcium without significant phosphorus may indicate opacification via wollastonite (CaSiO3) precipitation, a method used for soft-paste porcelain glaze [27].
The detection of both tin and chromium in the pink bead D2-24 indicates the use of pink malayaite pigment, discovered in the second half of the 19th century [28]. This pigment remained the primary alternative to gold nanoparticles for producing pink coloration until the 1960s. The absence of Sn and Cr in the pink bead D2-22 suggests that its color may instead derive from gold or copper nanoparticles (Au° or Cu° NPs), which have been used since the 17th century, and possibly earlier, such as in the Roman period for gold and in antiquity for copper [12,29]. Elemental analyses detected trace levels of both gold (0.004 wt%) and copper (0.004 wt%). Due to the strong coloring power of these metal nanoparticles, such low concentrations are sufficient for effective coloration [29].
Raman spectroscopy will be necessary to identify or confirm the proposed coloring agents.
3.3. Elemental Compositions of Beads Collected from the Briare Industrial Site
A comparison of the ternary diagrams in Figure 3 (Dohouan) and Figure 4 (Briare) shows that the beads from the Briare production waste fit only partially into Alumina-rich Group 1″, with about 20 wt% Al2O3. Corresponding compositions are summarized in Table 2 and given in Table S2.
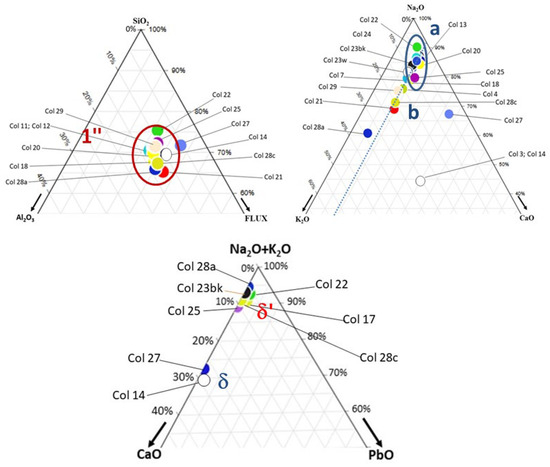
Figure 4.
Classification of Briare factory beads in the SiO2–Al2O3–flux (left), Na2O-K2O-CaO (right), and Na2O + K2O-CaO-PbO (center) ternary diagrams.
Table 2.
Characteristic oxide compositions of Briare beads. Values corresponding to potential coloring agents are shown in bold. See Table S4 of the Supplementary Materials for the full list of oxide compositions.
However, it is difficult to assess how representative these beads are of Briare’s overall production, as they were collected solely from the surface of waste piles. Figure 2 indicates that many of the collected Briare beads have larger diameters than those from Dohouan. The Na2O-K2O-CaO diagram reveals that most Briare beads have compositions similar to the Na2O-rich beads of Figure 3 (Groups a and δ′). All beads except Col27 have low CaO contents. A relatively high level of cerium was found in some white beads. Zinc–cobalt was detected in blue beads, similar to those from Dohouan. Iron and zinc were present in yellow beads, and cadmium was detected in the analyzed red bead.
3.4. Raman Signature of Beads Excavated from the Dohouan Site
Not all beads were analyzed using both techniques (see Tables S1 and S2). All recorded spectra are provided in Figure S1 (Supplementary Materials). We first consider the beads excavated from the Dohouan site.
Figure 5 displays the variety of spectra obtained over a broad spectral range. It is important to recall that the Raman spectrum is characteristic of amorphous or crystalline phases, and the intensity of Raman signals varies greatly depending on the type of chemical bond. Note that the presence of minor phases (on the order of a few percent or less) can dominate the Raman spectrum, while major phases can remain undetected [30].
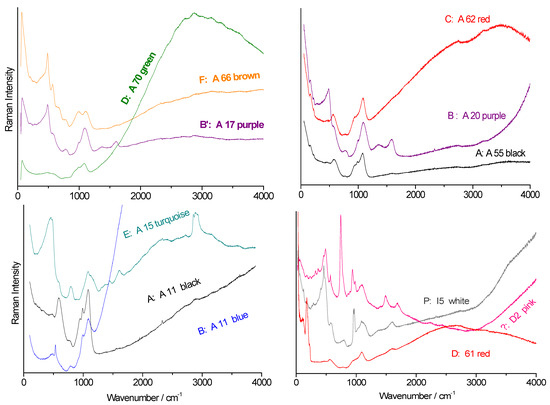
Figure 5.
Full-range spectra of the main Raman signature types (A–F) observed in the beads. Bead labels are provided (see Table 1); spectra were recorded using blue laser excitation.
The spectral background is influenced by the raw materials and includes broad luminescence bands resulting from electronic transitions associated with structural defects linked to: (i) inorganic impurities from raw materials (e.g., rare earths), (ii) inorganic impurities or defects introduced during processing (e.g., grinding, chemical, and thermal treatments), or (iii) (bio)organic residues acquired during burial [31]). This background can, in some cases, serve as a “fingerprint” of the raw materials used [31].
The AlO4 tetrahedron contributes negligibly to the vibrational spectrum of alumino-silicates due to the high ionicity of the Al-O bond [25,31,32,33,34,35]. Therefore, the Raman spectrum primarily reflects the vibrational signature of the SiO4 tetrahedron, the main structural unit. The vibrational modes of glassy silicates consist of three broad features: Si–O stretching (~1000 cm−1), bending (~500 cm−1), and the Boson peak (<300 cm−1), the latter being associated with lattice and librational modes [24,25,32,33,34]. These modes overlap with the luminescence spectrum, often called “background” [31]. Although micro-Raman analysis probes a very small volume (~10–20 µm3), spectra frequently show contributions from multiple phases. Variations in their relative intensities across sampling points suggest significant heterogeneity at the micron scale, as expected for glass–ceramic composites.
Three types of luminescence under blue laser excitation (also called fluorescence) contributions are observed (Figure 5): one in the 2500–3000 cm−1 range, another near 3500 cm−1, and a third above 4000 cm−1. These bands should be interpreted in absolute wavelength (nm), not using the Raman shift (cm−1), corresponding to ~570 nm (e.g., the B-type spectrum of the A11 blue bead), ~600 nm (the C-type spectrum of the A62 red bead), and >650 nm (the B-type spectrum of the A20 purple bead), respectively [30]. These features suggest at least three different raw material sources were used in the production of the Dohouan beads.
Examining the spectral region of fundamental vibrational modes (50–1500 cm−1), we identify six distinct types of Raman signatures, labelled A through F in Figure 5 and Figure 6. Some types are typical fingerprints of mixed glasses. The following types are distinguished: Type A: soda–potash–lime glass; Type B: potash–lime glass; Types C and D: soda–lead glass; Type F: alkaline–lead-rich glass. These follow the classification proposed by Colomban et al. [35]. An additional type, P, corresponds to a signature observed in phosphatic glazes typical of bone china and soft-paste porcelain [36,37]. The E signature resembles type B but includes notable contributions from organic and/or carbonaceous materials with C–H bands (~3000 cm−1) and a C–C doublet (1350–1600 cm−1). The presence of organic residues in a “glassy” matrix is rare and indicates encapsulation during formation. The classification of these spectral types is summarized in Table 3.
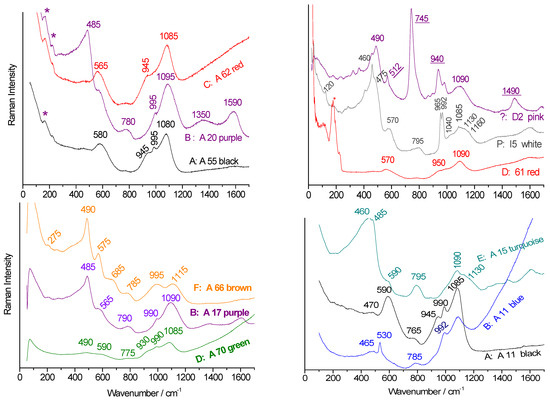
Figure 6.
Representative Raman spectra (fundamental mode range) for the main Raman signature (A–F); bead labels are provided (see Table 1), recorded using blue laser excitation. Peaks characteristic of pink malayaite garnet are underlined (*: shoulders due to the filter).
Table 3.
Classification of Dohouan beads of different color based on elemental composition and Raman groups (A: Na2O + K2O + CaO flux; B: K2O + CaO flux; D: Na2O + PbO flux; P: Al2O3- and P2O5-rich; n.a.: not analyzed; Fluo: fluorescence. Groups: α, α′: Pb-rich glass; δ: K-Na-Ca-based glass; δ′: K-Na-based glass; d,c: K-based glass; a,b: Na-rich glass; c: Ca-free glass; b: K-free glass).
As established by Seifert et al. [31], the components of the SiO4 stretching band (800–1250 cm−1) reveal the distribution of tetrahedra based on polymerization within the silicate glass network. The symmetric stretching mode for isolated tetrahedra (Q0) appears near 850 cm−1, while more polymerized tetrahedra (e.g., Q4, fully connected through all four oxygen atoms) yield band centers up to~1150 cm−1 [24,25].
Thus, the 995–1150 cm−1 doublet (type F) is typical of alkaline–lead glass [35], such as Iznik glazes [38]. Types A, B, and C are distinguished by minor bands in the 945–990 cm−1 range, reflecting variable alkali and lead contents. Type D, with a component near 930 cm−1, suggests significant lead content. Type P, showing a narrow doublet around 965–990 cm−1 (sometimes merging into a broader single peak), indicates a glass–ceramic composite with calcium phosphate crystals [36].
The polymerization index (Iₚ), defined as the ratio of band areas corresponding to SiO₄ bending and stretching modes, reflects the degree of network polymerization. This index ranges from ~7 in pure silica to <0.5 in lead-saturated glasses [24,25]. The Iₚ values for the different Raman types are: Type E: ~2; Types B and P: ~1; Types A and C: ~0.6; and Type D: ~0.4 The most polymerized type (Ip = 2) is typically more refractory and formed at higher temperatures, with melting temperatures also governed by network connectivity.
The main quartz peak at ~462 cm−1 [39] may shift slightly due to stresses in the glassy matrix. In the presence of pink malayaite pigment, green laser excitation may cause resonant enhancement of Sn-Cr chromophore modes (e.g., peaks at 745 and 940 cm−1, see Figure 6) [28].
Figure 7 compares spectra from selected beads for which average local compositions have been measured. A notable spectral variation is observed even within a single bead at micrometer-scale points. This variety is unusual for glass beads, which typically show two types of spectra: one dominated by the glass matrix, and the other by intense pigment signatures. These observations confirm that the beads are glass–ceramics, not purely glass.
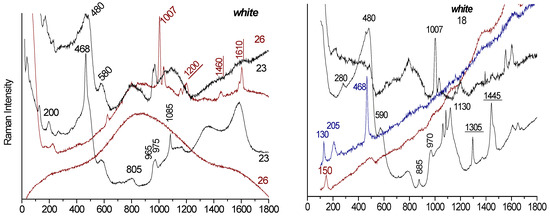
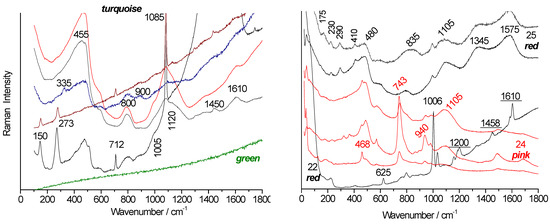
Figure 7.
Variety of Raman spectra obtained for beads A1-8, D2-23, and D2-26 (white); A1-3 and A1-5 (turquoise); D2-19 (green); A1-4, D2-22, and D2-25 (red); and D2-24 (pink), recorded at spots ranging from 5 to 25 µm2 using a blue laser (457.9 nm). The main peaks characteristic of the encapsulated organic phase are underlined.
For example, bead 23 (white) displays a wide range of Raman signatures: quartz (main bands at 200 and 400 cm−1 [39,40]), an amorphous silicate phase (broad bands at 480, 580, 800, and 1100 cm−1) [34], zircon (main peak at ~1005 cm−1) [41], calcite (~1085 cm−1) [42], calcium phosphate (~965 cm−1) [43], and wollastonite (~975 cm−1) [44]. We also observe characteristic bands of hydrocarbon products (ca. C-C or C-N bonds at 1200, 1440, and 1610 cm−1) confirmed by the C-H bands around 2900 cm−1 [45]. In some cases, these may reduce to the characteristic amorphous carbon doublet (1350–1600 cm−1). Similar spectra were obtained for bead A1-8, indicating that organic materials were added to the silicate powder and remained encapsulated, protected from complete oxidation.
In turquoise beads, neither wollastonite nor calcium phosphate is detected. In some areas, fluorescence is strong enough to obscure Raman signatures (e.g., D2-26 white, D2-19 green). A broad band near 835 cm−1 suggests the presence of lead arsenate, likely used as an opacifier [46].
Pigment signatures often overlap with the glass matrix signals. In red beads, hematite is identified by bands near 230, 290, and 410 cm−1 [47]. Pink beads exhibit the malayaite garnet signature (743 and 940 cm−1 [28], see Figure 6), along with an unidentified pigment showing peaks at 255, 440, 510, and 610 cm−1.
3.5. Raman Signature of Beads Collected from the Briare Industrial Site
Figure 8 and Figure 9 compare the Raman spectra of white and colored beads collected from the Bapterosse factory site in Briare [19]. The fluorescence backgrounds are homogeneous by color, except for beads Col1, Col2, and Col26.
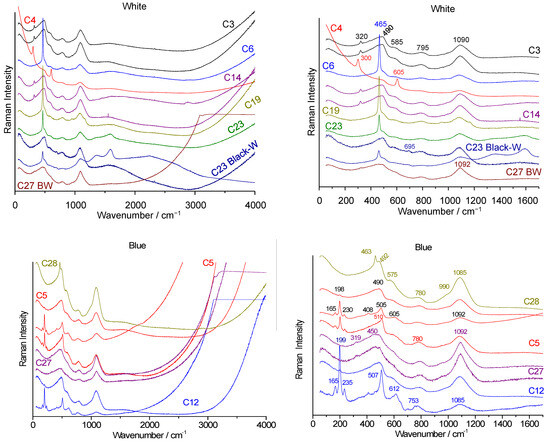
Figure 8.
Raman spectra of white (top) and blue (bottom) beads collected from the Briare industrial site. Left: full-range spectra showing fluorescence background. Right: zoomed-in view of the fundamental mode spectral range (green laser excitation). For simplicity, “Colxx” labels are replaced with “Cxx”.
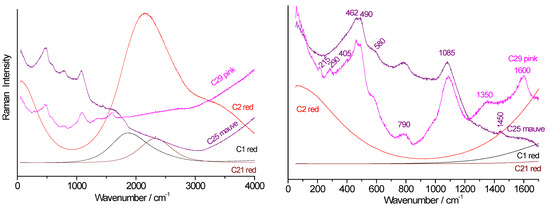
Figure 9.
Raman spectra of red, mauve, and pink beads collected from the Briare industrial site. Left: full-range spectra showing fluorescence background. Right: zoomed-in view of the fundamental mode spectral range (green laser excitation). For simplicity, “Colxx” labels are replaced with “Cxx”.
All the white beads (Figure 8) display the same signature characteristic of the glassy phase (bending at 480 cm−1, stretching at 1090 cm−1), along with the main peak of quartz (465 cm−1) and likely that of fluorite CaF2 at 320 cm−1 [48,49].
For the red (Col1, Col2, and Col21) and yellow (Col18, Col19, and Col26) beads, we observed the fluorescence of a CdS-CdSe solid solution [50].
The Raman signatures of the vitreous phases of the blue beads are similar, but in most cases, a component around 505 cm−1 is more clearly observed; this component is characteristic of incompletely dissolved feldspar or plagioclase grains [37]. In addition, the peaks at 199 and 612 cm−1 (e.g., Figure 8, spectra Col12 and Col4) are characteristic of the pigment Co3O4 [51]. These beads therefore have compositions close to those of glaze. The degree of polymerization measured for the Briare beads is fairly homogeneous, close to 1, and the spectra are of type B or P, with some approaching type A. The very strong fluorescence that increases with wavenumber under green laser excitation is typical of alumina-rich compositions and is observed in many alumina-based materials (alumina, mullite, porcelain). The strong fluorescence under green laser excitation observed in Figure 8 is due to the fluorescence of chromium in alpha-alumina [52]. Such strong fluorescence is common in porcelain due to the nucleation of alpha-alumina, when the first squared mullite crystals with 2 Al2O3 SiO2 composition transform into needles with 3 Al2O3 2 SiO2 composition [53].
Elemental compositions, including chromophore elements, are given in Table 4. As shown in Figure 3, all beads exhibit lead-free compositions and belong to group 1, δ, or δ′.
Table 4.
Classification of Briare beads based on chemical and Raman groups (-: not analyzed; fluo: fluorescence). Groups: δ and δ′, K-Na-based composition; δ′, Na-rich composition; a, Na-rich composition; b, K-free composition.
Figure 9 compares the spectra obtained for the colors red, mauve, and pink. The Col29 pink bead shows, in addition to the signature of the vitreous silicate, the characteristic peaks of hematite at ~215, 290, and 405 cm−1 [47] and the 1350–1600 cm−1 doublet of carbon traces. For the Col21 red, Col1 red, and Col2 red beads, very strong fluorescence indicates the presence of metallic nanoparticles (Cu° or Au°) or the CdS-CdSe solid solution [31,50]. The fundamental spectra of the phase are not visible due to the intense fluorescence. Indeed, LA-ICP-MS analyses determined a concentration higher than 0.1% Cd in the Col2, Col21, and Col28 (core) samples (Table 2). The low level of cadmium is due to the high coloring power of CdS-CdSe nanoparticles [50].
Table 5.
Chromophore/opacifier elements and phases identified in the Dohouan beads.
Table 6.
Chromophore/opacifier elements and phases identified in the Briare beads.
4. Discussion: Bead Processing and Characterization
4.1. Manufacturing of Glass Beads
The older process for producing glass beads is the winding of a glass wire onto a metal mandrel to produce a single bead [10]. Different beads can be made on the same mandrel. The second ancient technique involves the production of a tube by pulling molten glass into canes. The tubes are then broken into multiple pieces [1,54,55]. The hole is formed by an air bubble that is stretched along the length of the cane. Complex colors and decorations (chevron, herringbone, etc.) can be made by coating different glasses on the tube [1,2]. However, these techniques are slow. Higher productivity was achieved by using a mold, into which large glass rods were placed, either manually or, preferably, mechanically. In these later processes, the equatorial seam must be polished. Special beads can also be made by blowing, with or without a mold.
4.2. Information Provided by the Prosser and Bapterosse Patents
Richards and Thomas Prosser patented a process for making buttons by pressing “dry” powder in a steel mold before firing in 1840 in the UK, and in 1841 in the USA [56,57]. They claimed to use “clays and clayey earths, flint and felspar” as raw materials. The firing temperature had to be high enough to achieve densification without deformation, a typical ceramic process. Richard Prosser sold the use of his patent to the Minton pottery in the UK, which produced buttons from 1840 to 1846, and to a US factory [57]. Between 12 and 25 buttons could be made per minute, i.e., 20,000 per week [58], but it seems clear that beads were never produced according to these Prosser patents.
In France, Jean Felix Bapterosse extended the process to bead production and designed molds, allowing many beads to be made simultaneously. The process was later adopted by factories in Bohemia, Germany, and Austria [58]. Depending on the country, these beads are known as Prosser beads, Oriental beads, sintered beads, or Briare beads. Besides being cheaper, Briare beads were very regular in size and shape and retained their color, making them popular for trade in Africa. Reports indicate that the ingredients included Swedish feldspar, Zettlitz (Saxony) kaolin, potassium silicate, and calcined borax mixed with phosphoric lime. Feldspar may have been pre-treated with acid. The powder was prepared by grinding in a rotating drum (a common method for preparing glaze powder) [58]. Suitable binding agents (milk, gum arabic, tragacanth gum, or casein glue) and coloring agents were added to form a homogeneous paste. This paste was then rolled into sheets and placed in a pressing frame. One to five thousand beads could be made in one pressing shot. The technique is therefore similar to that used a century later to manufacture capacitors based on BaTiO3 [59], except that polymer binders were later used instead of casein and gums. The method appears “wetter” than tile pressing, but the Briare process can be seen as its precursor. The Briare factory closed in the 1960s; its successors stopped producing beads and buttons and shifted to tiles, then enamels and mosaics [20].
4.3. Experimental Evidence
An unusual level of alumina rules out the traditional preparation of glass beads. The observation of fine peaks around 965 and 992 cm−1, characteristic of phosphate and calcium silicate, respectively (Figure 6), and the detection of significant phosphorus levels in some beads (Figure 3d) are consistent with patents mentioning the addition of phosphoric lime.
The unusual presence of partially transformed organic residues (Figure 7) is consistent with the incorporation of casein. These Raman signatures are characteristic of the Prosser/Bapterosse process and can be used as a non-invasive identification tool.
However, it is evident that the beads collected at the old Briare factory site correspond to only a limited part of the Briare production (Alumina-rich Group 1″). In contrast, beads found in Dohouan show much more varied compositions (Alumina-rich Group 1′ and 1″).
The very strong luminescence observed in the red Briare beads indicates coloring by CdS-CdSe type precipitates, a pigment used as early as the beginning of the 20th century in stained glass [50] but popularized in enamels only after World War II [60]. The characteristic modes of CdS/CdSe are only visible for very short laser illumination times (1s), after the fluorescence covers the Raman signal.
Examination of chromophore elements with significant levels, such as Cr, Fe, Mn, Co, Cd, Zn, Cu, and Sb, aligns with the Raman identification of CrO4-based, CoAlZnO4, Fe2O3, and CaSb2O7 pigments, as well as coloration from Mn2+, Co2+, and Cu2+ ions dissolved in the glassy network (Table 5 and Table 6). Since borax addition is mentioned in patents, some beads may contain boron.
5. Conclusions
The demonstration, both by LA-ICP-MS and by Raman microspectroscopy, of an unusual material—a glass-ceramic body formed from an amorphous alumina-rich matrix containing various crystallized phases (calcium phosphate and silicate, lead–calcium/potassium arsenate, zircon, malayaite garnet, chromate, etc.)—confirms the modern character of the beads. These pigments were largely developed only after the start of the industrial arts revolution, most of them after ~1850, with some, such as the use of a CdS-CdSe solid solution, only developing after ~1930. Zircon is the most recent pigment (after ~1960), although some raw materials (e.g., pegmatite and quartz) may naturally contain zircon [60].
Different groups and subgroups are identified for both alumina-rich “Prosser” beads, prepared by molding and sintering, and standard glass beads, using the two analytical techniques. The Raman technique is particularly efficient for identifying crystalline phases, pigments, opacifiers, or organic residues.
In contrast to bead assemblages from older African sites, i.e., most of those studied in the literature, where the number of compositional types and Raman signatures is limited, this work reveals an unusual variety that reflects the diversity of production at the end of the 19th and throughout the 20th centuries.
With the development of new materials during the industrial era and the expansion of the “arts of Fire”, it appears that simple elemental analysis is no longer sufficient to identify the origin of such products. The identification of the production sites of glass beads was initially based on shape and color, then on composition, especially the presence of specific impurities [10]. However, products of the industrial era are made from much purer raw materials; thus, the identification of specific phases related to the production chain becomes essential.
The comparison with analyses of beads from the site of the former Bapterosse factory in Briare supports the attribution of certain beads to this production, following the Prosser patents. The identification of organic residues confirms the addition of casein, as reported in the patents, to consolidate the powder during pressing before heat treatment.
The long-standing operation of the Société des Emaux de Briare for over a century demonstrates that this ceramic technique—preparing glass beads by pressing and sintering, in synergy with porcelain or earthenware glaze preparation (as carried out at the Faïencerie de Gien, a major factory producing fine decorated earthenware owned by the same company)—remained competitive for a long time compared to traditional glassmaking techniques [1,10,48,54,61,62,63].
Although some early publications marginally considered bead exchanges up to the 19th century [2,9,64,65,66,67,68], in-depth works regarding the characterization of glass beads from the 19th century are rare [69,70,71,72,73,74], and those from the 20th century even more so [75,76,77,78]. To our knowledge, no publication has reported on the analysis of alumina-rich beads, particularly from archaeological excavations in Africa. Identifying other factories producing this type of bead could allow, through the analysis of minor and trace elements, the recognition of signatures that reveal their origin.
Supplementary Materials
The following supporting information can be downloaded at: https://www.mdpi.com/article/10.3390/ceramics8020071/s1. Figure S1: Raman spectra of beads of different color collected from Dohouan archaeological site. On the left full scale spectra showing fluorescence background; on the right zoom in the fundamental mode spectral range (green laser excitation). Table S1: Dohouan beads; Table S2: Briare beads; Table S3 (Excel file): Dohouan beads elemental compositions; Table S4 (Excel file): Briare beads elemental compositions.
Author Contributions
Conceptualization, K.M.K. and P.C.; methodology, P.C.; validation, P.C.; investigation, K.M.K. and P.C.; resources, K.M.K. and P.C.; data curation, K.M.K. and P.C.; writing—original draft preparation, K.M.K. and P.C.; writing—review and editing, K.M.K., P.C., C.P., and K.S.K.; visualization, K.M.K. and P.C. All authors have read and agreed to the published version of the manuscript.
Funding
This research received no external funding.
Institutional Review Board Statement
Not applicable.
Informed Consent Statement
Not applicable.
Data Availability Statement
All data are given as Supplementary Materials.
Acknowledgments
The authors warmly thank the “Musée de la perle de verre ancienne (Collection Mots Perlés, Le Tréport, France)” and their directors and owners of the collection, G. Maurette and M. de Castro, for the loan of beads collected on the former site of the Bapterosse factory. Bernard Gratuze and his team of Centre Ernest-Babelon de l’Institut de recherche sur les archéomatériaux (IRAMAT-CEB, UMR 7065), CNRS/University of Orléans, France, are kindly acknowledged for the LA-ICP-MS measurements.
Conflicts of Interest
The authors declare that the research was conducted in the absence of any commercial or financial relationships that could be construed as potential conflicts of interest.
References
- Karklins, K. Glass Beads; National Historic Parks and Sites Branch, Parks Canada, Environment Canada: Ottawa, ON, Canada, 1982. [Google Scholar]
- Francis, P., Jr. Asia’s Maritime Bead Trade: 300 BC to the Present; University of Hawaii Press: Honolulu, HI, USA, 2002. [Google Scholar]
- Wood, M. A glass bead sequence for southern Africa from the 8th to the 16th century AD. J. Afr. Archaeol. 2011, 9, 67–84. [Google Scholar] [CrossRef]
- Wood, M. Glass beads from pre-European contact sub-Saharan Africa: Peter Francis’s work revisited and updated. Archaeol. Rese. Asia 2016, 6, 65–80. [Google Scholar] [CrossRef]
- Wood, M. Glass beads and Indian Ocean trade. In The Swahili World; Routledge: Oxford, UK, 2017; pp. 458–471. [Google Scholar]
- Koleini, F.; Colomban, P.; Pikirayi, I.; Prinsloo, L.C. Glass beads, markers of ancient trade in Sub-Saharan Africa: Methodology, state of the art and perspectives. Heritage 2019, 2, 2343–2369. [Google Scholar] [CrossRef]
- Baujard, P. The Worlds of the Indian Ocean: A Global History; Cambridge University Press: Cambridge, UK, 2019; Volume 2. [Google Scholar]
- Truffa Giachet, M.; Gratuze, B.; Mayor, A.; Huysecom, E. Compositional and provenance study of glass beads from archaeological sites in Mali and Senegal at the time of the first Sahelian states. PLoS ONE 2020, 15, e0242027. [Google Scholar] [CrossRef]
- Babalola, A.B. Glass beads in West Africa. In Oxford Research Encyclopedia of Anthropology; Oxford University Press: New York, NY, USA, 2022; Available online: https://www.researchgate.net/profile/AbidemiBabalola/publication/371702230_Glass_bead_in_West_Africa/links/64918331c41fb852dd19c4ee/Glass-bead-in-West-Africa.pdf (accessed on 7 December 2024).
- Dussubieux, L.; Walder, H. The Elemental Analysis of Glass Beads: Technology, Chronology and Exchange; Leuven University Press: Leuven, Belgium, 2022. [Google Scholar]
- Koleini, F.; Prinsloo, L.C.; Biemond, W.; Colomban, P.; Ngo, A.-T.; Boeyens, J.C.A.; Van der Ryst, M.M.; Van Brakel, K. Unravelling the glass trade bead sequence from Magoro hill, South Africa: Separating pre-seventeenth-century Asian imports from later European counterparts. Herit. Sci. 2016, 4, 43. [Google Scholar] [CrossRef]
- Colomban, P.; March, G.; Mazerolles, L.; Karmous, T.; Ayed, N.; Ennabli, A.; Slim, H. Raman Identification of Materials used for Jewelry and Mosaic in Ifriqiya. J. Raman Spectrosc. 2003, 34, 205–213. [Google Scholar] [CrossRef]
- Prinsloo, L.C.; Tournié, A.; Colomban, P. Raman classification of the glass beads excavated on Mapungubwe hill and K2, two archaeological sites in South Africa. J. Raman Spectrosc. 2012, 43, 532–542. [Google Scholar] [CrossRef]
- Koleini, F.; Prinsloo, L.C.; Biemond, W.; Colomban, P.; Ngo, A.-T.; Boeyens, J.C.A.; van der Ryst, M.M. Towards refining the classification of glass trade beads imported to southern Africa during 8th–16th century. J. Cult. Herit. 2016, 19, 435–444. [Google Scholar] [CrossRef]
- Fischbach, N.; Ngo, A.-T.; Colomban, P.; Pauly, M. Beads excavated from Antsiraka Boira necropolis (Mayotte Island, 12th–13th centuries) Colouring agents and glass matrix composition comparison with contemporary Southern Africa sites. ArcheoSciences 2016, 40, 83–102. [Google Scholar] [CrossRef]
- Costa, M.; Barrulas, P.; Dias, L.; da Conceição Lopes, M.; Barreira, J.; Clist, B.; Karklins, K.; de Jesus, M.D.P.; da Silva Domingos, S.; Vandenabeele, P.; et al. Multi-analytical approach to the study of the European glass beads found in the tombs of Kulumbimbi (Mbanza Kongo, Angola). Microchem. J. 2019, 149, 103990. [Google Scholar] [CrossRef]
- Boya, E. La Céramique de Dohouan: Aspect du Patrimoine des N’zéma-Adouvlè au Voisinage de la Forêt des Marais Tanoé-Ehy (FMTE- sud-est de la Côte d’Ivoire). Doctoral Thesis (Anthropologie/option: Archéologie, spécialité: Céramique), Université Félix Houphouet Boigny, Abidjan, Cote d’Ivoire, 2020; p. 381. [Google Scholar]
- Kouassi, K.S.; Boya, E.; Gratuze, B. Produits de traite et connexion Europe -sud côtier de la Côte d’Ivoire aux XVIIe-XIXe siècles. Orientations à travers les perles du site de Dohouan. e-Phaïstos [Enligne] 2024, XII-2. [Google Scholar] [CrossRef]
- MIPAF, Musée Itinérant de la Perle Ancienne-France. Available online: https://routesduverre.fr/recherche/musee-itinerant-de-la-perle-ancienne-en-france-mipaf (accessed on 10 August 2024).
- Available online: https://www.tourismeloiret.com/fr/diffusio/illustres/jean-felix-bapterosses-briare_TFOILLCEN045V509TG8 (accessed on 20 May 2025).
- Kouassi, K.; Koffi, K.; Kouassi, F.; Coulibaly, D.; Yao, K.; Boya, E. L’archéologie dans la patrimonialisation de la forêt des marais Tanoé-Ehy (FMTE-sud-est-Côte d’Ivoire). Première campagne de fouille sur le site de Dohouan 1. Cah. CERLESHS 2017, 55, 157–166. [Google Scholar]
- Koffi, K. Les Contacts Europe-Afrique du XVIe au XXe Siècle: Analyse des Perles de Verre de Dohouan (sud-est de la Côte d’Ivoire). Ph.D. Thesis, Université Paris 1 Panthéon Sorbonne, Paris, France, 2025. [Google Scholar]
- Gratuze, B. Glass Characterization Using Laser Ablation-Inductively Coupled Plasma-Mass Spectrometry Methods. In Recent Advances in Laser Ablation ICP-MS for Archaeology; Dussubieux, L., Golitko, M., Gratuze, B., Eds.; Springer: Berlin/Heidelberg, Germany, 2016; pp. 179–196. [Google Scholar]
- Colomban, P. Polymerization degree and Raman identification of ancient glasses used for jewellery, ceramics enamels and mosaics. J. Non-Crystall. Solids 2003, 323, 180–187. [Google Scholar] [CrossRef]
- Colomban, P.O. Paulsen, Non-destructive Determination of the Structure and Composition of Glazes by Raman Spectroscopy. J. Am. Ceram. Soc. 2005, 88, 390–395. [Google Scholar] [CrossRef]
- Burgio, L.; Clark, R.J.H. Library of FT-Raman spectra of pigments, minerals, pigment media and varnishes, and supplement to existing library of Raman spectra of pigments with visible excitation. Spectrochim. Acta Part A 2001, 57, 1491–1521. [Google Scholar] [CrossRef]
- Colomban, P. The Destructive/Non-Destructive Identification of Enameled Pottery, Glass Artifacts and Associated Pigments—A Brief Overview. Arts 2013, 2, 77–110. [Google Scholar] [CrossRef]
- Faurel, X.; Vanderperre, A.; Colomban, P. Pink Pigment optimisation by resonance Raman Spectroscopy. J. Raman Spectrosc. 2003, 34, 290–294. [Google Scholar] [CrossRef]
- Colomban, P. The use of metal nanoparticles to produce yellow, red and iridescent colour, from Bronze Age to Present Times in Lustre pottery and glass: Solid state chemistry, spectroscopy and nanostructure. J. Nano Res. 2009, 8, 109–132. [Google Scholar] [CrossRef]
- Edwards, H.G.M.; Vandenabeele, P.; Colomban, P. Raman Spectroscopy in Cultural Heritage Preservation; Springer: Cham, Switzerland, 2023. [Google Scholar]
- Colomban, P. Full spectral range Raman signatures related to changes in enameling technologies from the 18th to the 20th Century: Guidelines, effectiveness and limitations of the Raman analysis. Materials 2022, 15, 3158. [Google Scholar] [CrossRef]
- Seifert, F.A.; Mysen, B.O.; Virgo, D. Three-dimensional network structure of quenched melts (glass) in the systems SiO2–NaAlO2, SiO2–CaAl2O4 and SiO2–MgAl2O4. Am. Mineral. 1982, 67, 696–717. [Google Scholar]
- Mysen, B.O.; Virgo, D.; Scarfe, C.M. Relations between the anionic structure and viscosity of silicate melts—A Raman spectroscopic study. Am. Mineral. 1980, 65, 690–710. [Google Scholar]
- McMillan, P.F.; Piriou, B. Raman spectroscopic studies of silicate and related glass structure: A review. Bull. Minéral. 1983, 106, 57–75. [Google Scholar] [CrossRef]
- Colomban, P.; Tournié, A.; Bellot-Gurlet, L. Raman Identification of glassy silicates used in ceramic, glass and jewellry: A tentative differentiation guide. J. Raman Spectrosc. 2006, 37, 841–852. [Google Scholar] [CrossRef]
- Edwards, H.G.M.; Colomban, P.; Bowden, B. Raman spectroscopic analysis of an English soft-paste porcelain plaque-mounted table. J. Raman Spectrosc. 2004, 35, 656–661. [Google Scholar] [CrossRef]
- Colomban, P.; Treppoz, F. Identification and Differentiation of Ancient and Modern European Porcelains by Raman Macro- and Microspectroscopy. J. Raman Spectrosc. 2001, 32, 93–102. [Google Scholar] [CrossRef]
- Colomban, P.; Simsek Franci, G. Timurid, Ottoman, Safavid and Qajar Ceramics: Raman and Composition Classification of the Different Types of Glaze and Pigments. Minerals 2003, 13, 977. [Google Scholar] [CrossRef]
- Bersani, D.; Lottici, P.P. Raman spectroscopy of minerals and mineral pigments in archaeometry. J. Raman Spectrosc. 2016, 47, 499–530. [Google Scholar] [CrossRef]
- Shapiro, S.M.; O’Shea, D.C.; Cummins, H.Z. Raman scattering study of the alpha-beta phase transition in quartz. Phys. Rev. Lett. 1967, 19, 361. [Google Scholar] [CrossRef]
- Syme, R.W.G.; Lockwood, D.J.; Kerr, H.J. Raman spectrum of synthetic zircon (ZrSiO4) and thorite (ThSiO4). J. Phys. C Solid State Phys. 1977, 10, 1335. [Google Scholar] [CrossRef]
- Sun, J.; Wu, Z.; Cheng, H.; Zhang, Z.; Frost, R.L. A Raman spectroscopic comparison of calcite and dolomite. Spectrochim. Acta Part A Mol. Biomol. Spectrosc. 2014, 117, 158–162. [Google Scholar] [CrossRef]
- De Aza, P.N.; Santos, C.; Pazo, A.; De Aza, S.; Cusco, R.; Artus, L. Vibrational properties of calcium phosphate compounds. 1. Raman spectrum of β-tricalcium phosphate. Chem. Mater. 1997, 9, 912–915. [Google Scholar] [CrossRef]
- Richet, P.; Mysen, B.O.; Ingrin, J. High-temperature X-ray diffraction and Raman spectroscopy of diopside and pseudowollastonite. Phys. Chem. Miner. 1998, 25, 401–414. [Google Scholar] [CrossRef]
- Koenig, J.L. Raman scattering of synthetic polymers—A review. Appl. Spectrosc. Rev. 1971, 4, 233–305. [Google Scholar] [CrossRef]
- Van Pevenage, J.; Lauwers, D.; Herremans, D.; Verhaeven, E.; Vekemans, B.; de Clercq, W.; Vincze, L.; Moens, L.; Vandenabeele, P. A combined spectroscopic study on Chinese porcelain containing ruan-cai colours. Anal. Methods 2014, 2, 6387–6394. [Google Scholar] [CrossRef]
- De Faria, D.L.; Venâncio Silva, S.; de Oliveira, M.T. Raman microspectroscopy of some iron oxides and oxyhydroxides. J. Raman Spectrosc. 1997, 28, 873–878. [Google Scholar] [CrossRef]
- Kırmızı, B.; Colomban, P.; Quette, B. On-site analysis of Chinese Cloisonné enamels from fifteenth to nineteenth centuries. J. Raman Spectrosc. 2010, 41, 780–790. [Google Scholar] [CrossRef]
- Alencar, I.; Ruiz-Fuertes, J.; Schwartz, K.; Trautmann, C.; Bayarjargal, L.; Haussühl, E.; Winkler, B. Irradiation effects in CaF2 probed by Raman scattering. J. Raman Spectrosc. 2016, 47, 978–983. [Google Scholar] [CrossRef]
- Fornacelli, C.; Colomban, P.; Turbanti Memmi, I. Toward a Raman/FORS discrimination between Art Nouveau and contemporary stained glasses from CdSxSe1−x nanoparticles signatures. J. Raman Spectrosc. 2015, 46, 1129–1139. [Google Scholar] [CrossRef]
- Jankowiak, R.; Roberts, K.; Tomasik, P.; Sikora, M.; Small, G.J.; Schilling, C.H. Probing the crystalline environment of α-alumina via luminescence of metal ion impurities: An optical method of ceramic flaw detection. Mater. Sci. Eng. A 2000, 281, 45–55. [Google Scholar] [CrossRef]
- Deléglise, F.; Berger, M.H.; Jeulin, D.; Bunsell, A.R. Microstructural stability and room temperature mechanical properties of Nextel 720 fibre. J. Eur. Ceram. Soc. 1980, 21, 569–580. [Google Scholar] [CrossRef]
- Hadjiev, V.G.; Iliev, M.N.; Vergilov, I.V. The Raman spectra of Co3O4. J. Phys. C Solid State Phys. 1988, 21, L199. [Google Scholar] [CrossRef]
- Agye, I.K.; Adu-Agyem, J.; Steiner, R. Exploring traditional glass bead making techniques in jewellery. J. Sci. Technol. 2012, 32, 103–112. [Google Scholar] [CrossRef][Green Version]
- Abraham, S.A. Glass beads and glass production in early South India: Contextualizing Indo-Pacific bead manufacture. Archaeol. Res. Asia 2016, 6, 4–15. [Google Scholar] [CrossRef]
- Available online: https://prossertheengineer.com/ (accessed on 10 March 2025).
- Available online: https://prossertheengineer.com/images/PDF/Patent_No._8548_17_June_1840_(Dust-Pressed_Process).pdf (accessed on 10 March 2025).
- Kaspers, F. Beads from Briare. The Story of a Bead Revolution from France, Marblings Publishing. 2011. Available online: https://www.google.com/url?sa=t&source=web&rct=j&opi=89978449&url=https://www.blurb.co.uk/b/2602875-beads-from-briare&ved=2ahUKEwiTmoWIsdmHAxWCdKQEHUSHHnkQFnoECBIQAQ&usg=AOvVaw3T_Brzj88gFOwX3IP61Aiy (accessed on 20 May 2025).
- Quintero, R.J.N.; Guillemet, S.; Aguilar-Garib, J.A.; Melo, M.E.R.; Durand, B. The thickness of BaTiO3 tape castings as function of the slip system. J. Ceram. Process. Res. 2012, 13, 101–104. [Google Scholar]
- Prinsloo, L.C.; Boeyens, J.C.; Van der Ryst, M.M.; Webb, G. Raman signatures of the modern pigment (Zn, Cd) S1−x Sex and glass matrix of a red bead from Magoro Hill, an archaeological site in Limpopo Province, South Africa, recalibrate the settlement chronology. J. Mol. Struct. 2012, 1023, 123–127. [Google Scholar] [CrossRef]
- Eppler, R.A.; Eppler, D.R. Glazes and Glasses Coatings; The American Ceramics Society: Westerville, OH, USA, 2000. [Google Scholar]
- Opper, M.J.; Opper, H. French beadmaking: An historical perspective emphasizing the 19th and 20th Centuries. Beads J. Soc. Bead Res. 1991, 3, 47–59. [Google Scholar]
- Francis, P., Jr. Beadmaking at Arikamedu and beyond. World Archaeol. 1991, 23, 28–43. [Google Scholar] [CrossRef]
- Van der Sleen, W.G.N. Ancient glass beads with special reference to the beads of East and Central Africa and the Indian Ocean. J. R. Anthropol. Inst. G. B. Irel. 1958, 88, 203–216. [Google Scholar] [CrossRef]
- Beck, R.B. Bibles and beads: Missionaries as traders in southern Africa in the early nineteenth century. J. Afr. Hist. 1989, 30, 211–225. [Google Scholar] [CrossRef]
- Opper, M.J.; Opper, H. Diakhité: A study of the beads from an 18th-19th-century burial site in Senegal, West Africa. Beads J. Soc. Bead Res. 1989, 1, 5–20. [Google Scholar] [CrossRef]
- Saitowitz, S.J. 19th Century Glass Trade Beads: From Two Zulu Royal Residences. Doctoral Dissertation, University of Cape Town, Cape Town, South Africa, 1990. [Google Scholar]
- Mann, R. The history of beads in East Africa. Kenya Past Present 2000, 31, 6–47. [Google Scholar] [CrossRef]
- Burgess, L.E.; Dussubieux, L. Chemical composition of late 18th- and 19th-century glass beads from western North America: Clues to sourcing beads. Beads J. Soc. Bead Res. 2007, 19, 58–73. [Google Scholar]
- Billeck, W.T. Red-on-white drawn or cornelian beads: A 19th-century temporal marker for the plains. Beads J. Soc. Bead Res. 2008, 20, 49–61. [Google Scholar]
- Eagleton, C.; Fuller, H.; Perkins, J. (Eds.) Money in Africa; The British Museum: London, UK, 2009; Available online: https://www.researchgate.net/profile/Karin-Pallaver/publication/304309581_A_Recognized_Currency_in_Beads_Glass_Beads_as_Money_in_Nineteenth-century_East_Africa_the_Central_Caravan_Road/links/576bbfb808aefcf135c00813/A-Recognized-Currency-in-Beads-Glass-Beads-as-Money-in-Nineteenth-century-East-Africa-the-Central-Caravan-Road.pdf (accessed on 19 May 2025).
- Marshall, L.W. Typological and interpretive analysis of a 19th-century bead cache in coastal Kenya. J. Afr. Archaeol. 2012, 10, 89–205. [Google Scholar] [CrossRef]
- Marshall, L.W. Consumer choice and beads in fugitive slave villages in nineteenth-century Kenya. Int. J. Hist. Archaeol. 2019, 23, 103–128. [Google Scholar] [CrossRef]
- Hons, B.A. The Glass Beads from Maleoskop, the 19th-Century Capital of the Bakopa in the Groblersdal Area, Limpopo Province. Doctoral Dissertation, University of Pretoria, Pretoria, South Africa, 2009. [Google Scholar]
- Robertshaw, P.; Wood, M.; Haour, A.; Karklins, K.; Neff, H. Chemical analysis, chronology, and context of a European glass bead assemblage from Garumele, Niger. J. Archaeol. Sci. 2014, 41, 591–604. [Google Scholar] [CrossRef]
- Denbow, J.; Klehm, C.; Dussubieux, L. The glass beads of Kaitshàa and early Indian Ocean trade into the far interior of southern Africa. Antiquity 2015, 89, 361–377. [Google Scholar] [CrossRef]
- Karklins, K.; Jargstorf, S.; Zeh, G.; Dussubieux, L. The Fichtelgebirge bead and button industry of Bavaria. Beads J. Soc. Bead Res. 2016, 28, 16–37. [Google Scholar]
- Biginagwa, T.J. Counterfeit glass beads during the East African caravan trade: Mineralogical and gemnological analysis. UMMA 2023, 10, 1–28. [Google Scholar] [CrossRef]


Disclaimer/Publisher’s Note: The statements, opinions and data contained in all publications are solely those of the individual author(s) and contributor(s) and not of MDPI and/or the editor(s). MDPI and/or the editor(s) disclaim responsibility for any injury to people or property resulting from any ideas, methods, instructions or products referred to in the content. |
© 2025 by the authors. Licensee MDPI, Basel, Switzerland. This article is an open access article distributed under the terms and conditions of the Creative Commons Attribution (CC BY) license (https://creativecommons.org/licenses/by/4.0/).