Article

Development and Characterization of Pyrolyzed Sodium Alginate–Montmorillonite Composite for Efficient Adsorption of Emerging Pharmaceuticals: Experimental and Theoretical Insights

by
Ibrahim Allaoui
1,*,
Rachid Et-Tanteny
2,
Imane Barhdadi
1,
Mohammad Elmourabit
1,
Brahim Arfoy
3,
Youssef Draoui
4,
Mohamed Hadri
1 and
Khalid Draoui
1,*
1
Materials Engineering and Sustainable Energy Laboratory, Faculty of Sciences, Abdelmalek Essaadi University, Tetouan 93002, Morocco
2
Laboratory of Mathematics, Modeling and Applied Physics, Ecole Normale Superieure, Sidi Mohamed Ben Abdellah University, Fez P.O. Box 5206, Morocco
3
Solid-State Chemistry Laboratory, Faculty of Sciences, Abdelmalek Essaadi University, Tetouan 93002, Morocco
4
Institute of Condensed Matter and Nanosciences Molecular Chemistry, Materials and Catalysis (IMCN/MOST), Université Catholique de Louvain, Place L. Pasteur 1, 1348 Louvain-la-Neuve, Belgium
*
Authors to whom correspondence should be addressed.
Ceramics 2025, 8(2), 60; https://doi.org/10.3390/ceramics8020060
Submission received: 29 March 2025 / Revised: 14 May 2025 / Accepted: 14 May 2025 / Published: 21 May 2025
(This article belongs to the Special Issue Advances in Ceramics, 3rd Edition)

Abstract

The present study aims to prepare a composite via pyrolysis, based on sodium alginate (SA) and a natural clay collected from the eastern region of Morocco, specifically the OUJDA area (C.O.R), for use in the disposal process of emerging pharmaceuticals. The strategy of rapid microwave heating followed by nitrogen calcination at 500 °C was successfully applied to produce the pyrolyzed carbonaceous materials. The removal of paracetamol (PCT) by adsorption on the carbonaceous clay (ca-C.O.R) composite was investigated to determine the effect of operating parameters (initial contaminant concentration, contact time, pH, and temperature) on the efficiency of PCT removal. The nanocomposite was analyzed using various techniques, including the nitrogen gas adsorption–desorption isothermal curve, X-ray diffraction, scanning electron microscopy, and Fourier transform infrared spectroscopy. Three models were used to describe the kinetic adsorption, and it was found that the experimental kinetic data fit well with a pseudo-second-order kinetic model with a coefficient of determination R2 close to one, a nonlinear chi-square value close to zero, and a reduced root mean square error RMSE (R2 → 1, X2 → 0 and lower RMSE). The adsorption was best described by the Sips isotherm. The ca-C.O.R composite achieved a PCT removal efficiency of 91% and a maximum adsorption capacity of 122 mg·g−1 improving on the performance of previous work. Furthermore, the variation in enthalpy (∆H°), Gibbs free energy (∆G°), and entropy (∆S°) indicated that the adsorption is exothermic in nature. The composite has shown promising efficiency for the adsorption of PCT as a model of emergent pollutant from aqueous solutions, making it a viable option for industrial wastewater treatment. Using Density Functional Theory (DFT) along with the 6-31G (d) basis set, the geometric structure of the molecule was determined, and the properties were estimated by analyzing its boundary molecular orbitals. The adsorption energy of PCT on MMT and ca-C.O.R studied using the Monte Carlo (MC) simulation method was −120.3 and −292.5 (kcal·mol−1), respectively, which shows the potential of the two adsorbents for the emerging product.

Graphical Abstract

1. Introduction

In recent decades, a global increase has been observed in the consumption of various pharmaceuticals by animals and humans worldwide for the treatment of disease. This widespread misuse has resulted in pharmaceutical compounds commonly being found in both natural and contaminated water sources, posing a threat to living organisms and the environment [1].
Pharmaceuticals, classified as “emerging contaminants”, can be found in aquatic systems at levels ranging from ng·L−1 to μg·L−1. Although essential to human and animal health, these drugs are not completely eliminated by conventional treatments, resulting in their presence in wastewater [2,3,4]. A significant portion of these pharmaceuticals are not fully metabolized in the human body and persist through wastewater treatment plants, ultimately ending up in lakes, rivers, groundwater, and other water bodies. The presence of these contaminants can also prevent the reuse of treated wastewater as drinking water [5]. Among these contaminants, paracetamol, also known as acetaminophen [6], is notable for its potential adverse effects, including the formation of a hepatotoxic metabolite and degradation into 4-aminophenol, a toxic and carcinogenic compound [1,7,8,9]. The maximum concentration of PCT in fresh water can reach 15,700 ng·L−1 [10].
Addressing this issue requires a long-term solution for the removal of PCT contaminants from various types of water sources, including wastewater, industrial waste, and surface and groundwater. Numerous advanced techniques have been proposed, such as advanced oxidation processes, ozonation, reverse osmosis, photocatalytic degradation [11,12,13], and membrane filtration [14,15]. However, these methods are often expensive and technically demanding. In contrast, the adsorption process offers a more practical and economical solution [14], as it uses a low-cost precursor to produce the adsorbent. This process involves the transfer of molecules from a liquid to a solid surface, occurring either through physisorption or chemisorption, depending on the nature of the intermolecular forces involved [16,17,18]. The reverse phenomenon, in which adsorbed molecules are released from the surface, is known as desorption. Physisorption involves weak interactions, such as van der Waals forces, whereas chemisorption is based on stronger interactions, including chemical bonding or electrostatic forces [19].
Various supports, such as natural or modified biochar, zeolites, hydroxyapatite, and activated carbon, have been used to adsorb water contaminants [20,21,22,23,24]. In addition, clay minerals (natural or modified) have also been used as adsorbents [25,26]. Clay minerals (natural or modified) have gained increasing interest over the years due to their unique properties, including availability, high specific surface area, porosity, structural modifiability, low cost, nontoxicity, and easy regeneration [27,28]. This has made them a promising option for the development of composites for wastewater treatment. Given these considerations, this study presents an efficient strategy for synthesizing clay-based composites by physically mixing alginate and clay, followed by heating under microwave irradiation and in a conventional oven under a nitrogen atmosphere.
The objective of this study was to evaluate the performance of a composite ca-C.O.R, in PCT adsorption from an aqueous medium. The physical and chemical properties of the composite were investigated using techniques. The adsorption behavior was thoroughly analyzed in terms of pH dependence, kinetics, isotherms, and thermodynamics. In addition, molecular simulation was used to gain deeper insights into the adsorption mechanism, including the verification of electrostatic interactions.

2. Materials and Methods

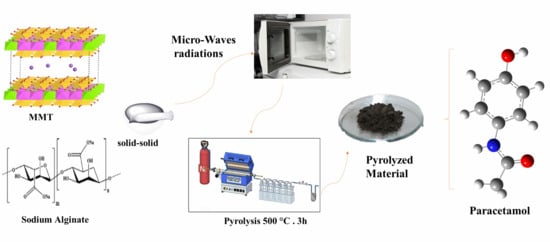
2.1. Preparation of Carbonaceous Composite

Two different heating methods were employed to produce the composite material. The first utilized a household microwave, while the second involved a conventional oven in an inert atmosphere, with a flow of nitrogen gas to prevent organic combustion.
The pyrolyzed materials obtained after microwave treatment were synthesized through a solid–solid reaction by mixing 0.5 g of medium-viscosity sodium alginate (A2033, Sigma-Aldrich, St. Louis, MO, USA) with 1.5 g of raw clay collected from the oriental region of Morocco. The mixture was then heated in a 450 W microwave chamber for one hour. The resulting powder was then pyrolyzed at 500 °C in a furnace under nitrogen gas for three hours, under a constant nitrogen flow rate of 100 mL·min−1.

2.2. Characterization Techniques

The crystallinity of the sample was determined by using a Bruker D8 ADVANCE diffractometer (Bruker AXS GmbH, Karlsruhe, Germany) with a Cu Ka monochromatic at λ = 1.54056 Å (40 kV, 40 mA) to scan the range of 2θ = 5–60° at a scan rate of 0.05° and a scan step time of 0.5 s. The specific surface area was determined using the BET method by N2 adsorption at liquid nitrogen temperature using an ASAP2420 micrometric instrument (Micromeritics Instrument Corp., Norcross, GA, USA). An FTIR spectrophotometer equipped with the ATR accessory (PerkinElmer Inc., Waltham, MA, USA) was used to obtain the Fourier transform infrared spectrum and to identify surface functional groups. The surface morphology and elemental composition of the samples were examined using energy-dispersive X-ray spectroscopy and a Carl Zeiss Auriga (Carl Zeiss Microscopy GmbH, Oberkochen, Germany) field emission scanning electron microscope (FESEM) operating at 100 kV. The thermal stability of C.O.R and ca-C.O.R materials was studied using a Thermogram Shimadzu D60 (Shimadzu Corporation, Kyoto, Japan) within the range of 25–1000 °C with a rate of 10 °C·min−1. The pH values were measured using a pH meter (913 pH meter Metrohm AG, Herisau, Switzerland. The zeta potential is determined from the supernatant using a Malvern Zetasizer Nano ZS (Malvern Instruments Ltd., Malvern, UK). To evaluate the hydrophobicity of the C.O.R and ca-C.O.R materials, 60 mg of each sample was dispersed in a solvent mixture consisting of 2 mL of n-hexane and 2 mL of water. The dispersion was stirred for one hour to ensure thorough mixing, followed by four hours of static settling. The procedure was designed to observe the interaction of the samples with the solvent phases without any further disturbance during the settling process.

2.3. Adsorption Studies

The PCT (C8H9NO2) solution was prepared by diluting a 1000 mg·L−1 stock solution in deionized water. Adsorption experiments were conducted by mixing 20 mg of adsorbent with 20 mL of PCT solution (100–1000 mg·L−1) at room temperature and pH ≈ 7.6, under constant stirring (150 rpm) for 240 min. The tests were performed in beakers. After separation of the suspension by centrifugation for 10 min at 4200 rpm, the concentration of PCT was determined using ultraviolet-visible spectroscopy at a wavelength of 243 nm with a JENWAY UV-7205 spectrophotometer (Jenway, Staffordshire, UK). The pH was adjusted to a specific value by adding sodium hydroxide, NaOH 1M, or hydrochloric acid, HCl, 1 M. The impact of the concentration of the starting solute, temperature, contact time, and other factors was evaluated. The following equation was used to calculate the adsorbed quantity (Qe):
Q e = ( C 0 C e ) V m .
The percentage removal (%) of PCT using the following equation:
%   Removal = ( C 0 C e C 0 )   ×   100
where C0 (mg·L−1) is the initial concentration, Ce (mg·L−1) is the equilibrium concentration, V (mL) is the volume of the solution and m (mg) is the weight of adsorbent.

2.4. Analysis Data

Table 1 lists the mathematical equations for various adsorption isotherm models, kinetic models, and error functions.

2.5. Computational Details

2.5.1. Quantum Chemical Calculation

Computational chemistry calculations were performed to investigate the reactivity of PCT. The ground-state geometries of all structures were optimized using Density Functional Theory (DFT) with the B3LYP functional [40] and the 6-31G(d) basis set. All calculations were performed in the aqueous phase using the polarizable continuum model (PCM) as implemented in the Gaussian 09 software Revision D.01 package [41,42,43].To investigate the electronegativity and polarity, the researchers examined electrostatic potential (ESP) maps. They also evaluated the electronic properties of the system; key orbitals include the highest occupied molecular orbital (HOMO). Also important is the lowest occupied molecular orbital (LUMO) and the energy gap (Eg). Molecular orbital theory (MOT) was used to evaluate the charge transfer between the donor and acceptor molecules, with electrons transferring from the HOMO of the donor molecule to the LUMO of the acceptor molecule. To investigate the chemical stability, the researchers calculated additional parameters such as electronegativity (χ), dipole moment (μ), and hardness (η) [44].

2.5.2. Molecular Dynamics

In order to elucidate the interfacial interactions between PCT and the ca-C.O.R. composite, Monte Carlo simulations were performed using the Adsorption Locator module within the Materials Studio 2020 modeling package (BIOVIA, Dassault Systems). The simulations employed the Universal Force Field (UFF) and used an annealing protocol to explore the most favorable adsorption configurations [45].
The sodium alginate pyrolyzed at 500 °C was modeled from the organic fragments identified by Py-GC/MS analysis (toluene, palmitic acid, isopropyl myristate, 3-penten-1-ol, 2-5H-furanone and sodium carbonate residue) based on published results in [46]. X-ray diffraction analysis was conducted in order to confirm the presence of smectite as the mineral phase. Following the modification, it is hypothesized that the partial coverage of the surface of the clay mineral smectite is by the biochar. The analysis yielded characteristic peaks corresponding to montmorillonite (MMT), thus validating the selection of this clay for the adsorption studies. The modified montmorillonite surface was generated from experimental crystallographic data (a = 5.23Å, b = 9.06Å, c = 12.5Å) [47], with cleavage along the [001] plane to give a 6 × 4 mesh surface (41.840 × 36.120 Å2). The substrate model was constructed by superimposing montmorillonite and a discontinuous layer of carbonaceous residues from alginate pyrolysis, with an adsorption interface limited to <10 Å. The dimensions chosen make it possible to accommodate target molecules (dyes or organic pollutants). The charge of atoms in montmorillonite and water was calculated by the Compass III charge QEq method, and the atomic charge of PCT was calculated by the density functional theory (DFT). The calculations consisted of five simulated annealing cycles, each comprising 50,000 iterations, with temperatures ranging from 105 to 102 K, a time step of 0.1 fs, and a total duration of 50 ps, under NVT conditions (constant volume and temperature). These parameters, validated for the adsorption of small molecules [35,36], were adapted to take account of the disordered nature of the pyrolysis residues and the enhanced electrostatic interactions at the clay–carbon interface.

3. Results and Discussion

3.1. Materials Characterization

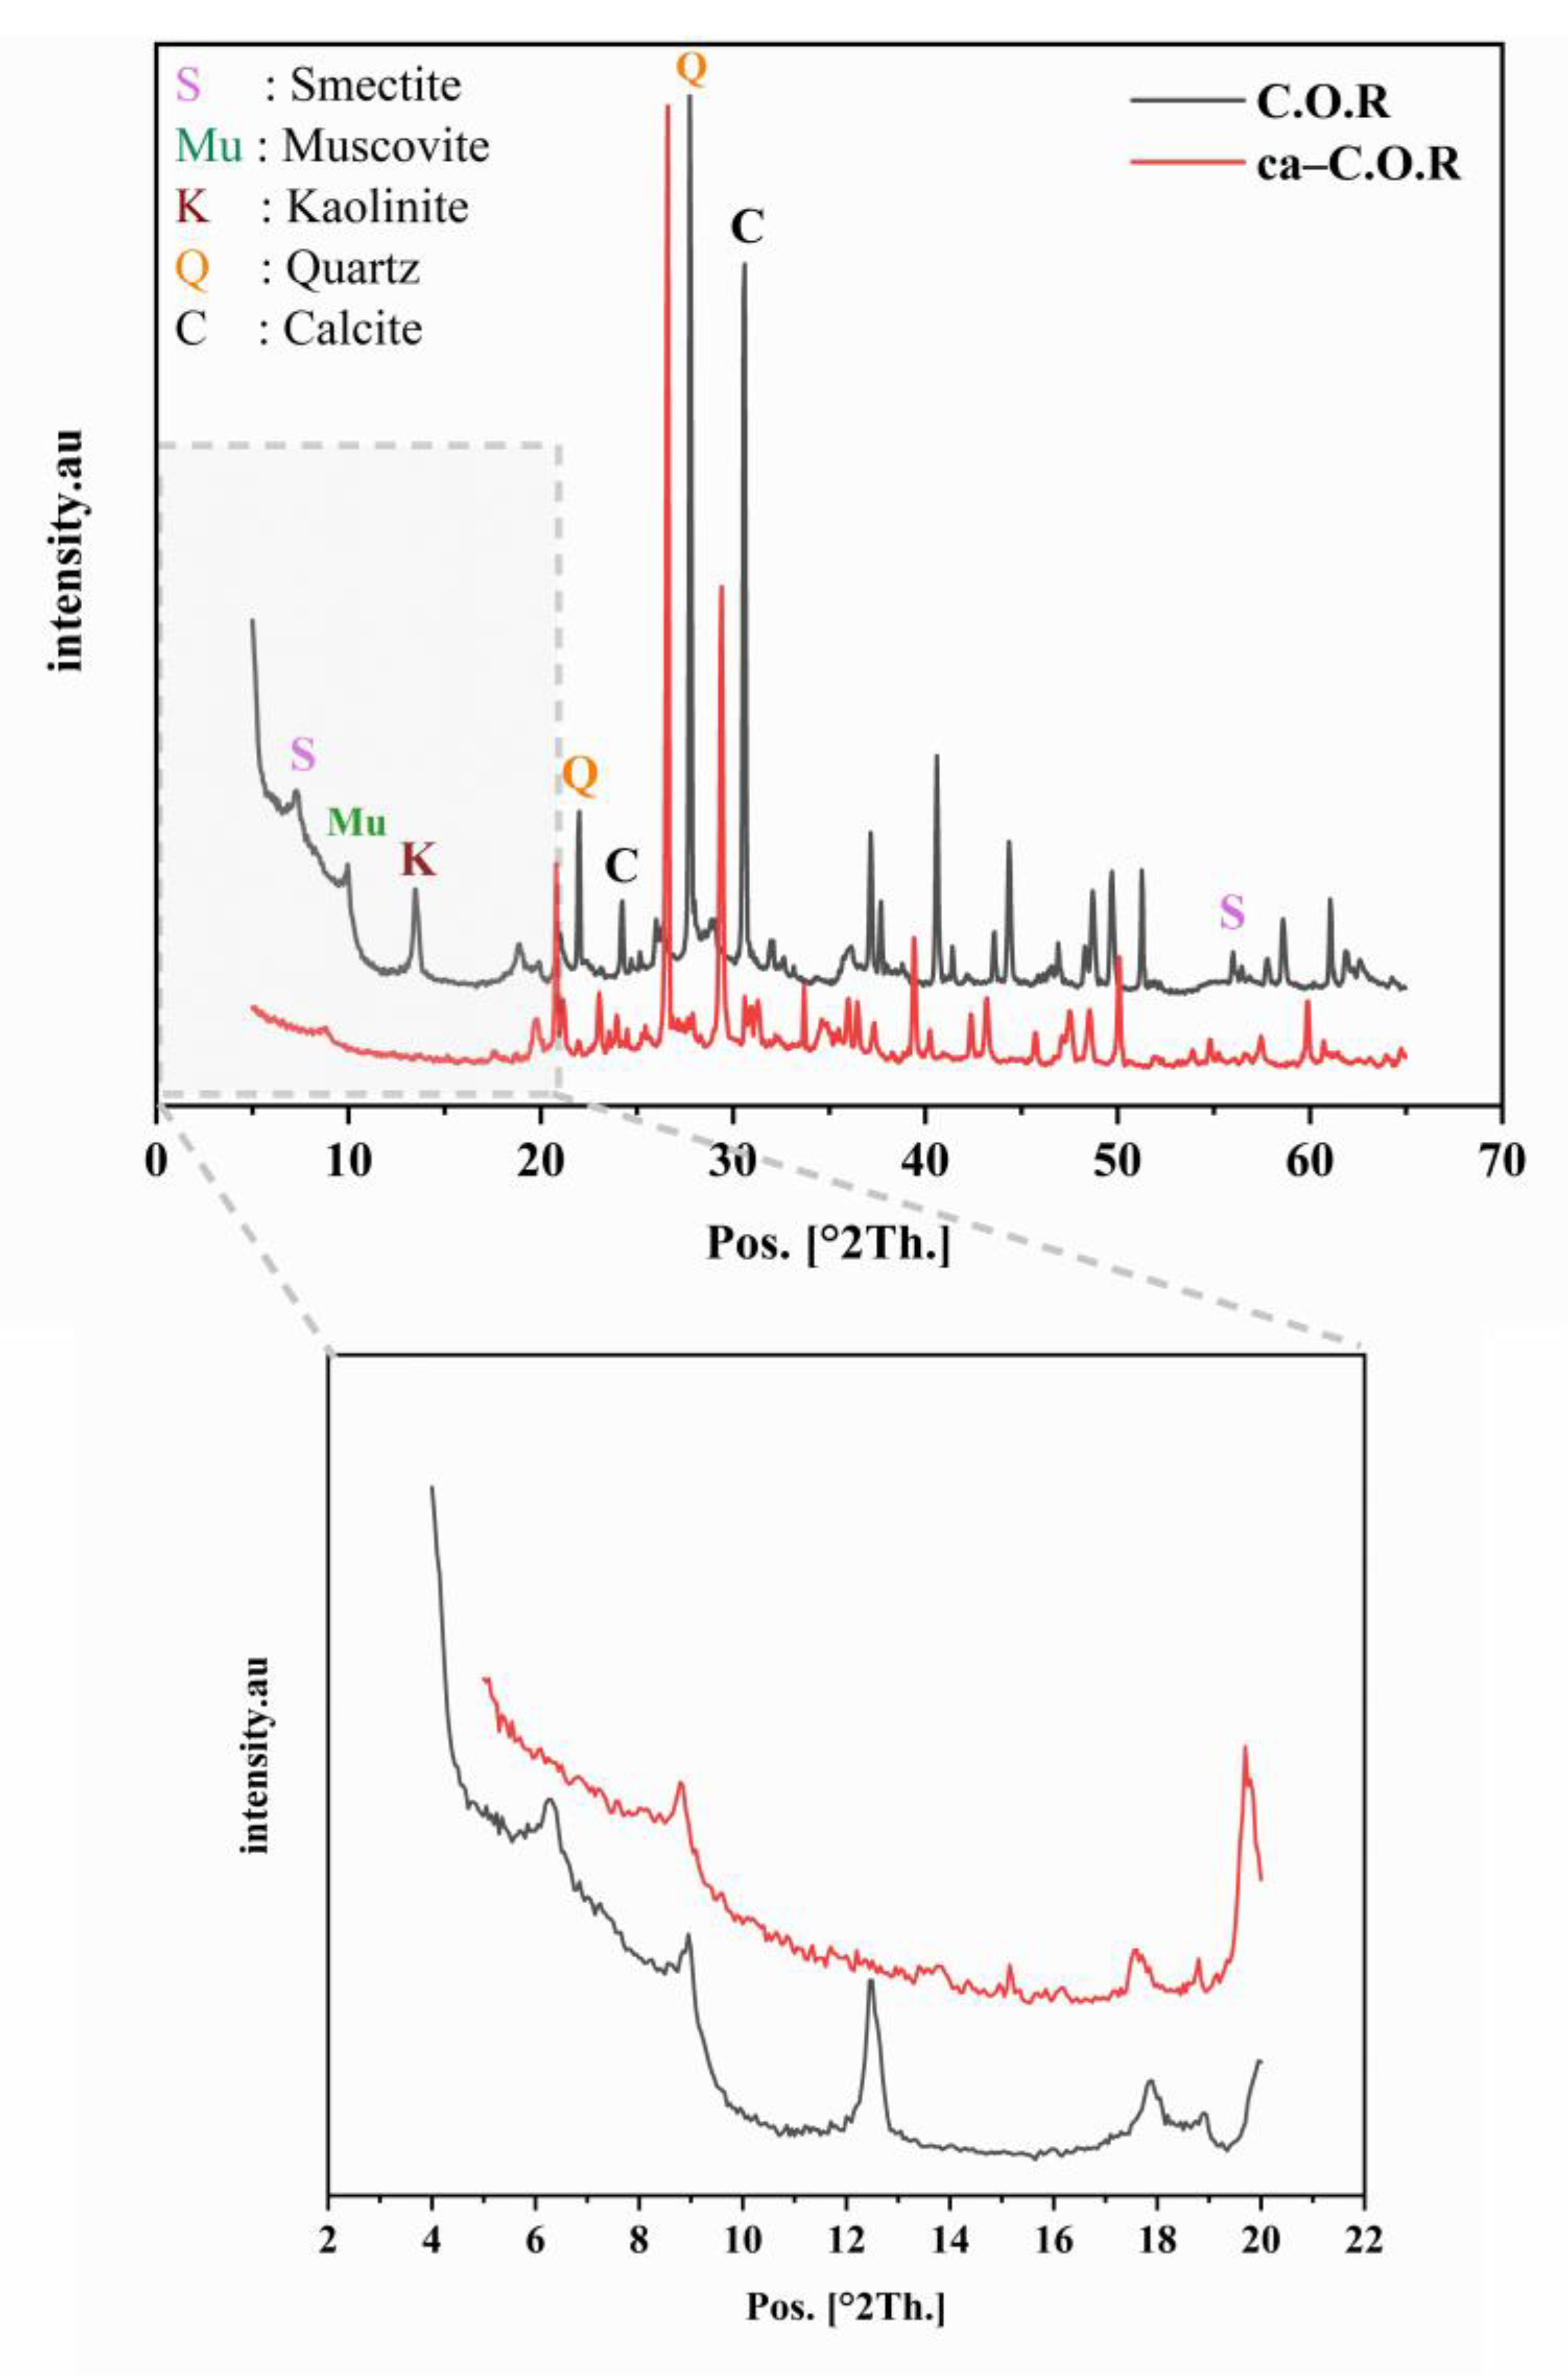
3.1.1. X-Ray Diffraction Analysis

The XRD diagram of the C.O.R clay (Figure 1) exhibited characteristic reflections corresponding to its crystalline phases. Notably, the smectite group (montmorillonite) was identified by its principal d001 reflection at 13.84 Å (2θ = 6.37°), while kaolinite showed a reflection at 7.10 Å (2θ = 12.58°), and muscovite was detected with a low-intensity peak at 9.78 Å (2θ = 9.03°). A semi-quantitative analysis of the XRD data, performed using the 2025 COD database, revealed the approximate relative proportions of the mineral phases as follows: montmorillonite (~42%), kaolinite (~6%), muscovite (~19%), calcite (~20%), and quartz (~13%). These values have been included to enhance transparency and support the interpretation of the adsorption performance. The XRD pattern of the ca-C.O.R composite showed a slight shift in the d001 reflection of muscovite to 10.01 Å, indicating an expansion of the basal spacing likely due to intercalation or structural modification during the synthesis with sodium alginate. Furthermore, the disappearance or attenuation of several peaks—particularly those associated with smectite and kaolinite—may result from partial coverage of the clay surface by biochar derived from pyrolyzed sodium alginate and from the thermal transformation of crystalline kaolinite into semi-crystalline metakaolinite [48,49,50,51].

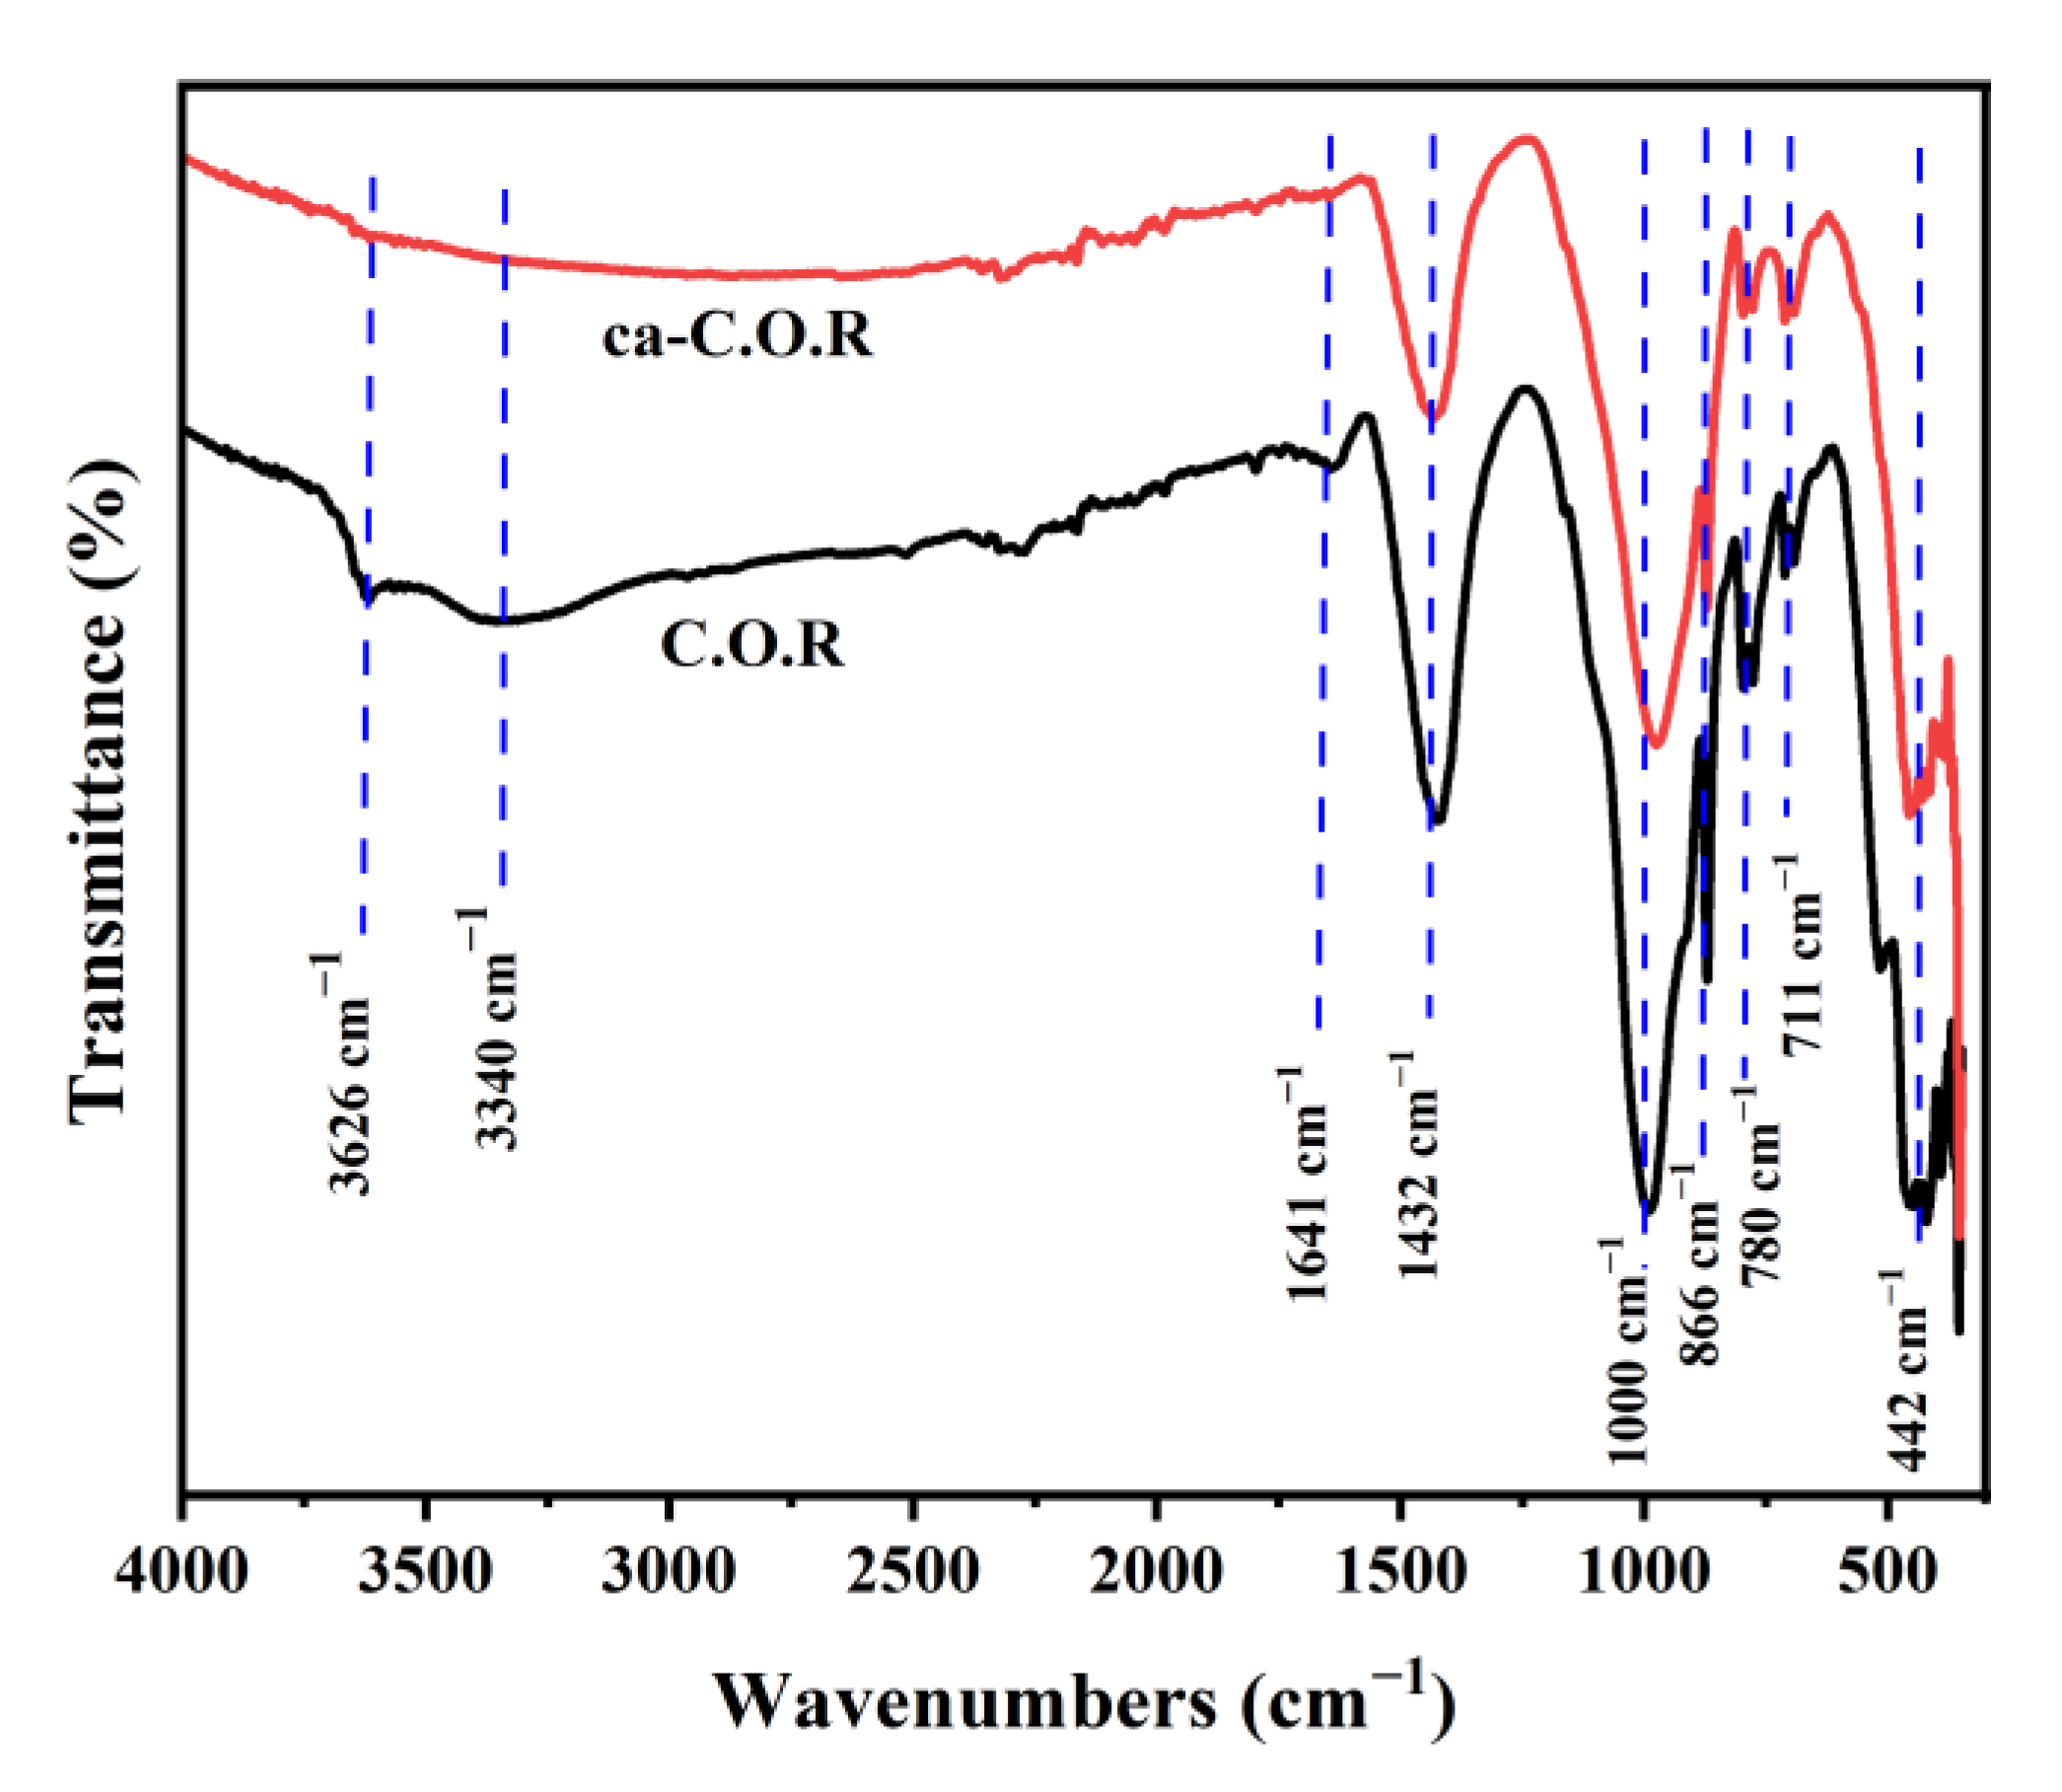
3.1.2. FTIR Analysis

FT-IR spectra for C.O.R and ca-C.O.R samples were recorded in the 400–4000 cm−1 region (as shown in Figure 2). Both C.O.R and ca-C.O.R FT-IR spectra reveal a similar peak shape, except for the disappearance of the 3626 and 3340 cm−1 bands after SA incorporation and calcination. The 3626 cm−1 bands are attributed to the Al–OH stretching vibrations. In the C.O.R sample, the decrease in intensity of the 3340 cm−1 (H–O–H stretching) and 1641 cm−1 (H–O–H bending) bands, which are typically associated with interlayer water in smectite, indicates a lower amount of hydrated smectite phases compared to typical dioctahedral smectite minerals [52,53]. The presence of Si–O stretching in the clay was indicated by the bands at the 1000 cm−1 region, and Si–O bending in quartz was indicated by the 711 and 780 cm−1 bands [54]. The 522 cm−1 band indicated the Al–O–Si strain, while the 442 cm−1 band is related to the Si–O–Si strain [55]. A broad band at 1426 cm−1 was detected in the FTIR spectrum of the C.O.R. clay, indicating the presence of carbonates [53]. In addition, the 1641, 3340, and 3626 cm−1 bands observed also for ca-C.O.R are originated by the –OH deformation of water. The band intensity for ca-C.O.R was significantly lower compared to C.O.R [56]. This may indicate an improvement in the hydrophobic properties of the ca-C.O.R surface, which could also be a result of the calcination at 500 °C that removed adsorbed water. Nevertheless, the existence of all the characteristic bands of smectite shows that the chemical structure of the clay was preserved after intercalation and carbonization of the SA biopolymer.

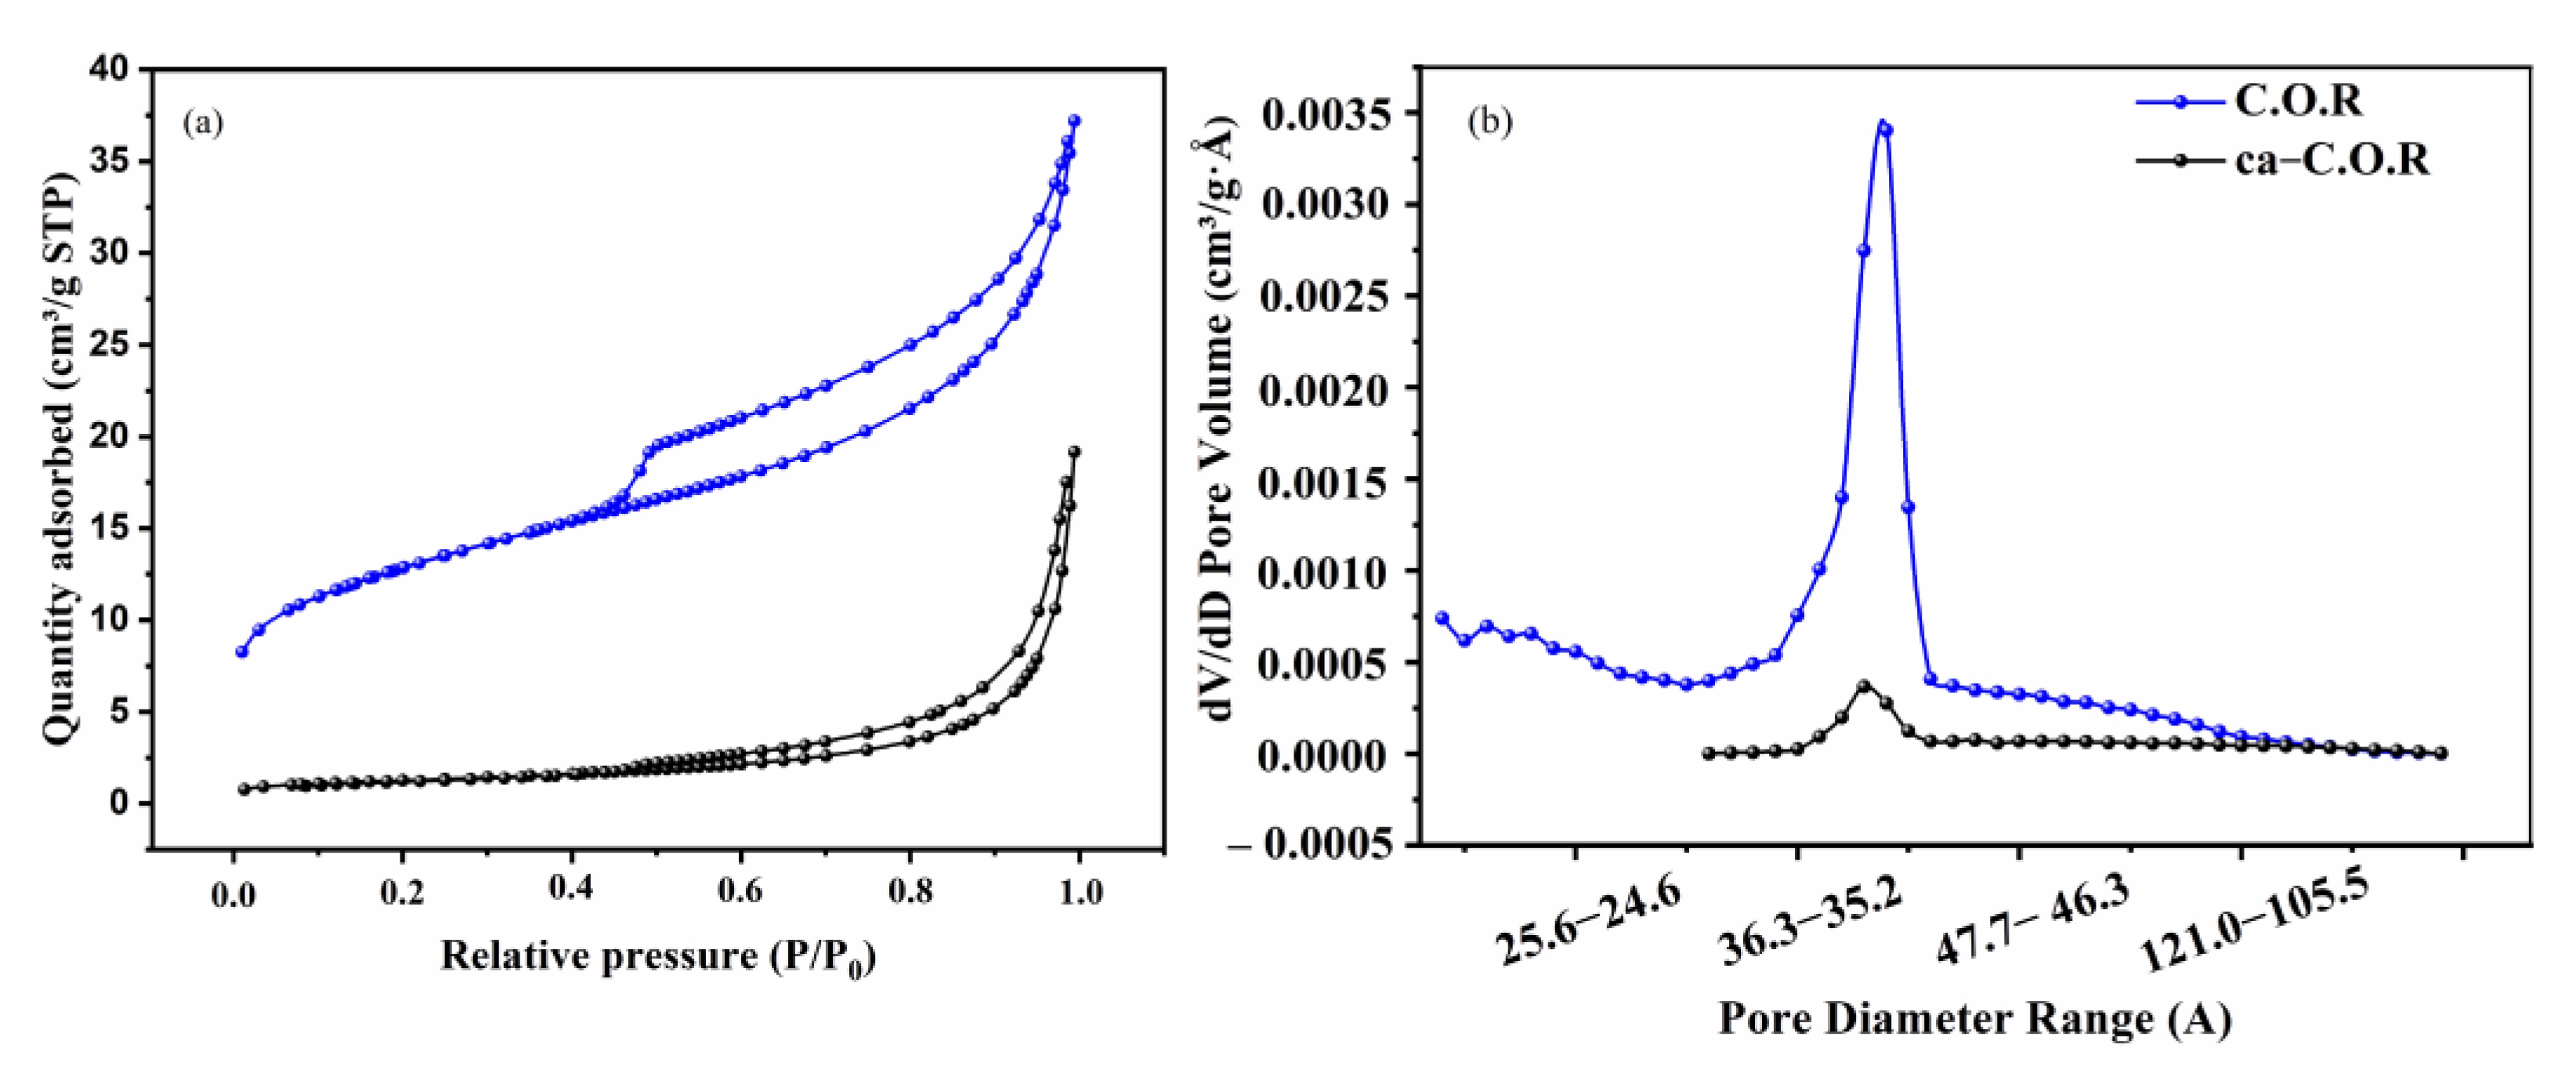
3.1.3. Nitogen Adsorption–Desorption Analysis

The surface texture and porosity of C.O.R and ca-C.O.R were investigated using nitrogen adsorption–desorption measurements at 77 K. As illustrated in Figure 3, both materials exhibit type IV isotherms with H3 hysteresis loops, according to the IUPAC classification, indicating the presence of mesoporous structures. This is further supported by the pore size values listed in Table 2. The BJH method was employed to calculate the pore size distribution and pore volume. The results revealed that both the specific surface area and total pore volume of ca-C.O.R are significantly lower than those of C.O.R. Specifically, the BET surface area decreased from 44.74 m2·g−1 to 4.38 m2·g−1, while the pore volume dropped from 0.0034 cm3·g−1·Å−1 to 0.00036 cm3·g−1·Å−1. This notable reduction is attributed to the deposition of carbonaceous residues from the pyrolyzed alginate, which block the pores of the original clay structure. These findings are summarized in Table 2 [57,58].

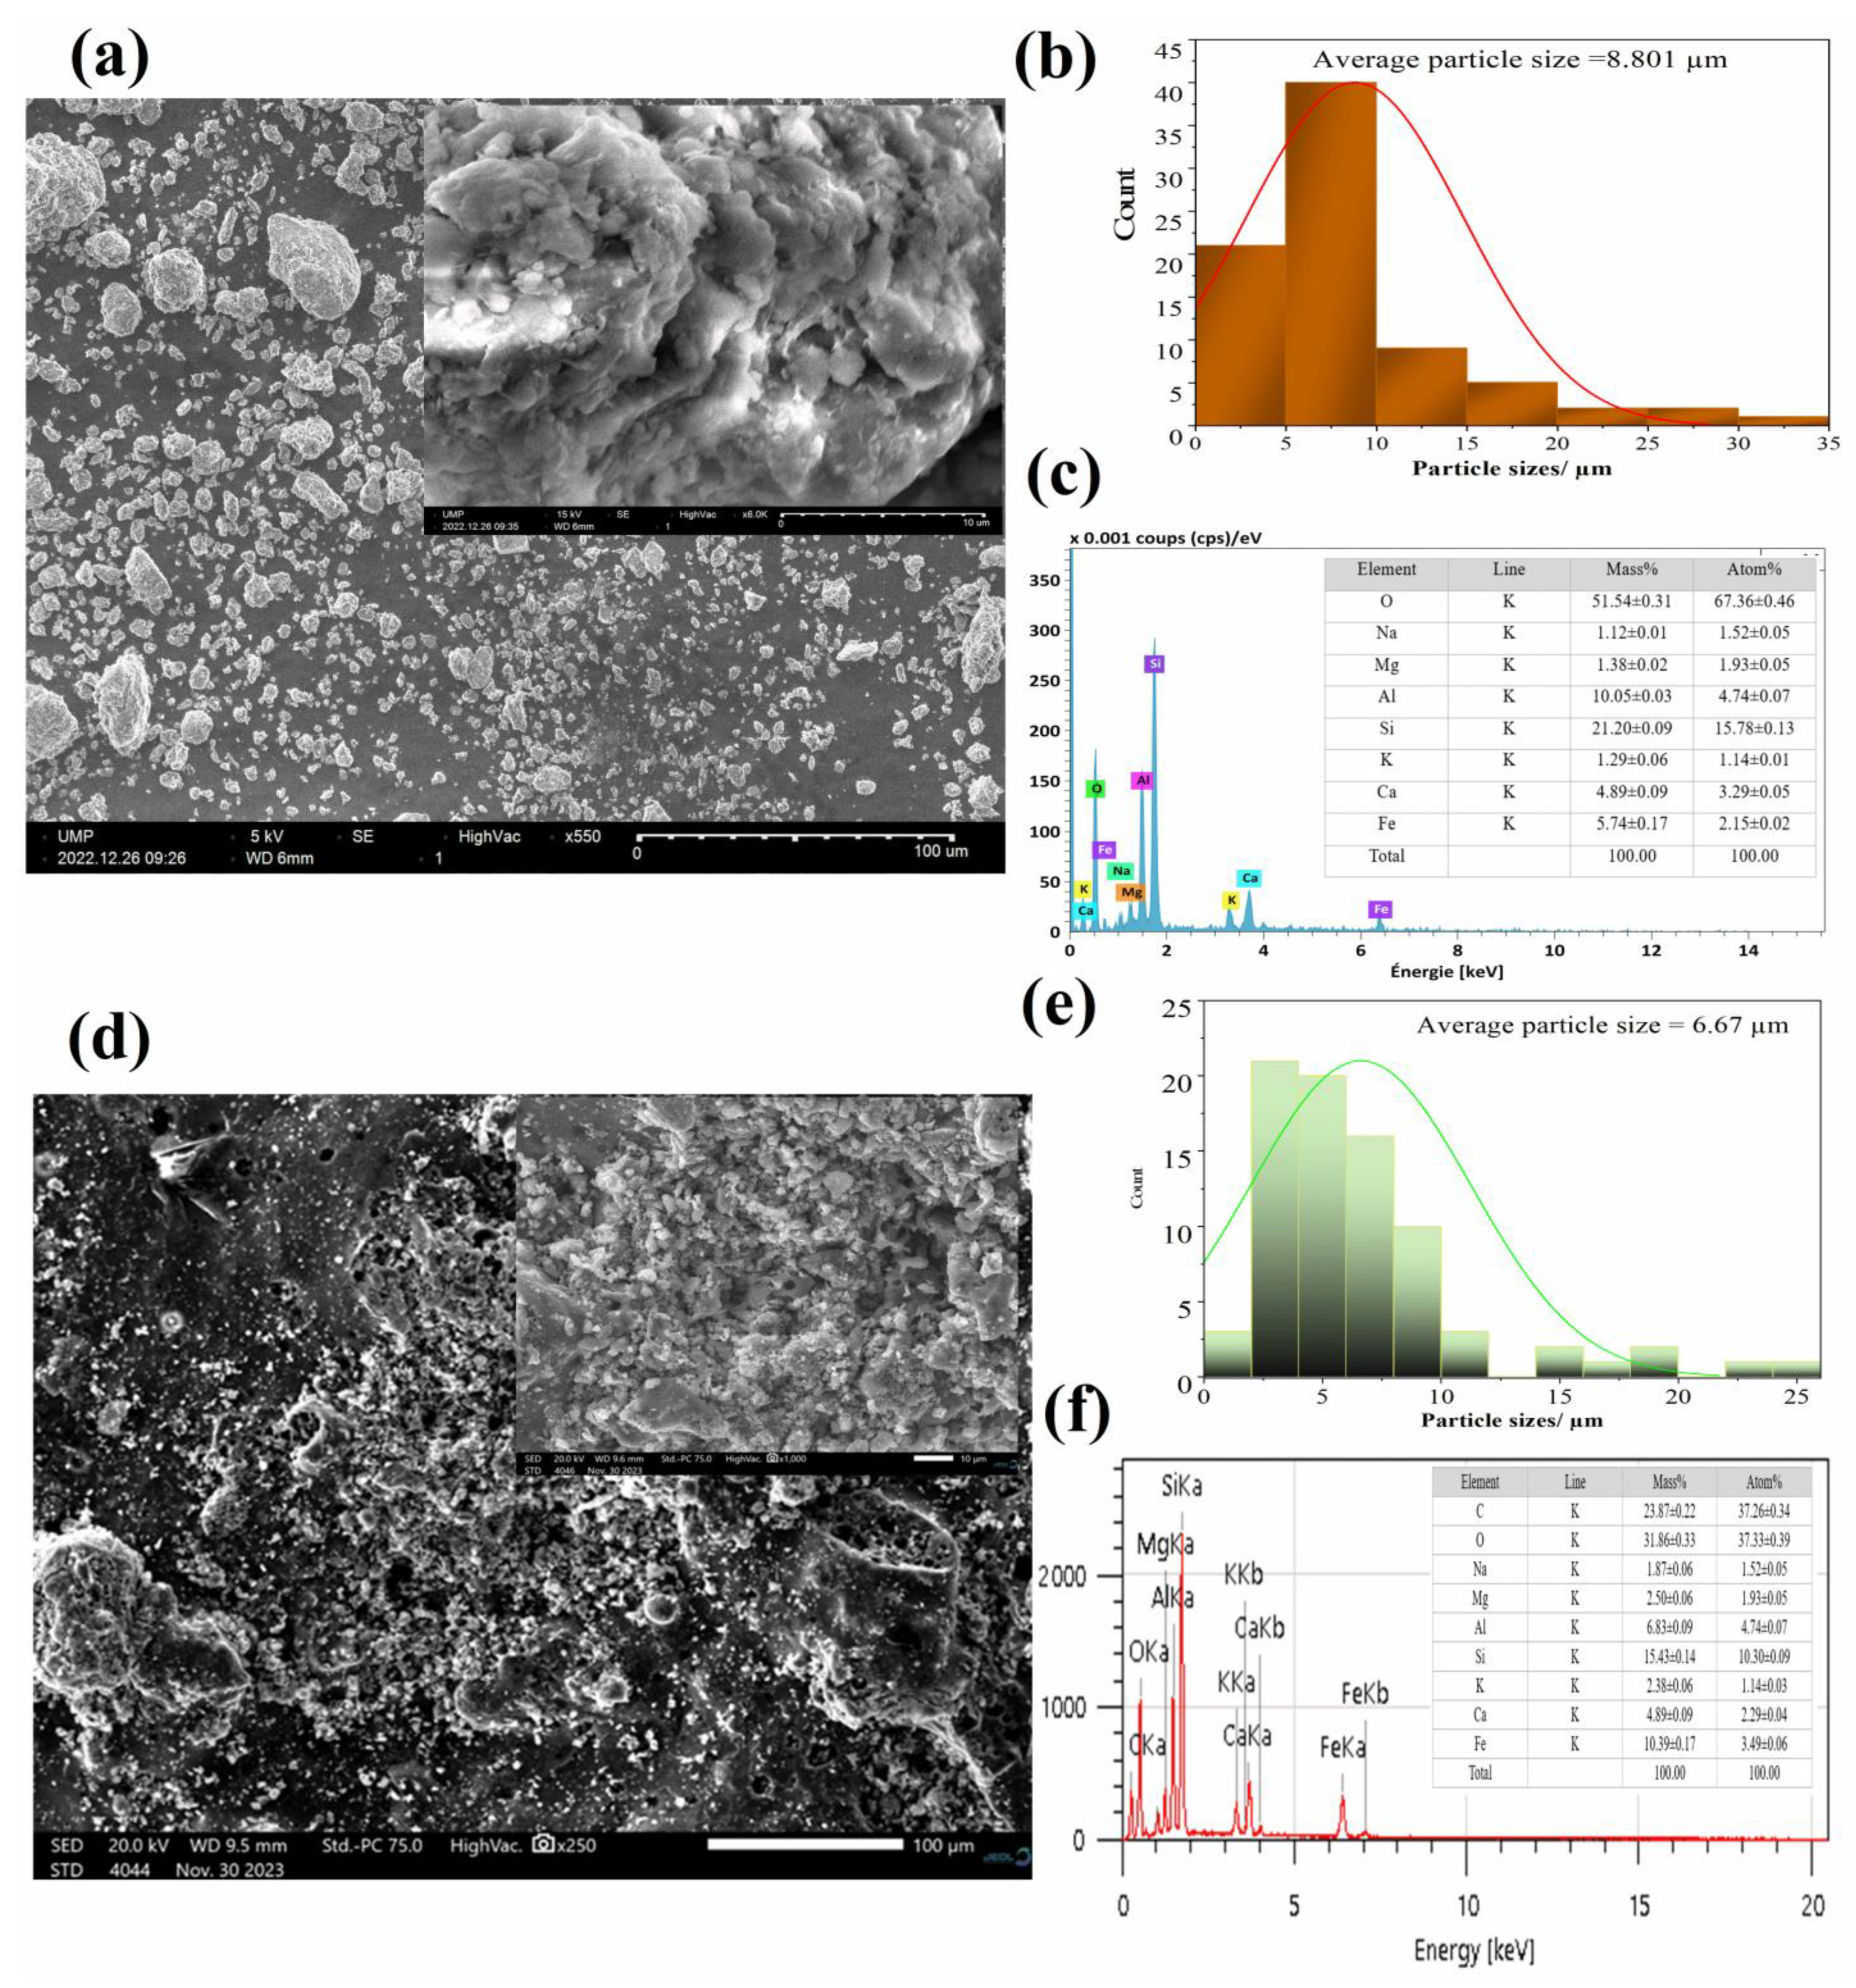
3.1.4. Surface Morphology

Scanning electron microscopy and energy dispersive X-ray spectroscopy were used to investigate the morphology and surface properties of C.O.R and ca-C.O.R. In Figure 4a,d, the morphology of C.O.R is manifested as nano-layers, confirming the phyllosilicate clay mineral structure. The results of SEM and EDS analysis for the ca-C.O.R composite are shown in Figure 4d,f. As shown in Figure 4d, which was acquired at lower magnification (100 µm resolution), well-distributed pores can be clearly observed on the surface of the composite. These pores reflect the material’s porous nature, which can enhance the adsorption capacity for PCT, introduce chemical diversity, and increase surface reactivity due to the presence of carbon formed during alginate pyrolysis. This includes the features of carbonaceous materials, such as carboxyl groups (–COOH) and hydroxyl groups (–OH), along with the functional groups present in clay, specifically aluminol groups (Al–OH) and silanol groups (Si–OH).
The particle size distribution analysis indicated monomodal patterns for both materials. As illustrated in Figure 4b, C.O.R displayed a relatively wider particle size range, with a mean diameter of 8.801 μm. In contrast, ca-C.O.R (Figure 4e) exhibited a more confined distribution, with a mean particle size of 6.67 μm, suggesting enhanced size uniformity compared to C.O.R. Additionally, energy-dispersive X-ray spectroscopy (EDS) combined with elemental mapping provided a detailed compositional analysis of the C.O.R and ca-C.O.R samples.
EDS analysis confirms the chemical diversity of the ca-C.O.R surface. As shown in Figure 4f, the EDS spectrum shows significantly elevated peaks for silicon, carbon, and magnesium, confirming the elemental composition of the composite that contains both clay and carbon. Furthermore, it also confirms that carbon has been effectively deposited on the surface without changing the key elements of the clay structure [41,42].

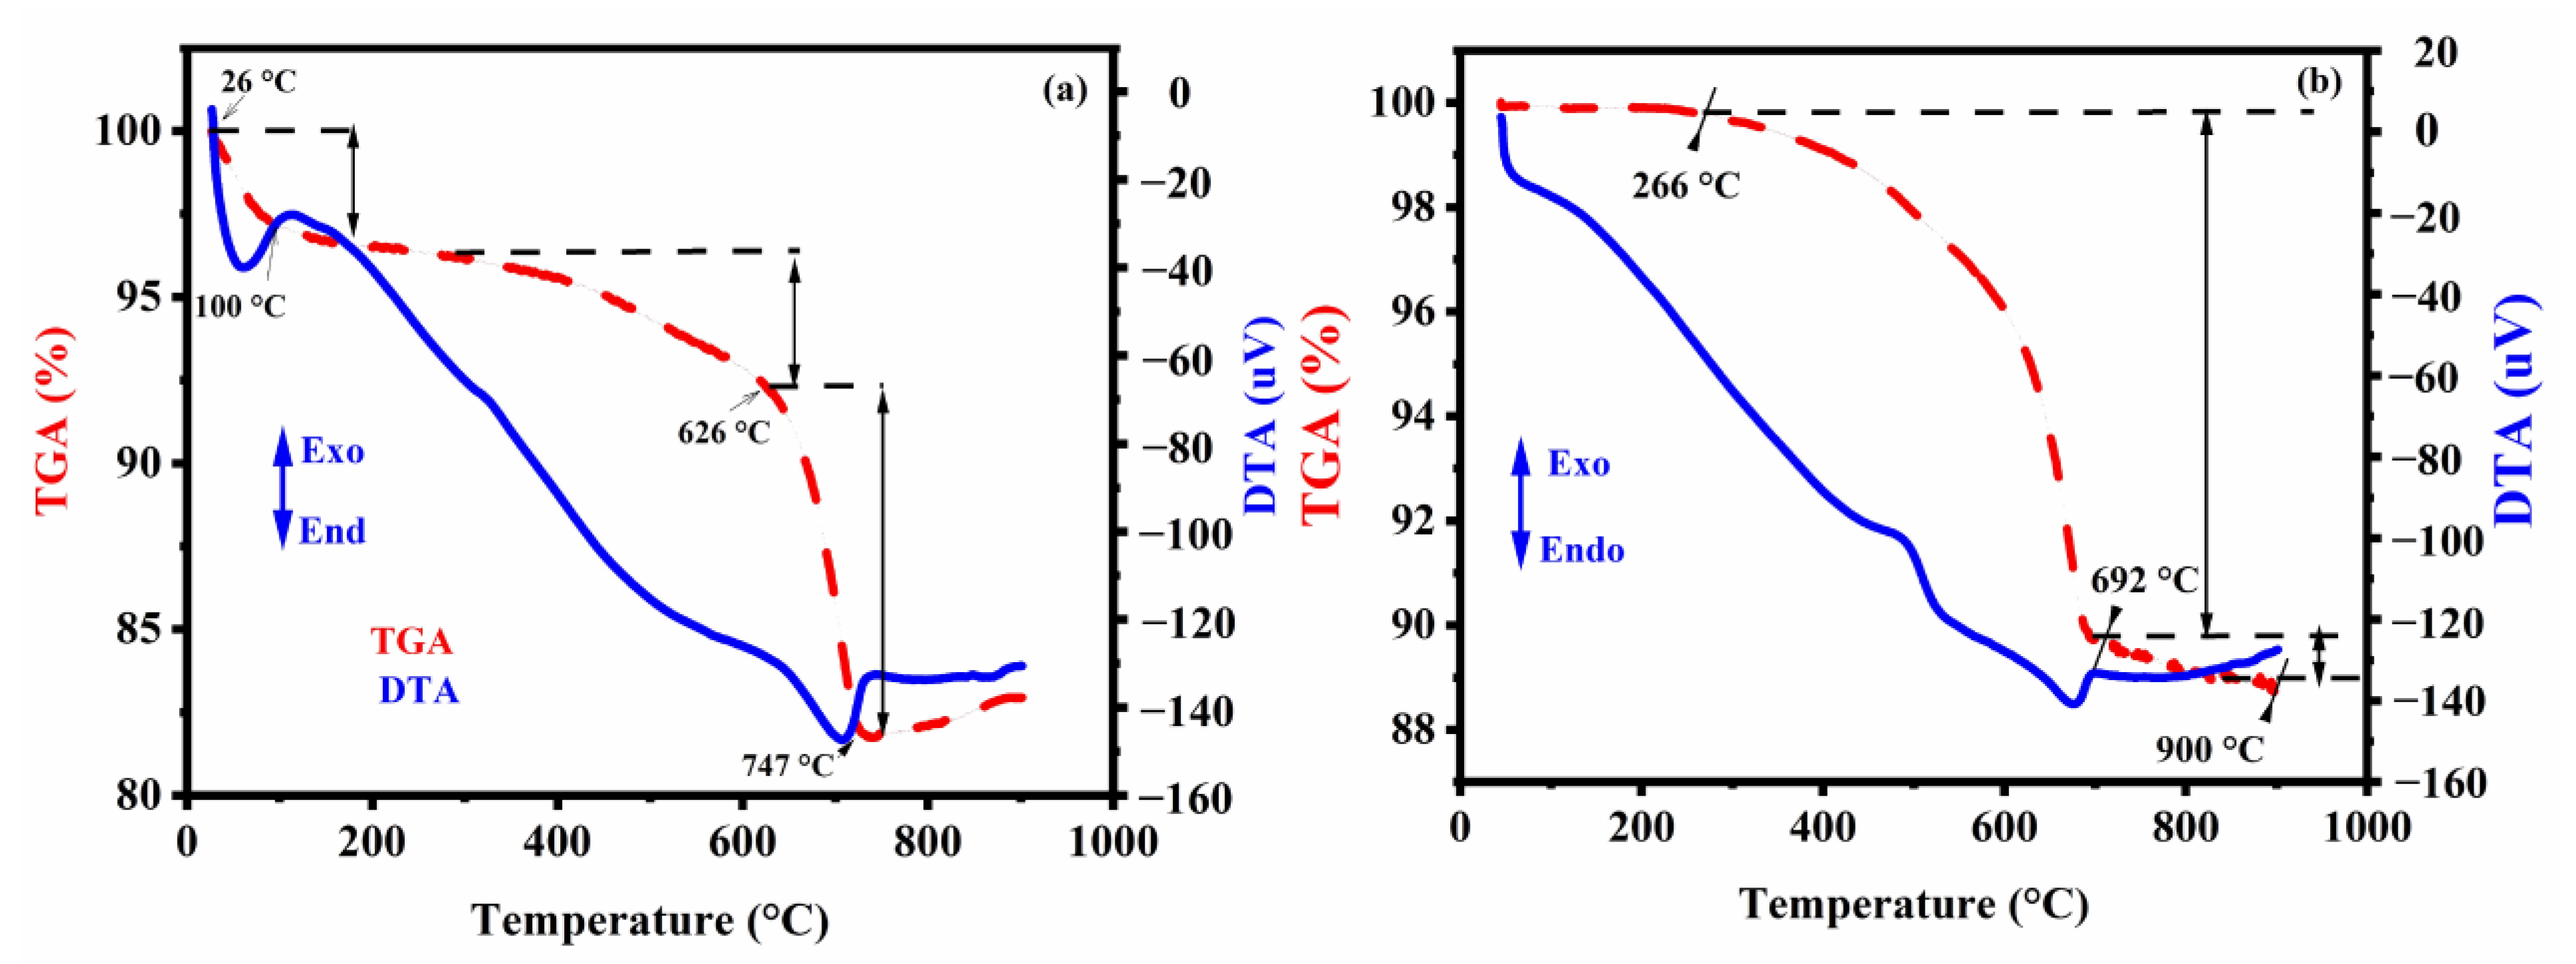
3.1.5. TGA/DTA Thermal Analysis

To assess thermal stability and temperature effect characteristics of the raw clay and the composite, TGA analyses were performed. Figure 5 illustrates the TGA-DTA analysis of the raw material conducted in the present study. In the TGA curve, a dominant initial weight loss (~2.9% by weight) is observed at temperatures below 200 °C, which can be attributed to interlayer dehydration and the removal of adsorbed water. This is indicated by the endothermic peaks in the DTA curve. A second weight loss (~4.9% by weight) was observed in the temperature range of 400 to 626 °C and can be attributed to the kaolinite thermal degradation and to the different de-hydroxylation process. Lastly, a third mass loss (~10.3% by weight) is observed at temperatures between 600 and 800 °C, with an endothermic peak at 706 °C in the DTA curve, which suggests the decarbonation reaction of calcite. Nevertheless, no considerable weight loss is evident at temperatures exceeding 800 °C, accompanied by the formation of crystalline phases in the analyzed sample [59].
The TGA/DTA analysis showed that ca-C.O.R exhibited a greater mass loss (−10%) in the temperature range of 266–692 °C compared to unmodified clay (C.O.R). This difference is primarily attributed to the degradation of carbonaceous materials and their associated counterions introduced during the modification process. Sodium alginate carbonization significantly improved the thermal stability of the composite material. This enhancement is attributed to the formation of strong hydrogen bonds between the carboxyl (–COO) groups on the carbonized surface and the hydroxyl (–OH) groups on the clay surface. These interactions create a reinforced network that requires higher energy to break, thus delaying thermal degradation. These interactions create a reinforced network that requires higher energy to break, delaying thermal degradation. Additionally, the clay particles act as thermal barriers, reducing heat transfer and further enhancing the stability of the composite [54].

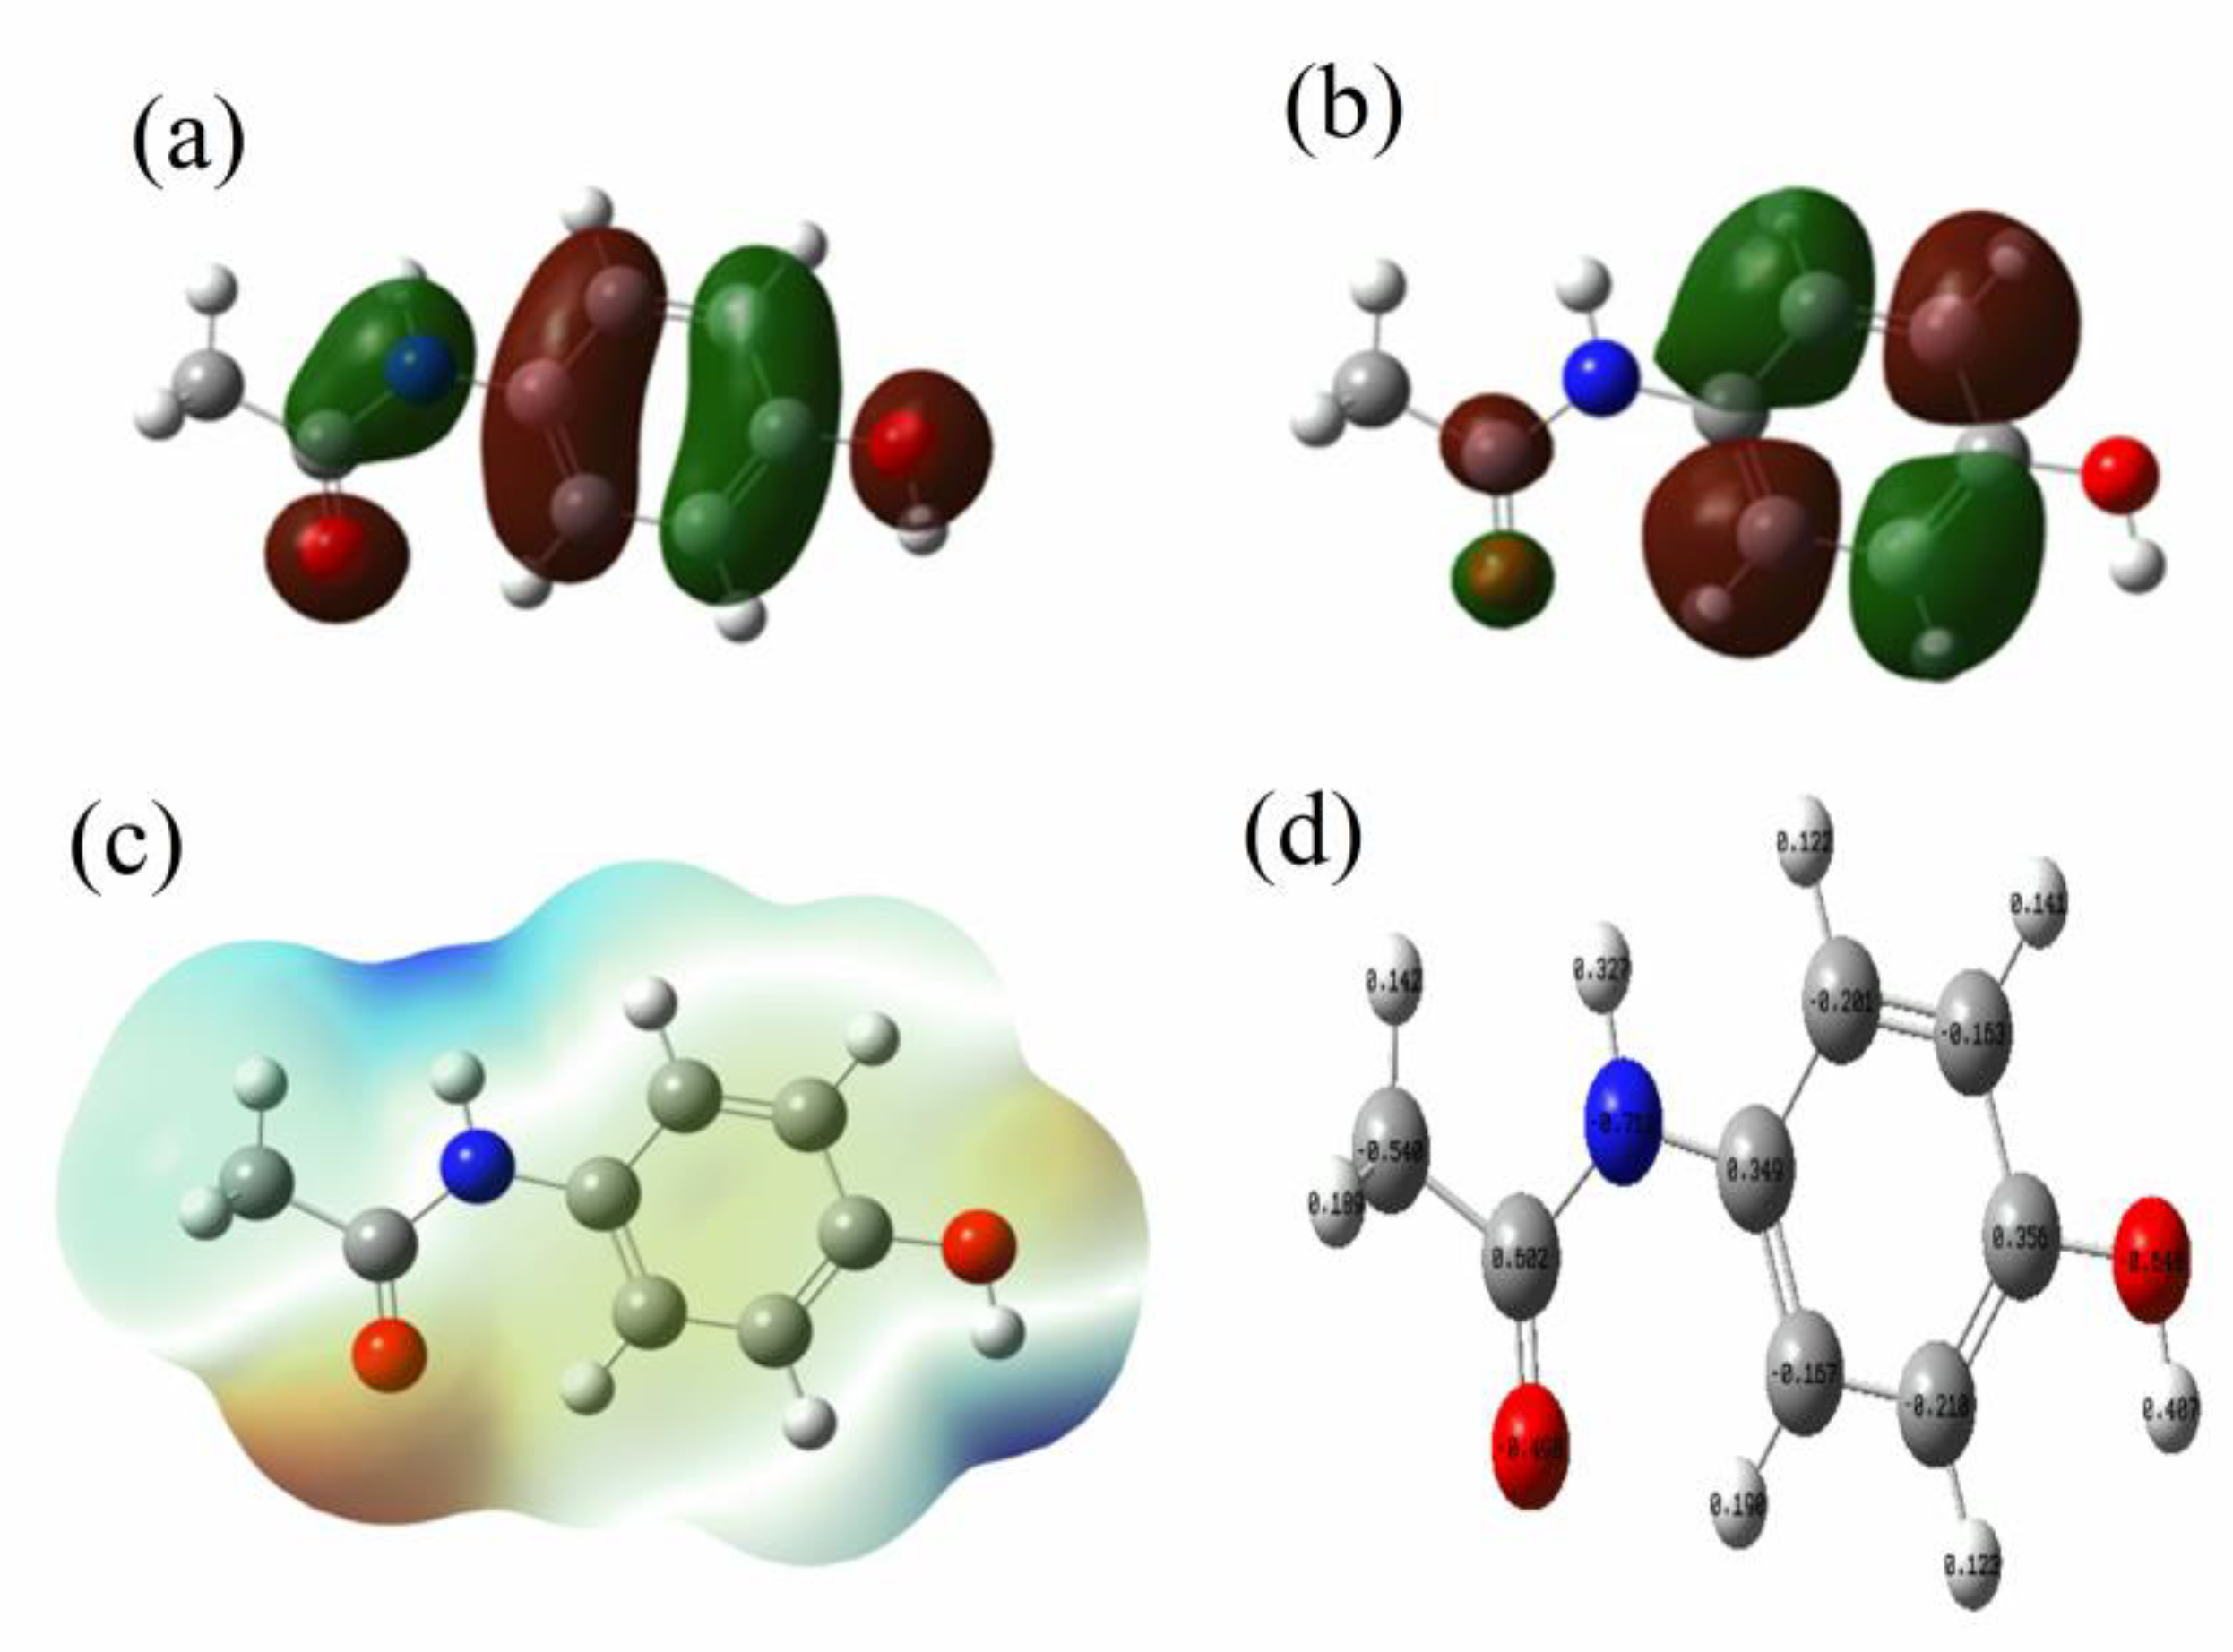
3.1.6. Density Functional Theory

Increasing the EHOMO leads to an increase in charge transfer, which, in turn, results in a higher adsorption energy. This allows electrons to move freely on the ELUMO of the PCT molecule. Surface electrostatic potential (ESP) analysis verifies these findings, providing insight into the interaction mechanism and offering a model to understand the electrophilicity, nucleophilicity, and reactive sites in the composite material that binds to the PCT molecule. The color scale can help identify the molecule based on its electron density (Figure 6c). A higher density of electrons in a particular area is represented by red, while lower densities result in a color change to orange, green, and eventually blue. The blue color indicates the lowest electron density and correspondingly lower electronegativity. In the PCT molecule, the electronegativity is distributed between the oxygen atom and other parts of the molecule, with the highest electronegativity located in the red color region, which gradually decreases toward the blue region. The ESP maps (Figure 6c) represent the three-dimensional charge distribution of the molecule and show that PCT is particularly susceptible to electrophilic attack; PCT is more electrophilic and reacts with more nucleophilic species [44,60]. Table 3 reveals that paracetamol exhibits a relatively small HOMO−LUMO energy gap (Eg = 0.1988 eV), indicating its high chemical reactivity and potential for interaction with the adsorbent surface. The low electronegativity (X = 0.1019 eV) and high dipole moment (2.0458 D) further support its strong affinity toward polar functional groups on the composite, which may explain the observed high adsorption capacity.

3.2. Batch Study

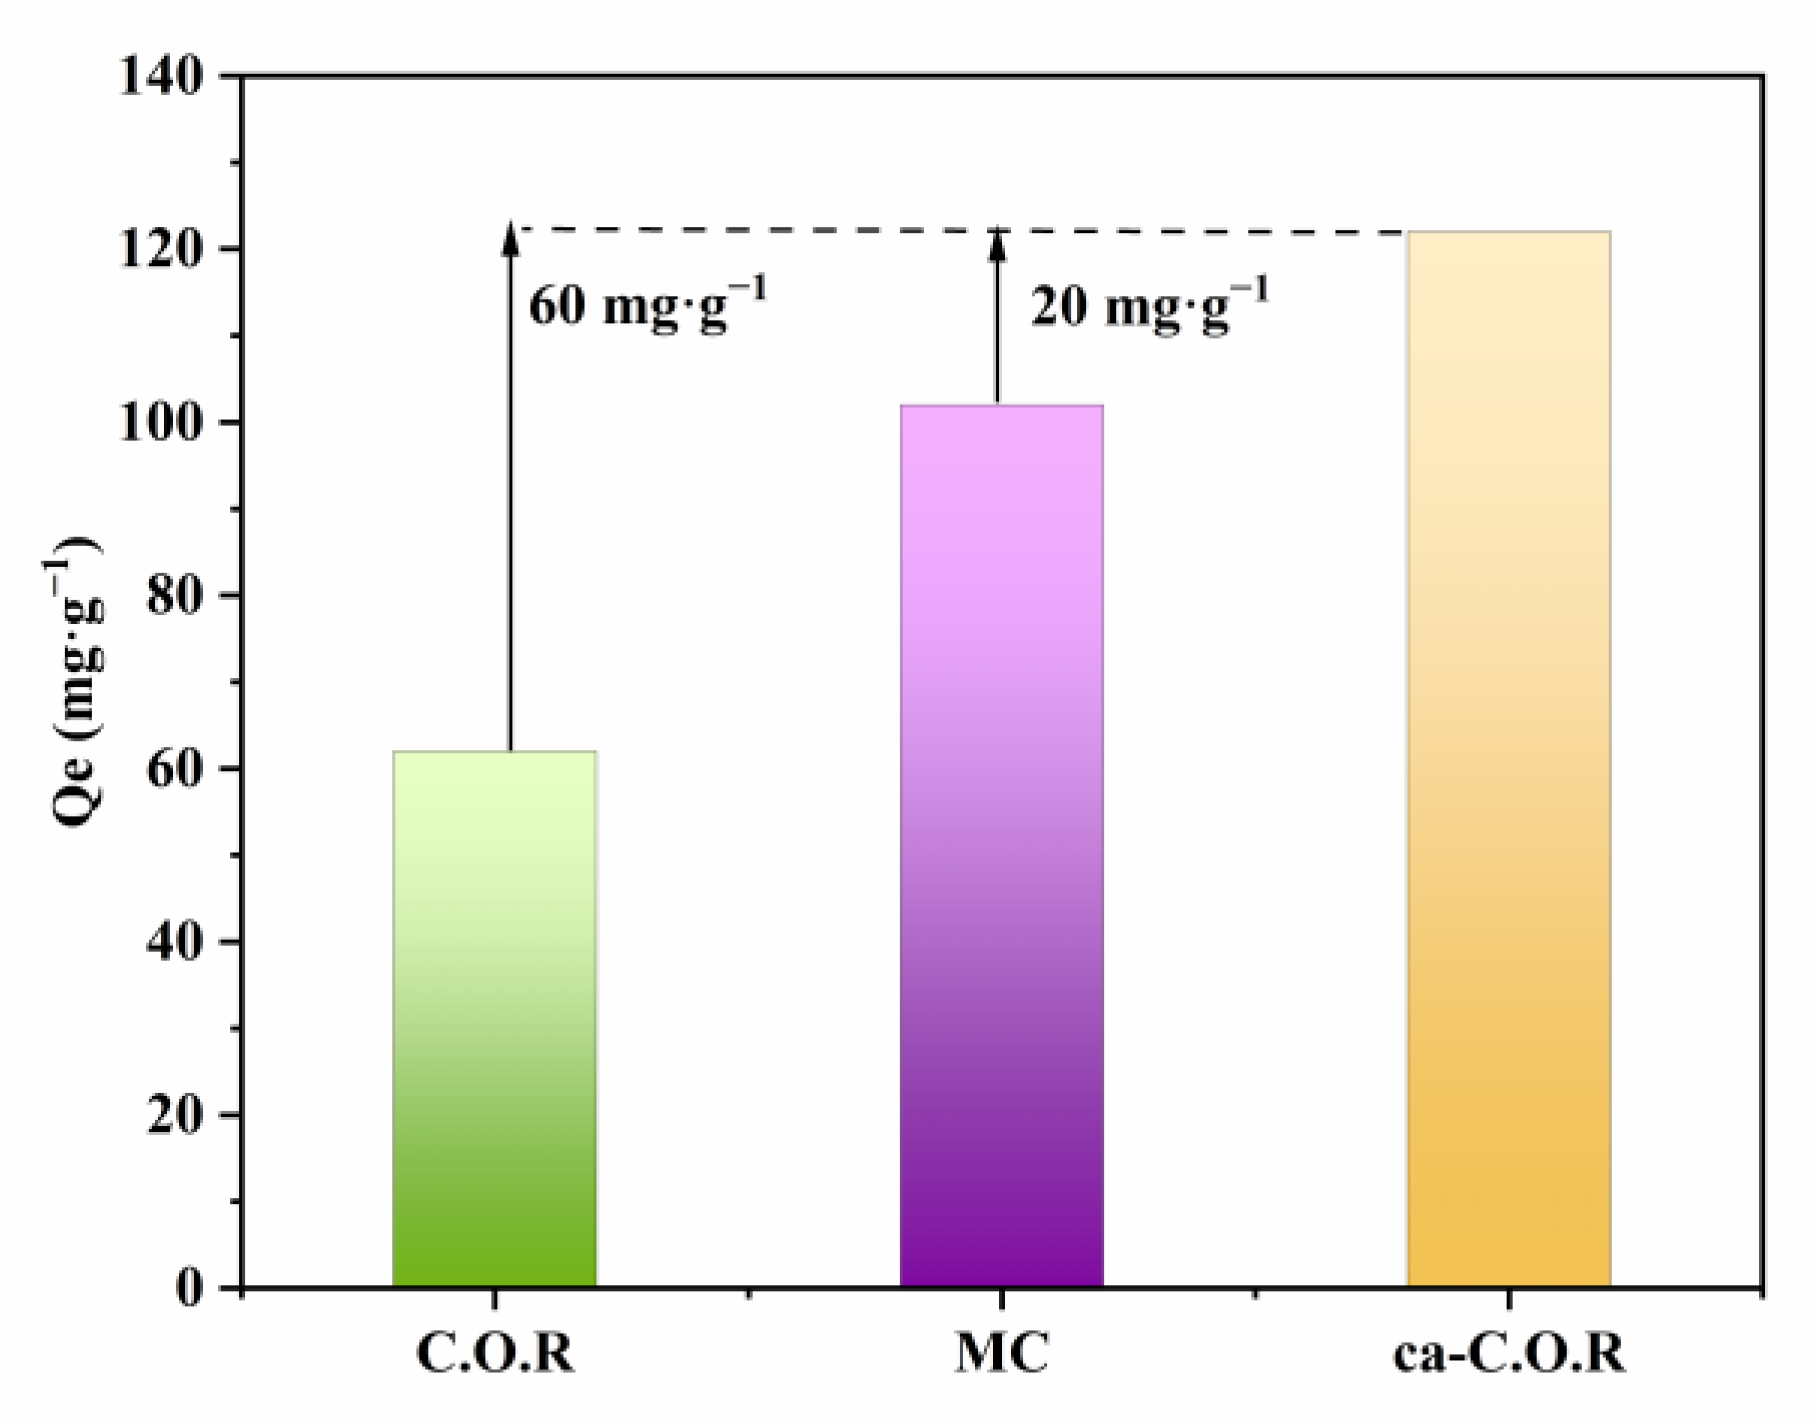
3.2.1. Selection of the Adsorption

In order to determine the most effective material for the adsorption of PCT, the three materials presented in the previous sections were evaluated under identical experimental conditions. These materials included the oriental raw clay (C.O.R), which had an adsorption capacity of 61 mg·g−1; the sodium alginate-modified clay treated with microwave heating (MC), which had an adsorption capacity of 102 mg·g−1; and the sodium alginate-modified clay treated with both microwave heating and pyrolysis (ca-C.O.R), which had the highest adsorption capacity of 122 mg·g−1. The experimental conditions were maintained at 25 °C with 20 mg of adsorbent, a PCT concentration of 1000 mg·L−1, a reaction time of 4 h, and stirring at 140 rpm. As shown in Figure 7, the ca-C.O.R material adsorbed 20 mg·g−1 more PCT than MC and 60 mg·g−1 more than C.O.R, demonstrating its superior adsorption performance. This improvement can be attributed to the structural and chemical modifications induced by calcination, which enhances the surface properties and interfacial interactions between sodium alginate and the clay, as confirmed by FTIR and TGA analyses. Although calcination requires additional energy, it significantly increases the adsorption capacity of the material, making it a more effective adsorbent. These results highlight ca-C.O.R as the most efficient material for the removal of PCT, and it was therefore selected for further investigation.

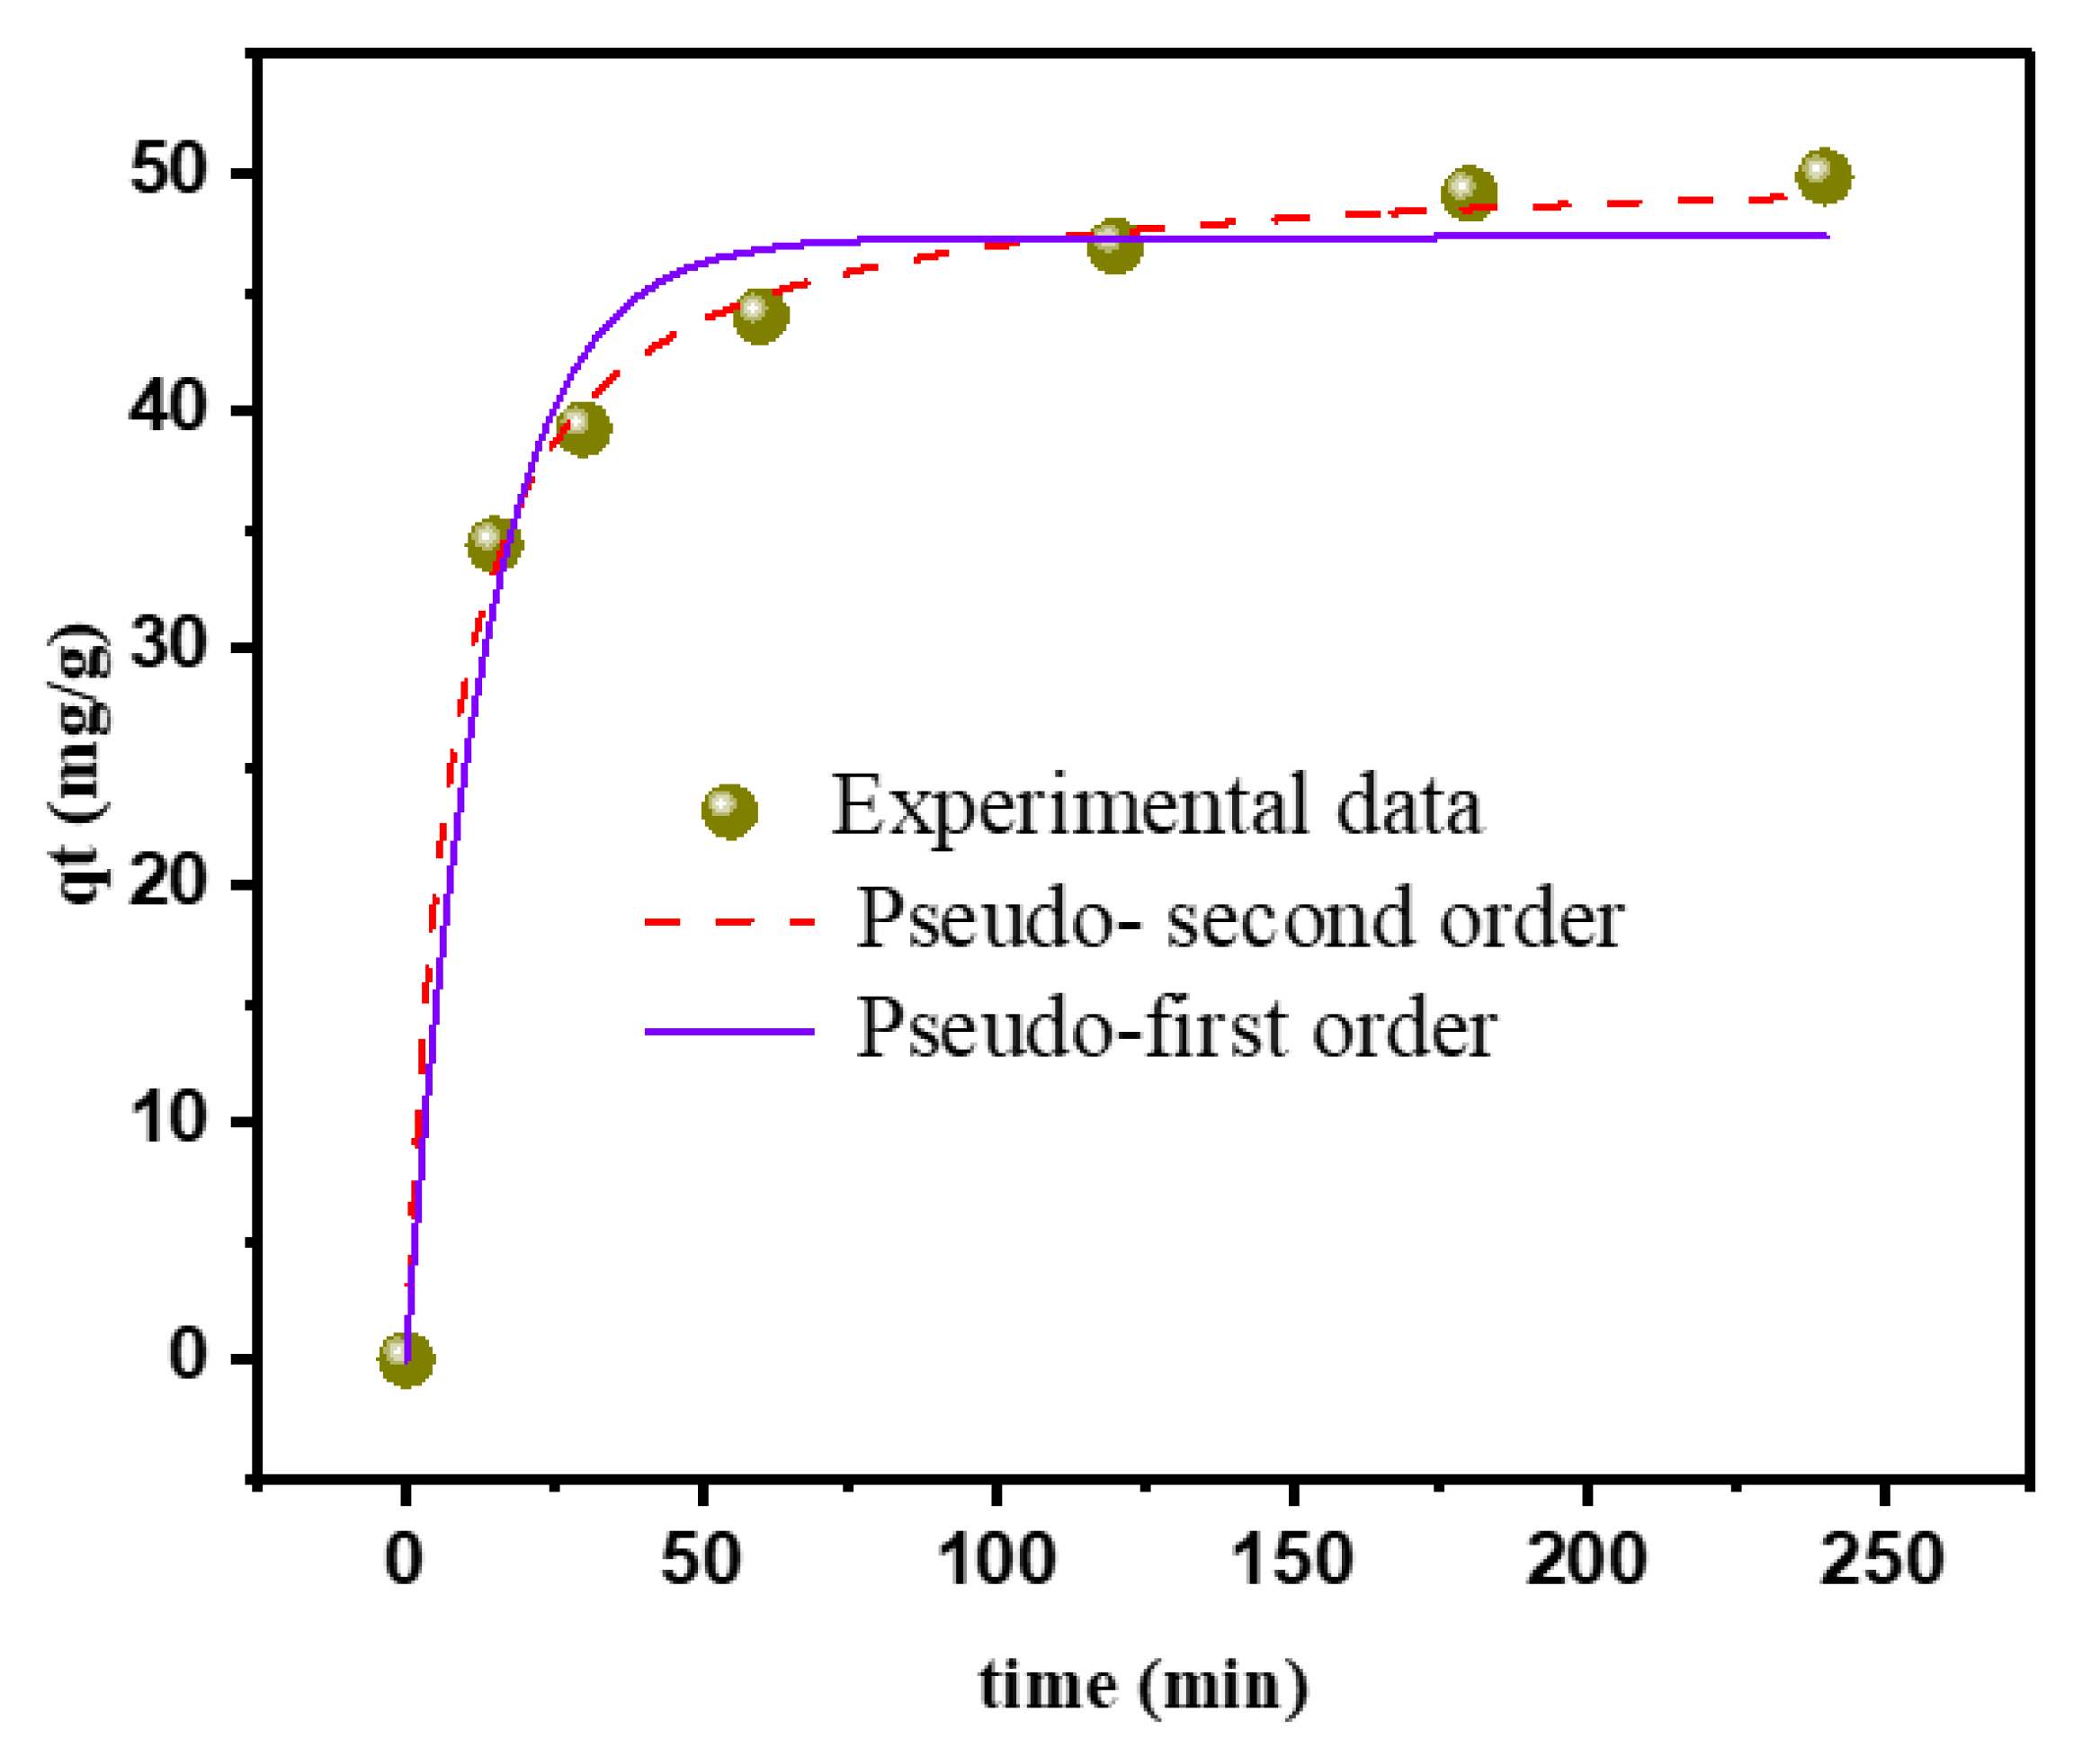
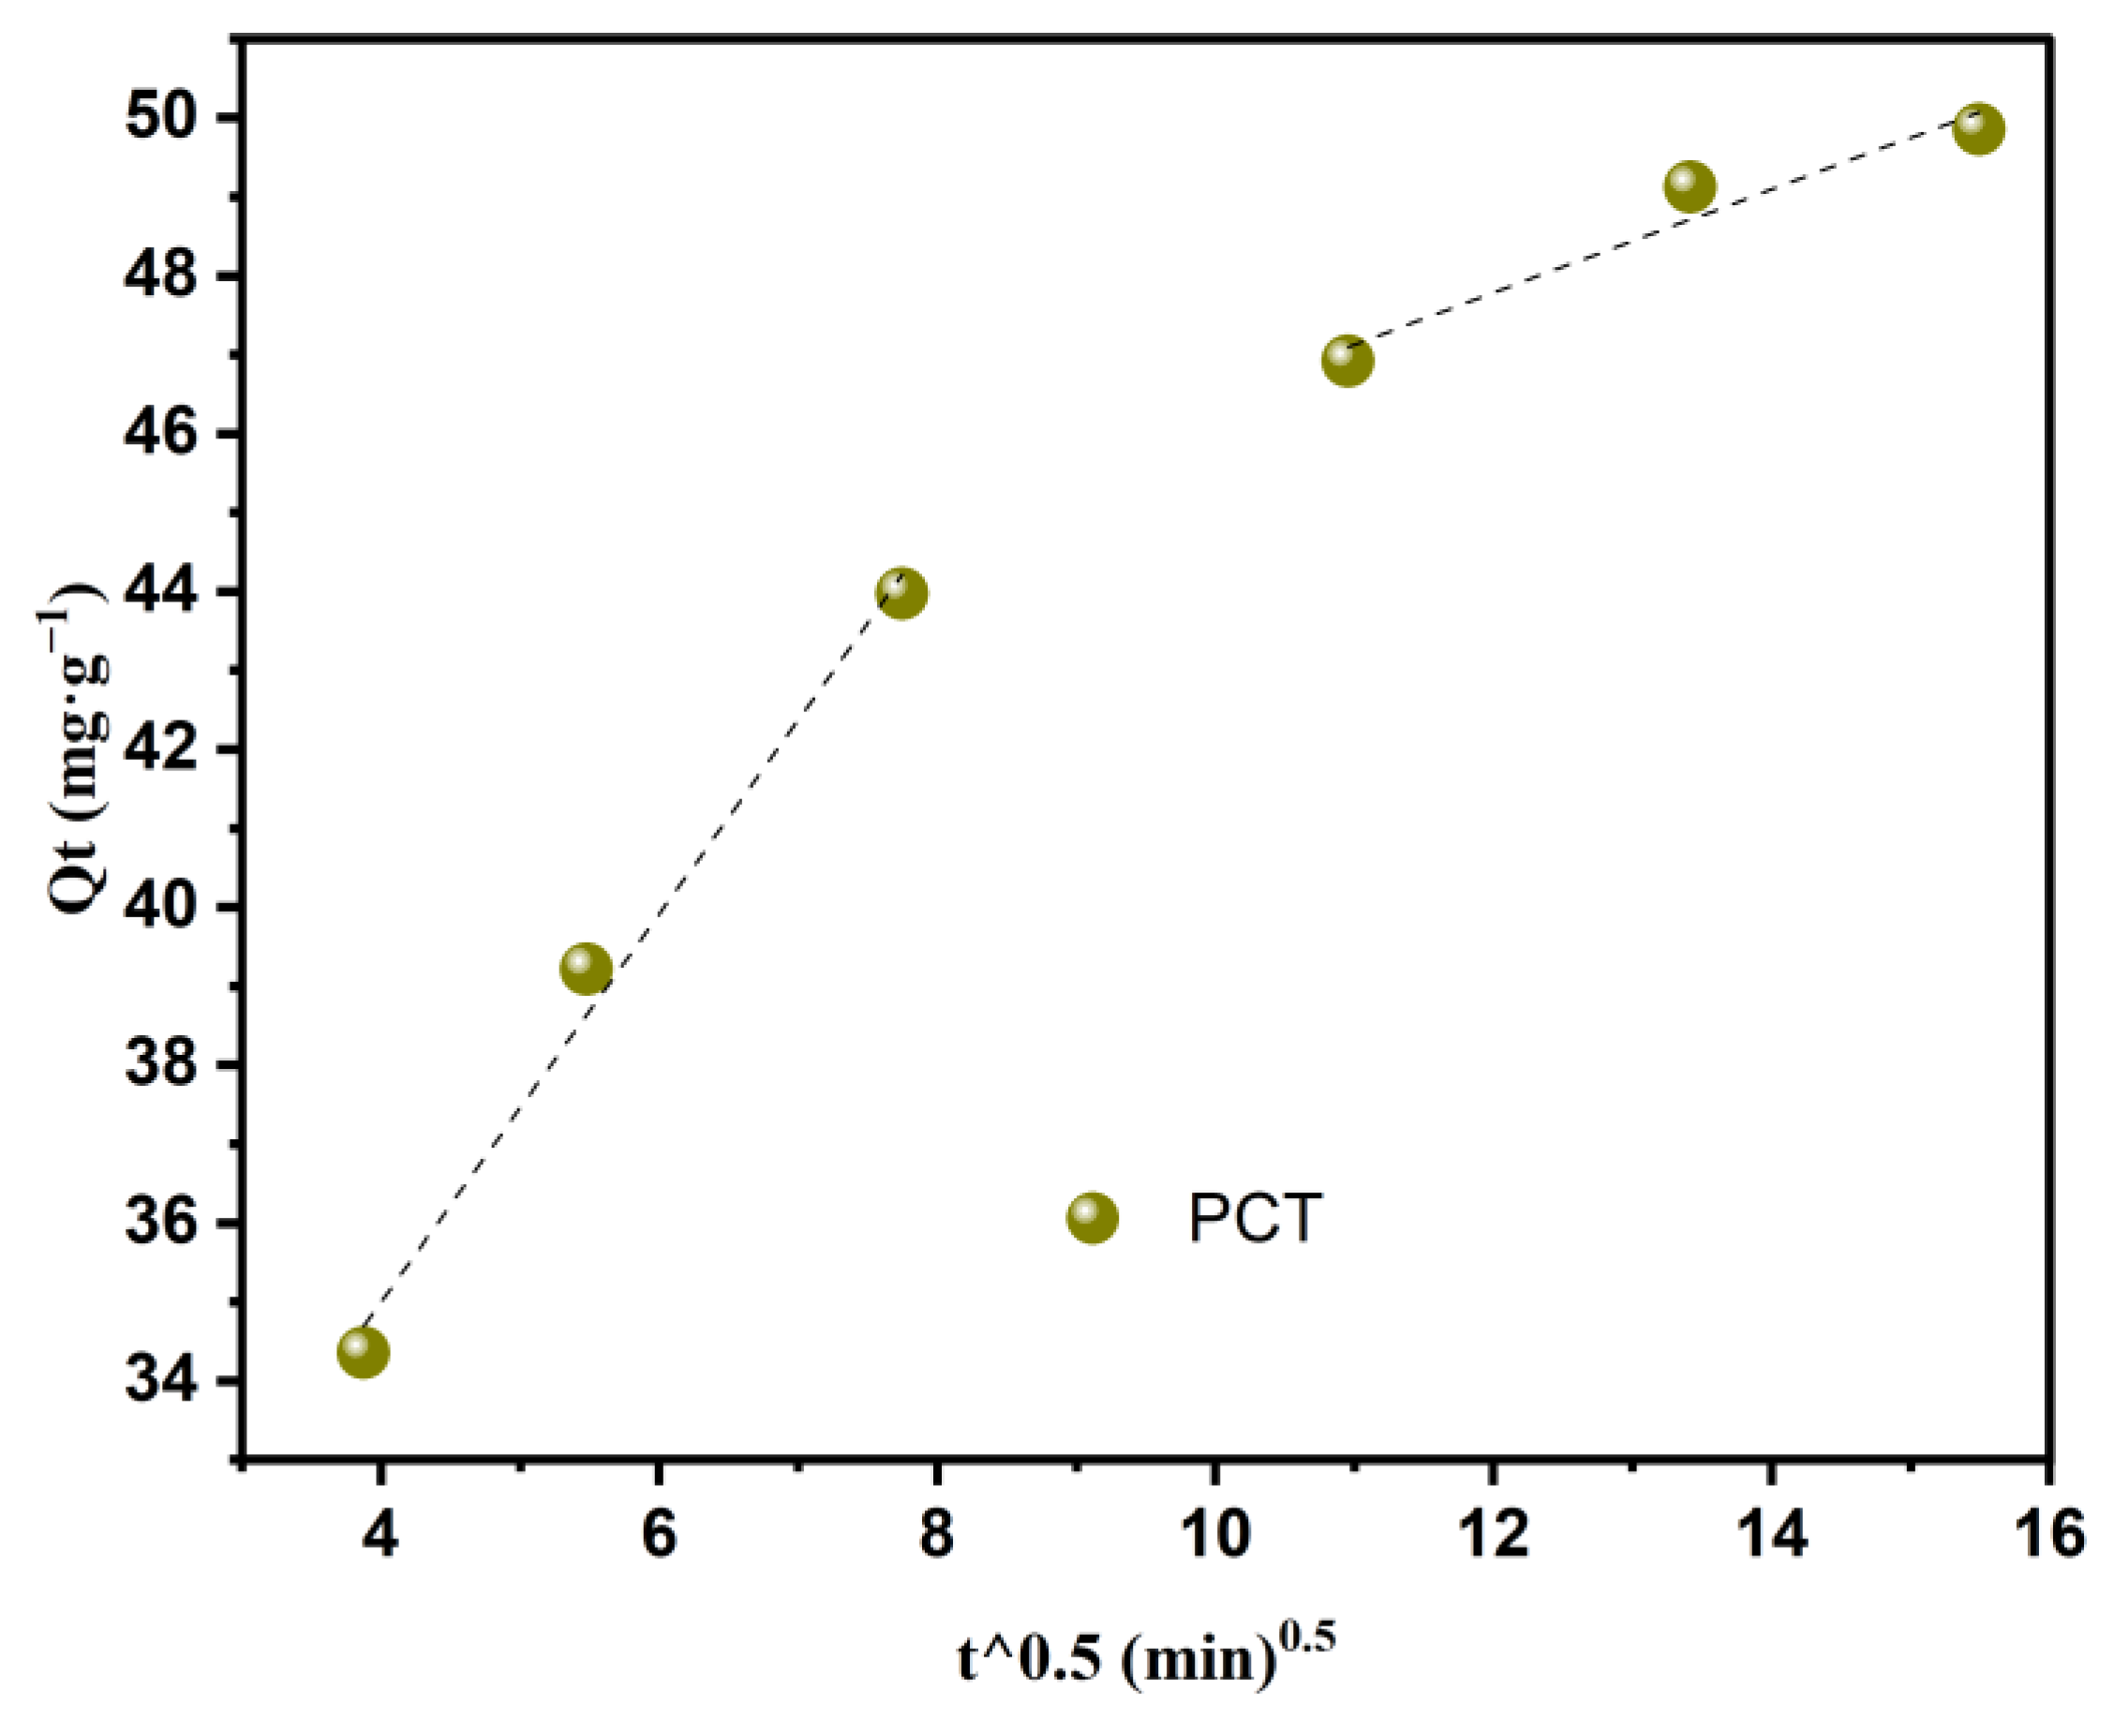
3.2.2. Kinetic Studies

Contact time is a crucial factor in the context of drug adsorption onto the surface of adsorbents. This study focuses on this aspect. Kinetic adsorption experiments were performed at room temperature with an initial PCT concentration of 1000 mg·L−1. The pH of the initial solution was maintained at 7.6 throughout the experiments. A significant amount of adsorbent (20 mg) was added to 25 mL of the PCT solution, and the mixture was stirred for different contact time intervals ranging from 15 to 360 min at 25 °C. Figure 8 illustrates the effect of contact time on the adsorption of PCT. During the initial phase, the adsorbed amount increases rapidly with the contact time for the ca-C.O.R composite. However, in the second phase, the rate slows down. The adsorption reaches equilibrium after 1 h. The rapid increase in the first phase is attributed to the high availability of reactive surface sites on the adsorbent. Over time, these sites gradually become occupied and blocked by the solute, causing the surface of the adsorbent to become saturated and the adsorption rate to decrease in the second phase [61].
The study of adsorption kinetics provides critical insights into proposing an adsorption mechanism. In this research study, the adsorption process of PCT was analyzed using nonlinear kinetic models, including the pseudo-first-order and pseudo-second-order models. The nonlinear equations for these models are listed in Table 1 and plotted in Figure 8. The optimal kinetic model was selected based on the error analysis, where the root mean square error (RMSE) was calculated using Equation (11) and presenting the results in Table 1. The most suitable model is characterized by an R2 value that is close to one, with lower values of chi-square and a lower RMSE value (R2 → 1, X2 → 0 and lower RMSE).
Table 4 shows the determined kinetic parameters (K1, K2, Qe, cal) derived from the nonlinear format for each model, along with the values of the coefficients of determination R2 and RMSE. Based on the results in Table 4, the pseudo-second-order model is the best fit to explain the adsorption kinetics of PCT on the surface of the ca-C.O.R composite. This is supported by the coefficient of determination R2 and adjusted coefficient R2adj, which is close to unity (R2 = 0.99) for the pseudo-second-order model compared to the pseudo-first-order model (R2 = 0.98, R2adj = 0.978), as well as the lower RMSE value obtained by the pseudo-second-order model (0.77) compared to the pseudo-first-order model (2.18). In addition, the adsorbed amount calculated by the pseudo-second-order model is very close to the experimental value, providing further evidence that this model accurately describes the adsorption kinetics of PCT on the ca-C.O.R composite (Table 4). Thus, the kinetic adsorption process is defined by the chemisorption process, implying the existence of chemical interactions between PCT and the adsorbent [62,63]. The plot in Figure 9 illustrates the relationship between qt and t1/2. According to [64], if the intraparticle diffusion model is the only factor limiting the rate, the plot should intersect at the origin. However, the figure shows two linear regions in each plot, indicating that this is not the case. The first linear region suggests that external surface adsorption or instantaneous adsorption may be responsible, while the second linear region corresponds to gradual adsorption, where PCT molecules gradually diffuse into the pores and structure of the composite material, with intraparticle diffusion becoming the rate-limiting step. Consequently, these results suggest that intraparticle diffusion is not the sole controlling factor and that other adsorption mechanisms, such as physisorption and chemisorption, are likely at play [36,65].

3.2.3. Adsorption Isotherms

In this section of the adsorption isotherm analysis, the amount of PCT adsorbed is measured in mg·g−1 to identify the most efficiently adsorbed PCT. Obtaining the adsorption isotherm for the ca-C.O.R composite is essential to evaluate its maximum adsorption capacity and to suggest the adsorption mechanism. The experiments were carried out at a stable temperature of 25 °C, using an adsorbent dose of 0.02 g of ca-C.O.R, and at an optimal pH of 7.6.
As part of our study on the adsorption of PCT, we tested the efficacy of both unmodified and carbonaceous clay to enhance its adsorption capacity. Our results showed that the initial adsorption capacity of the unmodified clay was 61 mg·g−1, while the carbonaceous clay reached a maximum adsorption capacity of 122 mg·g−1. These results showed a significant difference in the amount of adsorption between the two types of clay, which prompted us to further investigate the adsorption of PCT using the composite.
The experimental study used initial concentrations between 100 and 1000 mg·L−1, and the obtained results (Figure 10) were fitted to four commonly used models, namely the Langmuir model (Equation (6)), the Freundlich model (Equation (7)), the Temkin model (Equation (8)), and the Sips model (Equation (9)). The parameters for each model were calculated using a nonlinear optimization technique to minimize the modeling error. Analysis of the values presented in Table 5 indicates that the Sips model provides the best fit to describe the adsorption of PCT on ca-C.O.R. This conclusion is based on the fact that the Sips isotherm has lower values of chi-square and RMSE and higher values of the coefficient of determination R2 and adjusted coefficient R2adj when compared to the other isotherms.
The paragraph states that the Langmuir adsorption model suggests that there is a maximum limit to uptake that is consistent with a saturated monolayer of adsorbate molecules on the surface of the adsorbent [66,67]. In contrast, the Freundlich model suggests that the adsorption occurs on a heterogeneous surface by a multilayer mechanism, where the amount of adsorbed molecules increases as the concentration of adsorbate molecules increases [50,58,66,67]. The Temkin isotherm also describes how the behavior of heterogeneous adsorption systems behaves. To derive the Temkin isotherm, it is assumed that the heat of adsorption decreases linearly as adsorption increases and that the binding energy of adsorption is evenly distributed [68]. The Sips isotherm is a hybrid model of the Langmuir and Freundlich equations created to predict adsorption in heterogeneous systems [69]. It overcomes the limitation of the Freundlich isotherm, which predicts an increase in adsorbate concentration that can be impractical. As a result, the Sips model produces an expression that has a finite limit at high concentration. In addition, the Sips model has the advantage of localizing the adsorption process without the need for adsorbate–adsorbate interactions.
Figure 10 presents the adsorption isotherms of the emerging product PCT on ca-C.O.R under equilibrium conditions. The data analysis reveals that the Sips isotherm model is more suitable to describe the adsorption behavior of PCT compared to the Freundlich, Langmuir, Temkin, and Sips isotherm models. The derived parameters, such as QL, KL, RL, 1/nF, KF, KS, nS, QS, QT, and BT, were extracted from the nonlinear Freundlich, Langmuir, and Temkin equations. The corresponding coefficients of determination, R2, RMSE, and chi-squared values are presented in Table 5. The maximum adsorption capacity values obtained from the Sips model are in close agreement with the experimental adsorbed amount. Furthermore, the Sips model is preferred as it shows higher R2 and R2adj values (0.99) and lower values of chi-square (0.99) and RMSE (3.09), indicating a better fit of the adsorption isotherm of PCT adsorbed on ca-C.O.R [70].
In addition, Table 6 provides a comprehensive comparison of removal efficiencies between the ca-C.O.R composite and other previously documented adsorbents. The innovative ca-C.O.R adsorbent material, namely the structuring of certain carbon in this clay as shown in the table, exhibited outstanding performance in the recovery of PCT molecules, surpassing the efficiency of previously reported adsorbents.

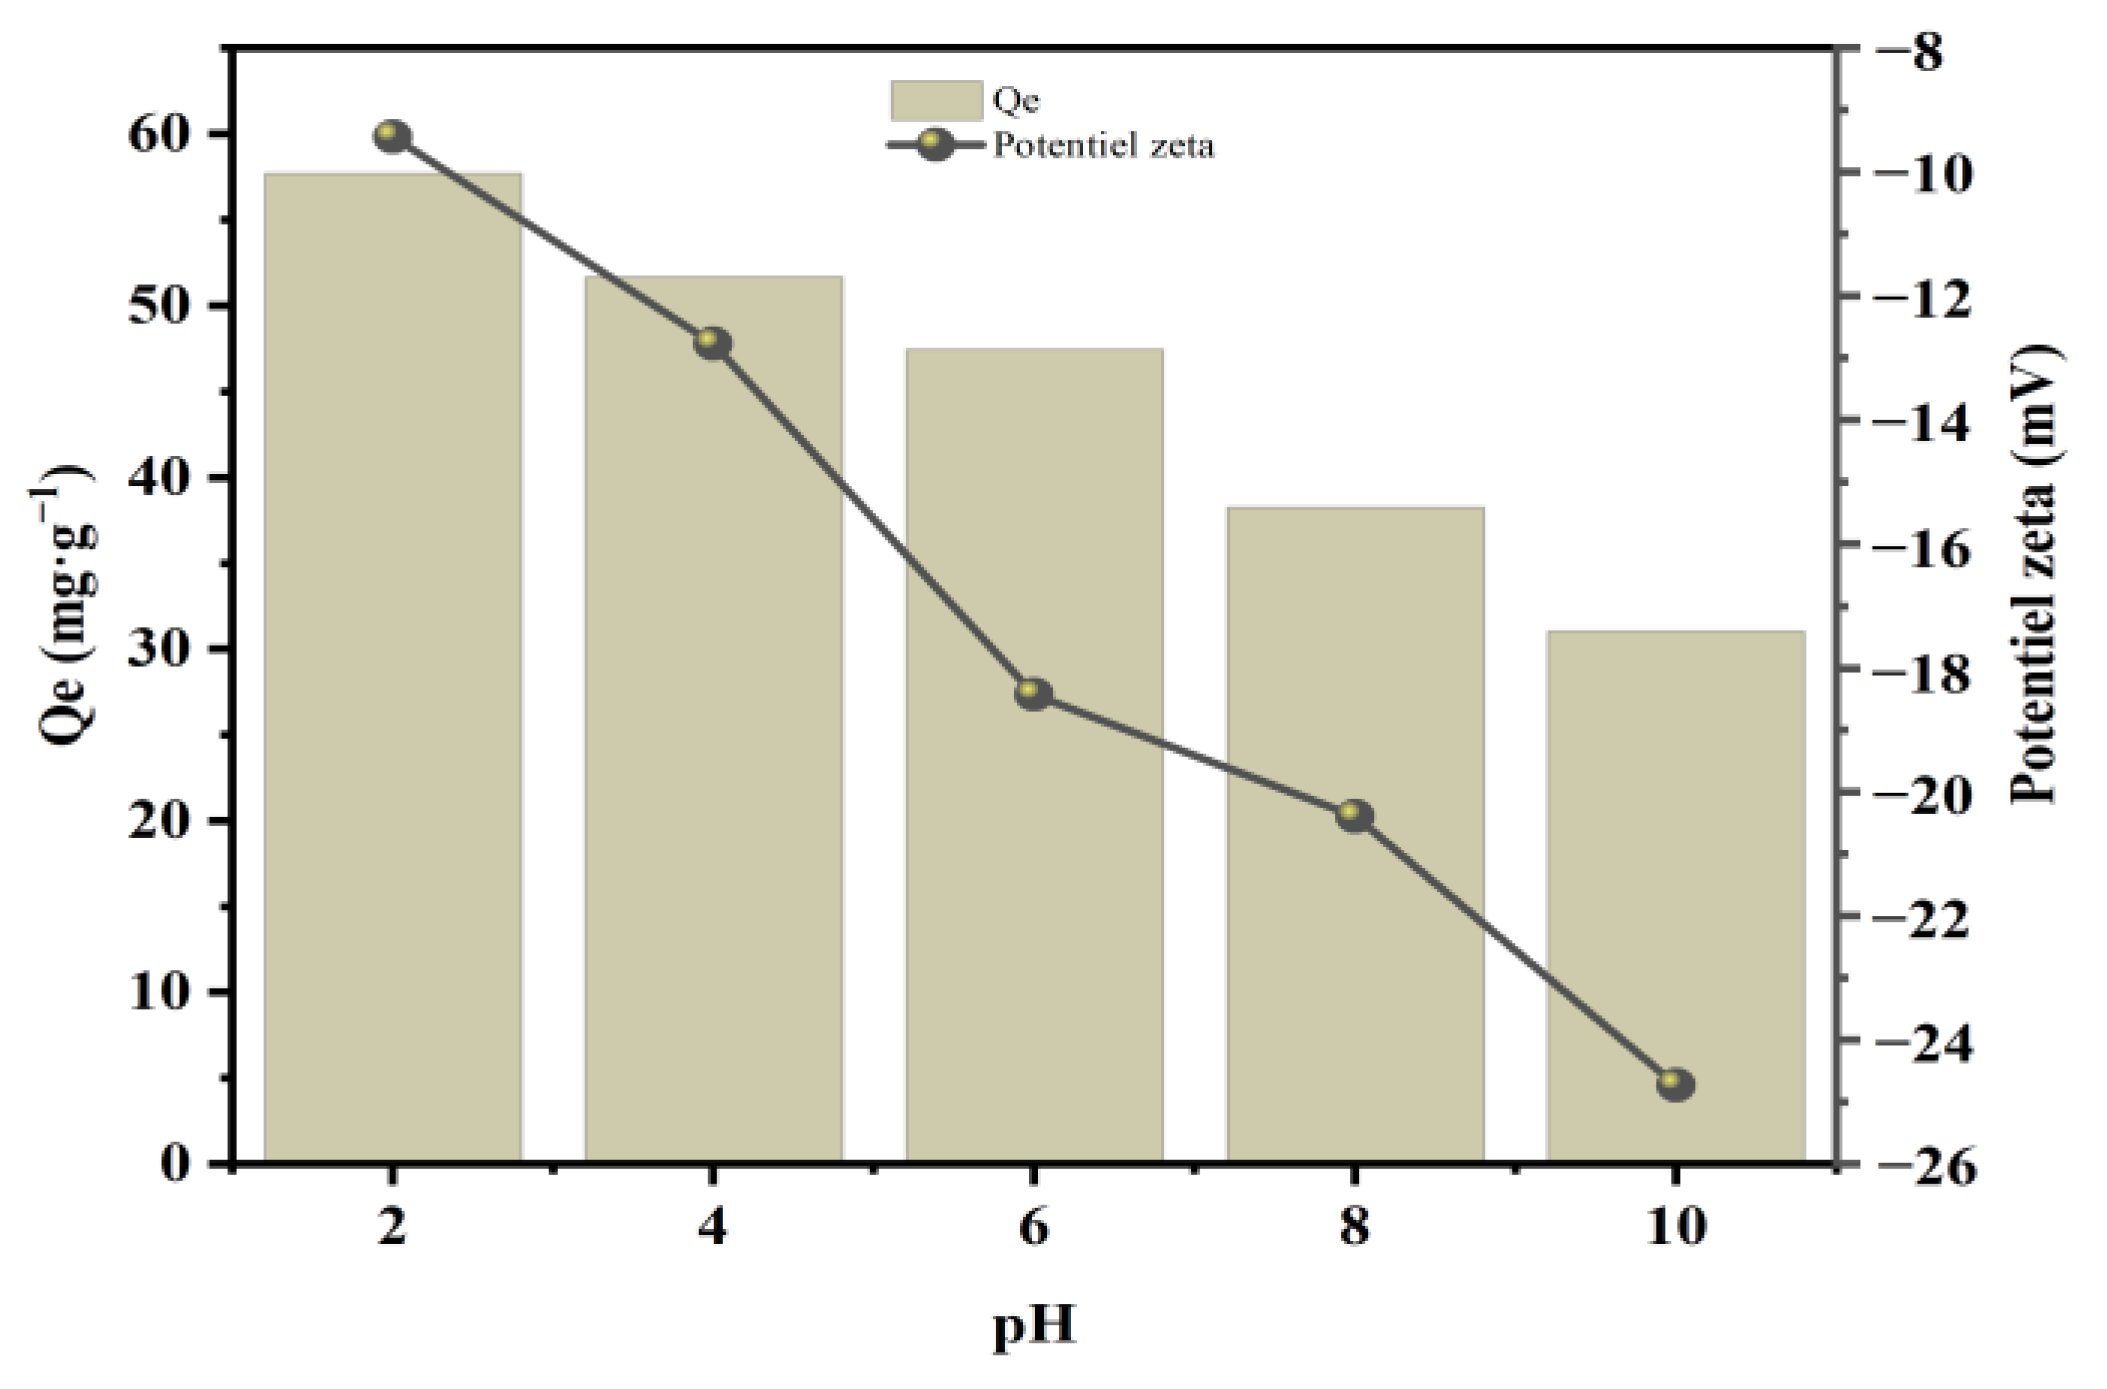
3.2.4. Effect of pH and Zeta Potential

To investigate the effect of solution pH on the removal of PCT by ca-C.O.R, we varied the pH values from 2 to 10 while maintaining an initial adsorbate concentration of 400 mg·L−1 and a temperature of 25 °C. Figure 11 shows the changes in PCT adsorption at different pH values. The pH of the solution has a significant effect on the adsorption process. The functional groups on the surface interacting with PCT molecules can be protonated or deprotonated at different surface charges in solutions with different pH values.
A slight decrease in adsorption capacity was observed in the pH range of 2 to 4. As the pH increased from 4 to 10, the adsorbed amount of PCT decreased from 57 mg·g−1 to 31 mg·g−1. This trend reveals a clear relationship between pH, the surface properties of the composite, and the speciation of PCT. Although zeta potential measurements (Figure 11) indicate a net negative surface charge across all pH values, the magnitude of this charge is significantly reduced in acidic conditions due to surface protonation. This reduced negativity facilitates the adsorption of paracetamol via weaker electrostatic repulsion and stronger hydrogen bonding or π–π interactions. Furthermore, PCT has a phenolic hydroxyl group with a pKa of approximately 9.5. Below this pH, PCT is mostly in its neutral molecular form, whereas above pH 9.5, it begins to deprotonate, forming negatively charged phenolate ions. Thus, at higher pH, the repulsion between the negatively charged PCT species and the negatively charged adsorbent surface intensifies, leading to lower adsorption. In addition, the presence of carbonaceous residues derived from the pyrolysis of sodium alginate may influence the surface chemistry and provide additional active sites for adsorption. These combined effects explain the observed decrease in adsorption with increasing pH [31,72].
The zeta potential values also show a clear trend, with increasingly negative zeta potential values as the pH value increases. This suggests that the clay surface is more negatively charged at higher pH values, which may further explain the decrease in adsorption. Overall, these results demonstrate the importance of pH and the presence of modifiers such as sodium alginate in the adsorption of PCT on clay surfaces.

3.2.5. Adsorption Thermodynamics

To evaluate the practicality of the adsorption process, we determined the thermodynamic parameters for the adsorption of PCT on ca-C.O.R, which include the change in Gibbs free energy (∆G°), standard enthalpy (∆H°), and standard entropy (∆S°). We studied the effect of temperature on the adsorption of PCT at 25, 30, 35, and 40 °C and used the following equations to calculate the corresponding thermodynamic parameters:
ln K C = S ° R H ° R T .
G° = ∆H° − TS°.
K C = Q e C e   ×   100
K is the equilibrium constant associated with the Langmuir constant ka, R is the universal gas constant (8.314 J·mol−1·K−1), and T stands for the absolute temperature in Kelvin (K). The values of ∆S° and ∆H° can be obtained from the intercept and slope of the plot of ln KC versus 1/T, as shown in Figure 12. KC refers to the partition coefficient [77]. The variations in ∆G° are calculated at each temperature using Equation (15).
Adsorbent–adsorbate interactions can be divided into two distinct categories based on their enthalpy: chemical adsorption and physical adsorption. Negative values of ∆H° indicate that the process is exothermic, meaning that the percentage of PCT removal decreases as the temperature increases. Lowering the temperature of the solution could increase the efficiency of adsorption. Physisorption occurs when ΔH° is less than 40 kJ·mol−1, whereas chemisorption occurs when ΔH° is between 80 and 450 kJ·mol−1. A chemisorption process is characterized by ∆H° values between 50 and 230 kJ·mol−1, while values outside this range correspond to physisorption processes [78,79]. Therefore, the ∆H° values obtained for PCT adsorption on the composite indicate a physical adsorption process. Under the experimental conditions, PCT with negative ΔG° values (Table 7 showed favorable and spontaneous behavior [31]. Negative values of ΔS° (−75.582 J·K−1·mol−1) indicate the reduced randomness at the solid–solute interface during the adsorption process. A similar pattern has been documented for the absorption of PCT [80].

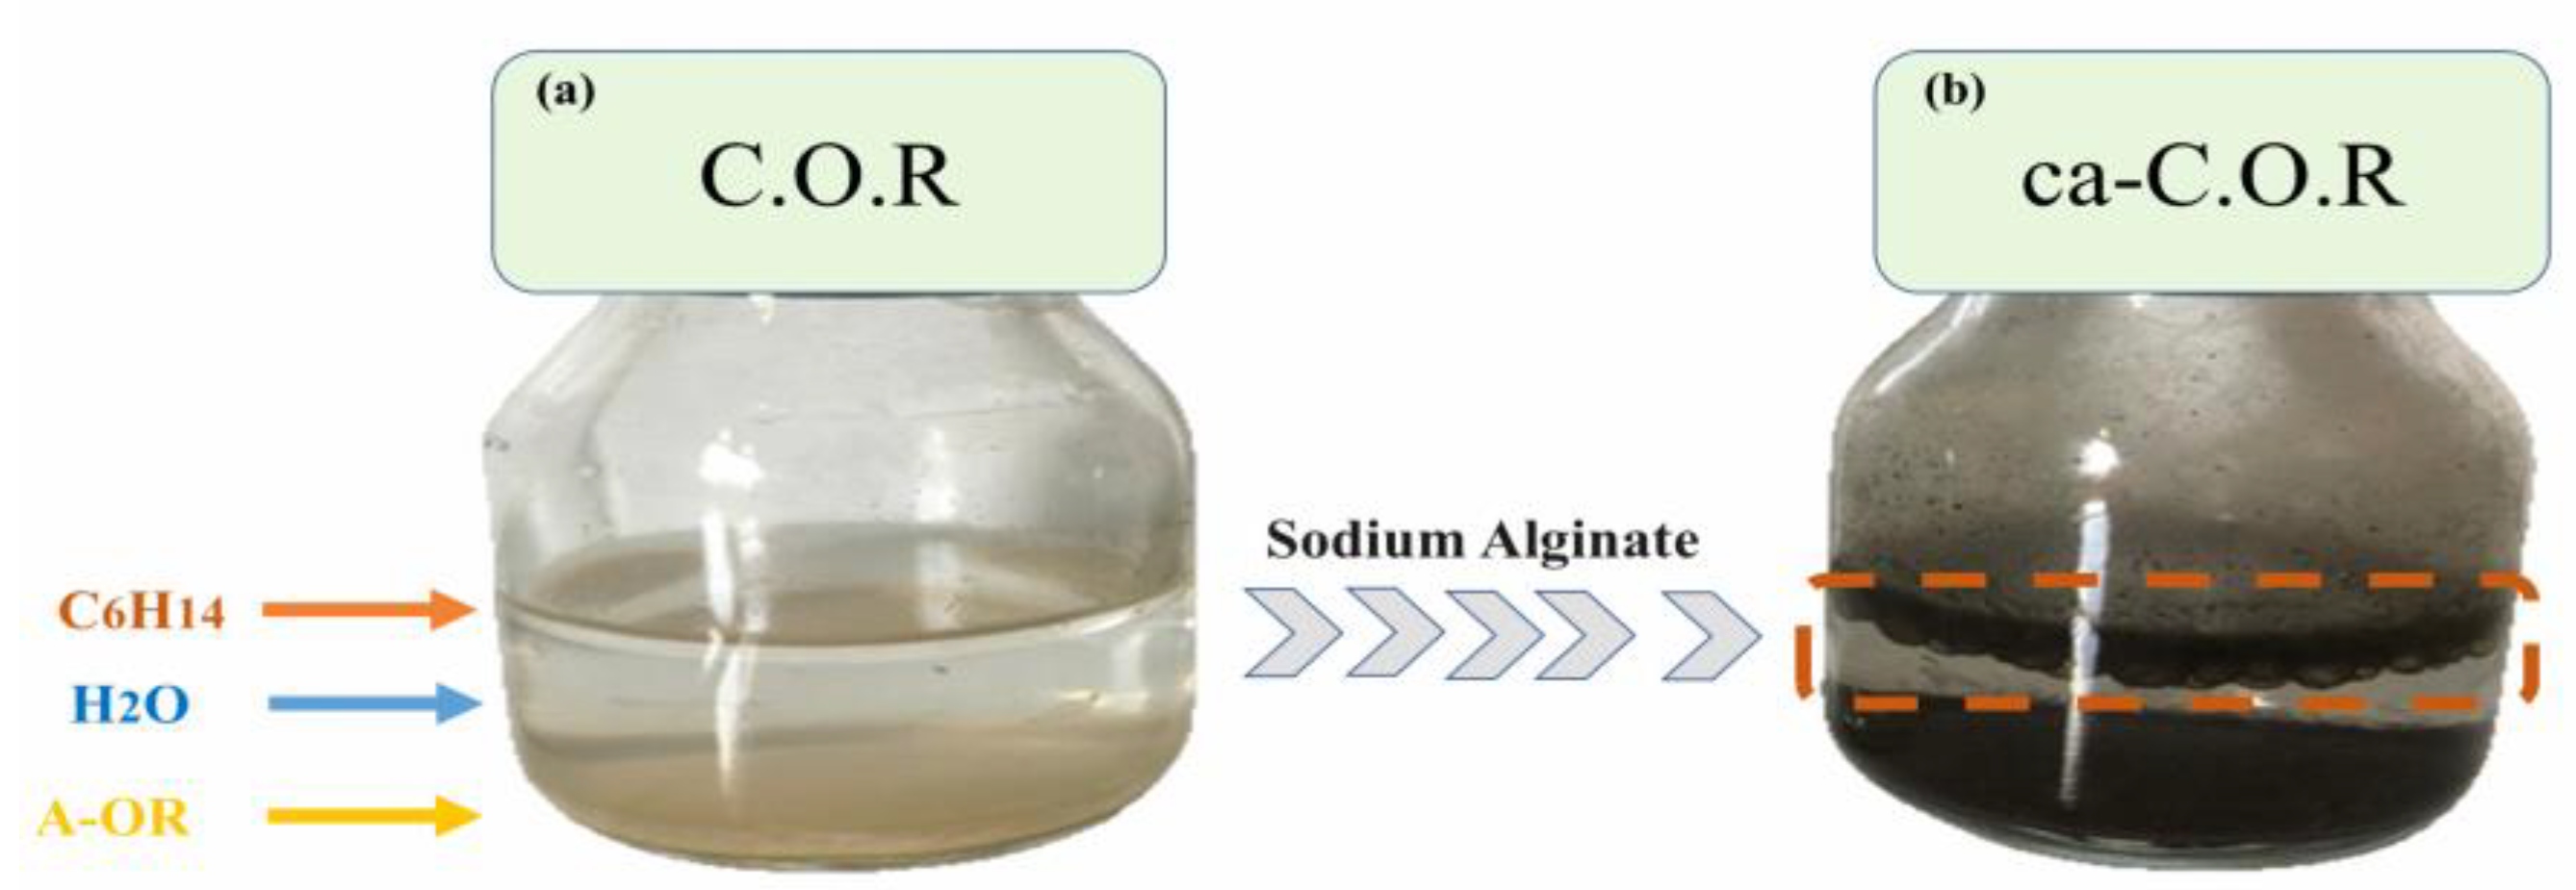
3.3. Hydrophobicity Characteristics of the Various Adsorbents

The dispersion behavior of a given amount (60 mg) of C.O.R (a) and ca-C.O.R (b) in a solvent mixture consisting of 2 mL of n-hexane and 2 mL of water is shown in Figure 13 [81]. To prepare each dispersion, the mixture was stirred for one hour and allowed to stand under static conditions for four hours. As shown in Figure 13a, the C.O.R particles settled in the aqueous phase, while in Figure 13b, the ca-C.O.R particles preferentially settled in the upper n-C6H12. These wetting results indicate that, as expected, C.O.R has a hydrophilic surface, while the ca-C.O.R sample has pronounced hydrophobic properties.

3.4. Theoretical Study
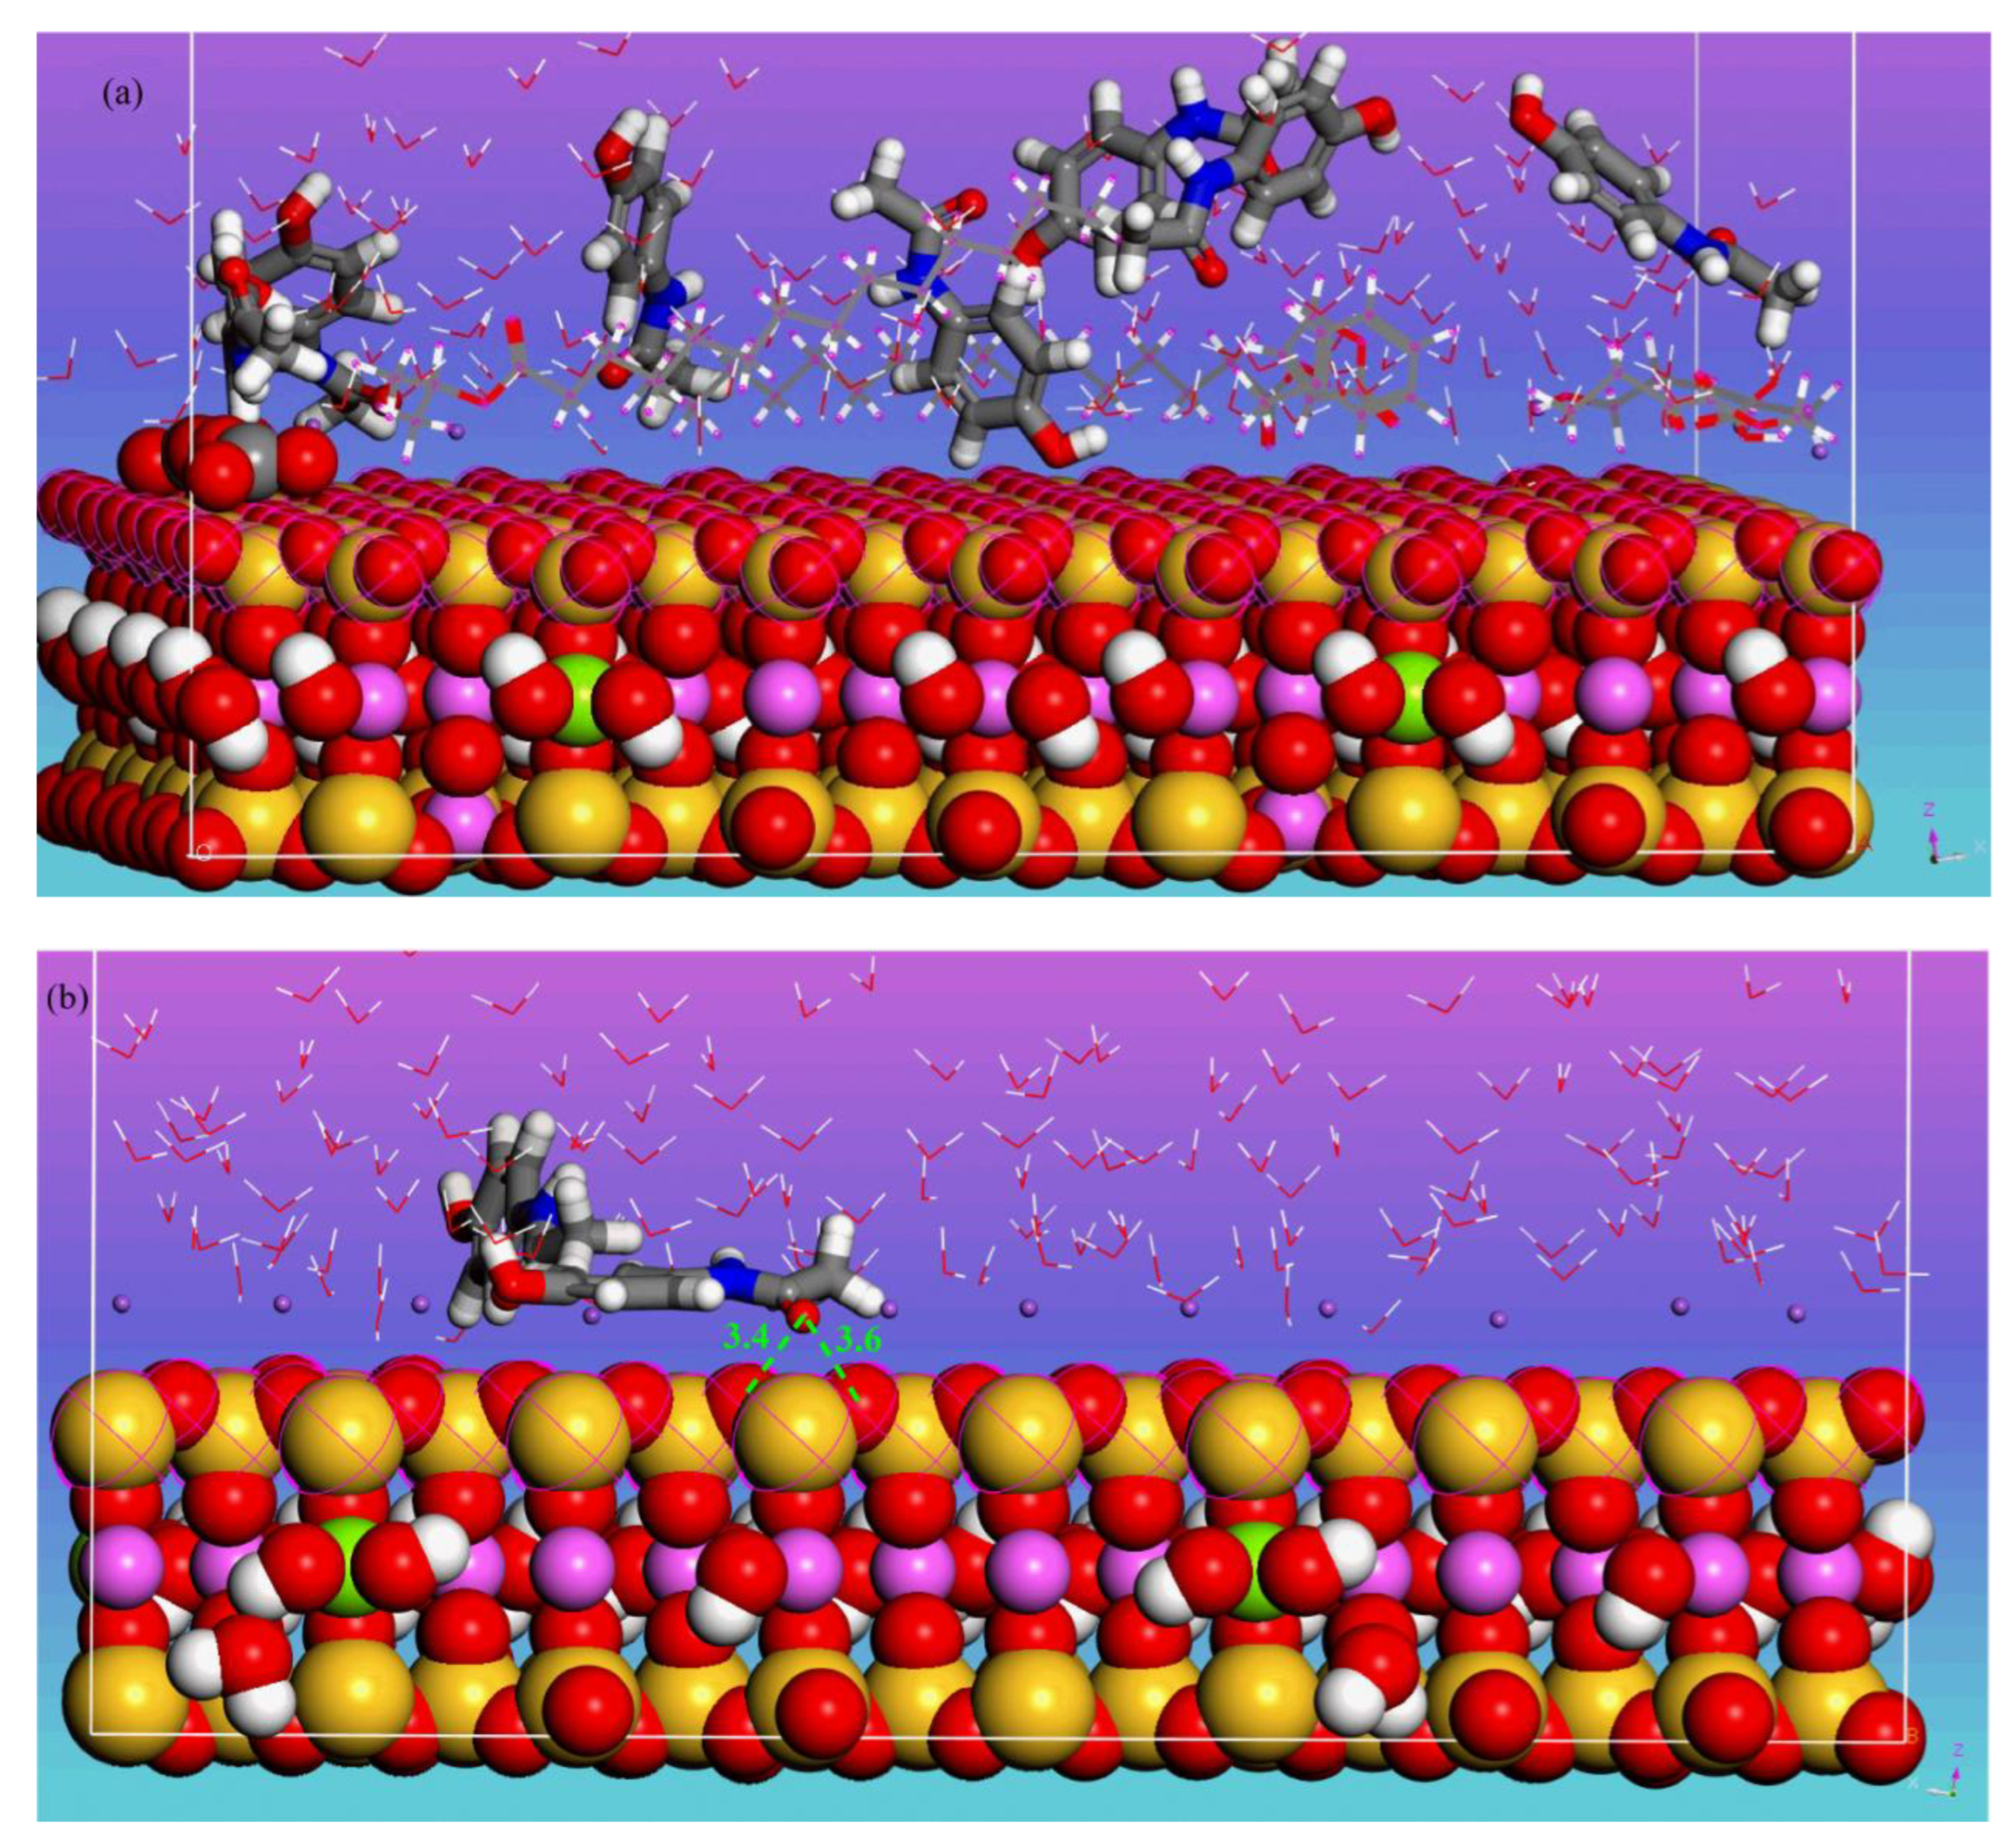
3.4.1. MDS Results

Figure 14 presents the most stable equilibrium configurations for the adsorption of PCT molecules onto MMT and the ca-C.O.R composite substrate models, with adsorption sites marked in purple. According to these equilibrium structures, the PCT molecule adopts a longitudinal orientation along the char (Figure 14a). Conversely, on the montmorillonite surface (Figure 14b), the aromatic rings of the adsorbate are nearly parallel to the surface, suggesting the participation of π-conjugated electrons in the adsorption mechanism.
Figure 14a depicts the adsorption mechanism on the surface models of the ca-C.O.R composite, revealing two distinct adsorption configurations: one localized on the montmorillonite (MMT) surface and another at the interface between the pyrolyzed MMT and sodium alginate. This observation indicates the creation of novel adsorption sites within the composite structure, which are absent in the unmodified starting materials.
Table 8 presents critical energy parameters for the adsorption process, including total energy, rigid adsorption energy, deformation energy, and dEads/dNi, with substrate energies serving as the reference. The negative energy values confirm the spontaneity of adsorption. These values align with typical physisorption energies and remain significantly lower than covalent bond energies, which are characteristic of chemisorption [82], highlighting the physical nature of the interactions and enhanced stability of the composite compared to pristine surfaces. This efficiency likely arises from newly formed adsorption sites, a finding corroborated by experimental data. In summary, PCT adsorption on MMT or the ca-C.O.R composite is spontaneous and dominated by weak physical interactions—van der Waals forces, dipolar interactions, hydrogen bonding, and π–electron interactions.

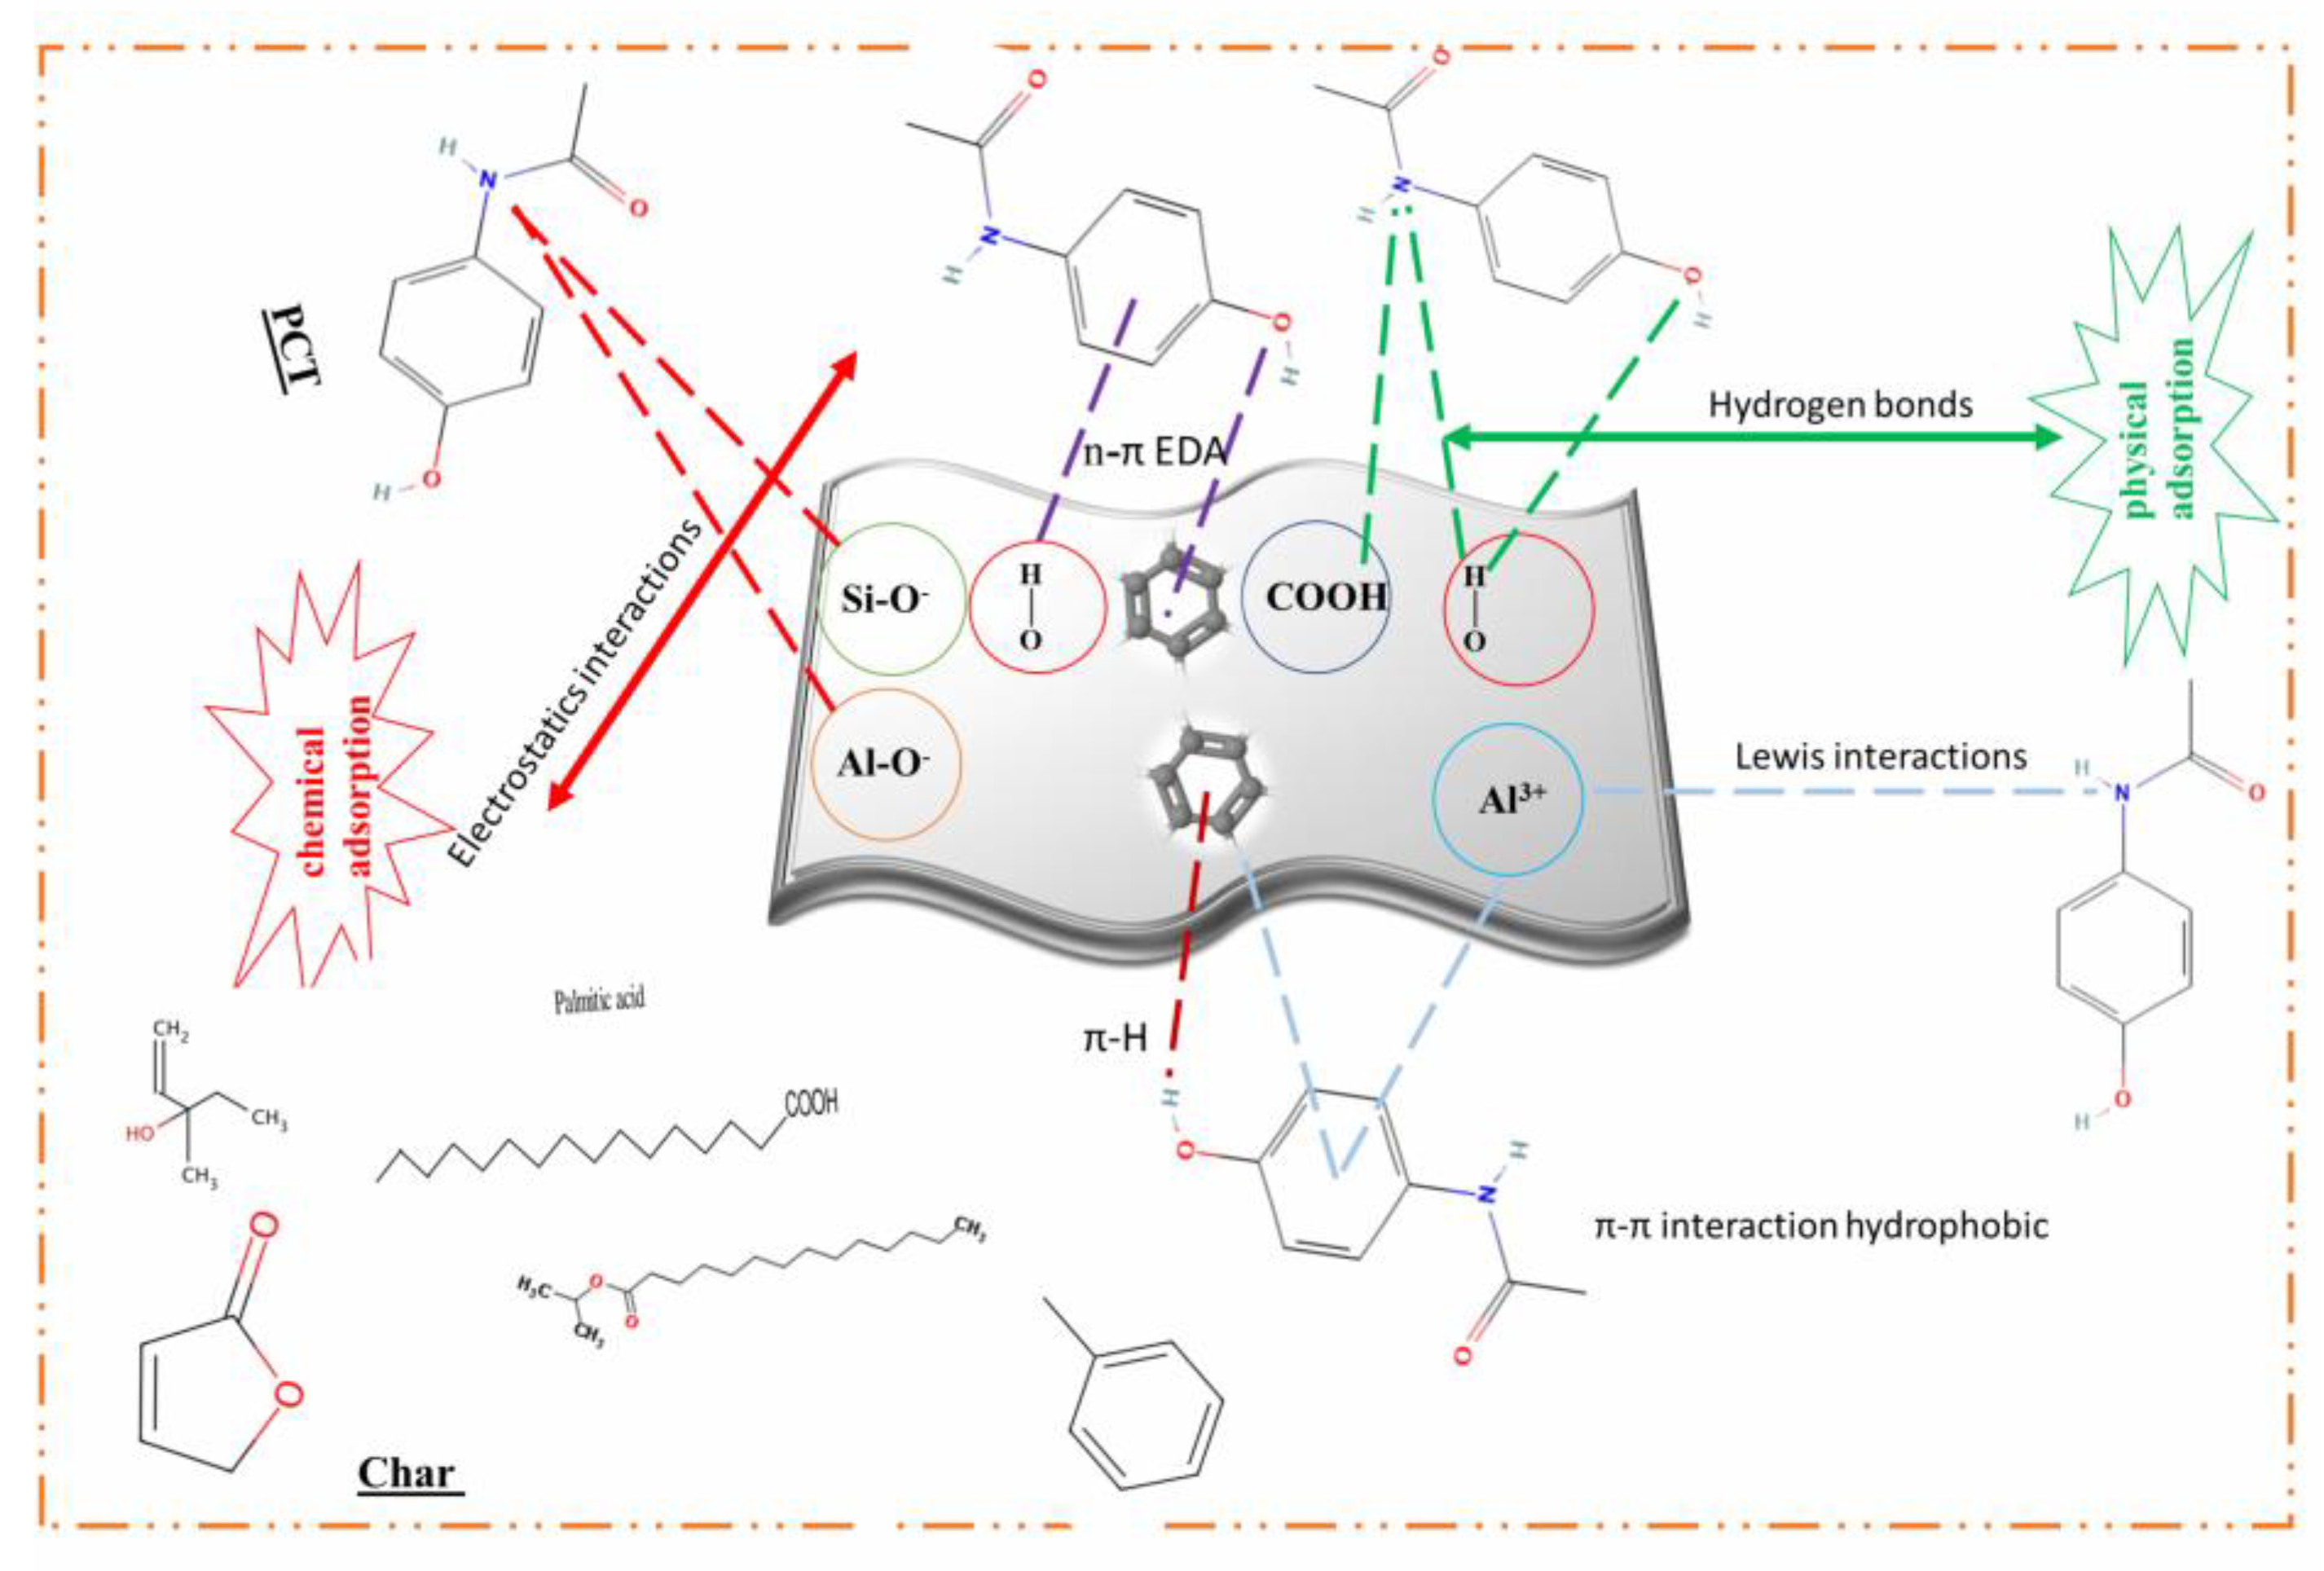
3.4.2. Mechanism Proposal

Several researchers have reported that the interactions between adsorbed molecules and the surface of carbon-based materials can be classified into different types: electron donor-acceptor (EDA) interactions, including π–π EDA and n–π EDA, hydrogen bonding, π–hydrogen bonding interactions, hydrophobic interactions, and molecular attraction between molecules at the liquid–solid interface and the adsorbed molecules. Under equilibrium conditions, potential adsorption mechanisms of PCT on the ca-C.O.R composite were proposed, considering the chemical and textural characterization of the material, the distribution species of PCT, the molecular electrostatic potential (MEP) surfaces (Figure 6), and the frontier molecular orbitals. The results obtained from different techniques show that molecular fragments such as carboxylic and phenolic groups, combined with the highly porous carbon structure, play a key role in favorable interactions with PCT molecules, leading to high adsorption capacity. Figure 15 illustrates the potential mechanisms contributing to the adsorption process [83,84,85,86].

4. Conclusions

In this investigation, a crude clay sourced from the oriental region and sodium alginate were used to produce a carbon composite through pyrolysis using two methods: microwave irradiation followed by calcination under nitrogen. The resulting material, ca-C.O.R, was characterized and found to have well-distributed carbon deposition across the clay surface. The synthesized composite proved to be a potent adsorbent for PCT in aqueous environments, as evidenced by the adsorption values. The Sips isothermal model was found to be the most appropriate for simulating the adsorbate’s adsorption on the synthesized composite. The amount of solute adsorbed at these sites is directly proportional to the solution concentration, indicating the adsorption mechanism. The maximum adsorption capacity for ca-C.O.R was experimentally determined to be 122 mg·g−1. The pseudo-second-order model showed excellent agreement with the experimental adsorption capacity at equilibrium, supported by strong correlation coefficients, a near-unity coefficient of determination (R2→1), and low values of nonlinear chi-squared (X2 → 0) and root mean square error (RMSE). These results suggest that the adsorption of PCT is controlled by a chemical process and is exothermic in nature. In addition, the properties of this adsorbate, including reactivity, were evaluated by calculating its energy, dipole moments, and frontier energy. The distribution of atomic charges and molecular electrostatic potential (MEP) were analyzed to identify potential interaction with higher electron densities, particularly nitrogen and oxygen. The collective data strongly suggest that the structure of PCT exhibits significant reactivity.
In conclusion, the newly synthesized carbonaceous composite is highly effective in recovering PCT from aqueous media, demonstrating its potential as a robust adsorbent for water treatment applications.

Author Contributions

I.A., data curation, formal analysis, software, investigation, methodology, writing—original draft; R.E.-T., data curation, formal analysis; I.B., formal analysis, investigation, resources; M.E., conceptualization, visualization, methodology; B.A., formal analysis, visualization; Y.D., conceptualization, writing—review and editing; M.H., validation, writing—review and editing; K.D., supervision, methodology, validation, writing—review and editing. All authors have read and agreed to the published version of the manuscript.

Funding

This research received no external funding.

Institutional Review Board Statement

Not Applicable.

Informed Consent Statement

The authors declare that the manuscript does not have studies on human subjects, human data or tissue, or animals.

Data Availability Statement

The original contributions presented in this study are included in the article. Further inquiries can be directed to the corresponding author.

Conflicts of Interest

The authors declare that they have no known competing financial interests or personal relationships that could have appeared to influence the work reported in this paper.

References

  1. Spessato, L.; Bedin, K.C.; Cazetta, A.L.; Souza, I.P.A.F.; Duarte, V.A.; Crespo, L.H.S.; Silva, M.C.; Pontes, R.M.; Almeida, V.C. KOH-Super Activated Carbon from Biomass Waste: Insights into the Paracetamol Adsorption Mechanism and Thermal Regeneration Cycles. J. Hazard. Mater. 2019, 371, 499–505. [Google Scholar] [CrossRef] [PubMed]
  2. Patel, M.; Kumar, R.; Pittman, C.U.; Mohan, D. Ciprofloxacin and Acetaminophen Sorption onto Banana Peel Biochars: Environmental and Process Parameter Influences. Environ. Res. 2021, 201, 111218. [Google Scholar] [CrossRef]
  3. Sauvé, S.; Desrosiers, M. Una Revisión de Lo Que Es Un Contaminante Emergente. Chem. Cent. J. 2014, 8, 15. [Google Scholar] [CrossRef]
  4. Wells, P.G. Canadian Aquatic Science and Environmental Legislation under Threat. Mar. Pollut. Bull. 2013, 69, 1–2. [Google Scholar] [CrossRef] [PubMed]
  5. Kim, S.; Chu, K.H.; Al-Hamadani, Y.A.J.; Park, C.M.; Jang, M.; Kim, D.H.; Yu, M.; Heo, J.; Yoon, Y. Removal of Contaminants of Emerging Concern by Membranes in Water and Wastewater: A Review. Chem. Eng. J. 2018, 335, 896–914. [Google Scholar] [CrossRef]
  6. Tran, H.N.; Tomul, F.; Thi Hoang Ha, N.; Nguyen, D.T.; Lima, E.C.; Le, G.T.; Chang, C.T.; Masindi, V.; Woo, S.H. Innovative Spherical Biochar for Pharmaceutical Removal from Water: Insight into Adsorption Mechanism. J. Hazard. Mater. 2020, 39, 122255. [Google Scholar] [CrossRef] [PubMed]
  7. Harnagea-Theophilus, E.; Gadd, S.L.; Knight-Trent, A.H.; DeGeorge, G.L.; Miller, M.R. Acetaminophen-Induced Proliferation of Breast Cancer Cells Involves Estrogen Receptors. Toxicol. Appl. Pharmacol. 1999, 155, 273–279. [Google Scholar] [CrossRef]
  8. Hinson, J.A.; Pohl, L.R.; Monks, T.J.; Gillette, J.R. Acetaminophen-Induced Hepatotoxicity. Life Sci. 1981, 29, 107–116. [Google Scholar] [CrossRef]
  9. Sivarajasekar, N.; Balasubramani, K.; Baskar, R.; Sivamani, S.; Ganesh Moorthy, I. Eco-Friendly Acetaminophen Sequestration Using Waste Cotton Seeds: Equilibrium, Optimization and Validation Studies. J. Water Chem. Technol. 2018, 40, 334–342. [Google Scholar] [CrossRef]
  10. Pan, X.-Y.; Qiao, X. chen Influences of Nitrite on Paracetamol Degradation in Dielectric Barrier Discharge Reactor. Ecotoxicol. Environ. Saf. 2019, 180, 610–615. [Google Scholar] [CrossRef]
  11. Ikehata, K.; Jodeiri Naghashkar, N.; Gamal El-Din, M. Degradation of Aqueous Pharmaceuticals by Ozonation and Advanced Oxidation Processes: A Review. Ozone Sci. Eng. 2006, 28, 353–414. [Google Scholar] [CrossRef]
  12. Yun, W.C.; Lin, K.Y.A.; Tong, W.C.; Lin, Y.F.; Du, Y. Enhanced Degradation of Paracetamol in Water Using Sulfate Radical-Based Advanced Oxidation Processes Catalyzed by 3-Dimensional Co3O4 Nanoflower. Chem. Eng. J. 2019, 373, 1329–1337. [Google Scholar] [CrossRef]
  13. Su, C.C.; Bellotindos, L.M.; Chang, A.T.; Lu, M.C. Degradation of Acetaminophen in an Aerated Fenton Reactor. J. Taiwan Inst. Chem. Eng. 2013, 44, 310–316. [Google Scholar] [CrossRef]
  14. Streit, A.F.M.; Collazzo, G.C.; Druzian, S.P.; Verdi, R.S.; Foletto, E.L.; Oliveira, L.F.S.; Dotto, G.L. Adsorption of Ibuprofen, Ketoprofen, and Paracetamol onto Activated Carbon Prepared from Effluent Treatment Plant Sludge of the Beverage Industry. Chemosphere 2021, 262, 128322. [Google Scholar] [CrossRef]
  15. Nadour, M.; Boukraa, F.; Benaboura, A. Removal of Diclofenac, Paracetamol and Metronidazole Using a Carbon-Polymeric Membrane. J. Environ. Chem. Eng. 2019, 7, 103080. [Google Scholar] [CrossRef]
  16. Lima, D.R.; Hosseini-Bandegharaei, A.; Thue, P.S.; Lima, E.C.; de Albuquerque, Y.R.T.; dos Reis, G.S.; Umpierres, C.S.; Dias, S.L.P.; Tran, H.N. Efficient Acetaminophen Removal from Water and Hospital Effluents Treatment by Activated Carbons Derived from Brazil Nutshells. Colloids Surfaces A Physicochem. Eng. Asp. 2019, 583, 123966. [Google Scholar] [CrossRef]
  17. Turk Sekulic, M.; Boskovic, N.; Slavkovic, A.; Garunovic, J.; Kolakovic, S.; Pap, S. Surface Functionalised Adsorbent for Emerging Pharmaceutical Removal: Adsorption Performance and Mechanisms. Process Saf. Environ. Prot. 2019, 125, 50–63. [Google Scholar] [CrossRef]
  18. Wong, S.; Lim, Y.; Ngadi, N.; Mat, R.; Hassan, O.; Inuwa, I.M.; Mohamed, N.B.; Low, J.H. Removal of Acetaminophen by Activated Carbon Synthesized from Spent Tea Leaves: Equilibrium, Kinetics and Thermodynamics Studies. Powder Technol. 2018, 338, 878–886. [Google Scholar] [CrossRef]
  19. Sims, R.A.; Harmer, S.L.; Quinton, J.S. The Role of Physisorption and Chemisorption in the Oscillatory Adsorption of Organosilanes on Aluminium Oxide. Polymers 2019, 11, 410. [Google Scholar] [CrossRef]
  20. Kerkhoff, C.M.; Martinello, K.d.B.; Franco, D.S.P.; Netto, M.S.; Georgin, J.; Foletto, E.L.; Piccilli, D.G.A.; Silva, L.F.O.; Dotto, G.L. Adsorption of Ketoprofen and Paracetamol and Treatment of a Synthetic Mixture by Novel Porous Carbon Derived from Butia Capitata Endocarp. J. Mol. Liq. 2021, 339, 117184. [Google Scholar] [CrossRef]
  21. Li, B.; Yang, L.; Wang, C.-Q.; Zhang, Q.-P.; Liu, Q.-C.; Li, Y.-D.; Xiao, R. Adsorption of Cd(II) from Aqueous Solutions by Rape Straw Biochar Derived from Different Modification Processes. Chemosphere 2017, 175, 332–340. [Google Scholar] [CrossRef] [PubMed]
  22. Martins Moreira, W.; Viotti, P.V.; Gurgel Adeodato Vieira, M.; dos Santos Gaudêncio Baptista, C.M.; Neves Olsen Scaliante, M.H.; Gimenes, M.L. Hydrothermal Synthesis of Biobased Carbonaceous Composite from a Blend of Kraft Black Liquor and Tannin and Its Application to Aspirin and Paracetamol Removal. Colloids Surf. A Physicochem. Eng. Asp. 2021, 608, 125597. [Google Scholar] [CrossRef]
  23. Rossner, A.; Snyder, S.A.; Knappe, D.R.U. Removal of Emerging Contaminants of Concern by Alternative Adsorbents. Water Res. 2009, 43, 3787–3796. [Google Scholar] [CrossRef]
  24. Elmourabit, M.; Zarki, Y.; Arfoy, B.; Allaoui, I.; Ait Aghzzaf, A.; Raissouni, I.; Bouchta, D.; Chaouket, F.; Draoui, K. Phosphate Sludge Valorization as New Alternative Precursor for Carbonated Hydroxyapatite Nanostructures: Synthesis and Characterization. J. Mater. Cycles Waste Manag. 2024, 26, 602–619. [Google Scholar] [CrossRef]
  25. Chu, Y.; Khan, M.A.; Xia, M.; Lei, W.; Wang, F.; Zhu, S. Synthesis and Mechanism of Adsorption Capacity of Modified Montmorillonite with Amino Acids for 4-Acetaminophenol Removal from Wastewaters. J. Chem. Eng. Data 2019, 64, 5900–5909. [Google Scholar] [CrossRef]
  26. Gamoudi, S.; Frini-Srasra, N.; Srasra, E. Influence of Synthesis Method in Preparation of HDTMA+- and HDPy+-Illites/Smectites. Appl. Clay Sci. 2015, 116–117, 78–84. [Google Scholar] [CrossRef]
  27. Han, H.; Rafiq, M.K.; Zhou, T.; Xu, R.; Mašek, O.; Li, X. A Critical Review of Clay-Based Composites with Enhanced Adsorption Performance for Metal and Organic Pollutants. J. Hazard. Mater. 2019, 369, 780–796. [Google Scholar] [CrossRef]
  28. Najafi, H.; Farajfaed, S.; Zolgharnian, S.; Mosavi Mirak, S.H.; Asasian-Kolur, N.; Sharifian, S. A Comprehensive Study on Modified-Pillared Clays as an Adsorbent in Wastewater Treatment Processes. Process Saf. Environ. Prot. 2021, 147, 8–36. [Google Scholar] [CrossRef]
  29. Revellame, E.D.; Lord, D.; Sharp, W.; Hernandez, R.; Zappi, M.E. Adsorption Kinetic Modeling Using Pseudo- Fi Rst Order and Pseudo-Second Order Rate Laws: A Review. Clean. Eng. Technol. 2020, 1, 100032. [Google Scholar] [CrossRef]
  30. Cataldo, S.; Muratore, N.; Orecchio, S.; Pettignano, A. Enhancement of Adsorption Ability of Calcium Alginate Gel Beads towards Pd(II) Ion. A Kinetic and Equilibrium Study on Hybrid Laponite and Montmorillonite-Alginate Gel Beads. Appl. Clay Sci. 2015, 118, 162–170. [Google Scholar] [CrossRef]
  31. Allaoui, I.; El Mourabit, M.; Arfoy, B.; Hadri, M.; Barhoun, A.; Draoui, K. Adsorption Equilibrium, Kinetic, and Thermodynamic Studies on the Removal of Paracetamol from Wastewater Using Natural and HDTMA-Modified Clay. Desalin. Water Treat. 2024, 318, 100345. [Google Scholar] [CrossRef]
  32. Fabryanty, R.; Valencia, C.; Soetaredjo, F.E.; Putro, J.N.; Santoso, S.P.; Kurniawan, A.; Ju, Y.H.; Ismadji, S. Removal of Crystal Violet Dye by Adsorption Using Bentonite—Alginate Composite. J. Environ. Chem. Eng. 2017, 5, 5677–5687. [Google Scholar] [CrossRef]
  33. Engineering, W.R. A Freundlich-Type Multicomponent Isotherm. J. Colloid Interface Sci. 1981, 79, 136–142. [Google Scholar]
  34. Batool, F.; Akbar, J.; Iqbal, S.; Noreen, S.; Nasir, S.; Bukhari, A. Study of Isothermal, Kinetic, and Thermodynamic Parameters for Adsorption of Cadmium: An Overview of Linear and Nonlinear Approach and Error Analysis. Bioinorg. Chem. Appl. 2018, 2018, 3463724. [Google Scholar] [CrossRef]
  35. Dinh, V.P.; Nguyen, P.T.; Tran, M.C.; Luu, A.T.; Hung, N.Q.; Luu, T.T.; Kiet, H.A.T.; Mai, X.T.; Luong, T.B.; Nguyen, T.L.; et al. HTDMA-Modified Bentonite Clay for Effective Removal of Pb(II) from Aqueous Solution. Chemosphere 2022, 286, 131766. [Google Scholar] [CrossRef]
  36. Tran, H.N.; You, S.; Hosseini-bandegharaei, A.; Chao, H. Mistakes and Inconsistencies Regarding Adsorption of Contaminants from Aqueous Solutions: A Critical Review. Water Res. 2017, 120, 88–116. [Google Scholar] [CrossRef]
  37. Ng, J.C.Y.; Cheung, W.H.; Mckay, G. Equilibrium Studies of the Sorption of Cu(II) Ions onto Chitosan. J. Colloid Interface Sci. 2002, 74, 64–74. [Google Scholar] [CrossRef]
  38. Parimal, S.; Prasad, M.; Bhaskar, U. Prediction of Equillibrium Sorption Isotherm: Comparison of Linear and Nonlinear Methods. Ind. Eng. Chem. Res. 2010, 49, 2882–2888. [Google Scholar] [CrossRef]
  39. Abdullahi, S.H.; Uzairu, A.; Shallangwa, G.A.; Uba, S.; Umar, A.B.; Srivastava, P.N. In-Silico Design of Some Pyrazolopyridine Analogs as Breast Cancer Inhibitors: QSAR Modeling, Molecular Docking, MD Simulation, and Pharmacological Features Profiling. J. Indian Chem. Soc. 2023, 100, 101053. [Google Scholar] [CrossRef]
  40. Zhao, Y.; Truhlar, D.G. Density Functionals with Broad Applicability in Chemistry. Acc. Chem. Res. 2008, 41, 157–167. [Google Scholar] [CrossRef]
  41. Frisch, M.J.; Trucks, G.W.; Schlegel, H.B.; Scuseria, G.E.; Robb, M.A.; Cheeseman, J.R.; Scalmani, G.; Barone, V.; Petersson, G.A.; Nakatsuji, H.; et al. Gaussian 09, Revision D.01; Gaussian Inc.: Wallingford, CT, USA, 2009. [Google Scholar]
  42. Abdulazeez, I.; Khaled, M.; Al-Saadi, A.A. Impact of Electron-Withdrawing and Electron-Donating Substituents on the Corrosion Inhibitive Properties of Benzimidazole Derivatives: A Quantum Chemical Study. J. Mol. Struct. 2019, 1196, 348–355. [Google Scholar] [CrossRef]
  43. Diniz, J.E.M.; Borges, R.S.; Alves, C.N. A DFT Study for Paracetamol and 3,5-Disubstituted Analogues. J. Mol. Struct. THEOCHEM 2004, 673, 93–97. [Google Scholar] [CrossRef]
  44. Ahmed, L.; Omer, R. Omer Computational Study on Paracetamol Drug. J. Phys. Chem. Funct. Mater. 2020, 3, 9–13. [Google Scholar]
  45. Ustinov, E. Kinetic Monte Carlo Approach for Molecular Modeling of Adsorption. Curr. Opin. Chem. Eng. 2019, 24, 1–11. [Google Scholar] [CrossRef]
  46. Liu, Y.; Wang, J.S.; Zhu, P.; Zhao, J.C.; Zhang, C.J.; Guo, Y.; Cui, L. Thermal Degradation Properties of Biobased Iron Alginate Film. J. Anal. Appl. Pyrolysis 2016, 119, 87–96. [Google Scholar] [CrossRef]
  47. Swai, R.E. Tutorial I: Sodium Montmorillonite (Na+—Mt) Crystal Modeling Process. 2020. Available online: https://www.researchgate.net/publication/340565376_Tutorial_I_Sodium_Montmorillonite_Na_-Mt_Crystal_modeling_Process?channel=doi&linkId=5e90ce884585150839d223e5&showFulltext=true (accessed on 13 May 2025). [CrossRef]
  48. Achache, M.; Elouilali Idrissi, G.; Chraka, A.; Ben Seddik, N.; Draoui, K.; Bouchta, D.; Mohamed, C. Detection of Paracetamol by a Montmorillonite-Modified Carbon Paste Sensor: A Study Combining MC Simulation, DFT Computation and Electrochemical Investigations. Talanta 2024, 274, 126027. [Google Scholar] [CrossRef]
  49. Barrak, I.; Ayouch, I.; Kassab, Z.; El Achaby, M.; Barhoun, A.; Draoui, K. Sodium Alginate Encapsulated Moroccan Clay as Eco-Friendly and Efficient Adsorbent for Copper Ions from Aqueous Medium. Mater. Today Proc. 2021, 51, 2040–2046. [Google Scholar] [CrossRef]
  50. Ouachtak, H.; Guerdaoui, E.; Haouti, E. Dyes on the Eco-Friendly Adsorbent of Activated. RSC Adv. 2023, 13, 5027–5044. [Google Scholar] [CrossRef]
  51. Bouna, L.; El Fakir, A.A.; Benlhachemi, A.; Draoui, K.; Villain, S.; Guinneton, F. Physico-Chemical Characterization of Clays from Assa-Zag for Valorization in Cationic Dye Methylene Blue Adsorption. Mater. Today Proc. 2020, 22, 22–27. [Google Scholar] [CrossRef]
  52. Luo, Z.; Gao, M.; Ye, Y.; Yang, S. Modification of Reduced-Charge Montmorillonites by a Series of Gemini Surfactants: Characterization and Application in Methyl Orange Removal. Appl. Surf. Sci. 2015, 324, 807–816. [Google Scholar] [CrossRef]
  53. Loutou, M.; Hajjaji, M.; Mansori, M.; Favotto, C.; Hakkou, R. Phosphate Sludge: Thermal Transformation and Use as Lightweight Aggregate Material. J. Environ. Manag. 2013, 130, 354–360. [Google Scholar] [CrossRef] [PubMed]
  54. Ayouch, I.; Barrak, I.; Kassab, Z.; El Achaby, M.; Barhoun, A.; Draoui, K. Improved Recovery of Cadmium from Aqueous Medium by Alginate Composite Beads Filled by Bentonite and Phosphate Washing Sludge. Colloids Surf. A Physicochem. Eng. Asp. 2020, 604, 125305. [Google Scholar] [CrossRef]
  55. Salerno, P.; Asenjo, M.B.; Mendioroz, S. Influence of Preparation Method on Thermal Stability and Acidity of Al-PILCs. Thermochim. Acta 2001, 379, 101–109. [Google Scholar] [CrossRef]
  56. Das, L.; Saha, N.; Ganguli, A.; Das, P.; Bhowal, A.; Bhattacharjee, C. Calcium Alginate–Bentonite/Activated Biochar Composite Beads for Removal of Dye and Biodegradation of Dye-Loaded Composite after Use: Synthesis, Removal, Mathematical Modeling and Biodegradation Kinetics. Environ. Technol. Innov. 2021, 24, 101955. [Google Scholar] [CrossRef]
  57. Largo, F.; Akbal, F.; Benlhachemi, A.; Jada, A.; Addi, A. Elaboration and Properties of a New SDS/CTAB@Montmorillonite Organoclay Compositeas a Superb Adsorbent for the Removal of Malachite Green from Aqueous Solutions. Sep. Purif. Technol. 2020, 225, 117335. [Google Scholar] [CrossRef]
  58. Azaryouh, L.; Abara, H.; Kassab, Z.; Ablouh, E.H.; Aboulkas, A.; El Achaby, M.; Draoui, K. Hybrid Carbonaceous Adsorbents Based on Clay and Cellulose for Cadmium Recovery from Aqueous Solution. RSC Adv. 2023, 13, 6954–6965. [Google Scholar] [CrossRef]
  59. Bounab, L.; Draoui, K.; Ahrouch, M.; Hadri, M.; Bouchta, D.; Barhoun, A. An Effective Functionalized Moroccan Bentonite: Application for a Green Remediation of m-Cresol. J. Mater. Environ. Sci. 2017, 8, 244–256. [Google Scholar]
  60. Jara, G.E.; Solis, C.A.; Gsponer, N.S.; Torres, J.J.; Glusko, C.A.; Previtali, C.M.; Pierini, A.B.; Vera, D.M.A.; Chesta, C.A.; Montejano, H.A. An Experimental and TD-DFT Theoretical Study on the Photophysical Properties of Methylene Violet Bernthsen. Dye. Pigment. 2015, 112, 341–351. [Google Scholar] [CrossRef]
  61. Bentahar, S.; Dbik, A.; El Khomri, M.; El Messaoudi, N.; Lacherai, A. Adsorption of Methylene Blue, Crystal Violet and Congo Red from Binary and Ternary Systems with Natural Clay: Kinetic, Isotherm, and Thermodynamic. J. Environ. Chem. Eng. 2017, 5, 5921–5932. [Google Scholar] [CrossRef]
  62. Kausar, A.; Sher, F.; Hazafa, A.; Javed, A.; Sillanpää, M.; Iqbal, M. International Journal of Biological Macromolecules Biocomposite of Sodium-Alginate with Acidi Fi Ed Clay for Wastewater Treatment: Kinetic, Equilibrium and Thermodynamic Studies. Int. J. Biol. Macromol. 2020, 161, 1272–1285. [Google Scholar] [CrossRef]
  63. Ho, Y.S.; Mckay, G. Pseudo-Second Order Model for Sorption Processes. Process Biochem. 1999, 34, 451–465. [Google Scholar] [CrossRef]
  64. Mittal, A.; Ahmad, R.; Hasan, I. Iron oxide-impregnated dextrin nanocomposite: Synthesis and its application for the biosorption of Cr(VI) ions from aqueous solution. Desalin. Water Treat. 2016, 57, 15133–15145. [Google Scholar] [CrossRef]
  65. Ouachtak, H.; El, R.; El, A.; Haounati, R.; Amaterz, E.; Ait, A.; Akbal, F.; Labd, M. Experimental and Molecular Dynamics Simulation Study on the Adsorption of Rhodamine B Dye on Magnetic Montmorillonite Composite γ-Fe2O3 @ Mt. J. Mol. Liq. 2020, 309, 113142. [Google Scholar] [CrossRef]
  66. Langmuir, I. The Adsorption of Gases on Plane Surfaces of Glass, Mica and Platinum. J. Am. Chem. Soc. 1918, 40, 1361–1403. [Google Scholar] [CrossRef]
  67. Goscianska, J.; Ejsmont, A.; Olejnik, A.; Ludowicz, D.; Stasiłowicz, A.; Cielecka-Piontek, J. Design of Paracetamol Delivery Systems Based on Functionalized Ordered Mesoporous Carbons. Materials 2020, 13, 4151. [Google Scholar] [CrossRef]
  68. Popa, V.T.; Schwarz, J.A. Two-step sequences with extended temkin nonuniform reactivity—Rate-determining step revisited. Chem. Eng. Sci. 1996, 51, 3657–3664. [Google Scholar] [CrossRef]
  69. Saadi, R.; Saadi, Z.; Fazaeli, R.; Fard, N.E. Monolayer and Multilayer Adsorption Isotherm Models for Sorption from Aqueous Media Monolayer and Multilayer Adsorption Isotherm Models for Sorption. Korean J. Chem. Eng. 2015, 32, 787–799. [Google Scholar] [CrossRef]
  70. Anirudhan, T.S.; Gopal, S.S.; Sandeep, S. Applied Clay Science Synthesis and Characterization of Montmorillonite/N-(Carboxyacyl) Chitosan Coated Magnetic Particle Nanocomposites for Controlled Delivery of Paracetamol. Appl. Clay Sci. 2014, 88–89, 151–158. [Google Scholar] [CrossRef]
  71. Sajid, M.; Bari, S.; Saif Ur Rehman, M.; Ashfaq, M.; Guoliang, Y.; Mustafa, G. Adsorption Characteristics of Paracetamol Removal onto Activated Carbon Prepared from Cannabis Sativum Hemp. Alexandria Eng. J. 2022, 61, 7203–7212. [Google Scholar] [CrossRef]
  72. Chauhan, M.; Saini, V.K.; Suthar, S. Ti-Pillared Montmorillonite Clay for Adsorptive Removal of Amoxicillin, Imipramine, Diclofenac-Sodium, and Paracetamol from Water. J. Hazard. Mater. 2020, 399, 122832. [Google Scholar] [CrossRef]
  73. Pathania, D.; Sharma, S.; Singh, P. Removal of Methylene Blue by Adsorption onto Activated Carbon Developed from Ficus Carica Bast. Arab. J. Chem. 2017, 10, S1445–S1451. [Google Scholar] [CrossRef]
  74. Lung, I.; Soran, M.L.; Stegarescu, A.; Opris, O.; Gutoiu, S.; Leostean, C.; Lazar, M.D.; Kacso, I.; Silipas, T.D.; Porav, A.S. Evaluation of CNT-COOH/MnO2/Fe3O4 Nanocomposite for Ibuprofen and Paracetamol Removal from Aqueous Solutions. J. Hazard. Mater. 2021, 403, 123528. [Google Scholar] [CrossRef] [PubMed]
  75. González-Hourcade, M.; Simões dos Reis, G.; Grimm, A.; Dinh, V.M.; Lima, E.C.; Larsson, S.H.; Gentili, F.G. Microalgae Biomass as a Sustainable Precursor to Produce Nitrogen-Doped Biochar for Efficient Removal of Emerging Pollutants from Aqueous Media. J. Clean. Prod. 2022, 348, 131280. [Google Scholar] [CrossRef]
  76. Başar, C.A. Applicability of the Various Adsorption Models of Three Dyes Adsorption onto Activated Carbon Prepared Waste Apricot. J. Hazard. Mater. 2006, 135, 232–241. [Google Scholar] [CrossRef]
  77. Milonjić, S.K. A Consideration of the Correct Calculation of Thermodynamic Parameters of Adsorption. J. Serbian Chem. Soc. 2007, 72, 1363–1367. [Google Scholar] [CrossRef]
  78. Sun, C.; Wang, C. Estimation on the Intramolecular Hydrogen-Bonding Energies in Proteins and Peptides by the Analytic Potential Energy Function. J. Mol. Struct. THEOCHEM 2010, 956, 38–43. [Google Scholar] [CrossRef]
  79. Lima, E.C.; Gomes, A.A.; Nguyen, H. Comparison of the Nonlinear and Linear Forms of the van ’ t Hoff Equation for Calculation of Adsorption Thermodynamic Parameters (ΔS° and ΔH°). J. Mol. Liq. 2020, 311, 113315. [Google Scholar] [CrossRef]
  80. Nourmoradi, H.; Moghadam, K.F.; Jafari, A.; Kamarehie, B. Removal of Acetaminophen and Ibuprofen from Aqueous Solutions by Activated Carbon Derived from Quercus Brantii (Oak) Acorn as a Low-Cost Biosorbent. J. Environ. Chem. Eng. 2018, 6, 6807–6815. [Google Scholar] [CrossRef]
  81. Nur, H.; Faizal, A.; Abdul, N.; Wei, L.K.; Nazlan, M.; Muhid, M.; Hamdan, H. Simultaneous Adsorption of a Mixture of Paraquat and Dye by NaY Zeolite Covered with Alkylsilane. J. Hazard. Mater. 2005, 117, 35–40. [Google Scholar] [CrossRef]
  82. Benhouria, A.; Zaghouane-Boudiaf, H.; Bourzami, R.; Djerboua, F.; Hameed, B.H.; Boutahala, M. Cross-Linked Chitosan-Epichlorohydrin/Bentonite Composite for Reactive Orange 16 Dye Removal: Experimental Study and Molecular Dynamic Simulation. Int. J. Biol. Macromol. 2023, 242, 124786. [Google Scholar] [CrossRef]
  83. Liu, L.; Luo, X.; Ding, L.; Luo, S. 4—Application of Nanotechnology in the Removal of Heavy Metal From Water; Elsevier Inc.: Amsterdam, The Netherlands, 2019; ISBN 9780128148372. [Google Scholar]
  84. Abidi, N.; Duplay, J.; Errais, E.; Jada, A.; Trabelsi-ayadi, M. Discoloration of Textile Effluent by Natural Clay Improved through the Presence of Dyeing Additives. Desalination Water Treat. 2016, 3994, 27954–27968. [Google Scholar] [CrossRef]
  85. Spessato, L.; Cazetta, A.L.; Melo, S.; Pezoti, O.; Tami, J.; Ronix, A.; Fonseca, J.M.; Martins, A.F.; Silva, T.L.; Almeida, V.C. Synthesis of Superparamagnetic Activated Carbon for Paracetamol Removal from Aqueous Solution. J. Mol. Liq. 2020, 300, 112282. [Google Scholar] [CrossRef]
  86. Pauletto, P.S.; Lütke, S.F.; Dotto, G.L.; Salau, N.P.G. Adsorption Mechanisms of Single and Simultaneous Removal of Pharmaceutical Compounds onto Activated Carbon: Isotherm and Thermodynamic Modeling. J. Mol. Liq. 2021, 336, 116203. [Google Scholar] [CrossRef]
Figure 1. XRD patterns of C.O.R and ca-C.O.R.
Ceramics 08 00060 g001
Figure 2. FT-IR spectra of C.O.R and ca-C.O.R.
Ceramics 08 00060 g002
Figure 3. (a) N2 adsorption–desorption isotherms and (b) corresponding pore size distribution (inset).
Ceramics 08 00060 g003
Figure 4. (a) SEM image of C.O.R; (b) particle size distribution histogram of C.O.R; (c) EDS elemental mapping of C.O.R (d) SEM image of ca-C.O.R; (e) particle size distribution histogram of ca-C.O.R; (f) EDS elemental mapping of ca-C.O.R.
Ceramics 08 00060 g004
Figure 5. TGA/DTA diagrams of (a) C.O.R and (b) modified clay ca-C.O.R.
Ceramics 08 00060 g005
Figure 6. DFT calculations for (a) HOMO, (b) LUMO, (c) ESP of PCT drug, and (d) Mulliken atomic charges distribution.
Ceramics 08 00060 g006
Figure 7. Comparison of different prepared materials for PCT removal.
Ceramics 08 00060 g007
Figure 8. Effect of contacting time on PCT adsorption on ca-C.O.R.
Ceramics 08 00060 g008
Figure 9. Weber–Morris kinetic model for the adsorption of PCT on ca-C.O.R.
Ceramics 08 00060 g009
Figure 10. Experimental adsorption isotherms of PCT onto ca-C.O.R compared to the nonlinear theoretical models.
Ceramics 08 00060 g010
Figure 11. Effect of pH on the adsorption of PCT onto ca-C.O.R.
Ceramics 08 00060 g011
Figure 12. (a) Effect of temperature on PCT adsorption and (b) Van’t Hoff plot for the adsorption of PCT on ca-C.O.R.
Ceramics 08 00060 g012
Figure 13. Phase distribution of (a) C.O.R and (b) ca-C.O.R in n-hexane and water mixture.
Ceramics 08 00060 g013
Figure 14. Equilibrium configurations of the adsorbed reactive PCT molecules on substrate models: (a) ca-C.O.R composite and (b) montmorillonite, red, pink, light green, golden and violet represent oxygen, aluminum, magnesium, silicon and sodium atoms, respectively.
Ceramics 08 00060 g014
Figure 15. Proposed mechanisms for PCT adsorption on ca-C.O.R.
Ceramics 08 00060 g015
Table 1. The equations for kinetic models, isothermal models and error functions.
Isothermal or KineticModel Equations Reference
Pseudo-first-orderQt = Qe (1 − e k , t ) Equation (3)[29]
Pseudo-second-orderQt = Q e 2 K 2 , t 1 + K 2 Q e , 2 t Equation (4)[30]
Intraparticle diffusion Q t = k t t 1 2 + C Equation (5)[31]
Langmuir isothermQe = Q L K l C e 1 + K L C e Equation (6)[32]
Freundlich isothermQe = K F C e 1 / n F Equation (7)[33]
TemkinQe = B T L n ( K T C e ) Equation (8)[34]
SipsQe = K S Q S C e 1 / n S 1 + K S C e 1 / n S Equation (9)[35]
Error functions
Chi-squared X2X2 = ( Q e , e x p Q e , c a l ) 2 Q e , c a l Equation (10) [36]
Residual root mean square errorRMSE = 1 n 2 ( Q e , e x p Q e , c a l ) 2 Equation (11)[37]
Coefficient of determinationR2 = 1 − ( Q e , e x p Q e , c a l ) 2 Equation (12)[38]
Adjusted cofficient R2adj = n 1 ( R 2 k ) n k + 1 Equation (13)[39]
Notation: Qt (mg·g−1) is the amount adsorbed at time t (min), while Qe (mg·g−1) is the amount at equilibrium. The constants K1 (min) and K2 (mg·g−1·min−1) correspond to the rates of pseudo-first-order and second-order kinetics, respectively. The equilibrium concentration is given in (mg·L−1), and Qmax is the maximum amount adsorbed (mg·g−1), and KL is the Langmuir constant (L·mg−1). KT (L·mg−1) and BT (J·mol−1) are parameters from the Temkin equations. Qmax indicates the maximum adsorption capacity under the tested conditions, Ce represents the pressure or concentration of the adsorbate, KS is a constant that describes the affinity of the adsorbate for the adsorbent surface, and nS is a constant that reflects the heterogeneity of the adsorbent surface. KF (mg·g−1), together with n (mg·L−1), defines the Freundlich isotherm constant, where n indicates the degree of heterogeneity. Qe, cal (mg·g−1) refers to the amount calculated using a kinetic or isothermal adsorption model through the Solver add-in in Microsoft Excel 2019. Qe, exp (mg·g−1) represents the mean of the experimental Q values, and n indicates the number of data points in the experimental set. Data visualization and curve fitting were performed using OriginPro 2020.
Table 2. Texture parameters of C.O.R and ca-C.O.R.
SampleSurface Area
m2·g−1
Pore Volume Differential
cm3·g−1·Å−1
Size of Pores
Å
C.O.R44.740.003442.70
ca-C.O.R4.380.00036146.01
Table 3. Calculated electronic parameters of PCT alginate contained in the composites.
MoleculeEHOMO
(eV)
ELUMO
(eV)
Eg
(eV)
η
(eV)
X
(eV)
Dipole
Moment
Et
(eV)
Paracetamol−0.2013−0.00250.19880.09940.10192.0458−515
Table 4. Kinetic parameters for the adsorption of PCT onto ca-C.O.R.
Kinetic ModelParam.ca-C.O.R
Pseudo-first-orderk2 (g·mg−1·min−1)0.075
Qe,cal (mg·g−1)47.31
26.64
RMSE2.18
R20.982
R2adj0.978
Pseudo-second-orderk2 (g·mg−1·min−1)0.002
Qe,cal (mg·g−1)50.59
20.82
RMSE0.77
R20.997
R2adj0.997
Intraparticle diffusionk12.46
C125.17
R20.989
R2adj0.977
k20.66
C239.91
R20.947
R2adj0.894
Qexp = 48.75 mg·g−1
Table 5. Isotherm parameters for the adsorption of PCT onto the ca-C.O.R composite.
Isotherm ModelParametersca-C.O.R
LangmuirKL (L·mg−1)0.00003
qm (mg·g−1)606
23.33
RMSE6.41
R20.98
R2adj0.97
FreundlichKF0.29
1/nF0.89
23.73
RMSE7.12
R20.96
R2adj0.94
TemkinBT64
KT0.007
23.08
RMSE5.53
R20.98
R2adj0.96
Sipsks (L·mg−1)0.002
qs (mg·g−1)162
ns1.93
20.99
RMSE3.09
R20.99
R2adj0.99
Table 6. Comparison of the maximum adsorption capacities of PCT.
AdsorbentCapacities (mg·g−1)Reference
Activated carbon from Cannabis sativum hemp26.31[71]
Natural montmorillonite (Ti-PILC)20.83[72]
Activated carbon from Ficus carica bast47.62[73]
Banana peel biochar (PBC750)49.43[2]
CNT-COOH/MnO2/Fe3O4 composit80.64[74]
Porous carbon derived from Butia capitata endocar100.6[20]
N-doped biochar-600105.6[75]
Activated carbon from waste apricot102.00[76]
Carbonaceous composite122This work
Table 7. Thermodynamic parameters of ca-C.O.R.
G°(kJ·mol−1) H° (kJ·mol−1)S° (J·K−1·mol−1)
298 K303 K308 K313 K
ca-C.O.R−12.159−12.808−11.510−11.023−34.805−75.782
Table 8. Some adsorption energies (in kcal·mol−1) of the adsorbed reactive PCT molecules on montmorillonite and the composite model substrates.
StructureEtotEadsErigidEdefdEads/dNi
MMT−193.115−120.309−96.170−24.139−58.377
ca-C.O.R−547.346−292.524−202.291−90.233−33.118
Disclaimer/Publisher’s Note: The statements, opinions and data contained in all publications are solely those of the individual author(s) and contributor(s) and not of MDPI and/or the editor(s). MDPI and/or the editor(s) disclaim responsibility for any injury to people or property resulting from any ideas, methods, instructions or products referred to in the content.

