Article

Pseudocapacitive Behavior of Protonic Niobate Nanowires in Aqueous Acidic Electrolyte

by
Adilar Gonçalves dos Santos Júnior
1,*,
Jessica Gotardi
1,
Edna Jerusa Pacheco Sampaio
1,
Cristiano Campos Araújo
1,
Gabriel Luiz Rasch
1,
Antonio Marcos Helgueira de Andrade
2,
Roberto Hübler
3,
Andrés Cuña Suárez
4 and
Célia de Fraga Malfatti
1,*
1
Laboratório de Pesquisa em Corrosão (LAPEC), Departamento de Metalurgia, Universidade Federal do Rio Grande do Sul (UFRGS), Porto Alegre 91501 970, Rio Grande do Sul, Brazil
2
Instituto de Física, Universidade Federal do Rio Grande do Sul (UFRGS), Porto Alegre 91501 970, Rio Grande do Sul, Brazil
3
Materials and Nanoscience Laboratory, Polytechnic School, Pontifícia Universidade Católica do Rio Grande do Sul, Porto Alegre 90619-900, Rio Grande do Sul, Brazil
4
Área Fisicoquímica/DETEMA and Laboratorio de Energías Renovables/IPTP, Facultad de Química, Universidad de la República, Montevideo 11800, Uruguay
*
Authors to whom correspondence should be addressed.
Ceramics 2025, 8(2), 59; https://doi.org/10.3390/ceramics8020059
Submission received: 28 March 2025 / Revised: 9 May 2025 / Accepted: 15 May 2025 / Published: 20 May 2025
(This article belongs to the Special Issue Advances in Electronic Ceramics, 2nd Edition)

Abstract

Niobium-based oxides are being increasingly evaluated as materials for energy storage applications. Additionally, the use of these oxides as cathodes in aqueous electrolytes has shown promise. Based on this, the pseudocapacitive behavior of protonic niobate nanowires in an aqueous acidic electrolyte (1 M H2SO4) was evaluated for the first time. The material was obtained in two simple sequential steps. First, hydrothermal synthesis resulted in sodium niobate; second was ionic exchange (in two concentrations of 2 M and 0.1 M HNO3), where the protonic niobate was obtained. The resulting protonic niobate was characterized by FEG-SEM, the results demonstrated that the morphology of the oxide was concentration-dependent in the ionic exchange step, and EDS analysis was used to validate the procedure. Using DRX, Raman spectroscopy, and FTIR analysis, the transformation of sodium niobate to protonic niobate was evidenced. The electrochemical tests demonstrated that the protonic niobate presented pseudocapacitive behavior when employed as the cathode in 1 M H2SO4, and the ionic exchange in 2 M HNO3 promoted a better specific capacitance, reaching 119.8 mF·cm−2 at a 1 mA·cm−2 current density.

1. Introduction

The global energy demand has increased in line with technological advancements and population growth. A report by the International Energy Agency (IEA) demonstrated that, in the last year (2024), the energy demand growth was faster than the average annual increase, with a growth of 3.2% against 1.3% in 2023 [1]. In addition, the depletion of fossil fuels and the negative impact on the environment resulting from their use have motivated research and development on the production of energy from renewable sources, which usually requires the use of some type of electrical energy storage. Additionally, new generations of cell phones, computers, electronic devices, and hybrid and electric vehicles, among others, require increasingly powerful energy storage devices with greater storage capacity. Thus, novel energy storage technologies and advanced materials have been explored in order to meet the worldwide energy demand [2].
Niobium-containing oxides have been proposed for several energy storage applications, such as batteries and electrochemical capacitors (pseudocapacitors) [3,4,5,6,7]. These materials stand out mainly due to their favorable electrochemical properties, such as fast surface oxidation–reduction reactions and/or ion intercalation and deintercalation processes [8,9]. Additionally, niobium oxides are considered bifunctional materials, since these oxides can be employed as cathodes or anodes [9,10]. Several niobium-based oxide compositions have been investigated for these applications, with emphasis on niobium pentoxide [4,11] and titanium niobium oxides (TNOs) [12,13]. When these niobium oxides are used as the active material in electrochemical capacitors, mainly as anodes, organic electrolytes are usually used [7,14,15], which have a larger operational window than aqueous electrolytes (approximately 2.5 V versus 1 V). However, in this same comparison, organic electrolytes present some disadvantages such as lower specific capacitance, lower electrical conductivity, higher cost, and greater operational risk [16,17].
The use of metal oxides as active materials in the construction of electrodes in devices that use aqueous electrolytes may allow their application beyond the limit of the water decomposition potential window, as demonstrated for RuO2, Fe2O3, and MnO2 [18]. Upadhyay et al. [9] reported the application of niobium pentoxide (Nb2O5) as the negative electrode of an electrochemical capacitor in a neutral aqueous electrolyte (1 M Na2SO4), with a robust explanation of the redox and intercalation mechanisms involved. The material proposed by the authors showed good energy storage capacity in terms of specific capacitance (approximately 100 mF·cm−2). Furthermore, the study revealed the possibility of using this oxide in a large negative potential window, overcoming one of the main disadvantages of using an aqueous electrolyte, which is the limited operational voltage window.
In our previous work [19], it was demonstrated that when sodium niobate Na2Nb2O6·H2O was subjected to an ion exchange procedure in an acidic medium (2 M HNO3), the resulting material presented electrochemical properties quite different from those of its original counterpart; in other words, the resulting protonic niobate (H3O)2Nb2O6·H2O had a considerably stronger sodium ion intercalation capacity. The present article provides a follow-up to our previous work, and the first objective was to investigate the effect of the ion exchange step with a lower concentration of nitric acid on the structural, morphological, and elemental properties of the oxide. Then, an in-depth investigation of the pseudocapacitive properties of the resultant protonic niobates in different aqueous electrolytes (1 M Na2SO4 and 1 M H2SO4) was conducted in order to verify the influence of the ion size on the intercalation capacity of the oxide structure.

2. Materials and Methods
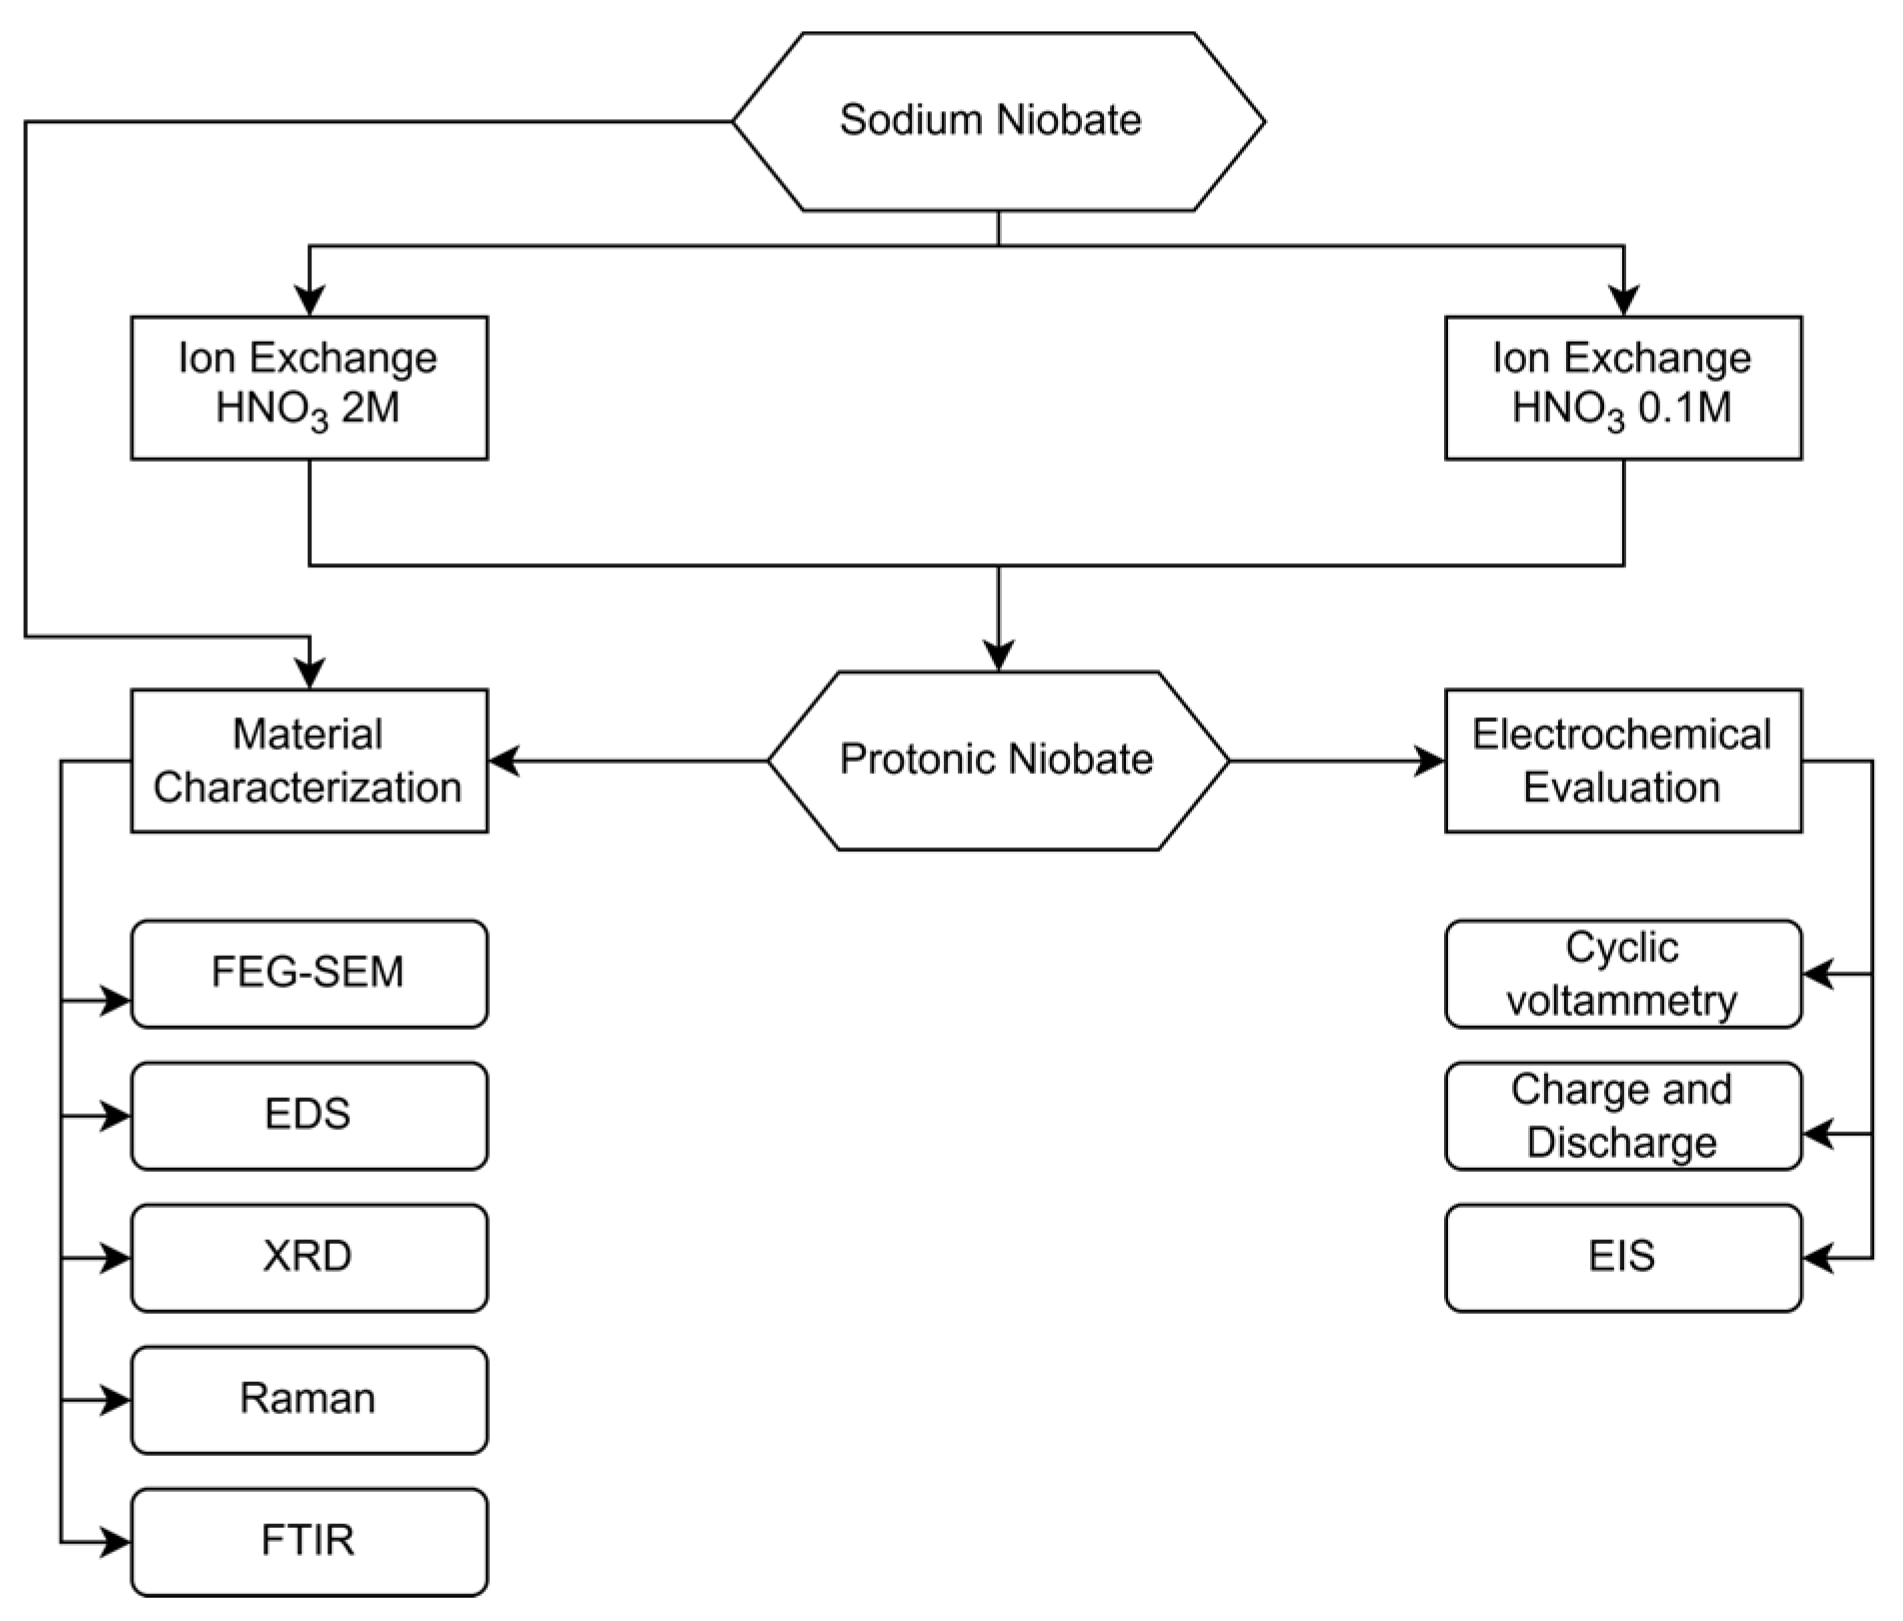
Figure 1 presents a flowchart of the experimental methods and the characterizations carried out for the niobate nanowire samples obtained in this work.

2.1. Synthesis

Sodium niobate nanowires samples were obtained by hydrothermal synthesis, according to the methodology described in a previous work [19]. In summary, four niobium sheets (98.9% w/w, Companhia Brasileira de Metalurgia e Mineração (CBMM), Araxá, Brazil), previously prepared (sanding and cleaning) with dimensions of 1.5 cm × 1.5 cm and a thickness of 0.2 cm, were subjected to hydrothermal synthesis in 1 M NaOH aqueous solution carried out at 50 °C for 10 h in an autoclave reactor. From this procedure, hydrated sodium niobate (Na2Nb2O6·H2O) was obtained [19].
To evaluate the effects of the ion exchange reaction of sodium niobate in nitric acid, sodium niobate samples were immersed in nitric acid solution HNO3 at different concentrations (2 M and 0.1 M) for 24 h at room temperature. Finally, the samples were washed with ultrapure water until the solution reached pH 5.0.

2.2. X-Ray Diffraction (XRD)

The structural characterization was performed by X-ray diffraction (XRD) at the Laboratório de Conformação Nanométrica (LCN) of the Institute of Physics (IF) of the Federal University of Rio Grande do Sul (UFRGS), with a Bruker D8 Advance diffractometer (Bruker, Billerica, MA, USA). The analysis employed CuKα radiation (λ = 1.5418 Å) in the Bragg–Brentano configuration, covering a 2θ range of 5° to 80°, in 0.02° increments with a step time of 384 s (2 s × 192 channels). XRD analyses were conducted to examine the crystalline structure of the oxides obtained from each procedure.

2.3. Raman Spectroscopy

Raman spectroscopy was utilized for the characterization of the niobium-containing oxides. This was performed with a Horiba LabRamHr Evolution spectrometer (Horiba, Kyoto, Japan) at the Laboratório de Altas Pressões e Materiais Avançados (LAPMA) of the Physics Institute (IF) of the Federal University of Rio Grande do Sul (UFRGS). A HeNe laser with λ = 632.8 nm was utilized for the characterizations, which were performed in the 242–1486 cm−1 range.

2.4. Attenuated Total Reflectance Fourier-Transform Infrared Spectroscopy (ATR-FTIR) Analysis

The synthesized materials were characterized by ATR-FTIR. The spectra were obtained using a BRUKER Alpha ATR-FTIR spectrometer (Bruker, Billerica, MA, USA) with a diamond window in absorption mode. The spectral resolution was 4 cm−1, with a total of 128 scans acquired.

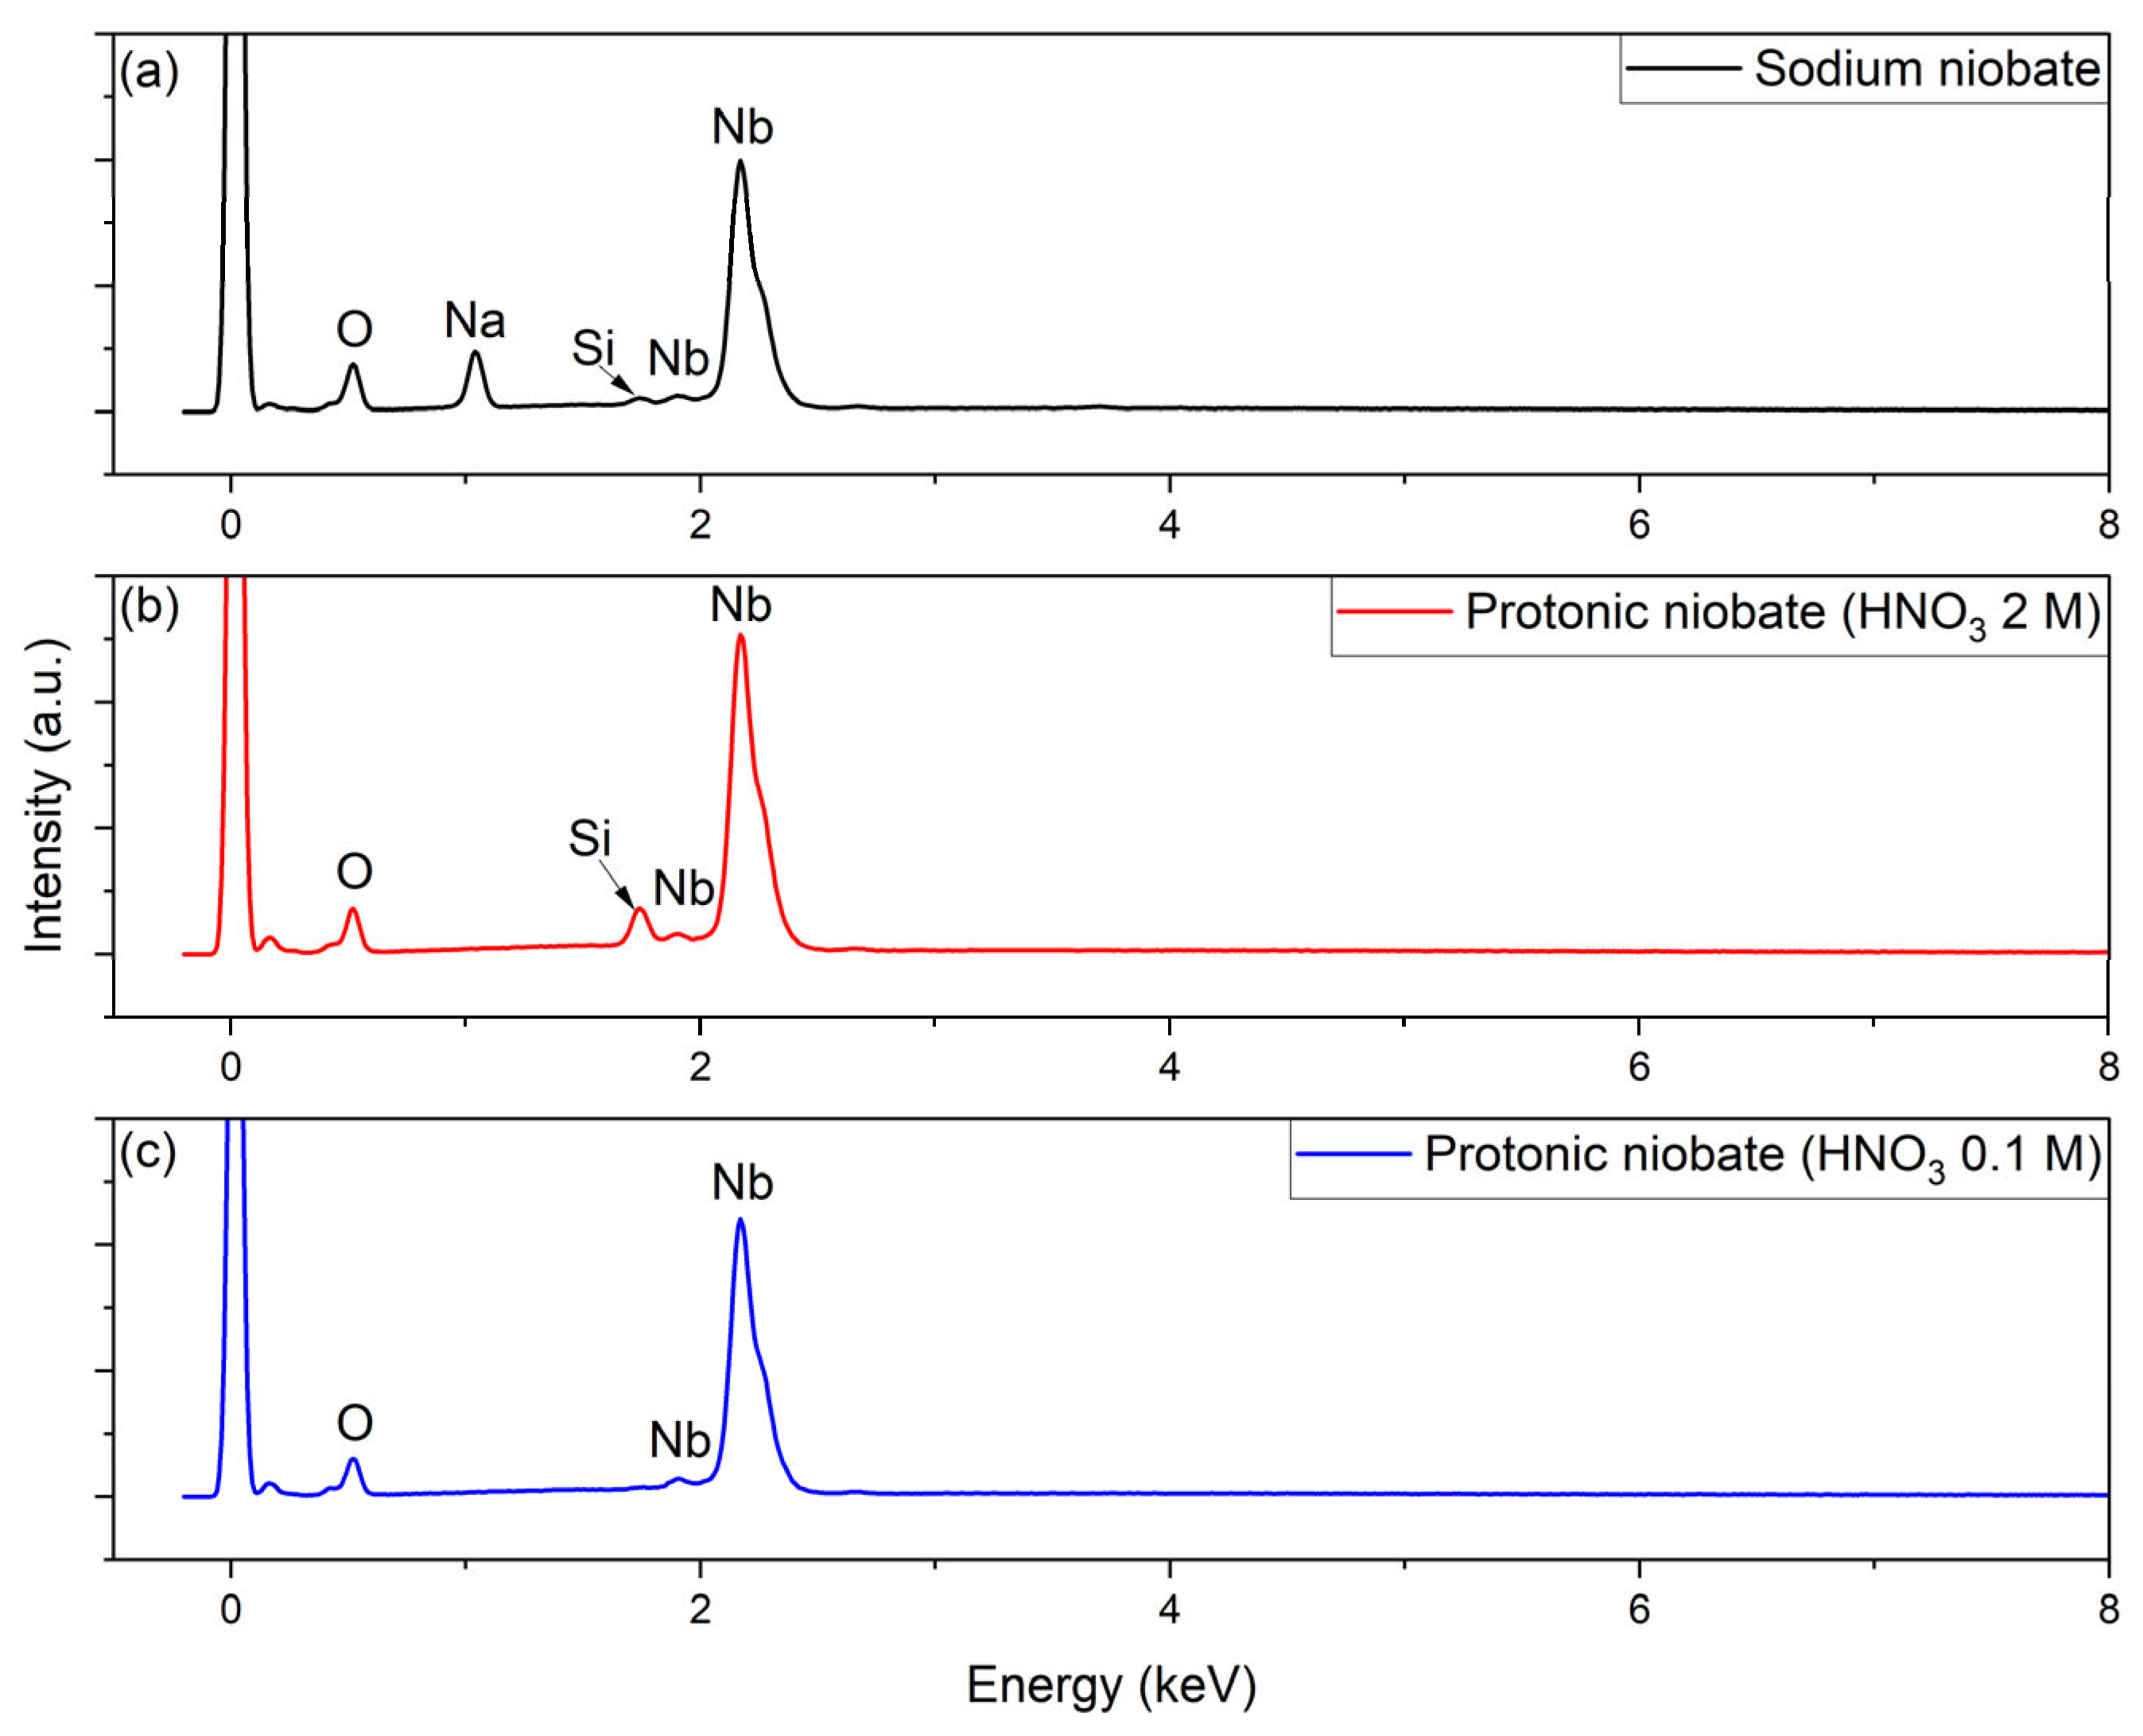
2.5. Morphological Characterization

The morphology was characterized by field-emission scanning electron microscope (FEG-SEM) in a ZEISS EVO LS-10 (ZEISS, Oberkochen, Germany) operating at 20 kV. Additionally, the equipment was used to conduct elemental analysis dispersion spectroscopy (EDX), and the images were treated with ImageJ 1.51e software.

2.6. Electrochemical Evaluation

The electrochemical characterizations were conducted in a three-electrode cell composed of a silver/silver chloride (Ag/AgCl (3.5 M KCl)) reference electrode, a platinum plate as the counter electrode, and the protonic niobate samples supported on a Nb sheet as the working electrode. An Autolab PGSTAT302N potentiostat/galvanostat was used to perform the tests, with data acquisition by Nova 2.1.4 software (both from Metrohm, Herisau, Switzerland).
First, the influence of the electrolyte was evaluated. For this purpose, two aqueous electrolytes were used: 1 M sodium sulfate Na2SO4 (Merck, Darmstadt, Germany) and 1 M sulfuric acid H2SO4 (Merck, Darmstadt, Germany). Protonic niobate electrodes were tested as cathodes, as proposed by Upadhyay et al. [9] and Santos et al. [19]. In our previous work, it was demonstrated that for protonic niobate, the suitable potential window for 1 M Na2SO4 electrolyte is 0 to −1.2 V (versus Ag/AgCl) [19]. To verify the operational potential window (maximum potential where hydrogen evolution does not occur) of the protonic niobates in 1 M H2SO4, potentiodynamic cyclic voltammetry tests were performed at a 50 mV·s−1 scan rate in increments in the potential window in the cathodic direction. Three scans were performed for each condition, and the third scan is shown in the results. Then, for both electrolytes, cyclic voltammetry tests were performed with 50 scan cycles in the useful potential window at a 50 mV·s−1 scan rate to verify the reversibility of the electrochemical phenomena resulting from polarization.
The systems that presented the best performance in terms of current density response in the potentiodynamic cyclic voltammetry tests were subjected to galvanostatic charge and discharge (GCD) tests to determine the capacitance, which was calculated according to Equation (1) [9]. In the samples where this value was significant, tests were performed at different current densities (from 1 to 10 mA·cm−2). Then, a current density was selected, and successive charge and discharge cycles were performed to evaluate the reversibility of the protonic niobate.
C S = j · t V
where CS is the specific capacitance (mF·cm−2), j is the current density (mA·cm−2), t is the discharge time (s), and V is the operational window (V).
Lastly, electrochemical impedance spectroscopy (EIS) measurements were conducted in the frequency range of 105 Hz to 10−2 Hz using 10 mV sinusoidal perturbation.

3. Results and Discussion

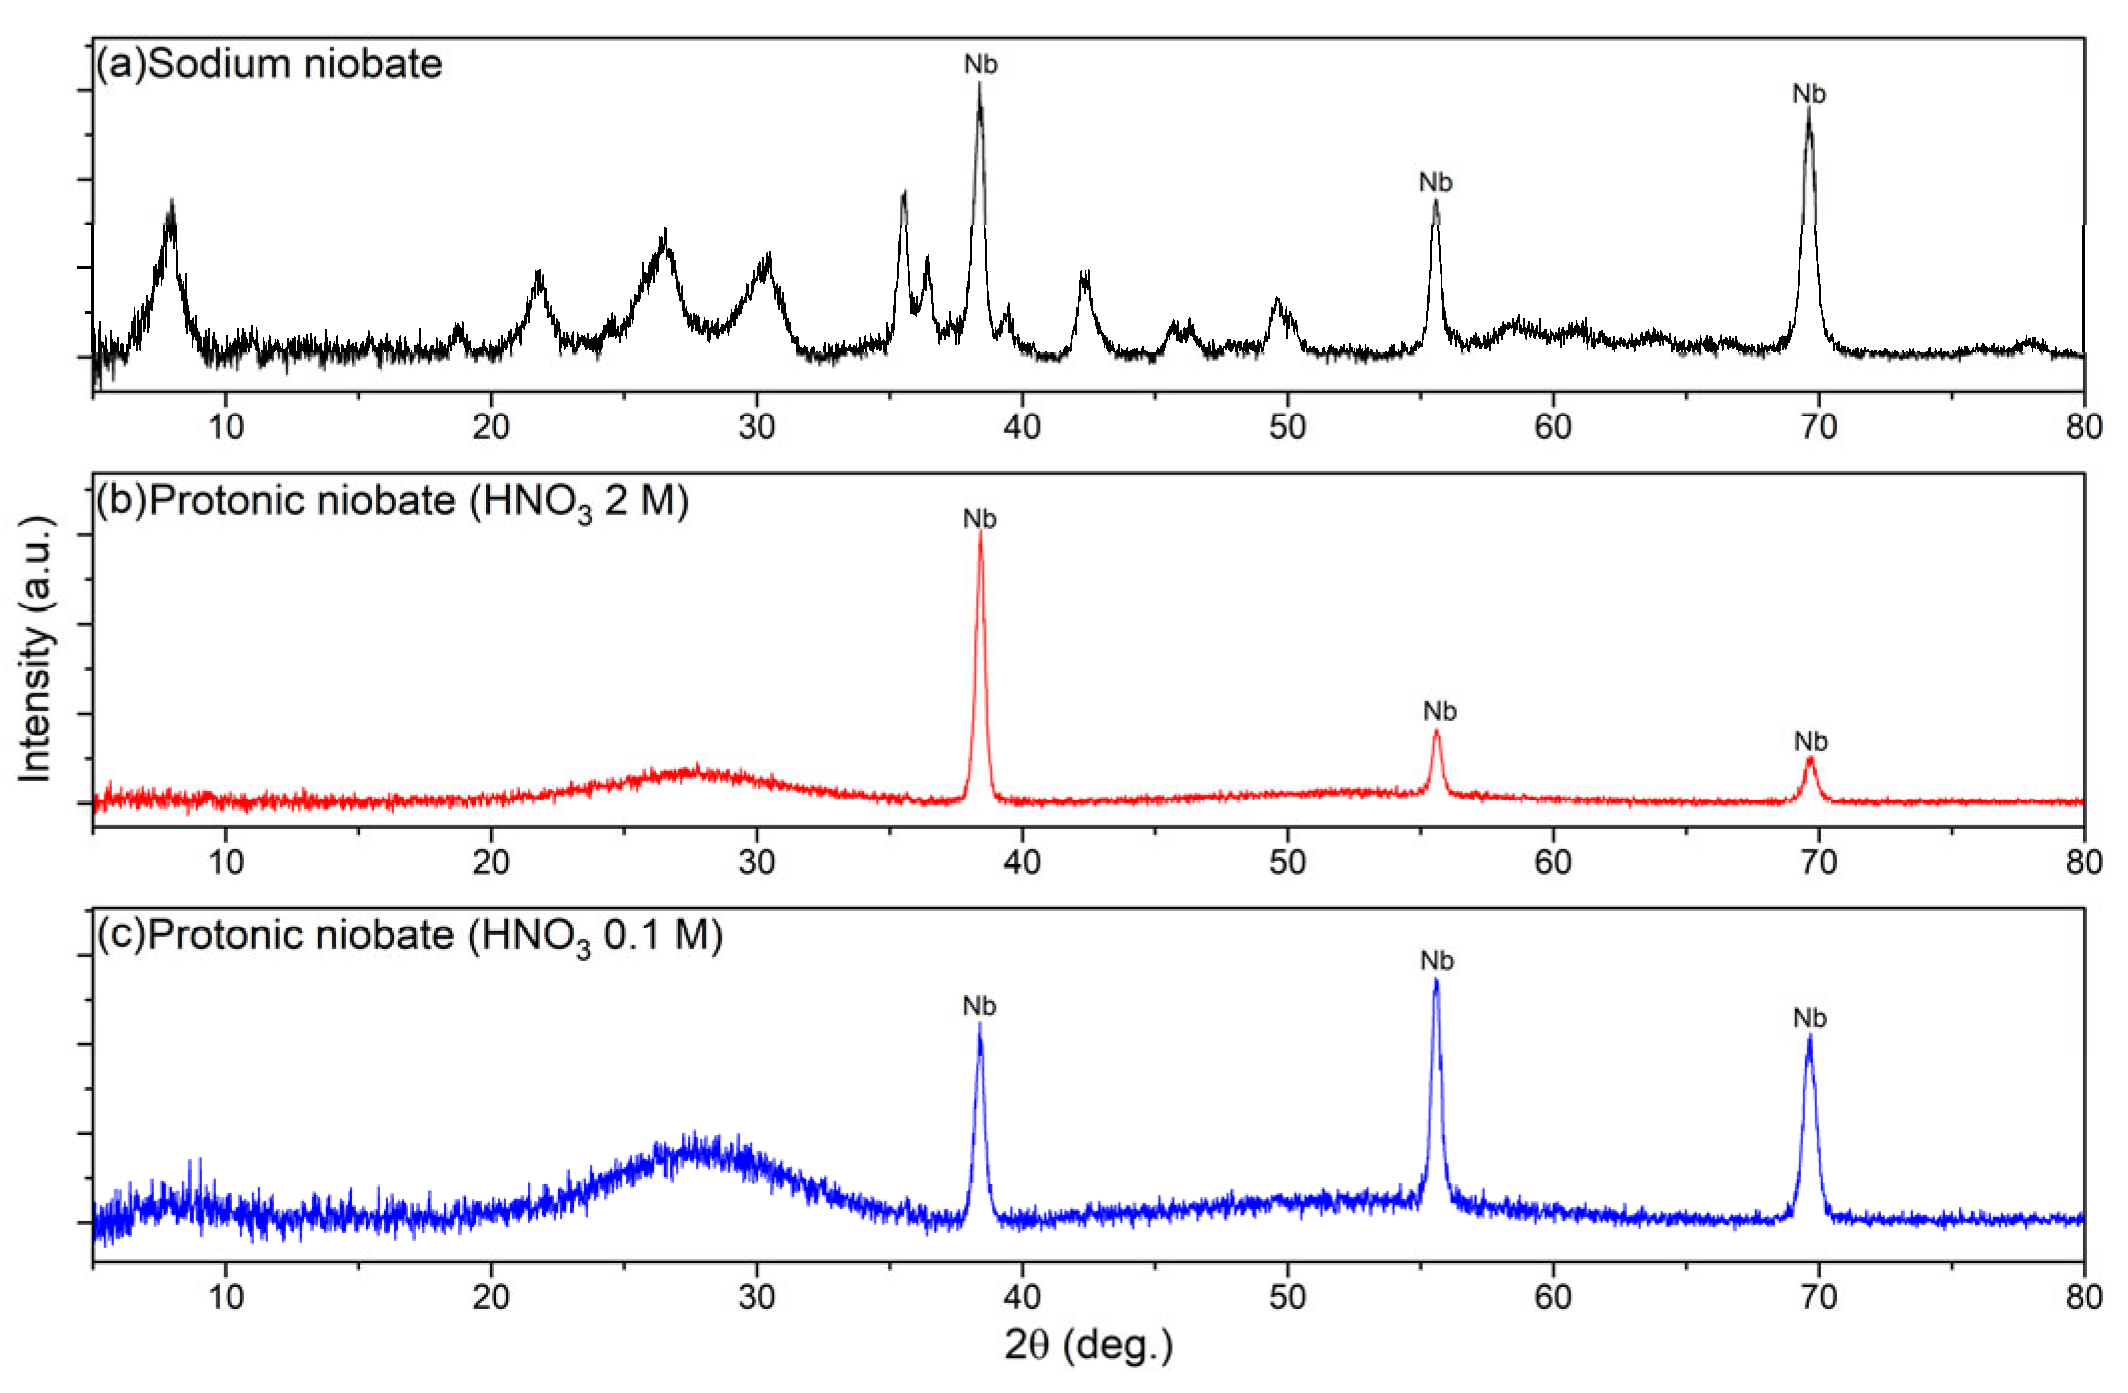
3.1. X-Ray Diffraction (XRD)

Figure 2 presents the XRD results of the samples obtained after hydrothermal synthesis and after the ion exchange procedure with 2 M and 0.1 M HNO3. Spectrum (a) corresponds to the sample obtained right after hydrothermal synthesis, and, as reported in the literature [19], it exhibits the characteristic diffractogram of hydrated sodium niobate Na2Nb2O6·H2O. This material consists of irregular NaO6 and NbO6 octahedra, with residual sodium (Na) ions distributed along the (010) plane [19]. Additionally, the peaks at 38.4° (110), 55.6° (200), and 69.6° (211), present in all diffractograms, can be attributed to metallic niobium substrate, consistent with previous studies [20]. The crystallite size of sodium niobate nanowires was estimated using the Scherrer Equation (2):
D = K · λ β · c o s θ
In Equation (2), D represents the crystallite size, K is the shape factor (taken as 0.89), λ is the X-ray wavelength (1.5418 Å), β is the full width at half maximum (FWHM) in radians, and θ is the Bragg angle [21]. Based on the XRD peaks observed at 7.98°, 21.74°, and 26.36° in the sodium niobate diffractogram (spectrum (a)), the average crystallite size was calculated to be approximately 16.6 nm.
Figure 2b,c exhibits the XRD diffractograms of the samples obtained after the ion exchange procedure with 2 M and 0.1 M HNO3, respectively, which correspond to protonic niobate (H3O)2Nb2O6·H2O [19]. Despite the clear distinction that could be observed compared with sodium niobate (Figure 2a), no significant structural differences were noted between the samples treated with different nitric acid concentrations (2 M and 0.1 M). The absence of well-defined peaks after immersion in HNO3 at both concentrations suggested that the treatment led to the collapse of the crystalline structure. The undulation between 25° and 30° of the protonic niobate samples indicated the presence of a fraction of crystalline material coexisting with a largely disordered phase, which could have led to the merging or broadening of the original peaks, resulting in the observed diffraction profile.
Regarding the relative intensities of the major peaks in Figure 2a–c, which correspond to the metallic Nb substrate, noticeable differences can be observed. In Figure 2a, the most intense peak is located at 38.4° (110), whereas in Figure 2c, the peak at 55.6° (200) is more prominent. However, the overall variations in the relative intensities of the metallic Nb substrate peaks in Figure 2a,c are relatively small compared to the significant differences observed in Figure 2b. In contrast to the other samples, protonic niobate treated with 2 M HNO3 (Figure 2b) exhibited a relative peak intensity distribution that closely resembled that of pure metallic Nb (without coating). A similar intensity profile has been reported in the literature for amorphous Nb oxide films deposited on Nb substrates [20], suggesting that the sample treated with 2 M HNO3 contained a higher fraction of amorphous material compared to the one treated with 0.1 M. The structural differences may have resulted from faster ion exchange kinetics at the higher HNO3 concentration, where the abrupt Na+ substitution by H3O+ could have caused crystal structure collapse.

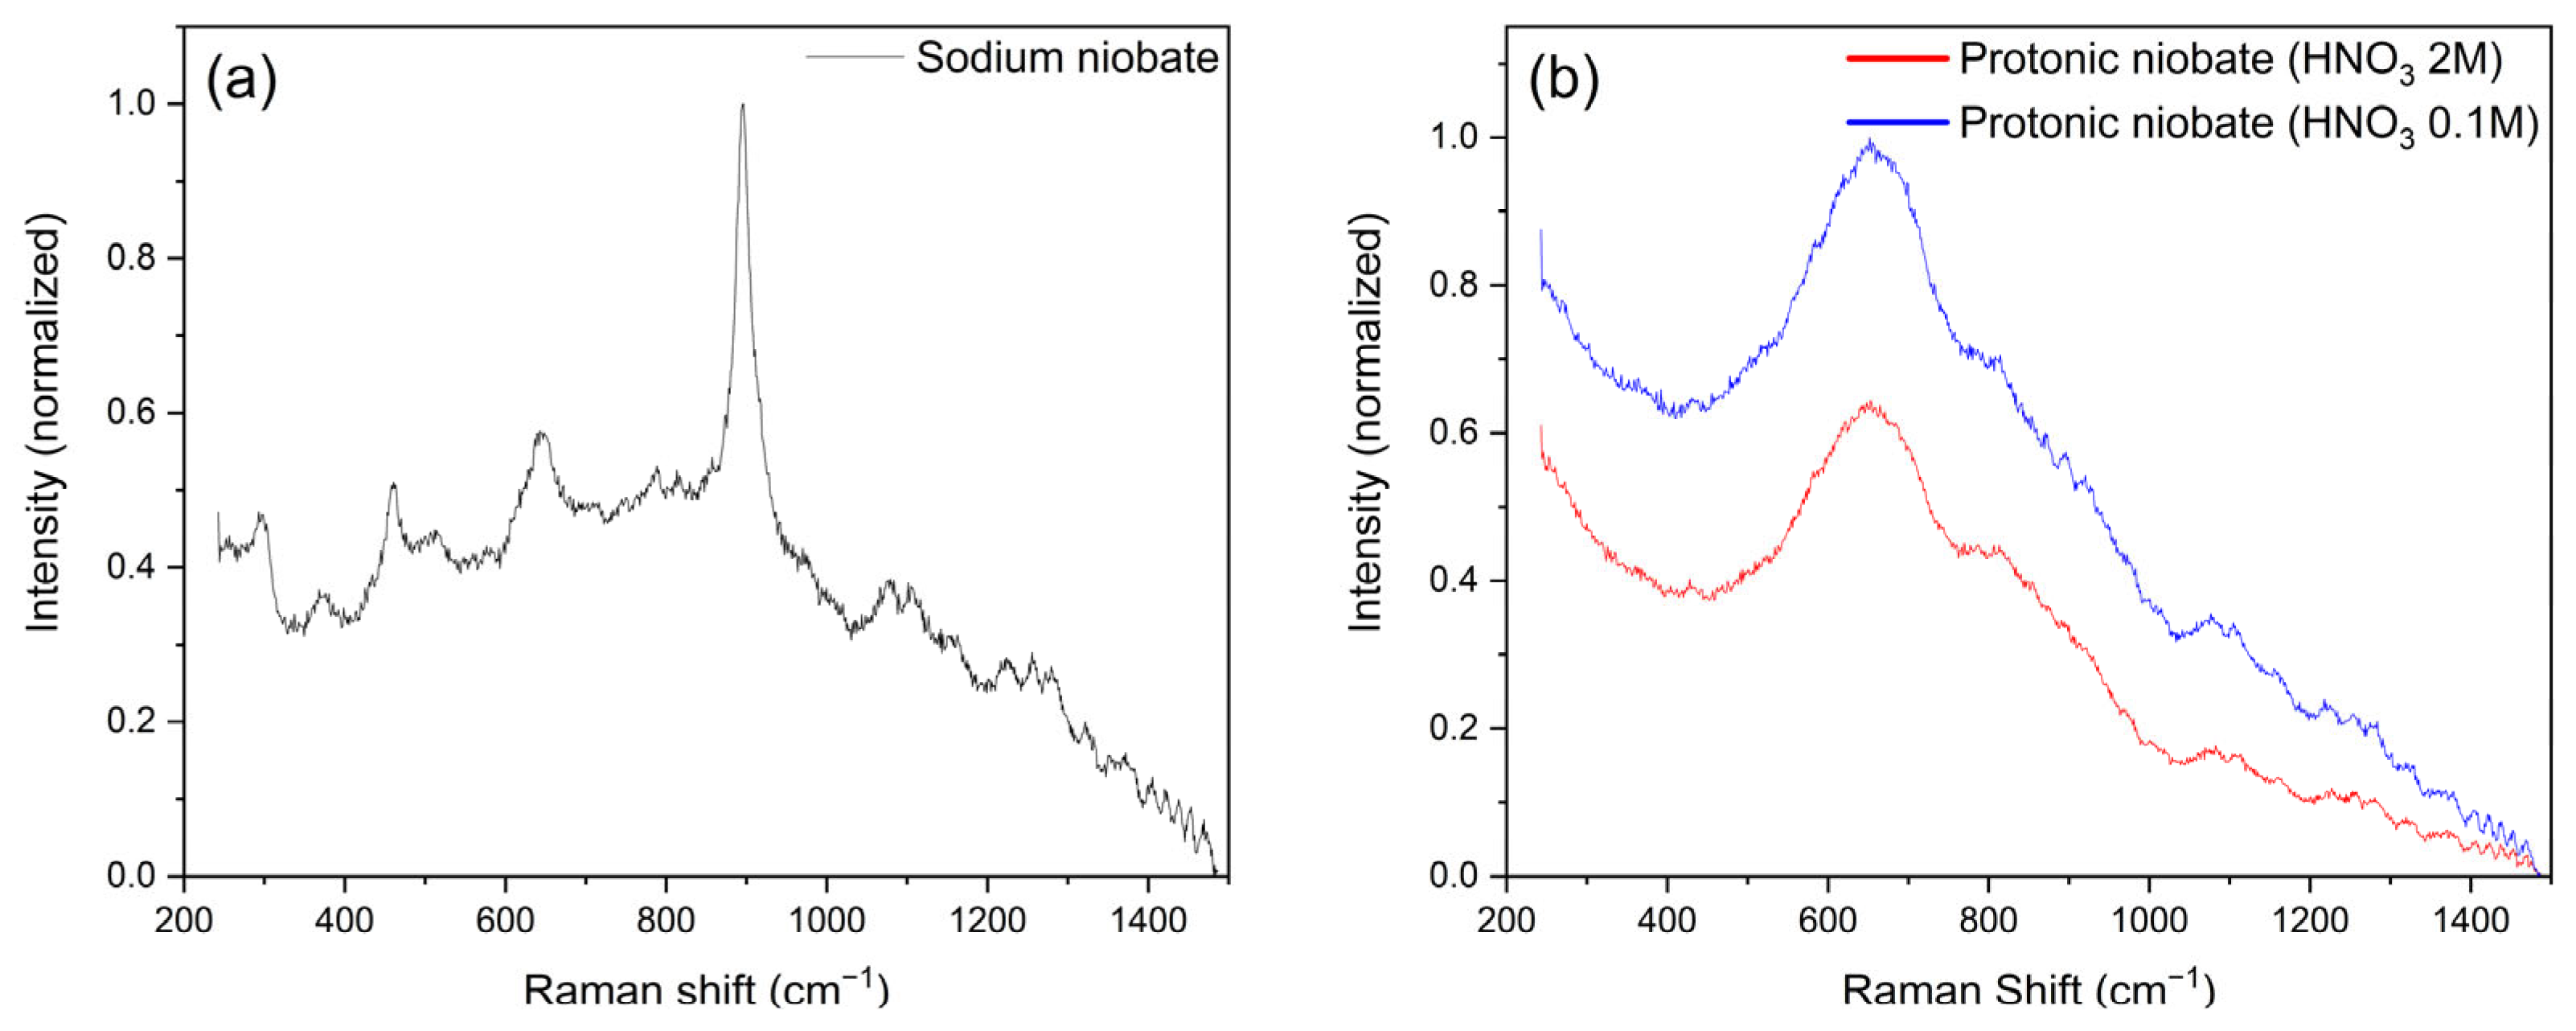
3.2. Raman Spectroscopy

Figure 3 presents the results of Raman spectroscopy. The peaks with wavenumbers less than 500 cm−1 (Figure 3a) may have been associated with Na–O bonds [22]. The most intense peak at 896 cm−1 was likely related to the stretching vibrations of Nb–O bonds inside the NbO6 octahedra [19,23]. The peaks related to water (H–O) bonds were probably absent in this range of wavenumbers due to the weak Raman scattering properties of water [19].
The ion exchange procedure promoted an obvious transformation in the structure of the oxide from many sharp peaks to one notable and broad peak. Despite the differences between the Raman spectra before and after ionic exchange (Figure 3a,b) being expected [24], such changes are unprecedented and imply great differences in the vibrational modes of the material. The peak wavenumbers in both Raman spectra in Figure 3b are almost equal, indicating the same vibrational modes, probably the result of the same crystal structure. There was, however, a noticeable 64.4% decrease in the peak intensity (from 1 in the 0.1 M sample to 0.644 in the 2 M sample, normalized according to the most intense 652 cm−1 peak), which suggested that the sample that underwent ionic exchange in 2 M HNO3 had a lesser volume fraction of crystalline material, with a more distorted lattice [25,26], probably due to the more intense proton exchange during the treatment. These results are in agreement with the results obtained in the XRD diffractograms (Figure 2).

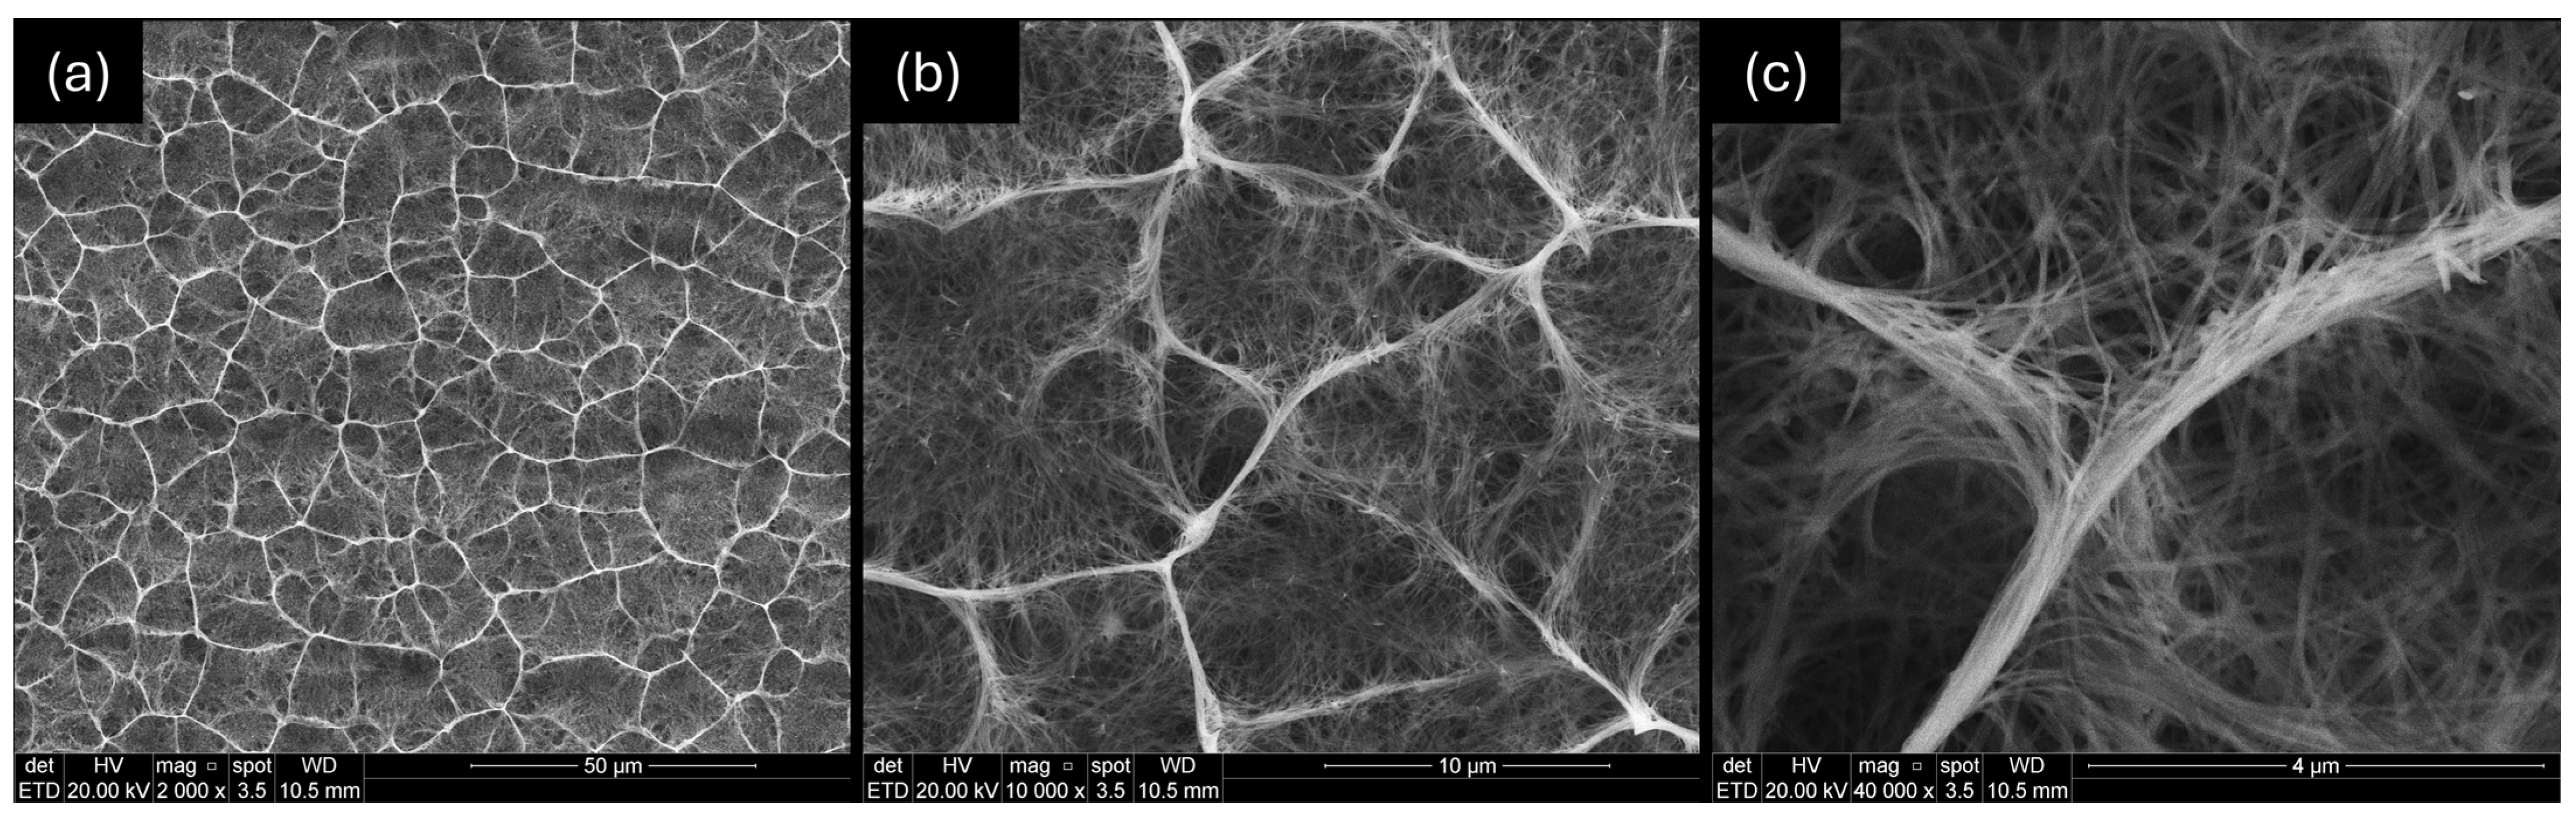
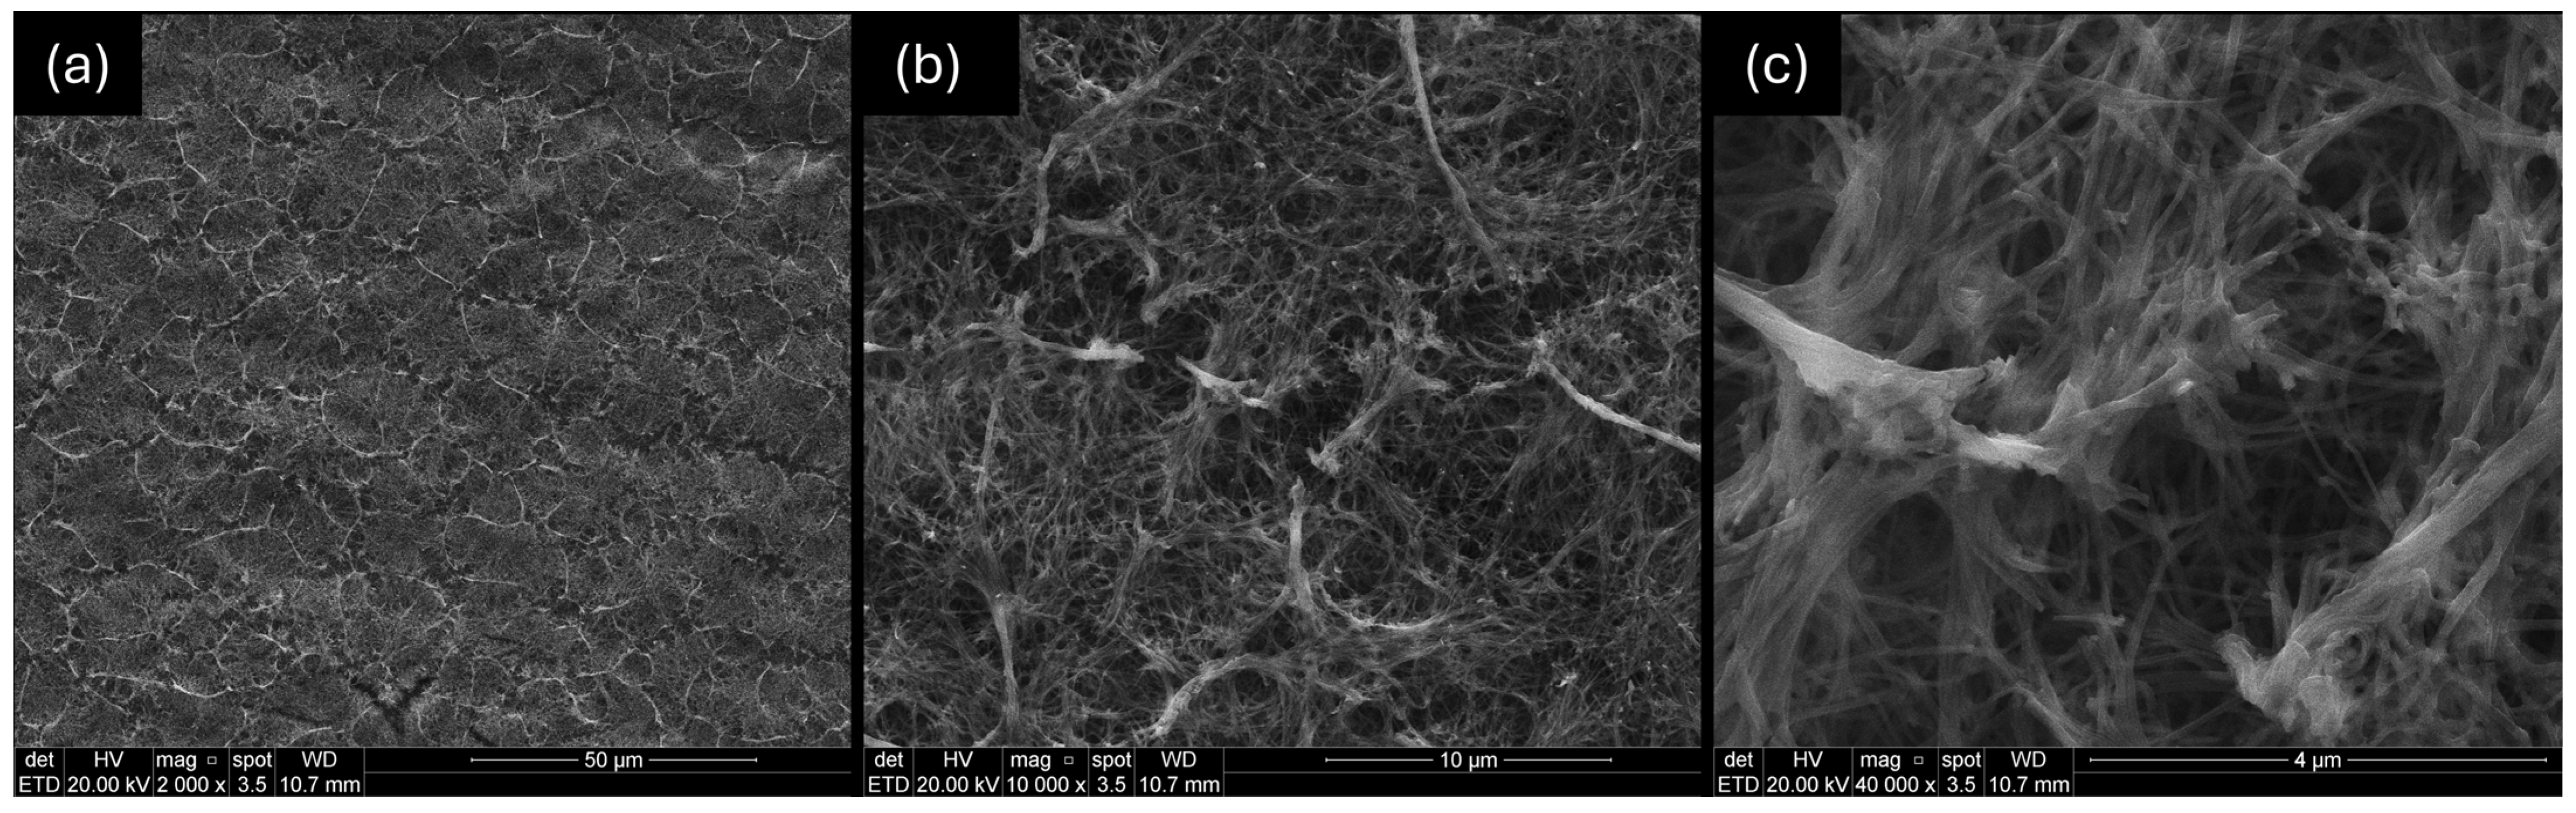
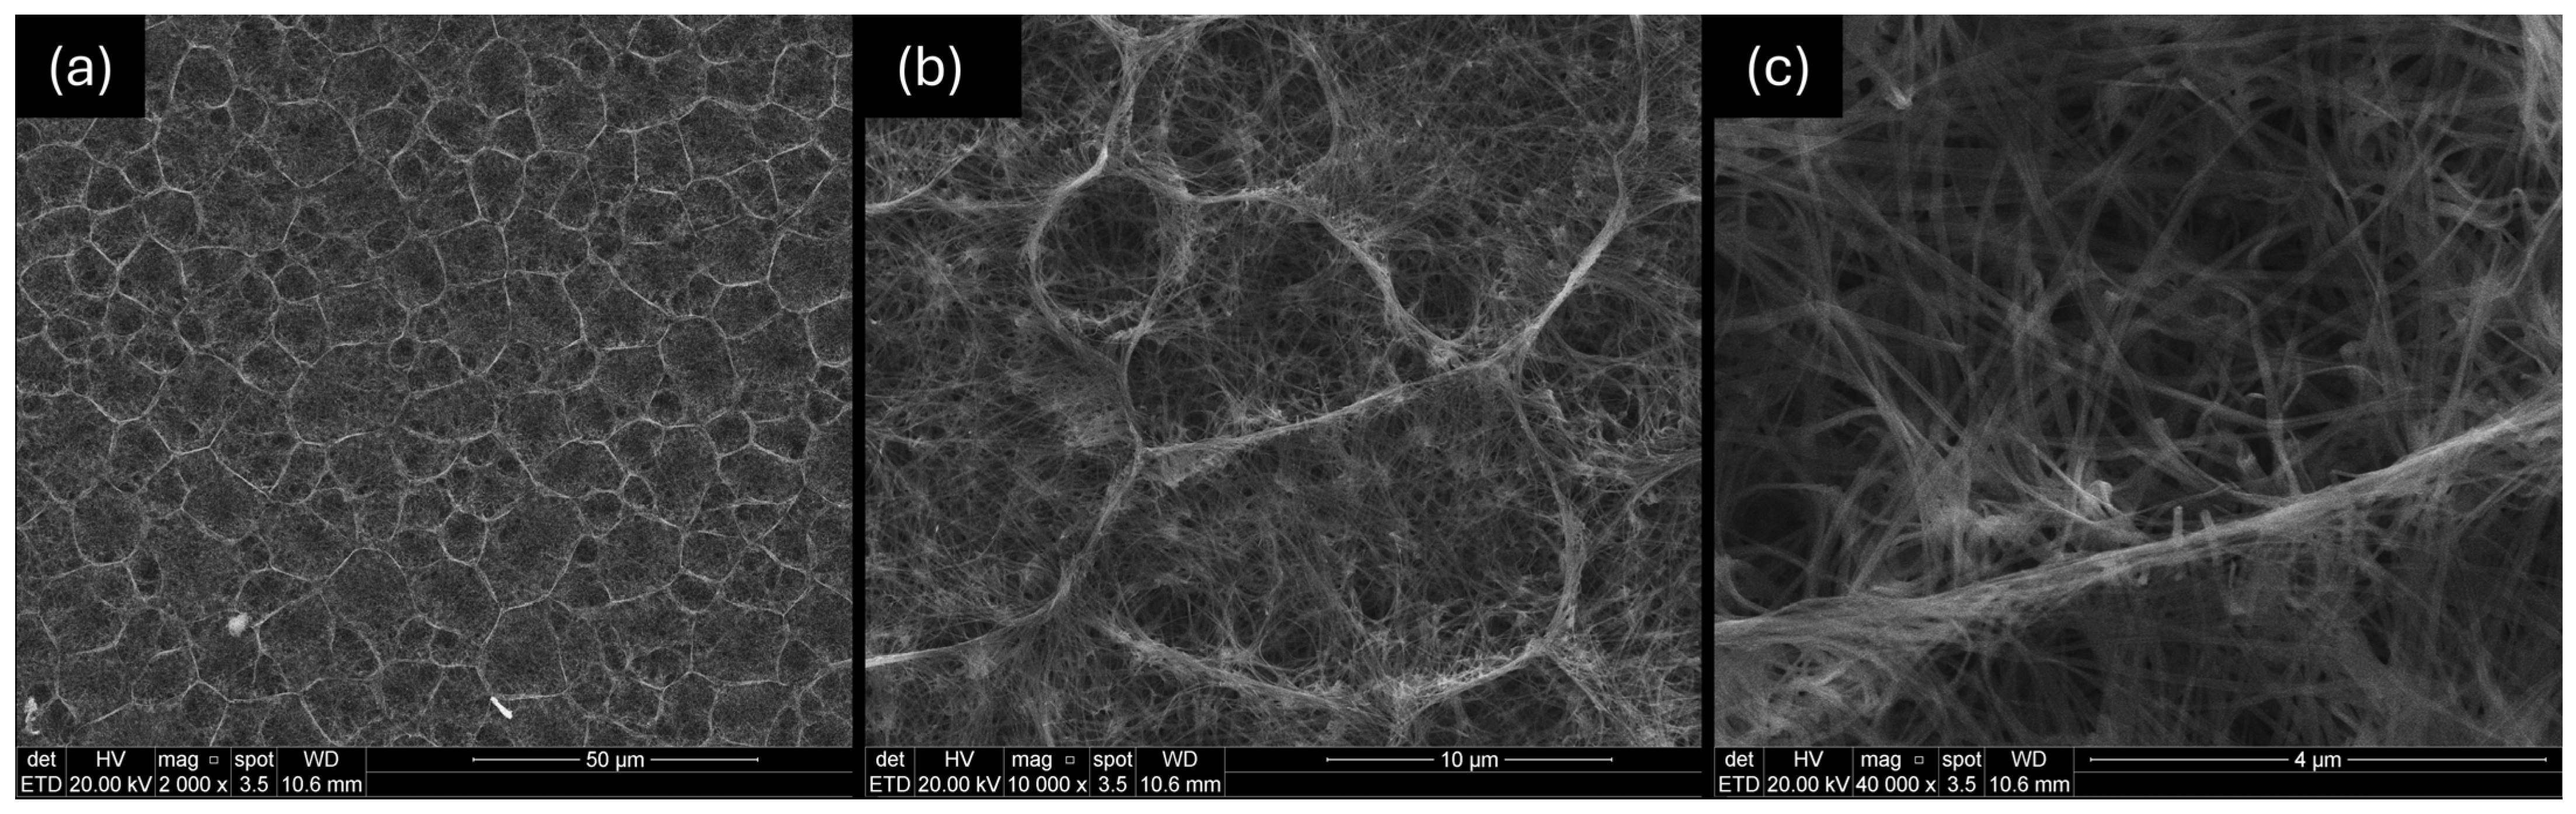
3.3. Morphological Characterization

The influence of the ionic exchange procedure with HNO3 on the morphological structure was observed by FEG-SEM. As can be seen in Figure 4, the sodium niobate sample had a micrometric hive shape with nanowire formation (with a thickness of 63.87 ± 7.2 nm). After the treatment with 2 M HNO3, it is possible to observe in Figure 5 that it caused significantly destroyed the morphology, in which there was a collapse of the micrometric structures and the rupture of the nanowires, combined with a significant increase in its thickness (88.36 ± 8.8 nm). Both findings are in agreement with the previous results obtained [19,27]. However, after the treatment with 0.1 M HNO3, it was possible to observe a negligible change in the morphology, which maintained the formed micrometric hives, and the nanowires were slightly thicker than the sodium niobate sample (thickness of 70.01 ± 5.9 nm), as can be seen in Figure 6.
Despite the slight differences between the protonic niobate samples that were discussed in the previous characterizations and the large differences when these protonic niobates were compared to the sodium niobate sample, the FEG-SEM images (Figure 5 and Figure 6) indicate that, after the ionic exchange, there was concentration-dependent morphological stability, since treatment with 0.1 M HNO3 produced negligible changes, whereas the treatment with 2 M HNO3 caused the partial destruction of the structure. This difference in morphological structure stability could have been caused by the different kinetics of the ion exchange process, which occurred faster in higher concentrations of HNO3. The abrupt exchange of Na+ for H3O+ could have led to a structural collapse.
The EDS analysis of protonic niobate showed the absence of a sodium peak, as can be seen in Figure 7, which suggested that the complete ion exchange of Na+ for H3O+ in sodium niobate samples with HNO3 2 M and 0.1 M was successfully obtained, and the chemical formula (H3O)2Nb2O6·H2O could be attributed to both protonic niobates. It is worth highlighting that the treatment with HNO3 0.1 M maintained the morphology, suggesting that the ion exchange was less abrupt and had less of an impact on the structure; nonetheless, it preserved the ion exchange efficiency.

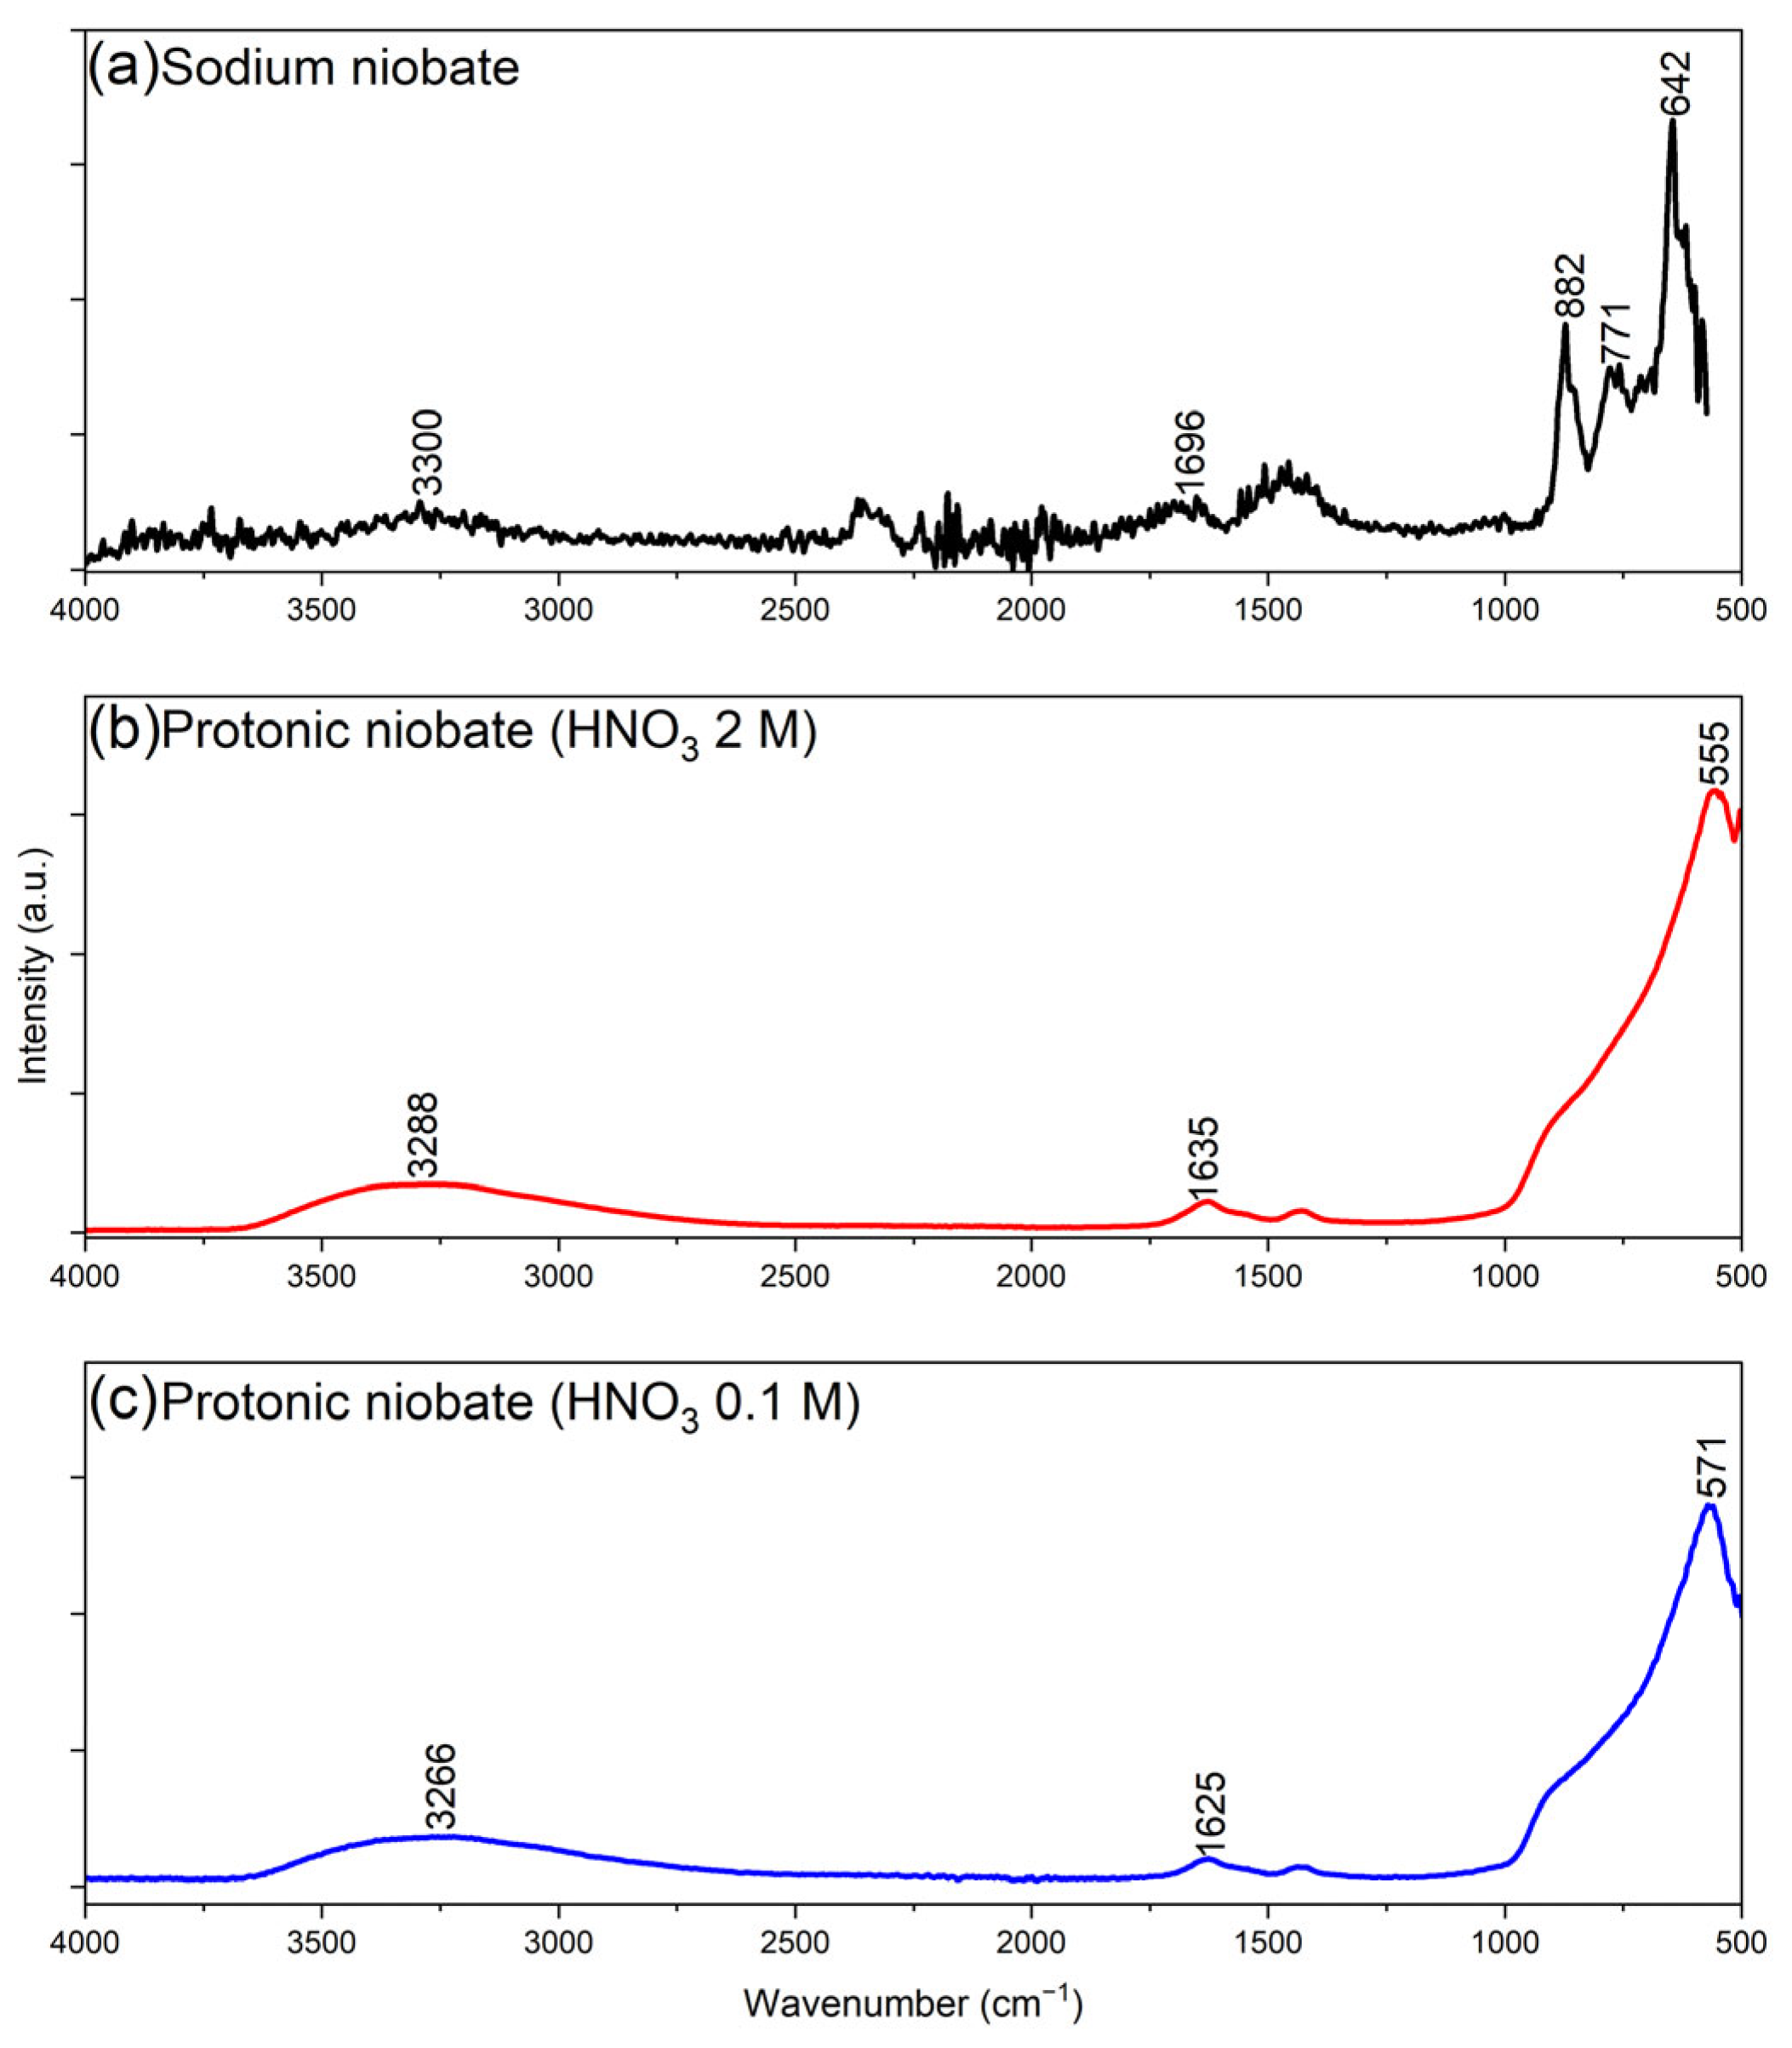
3.4. Fourier-Transform Infrared Spectroscopy (FTIR)

The sodium niobate obtained by hydrothermal synthesis was characterized by ATR-FTIR. In the spectrum in Figure 8a, the peaks at 3300 cm−1 and 1696 cm−1 are associated with OH-stretching vibration mode and the bending mode of the water present in the sample [28,29]. The peaks observed at 882, 771, and 642 cm−1 were consistent with those reported in the study by Xingfu et al. [29], which indicated that they correspond to the vibrational modes of the sodium niobate structure, such as Nb–O stretching and Nb–O–Nb bending. According to Orel et al. [30], who performed an FTIR spectrum analysis of niobium pentoxide (Nb2O5), peaks in the 910–850 cm−1 range are linked to the vibration of terminal Nb=O bonds, Nb–O–Nb bridging vibrations are observed in the 850–580 cm−1 range, and Nb3–O bonds appear between 500 and 380 cm−1. Based on this, it could be inferred that the peak at 882 cm−1 corresponded to the vibration of terminal Nb=O bonds in the material, while the peaks at 771 cm−1 and 642 cm−1 were related to Nb–O–Nb bridging vibrations.
The spectra of niobate after ion exchange in 2 M HNO3 solution (Figure 8b) and 0.1 M HNO3 solution (Figure 8c) revealed significant changes in the vibrational profile of the material’s structure. In both spectra, the presence of water was observed, with peaks at 3266 cm−1 and 1625 cm−1 for the 0.1 M sample and at 3288 cm−1 and 1635 cm−1 for the 2 M sample. Both samples displayed the same vibration profile in the oxygen–niobium bonding region, with shoulders around 900 cm−1 and less-defined peaks between 571 and 555 cm−1. Compared to the original sodium niobate, the vibrations that were previously more energetic and well defined were replaced by less-defined, lower-energy peaks, with a reduction in the previously existing vibrational modes.
In the study by Hossain and Ahmed (2023) [31], the relationship between the FTIR peak characteristics and the crystallinity of hydroxyapatites was examined, showing that crystalline structures tended to exhibit more intense and defined peaks compared to amorphous systems. Similarly, Tossici et al. (1992) [32] found that lithium intercalation in a crystalline Li1+x V3O8 structure led to material amorphization, resulting in less-defined transmission peaks. Based on this, it is possible that the transformation observed in the sodium niobate spectrum, due to hydronium intercalation, induced a loss of crystallinity in the material.
Another important aspect to consider is the modification or emergence of a peak at lower wavenumbers with distinct values. According to Equation (3), the wavenumber (ν) of a peak in the infrared spectrum is directly proportional to the bond force constant (k) and inversely proportional to the reduced mass (µ) of the bonded atoms [33]. The prominent peak in the spectra of the materials having a similar shape before and after ion exchange suggested that the same types of bonds were present, meaning the reduced mass remained unchanged. Since the peak for the sample produced in 2 M HNO3 appeared at a lower wavenumber, this indicated a reduction in the material’s chemical bond strength compared to the sample produced in 0.1 M HNO3 solution (94.5% of k 0.1 M). The mathematical derivation is included in the Supplementary Information (SI).
ν = 1 2 π k μ

3.5. Electrochemical Evaluation

This part of this work evaluated the pseudocapacitive behavior of protonic niobates in different aqueous electrolytes (neutral and acidic media). At this point, it is worth highlighting that protonic niobates may present reversible ion exchange behavior [34]; in other words, if these materials are placed in alkaline solutions, they tend to perform a reverse ion exchange, which results in the instability of the material in these media. Thus, the protonic niobates were tested only in neutral and acidic media. The operational potential window for protonic niobate (2 M HNO3) in 1 M Na2SO4 as the electrolyte was determined in our previous work [19] (0 to −1.2 V (versus Ag/AgCl)).
Figure 9 presents the cyclic voltammetry results of protonic niobate (HNO3 2 M) in 1 M H2SO4 as the electrolyte for different potential windows. It was verified that slight hydrogen evolution began in the potential window from 0 V to −0.75 V. Thus, the potential window selected for this sample was 0 V to −0.7 V (vs. Ag/AgCl).
Figure 10 presents the cyclic voltammetry results of protonic niobate (2 MHNO3) in the operational potential window for Na2SO4 1 M and H2SO4 1 M electrolytes. The current density values found here are comparable to those presented by Upadhyay et al. [9], and the mechanisms that cause this electrochemical response of the protonic niobate can be attributed to the double electrochemical layer, the intercalation/deintercalation of ions, and fast surface redox reactions [9,19,20]. In addition, in Figure 10, it can be observed that the current density value in the 1 M H2SO4 electrolyte was higher than that in the 1 M Na2SO4 electrolyte, even with a smaller operating potential window. As intercalation/deintercalation depends on the ion size, the higher current density can be attributed to the intercalation of a larger amount of H+ ions (0.029 nm) compared to Na+ ions (0.095 nm) [31].
Regarding the response in acidic electrolytes, Gomes et al. [8] investigated the electrochemical behavior of niobium pentoxide (Nb2O5) in an acidic medium (0.2 M H2SO4). For this purpose, cyclic voltammetry tests were performed in the cathodic direction up to −1.45 V (versus Hg/Hg2SO4). According to the authors, during the scan, Nb5+ reduced to Nb4+, and simultaneously the intercalation of H+ ions occurred inside the oxide, which formed a bond with the O2− of the oxide; therefore, the electron injection and intercalation of the H+ ions occurred. Furthermore, the study reported a change in the color of the Nb2O5 oxide when polarized, changing from white to dark blue. The same behavior was found for the protonic niobate (2 M HNO3) when polarized in the cathodic direction, returning to its original white color when the polarization was reversed, as can be seen in Figure 11. This macroscopic similarity in the electrochemical behavior of Nb2O5 and the samples in the present work indicated that the reactions occurring in the protonic niobate samples were similar to those occurring in niobium pentoxide, despite the materials having different compositions and crystalline structures [6,27].
To verify the reversibility of the processes involved in the pseudocapacitive behavior of the protonic niobate, Figure 12 presents the results of the cyclic voltammetry tests with 50 scan cycles for the different electrolytes. From the results, it can be observed that the sample tested in the 1 M Na2SO4 electrolyte did not present suitable reversibility for application as an electrochemical capacitor electrode, since the loss of the current response was significant after only 50 cycles. On the other hand, the protonic niobate presented good reversibility in the 1 M H2SO4 electrolyte. Therefore, considering the current density response and the reversibility of the electrochemical reactions involved, the 1 M H2SO4 electrolyte proved to be more suitable for this application, so this electrolyte was used to determine the specific capacitance of the protonic niobates.
From the cyclic voltammetry results presented in Figure 9, it was found that the useful operational potential window ranged from −0.3 V to −0.7 V (versus Ag/AgCl) (ΔV = 0.4 V). Figure 13a,b present the results of the galvanostatic charge and discharge (GCD) tests of the protonic niobate samples subjected to ion exchange in different concentrations of nitric acid (2 M HNO3 and 0.1 M HNO3, respectively) in 1 M H2SO4 electrolyte. Figure 13c exhibits the results of the specific capacitance CS (mF·cm−2) calculated from Equation (1) for different current densities (j) (conservation rate), and Table 1 summarizes these results.
According to the results presented in Figure 13 and Table 1, the performance of the protonic niobate obtained with 2 M HNO3 was better than that of the sample obtained with 0.1 M HNO3. Despite the treatment with 0.1 M HNO3 maintaining the morphology of the sodium niobate, the better results obtained with the sample with 2 M HNO3 suggested that the more abrupt exchange of Na+ for H3O+ in 2 M HNO3 promoted increased distortion in the crystalline structure of the protonic niobate. This promoted greater interplanar spacing, which allowed more H+ ions to intercalate into the structure of the oxide, indicating that the structure was more important than the morphology for the specific capacitance of the evaluated system.
The specific capacitance achieved with protonic niobate obtained with 2 M HNO3 was better than that obtained by Upadhyay et al. [9], who achieved a specific capacitance of 100 mF·cm−2 for 1 mA·cm−2 and approximately 70 mF·cm−2 for 5 mA·cm−2. Even compared to other works that used niobium-containing materials and a M H2SO4 as the electrolyte, the results obtained in the present work are also better, since Gao et al. [35] obtained approximately 30 mF·cm−2 for 1 mA·cm−2 for a niobium nitride nanobelt array, and Pacheco et al. [20] achieved 103 mF·cm−2 for 1 mA·cm−2.
As shown in Figure 14, the protonic niobate sample obtained with 2 M HNO3 achieved excellent reversibility, maintaining the same specific capacitance after several consecutive cycles. However, this good retention of capacitance was only maintained up to approximately 350 cycles. After this number of charges and discharges, hydrogen evolution began, causing the sample to lose its ability to reach the predetermined potential value, until it completely lost this capacity.
A hypothesis for this behavior was a mechanism involving the “poisoning” of the oxide due to oxidation or incomplete deintercalation, which modified the structure of the oxide. Another possibility was the destabilization of the H3O and/or H2O molecules in the sample due to the applied potential. However, if one of these mechanisms was involved, the loss of specific capacitance retention should have occurred before or even after exceeding 300 cycles, and this loss should have been gradual and not abrupt, as occurred in the tests. Another hypothesis was that, with consecutive charge and discharge cycles, the electrolyte accessed the niobium metal substrate, which probably had different electrochemical behavior than the oxide, causing the reference potential involved in the test to shift and, consequently, hydrogen evolution to begin. The evaluated protonic niobate shows promise for application as a cathode in electrochemical capacitors due to a combination of attributes such as its nanometric morphology and especially the structural arrangement of the material, which allows energy to be stored due to the double electrochemical layer, surface oxidation–reduction reactions, and ion intercalation/deintercalation.
Finally, Figure 15 exhibits the Nyquist and Bode plots obtained through electrochemical impedance spectroscopy (EIS) of the protonic niobate sample (2 M HNO3) in 1 M H2SO4 electrolyte. A great difference can be observed in the EIS results obtained at the open circuit potential (OCP) compared to the measurements performed at −0.7 V versus Ag/AgCl. This behavior indicated that the material was excited to provide good conductivity, since the electrical resistivity at −0.7 V was some orders of magnitude lower than at the OCP, as can be seen in the Bode plot with the modulus of impedance (Z) (Figure 15b). These results are in agreement with the cyclic voltammetry results (Figure 9), where the protonic niobate presented a considerable current response only when polarized towards negative potentials.

4. Conclusions

In this work, protonic niobates nanowires were obtained through hydrothermal synthesis, followed by an ion exchange process in two different HNO3 concentrations (2 M and 0.1 M). These materials were applied as the cathode in electrochemical capacitors. From the achieved results, it was found that
  • Protonic niobates were successfully obtained by the ion exchange of Na+ for H3O+ from sodium niobate samples immersed in 2 M and 0.1 M HNO3.
  • The protonic niobate obtained with 2 M HNO3 had a higher fraction of amorphous material than the protonic niobate obtained with 0.1 M HNO3.
  • The resultant morphology of the ionic exchange treatment was concentration-dependent, since the treatment with 0.1 M HNO3 produced negligible changes in the oxide, whereas the treatment with 2 M HNO3 caused the partial collapse of the structure.
  • The ATR-FTIR results demonstrated that the protonic niobates exhibited less-defined and lower-energy peaks, with a reduction in the vibrational modes, compared to sodium niobate. The sample obtained with 2 M HNO3 had a lower chemical bond strength compared to the sample obtained in 0.1 M HNO3.
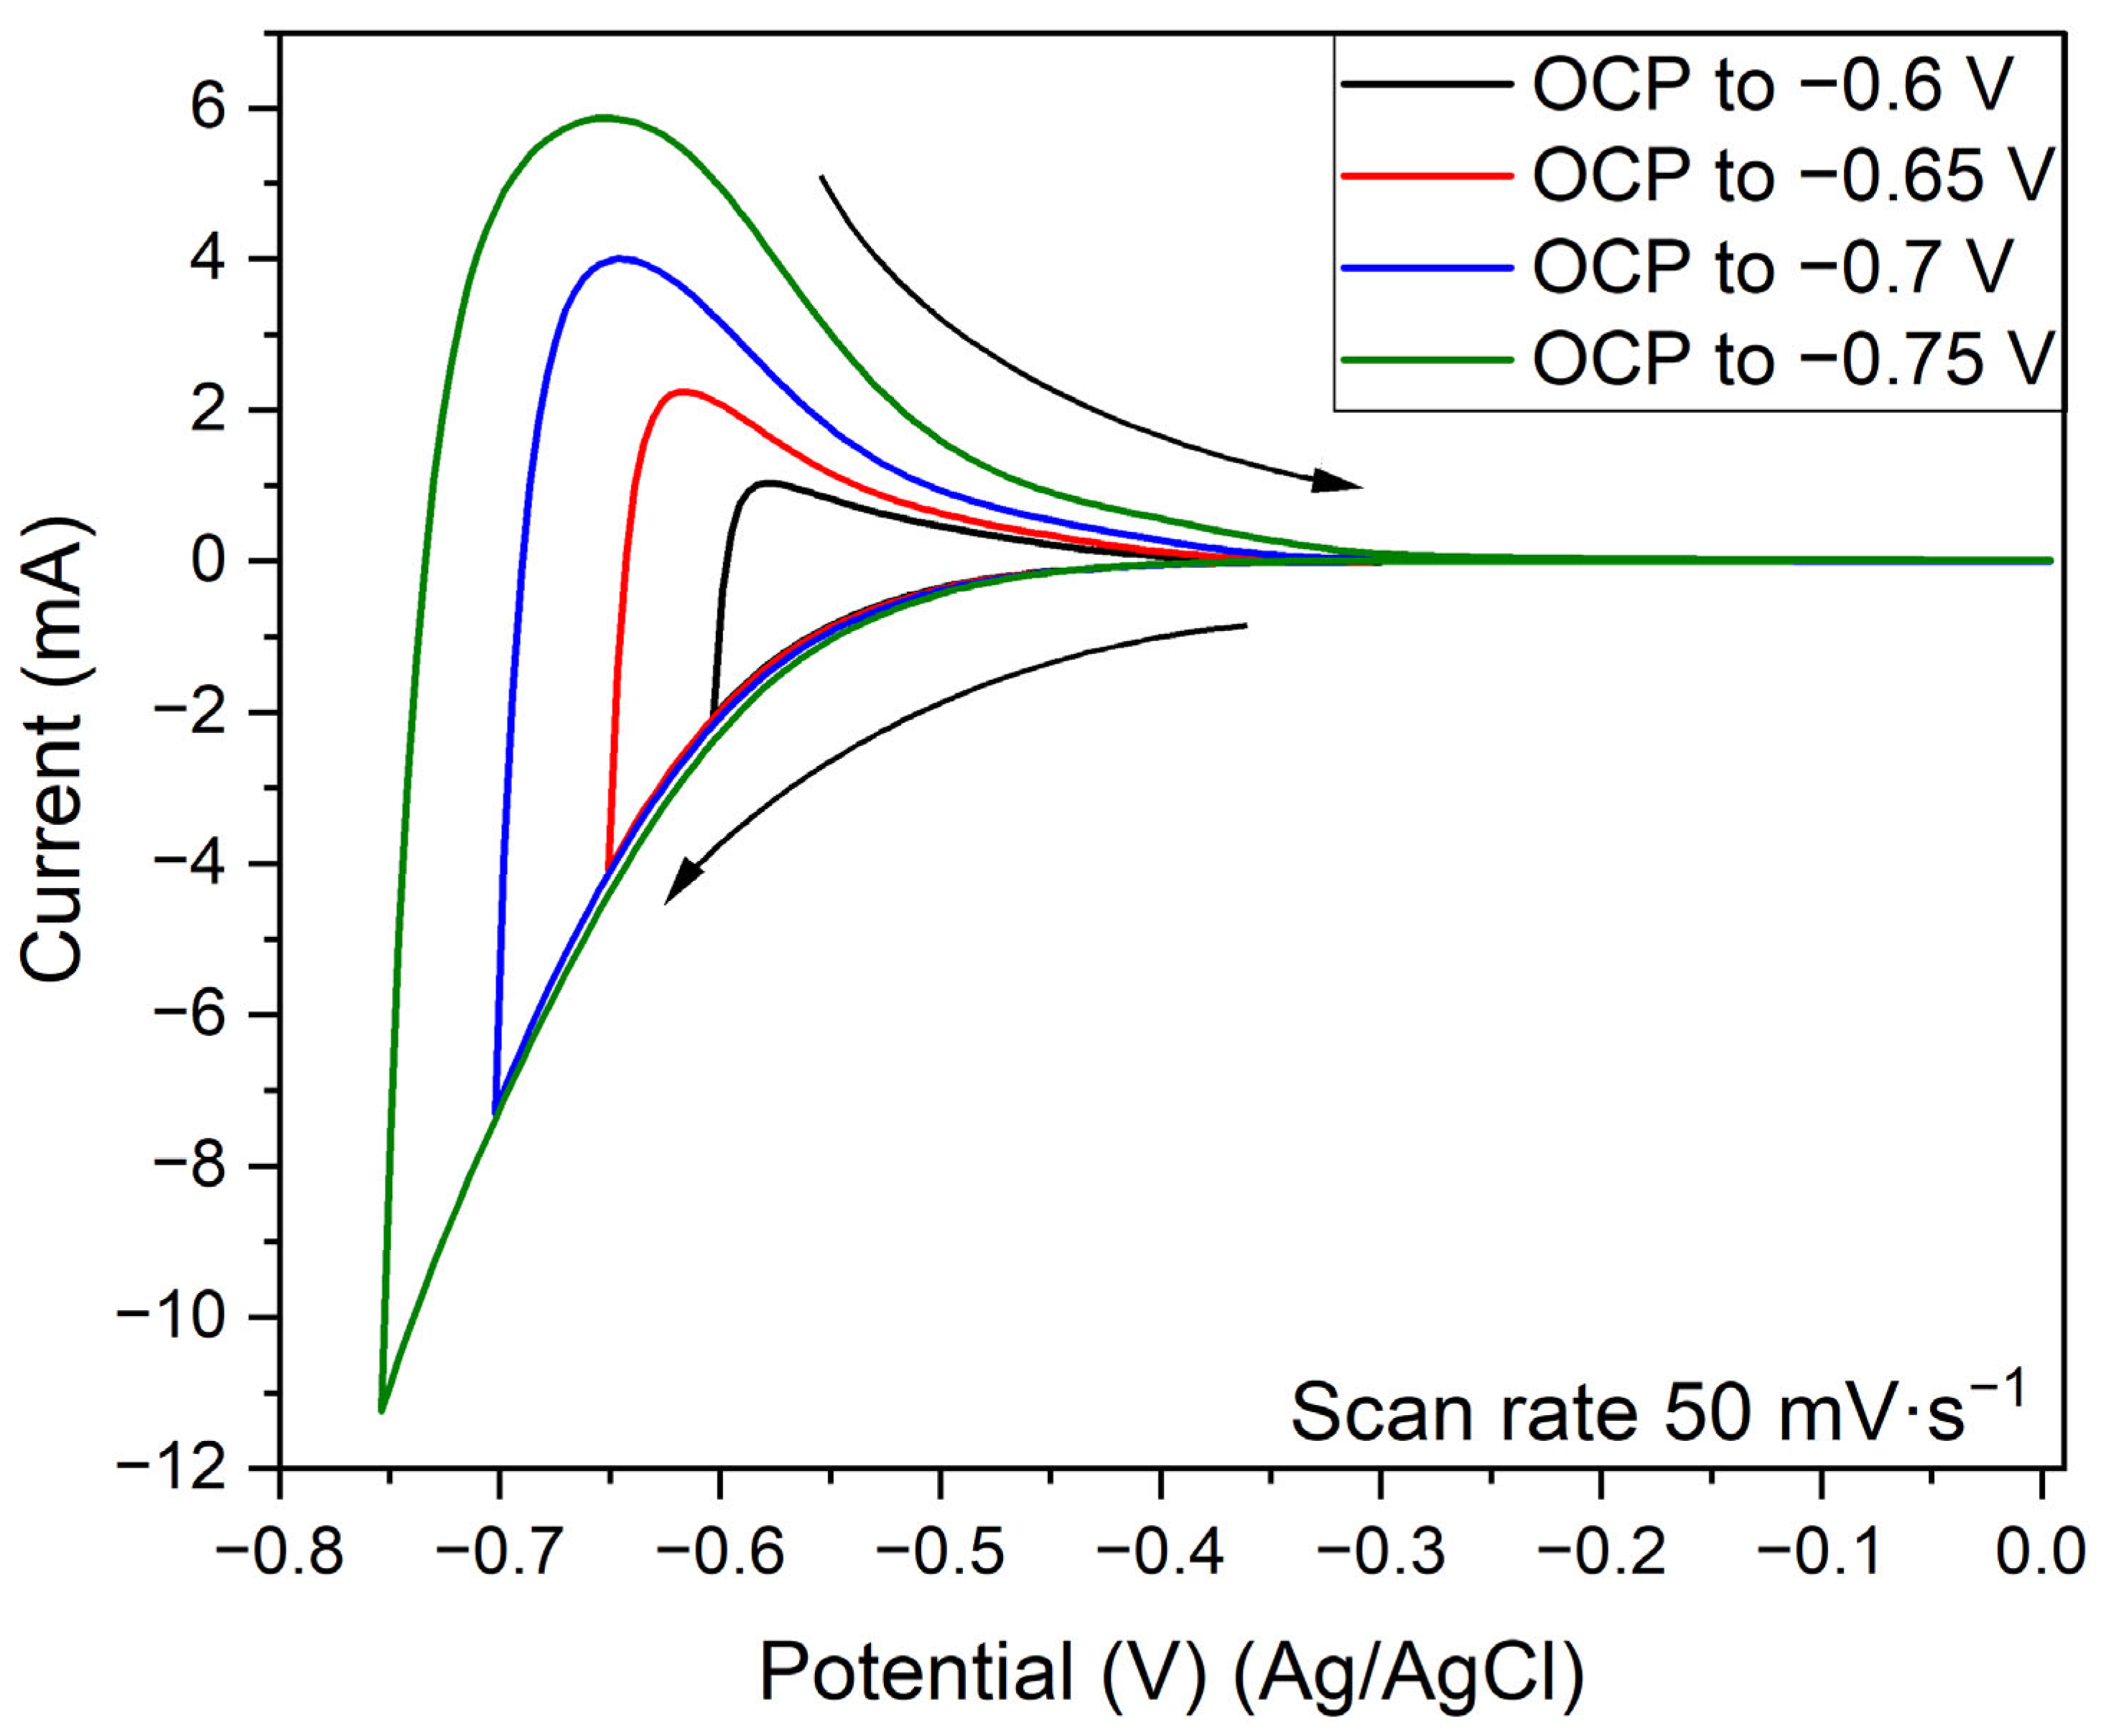
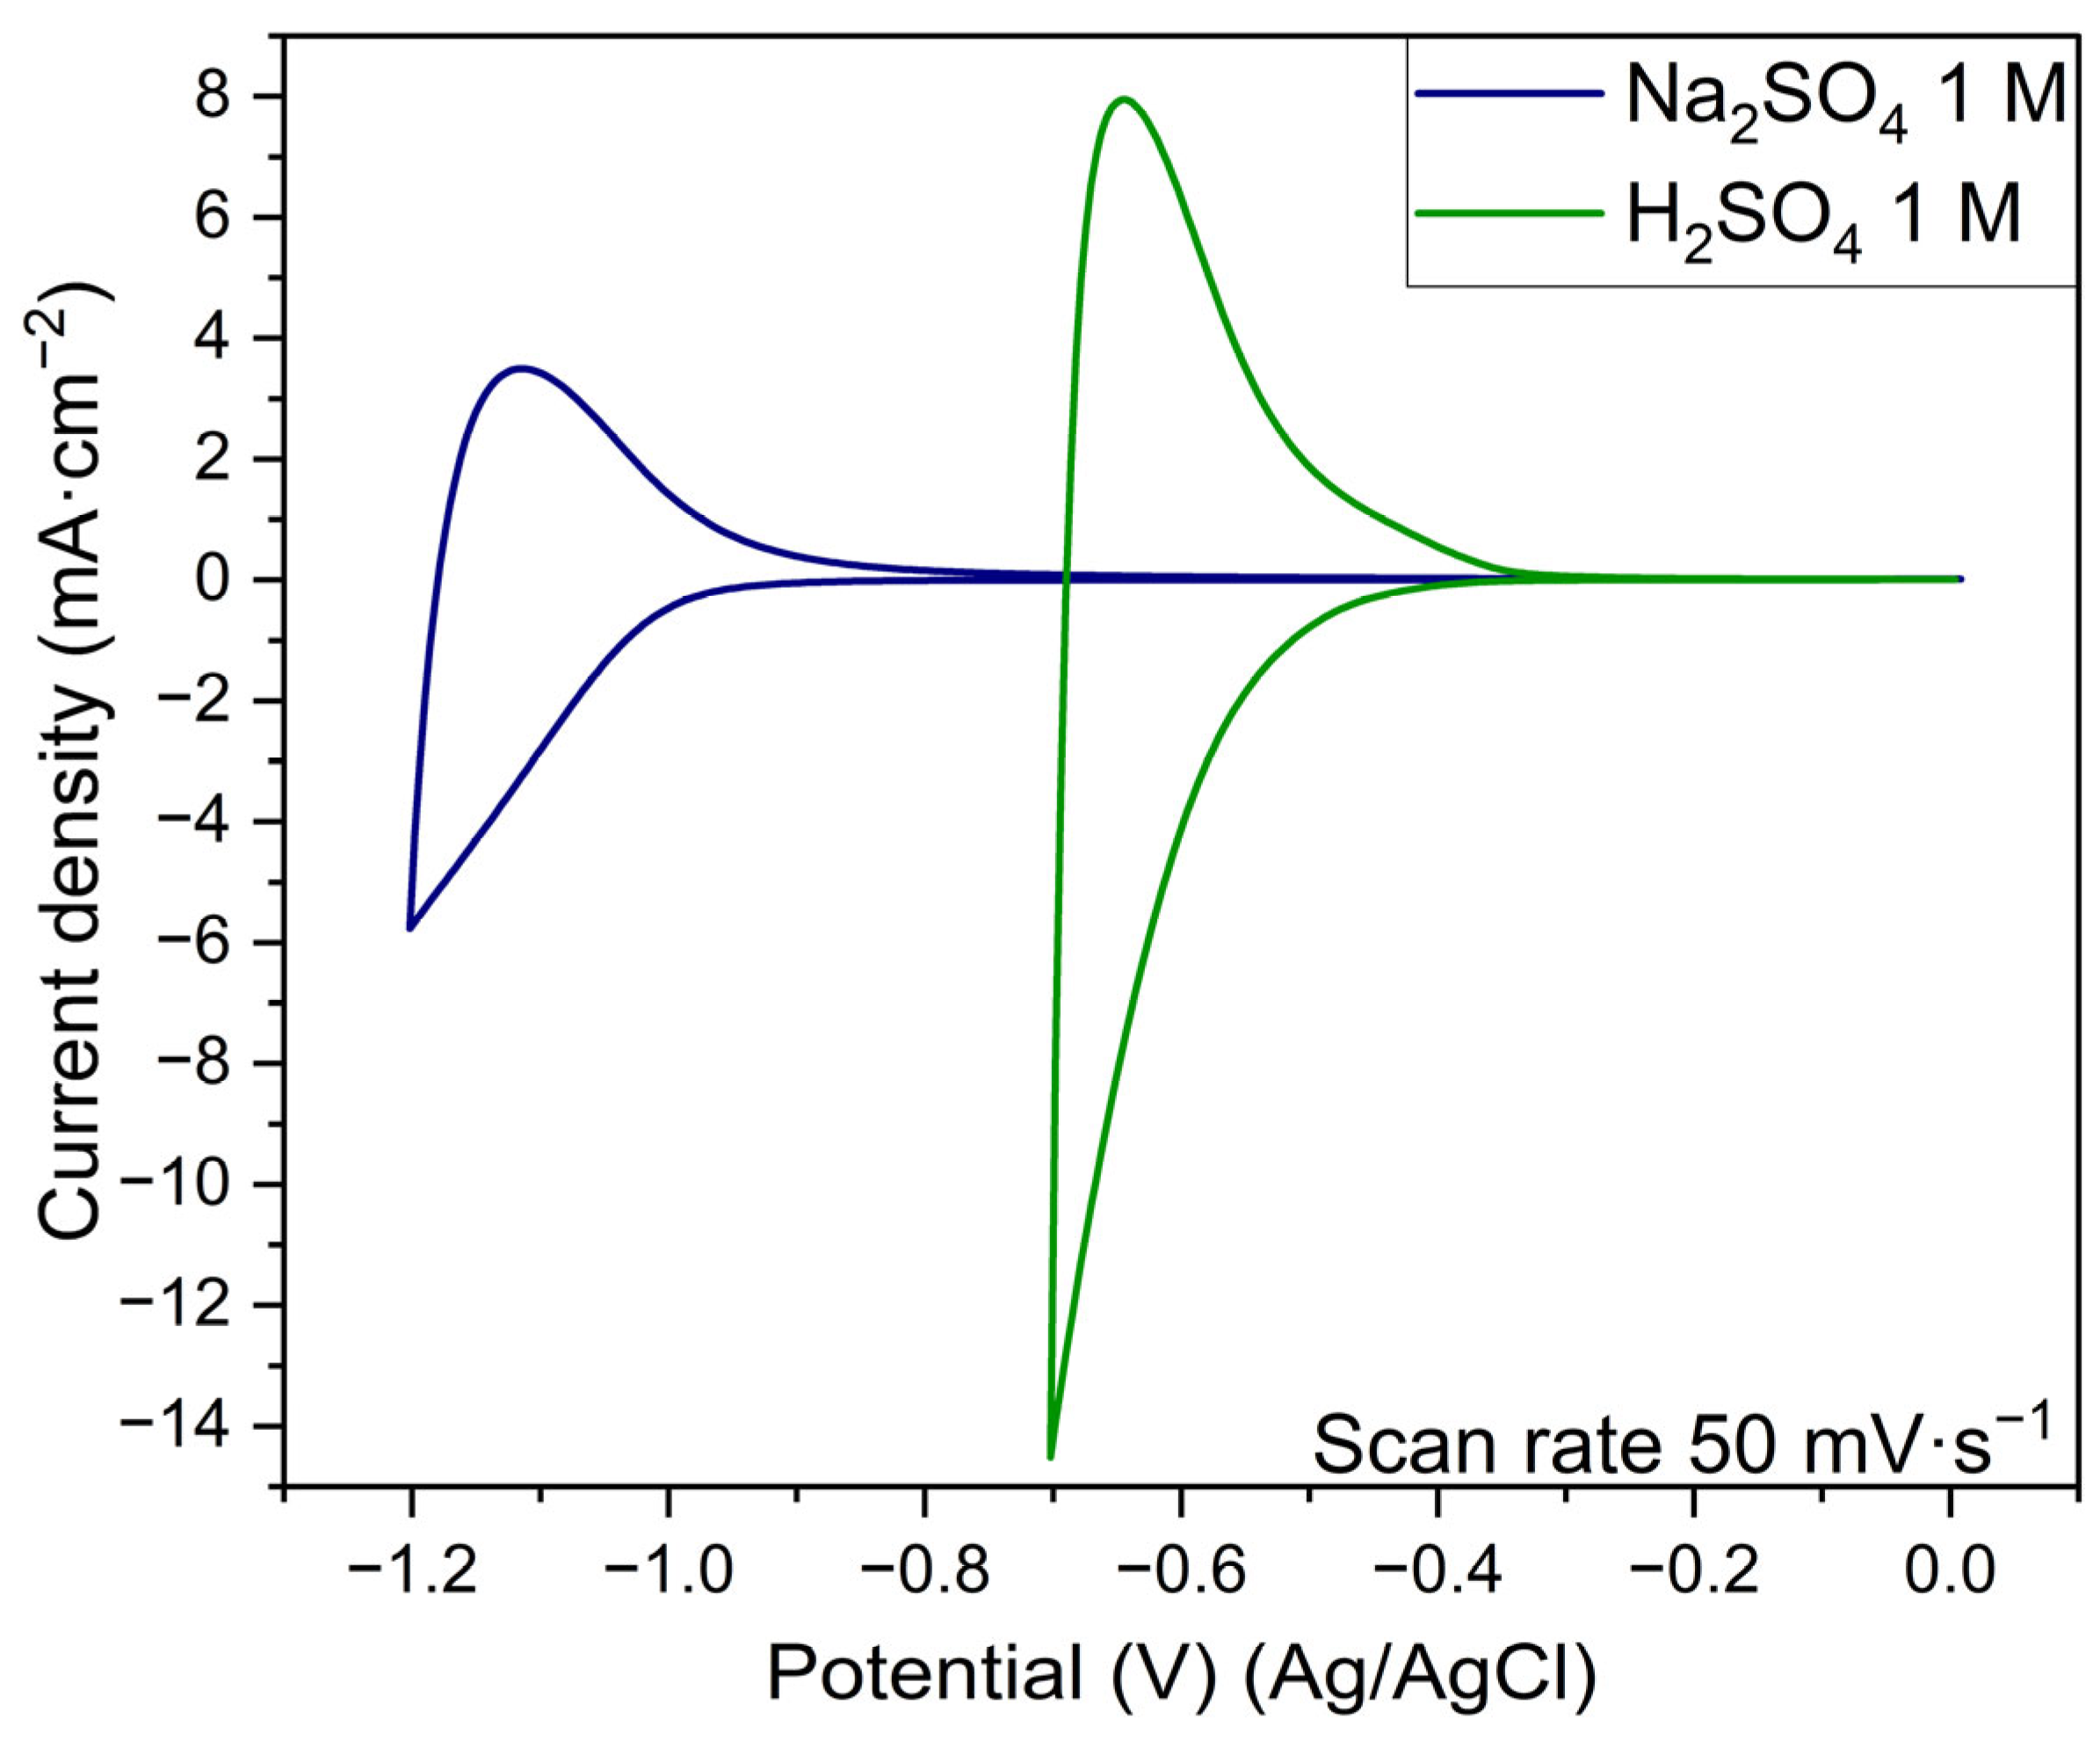
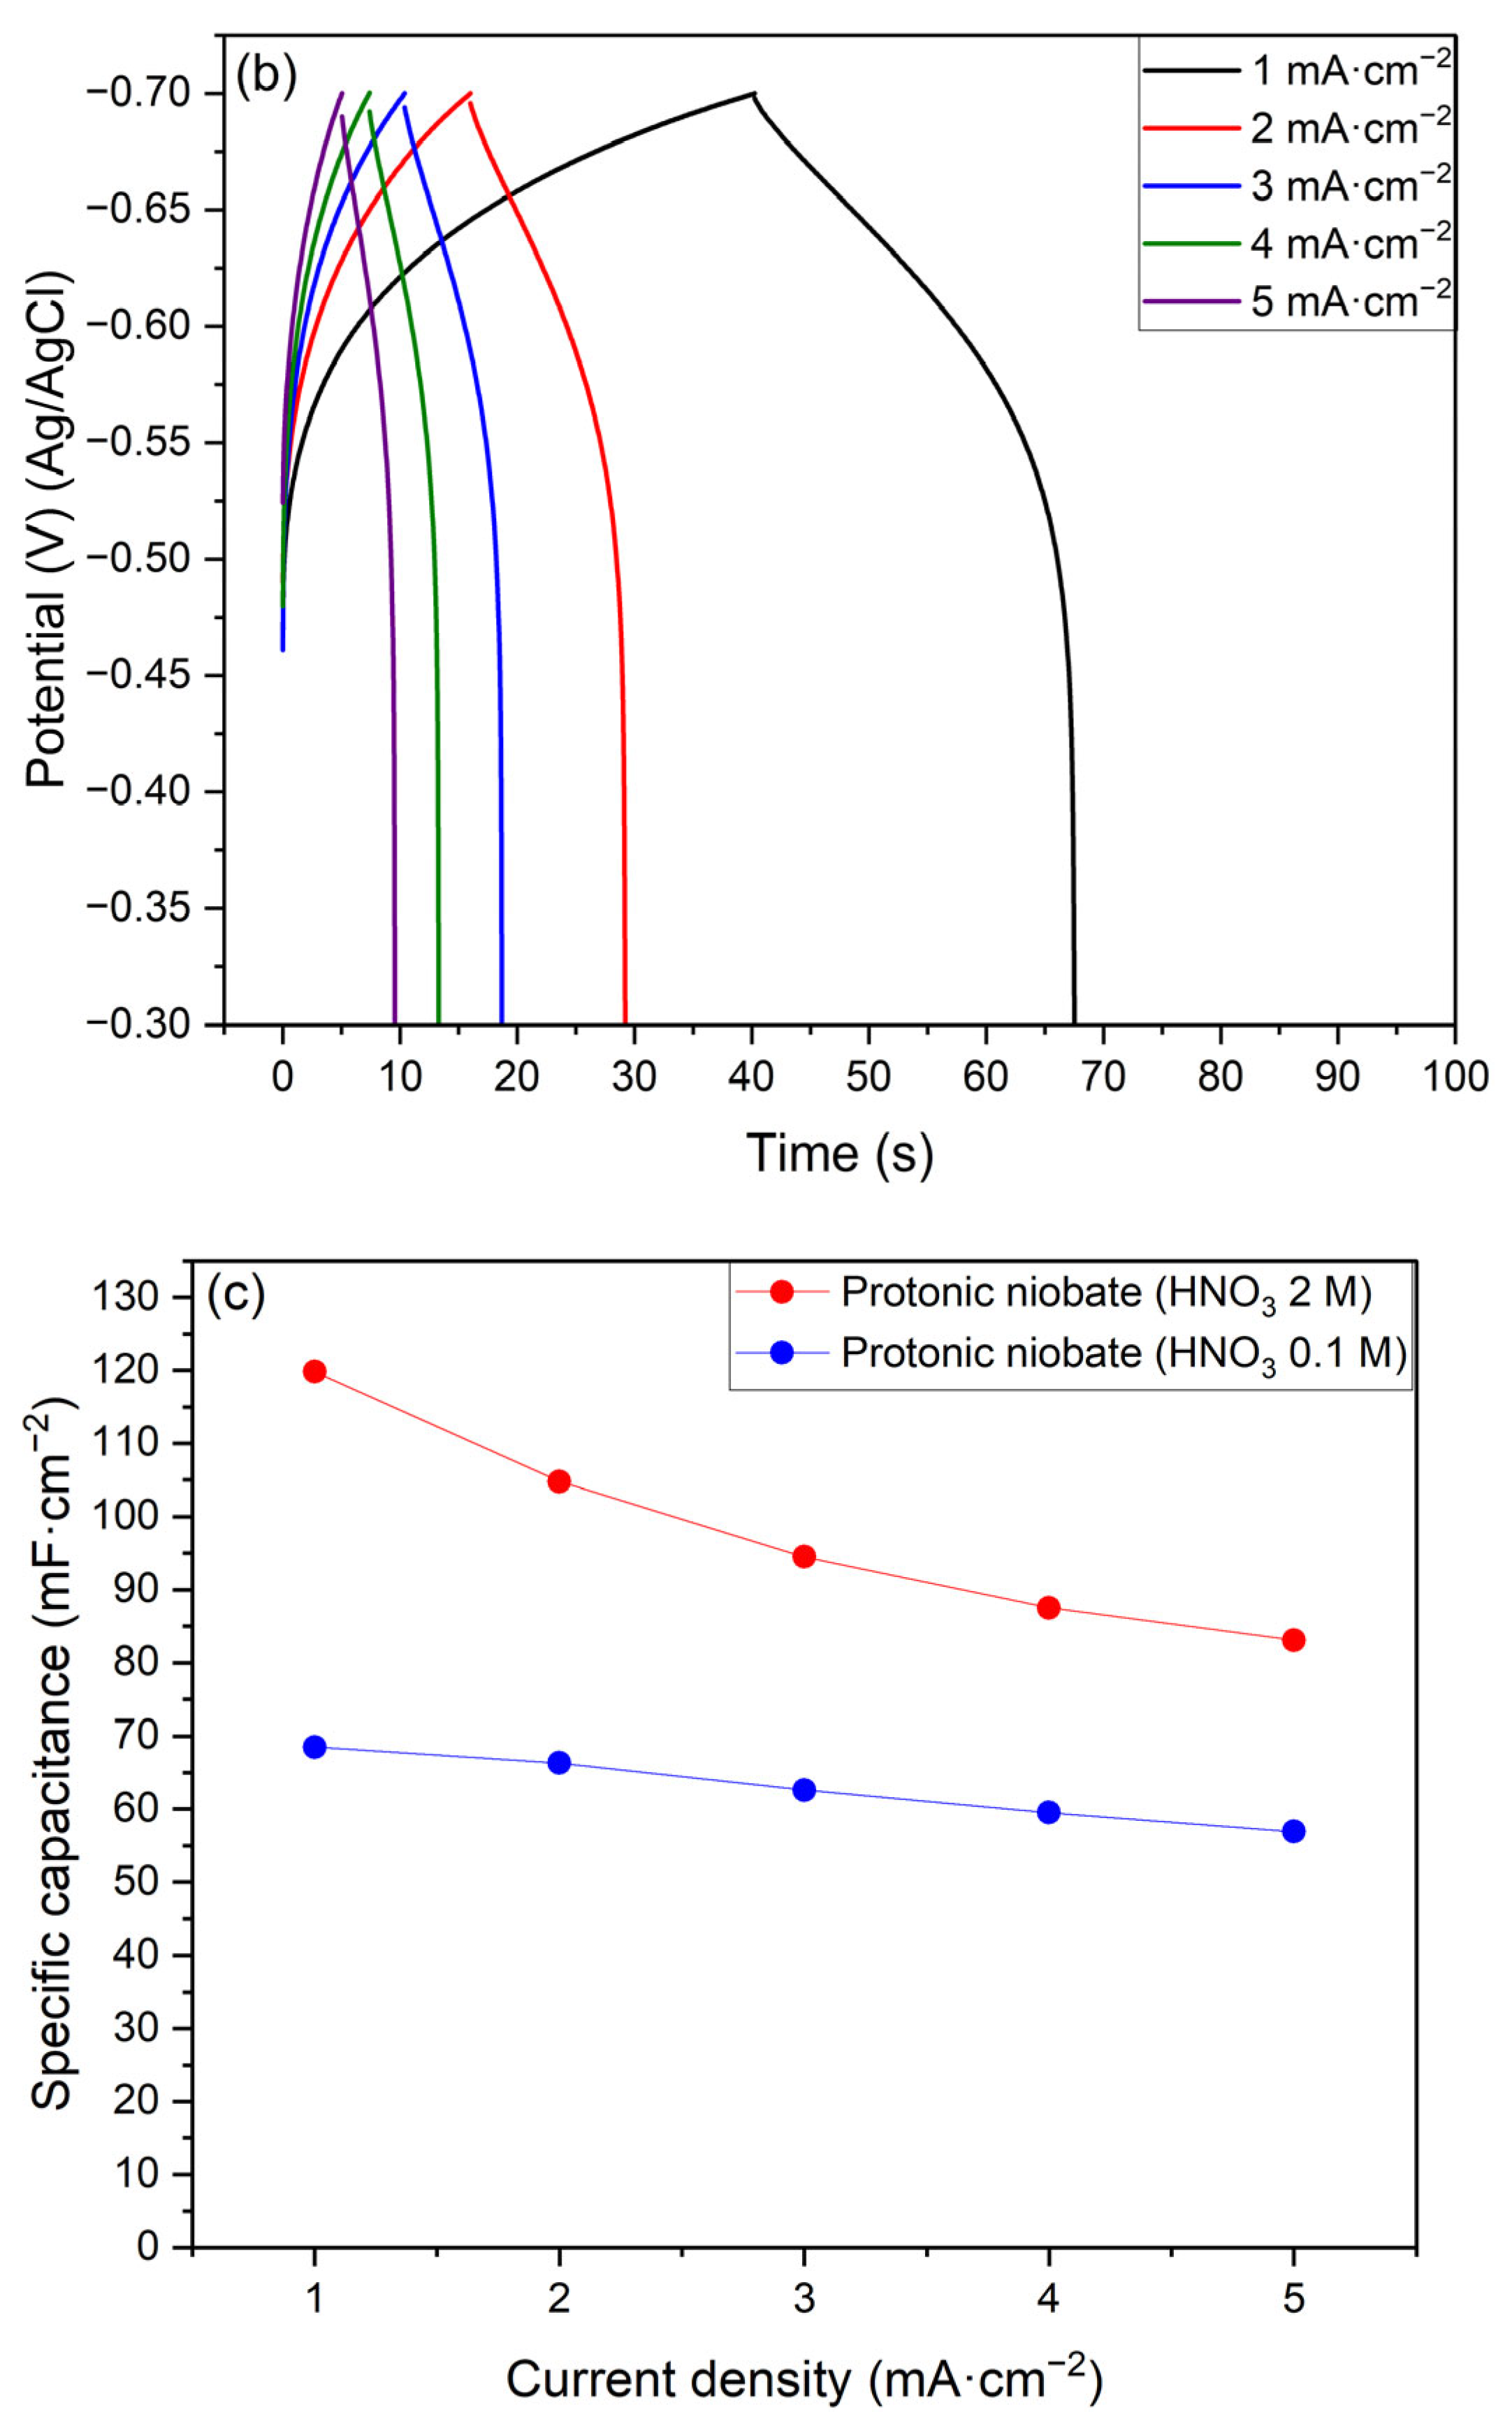
  • The protonic niobate presented a current density response that was suitable for a cathode material in both 1 M Na2SO4 and 1 M H2SO4 electrolytes.
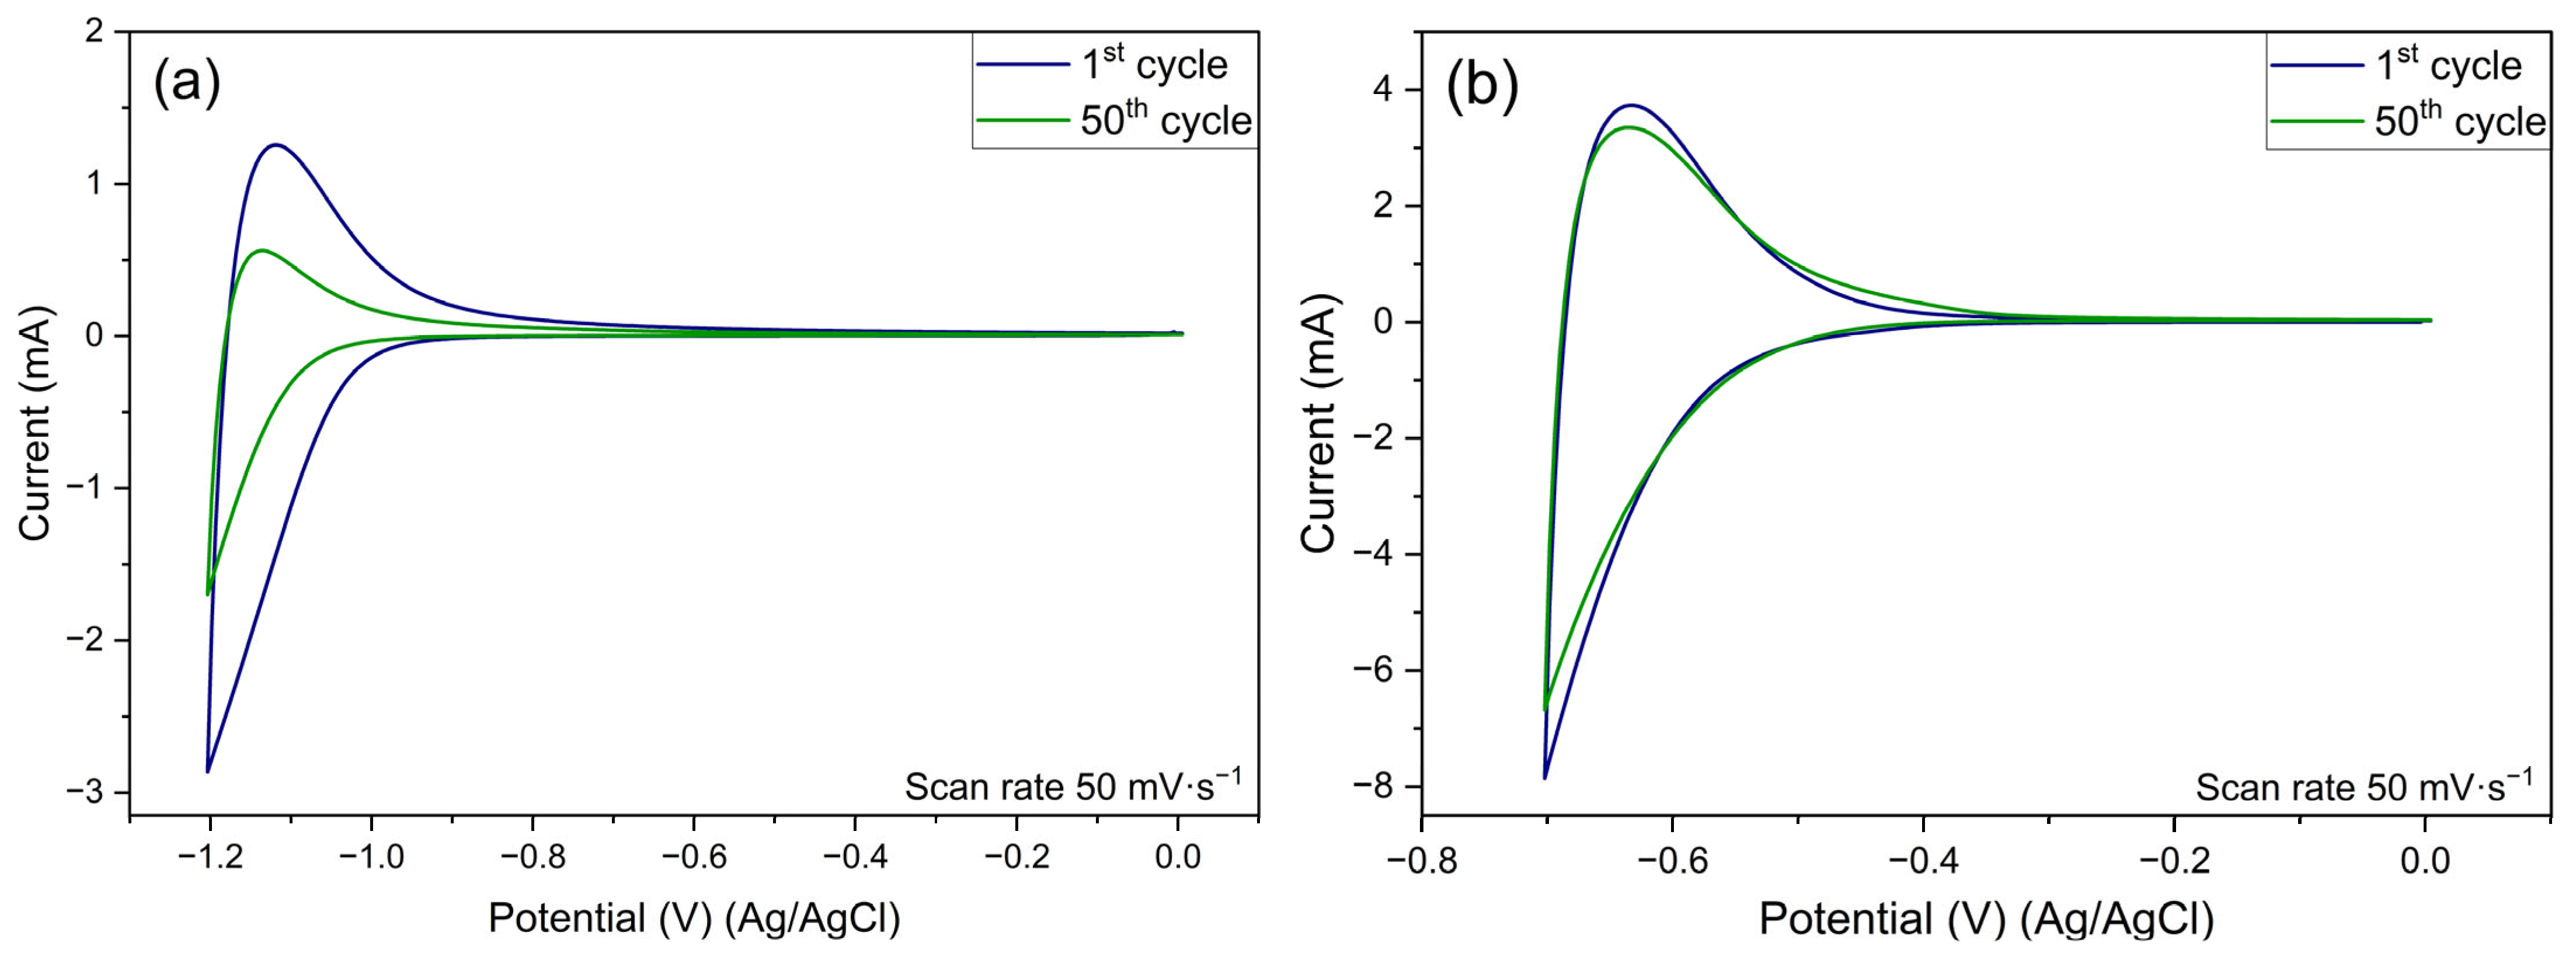
  • The results in Na2SO4 1M electrolyte did not present suitable reversibility for application as an electrochemical capacitor electrode. On the other hand, the protonic niobate presented good reversibility in the H2SO4 1 M electrolyte.
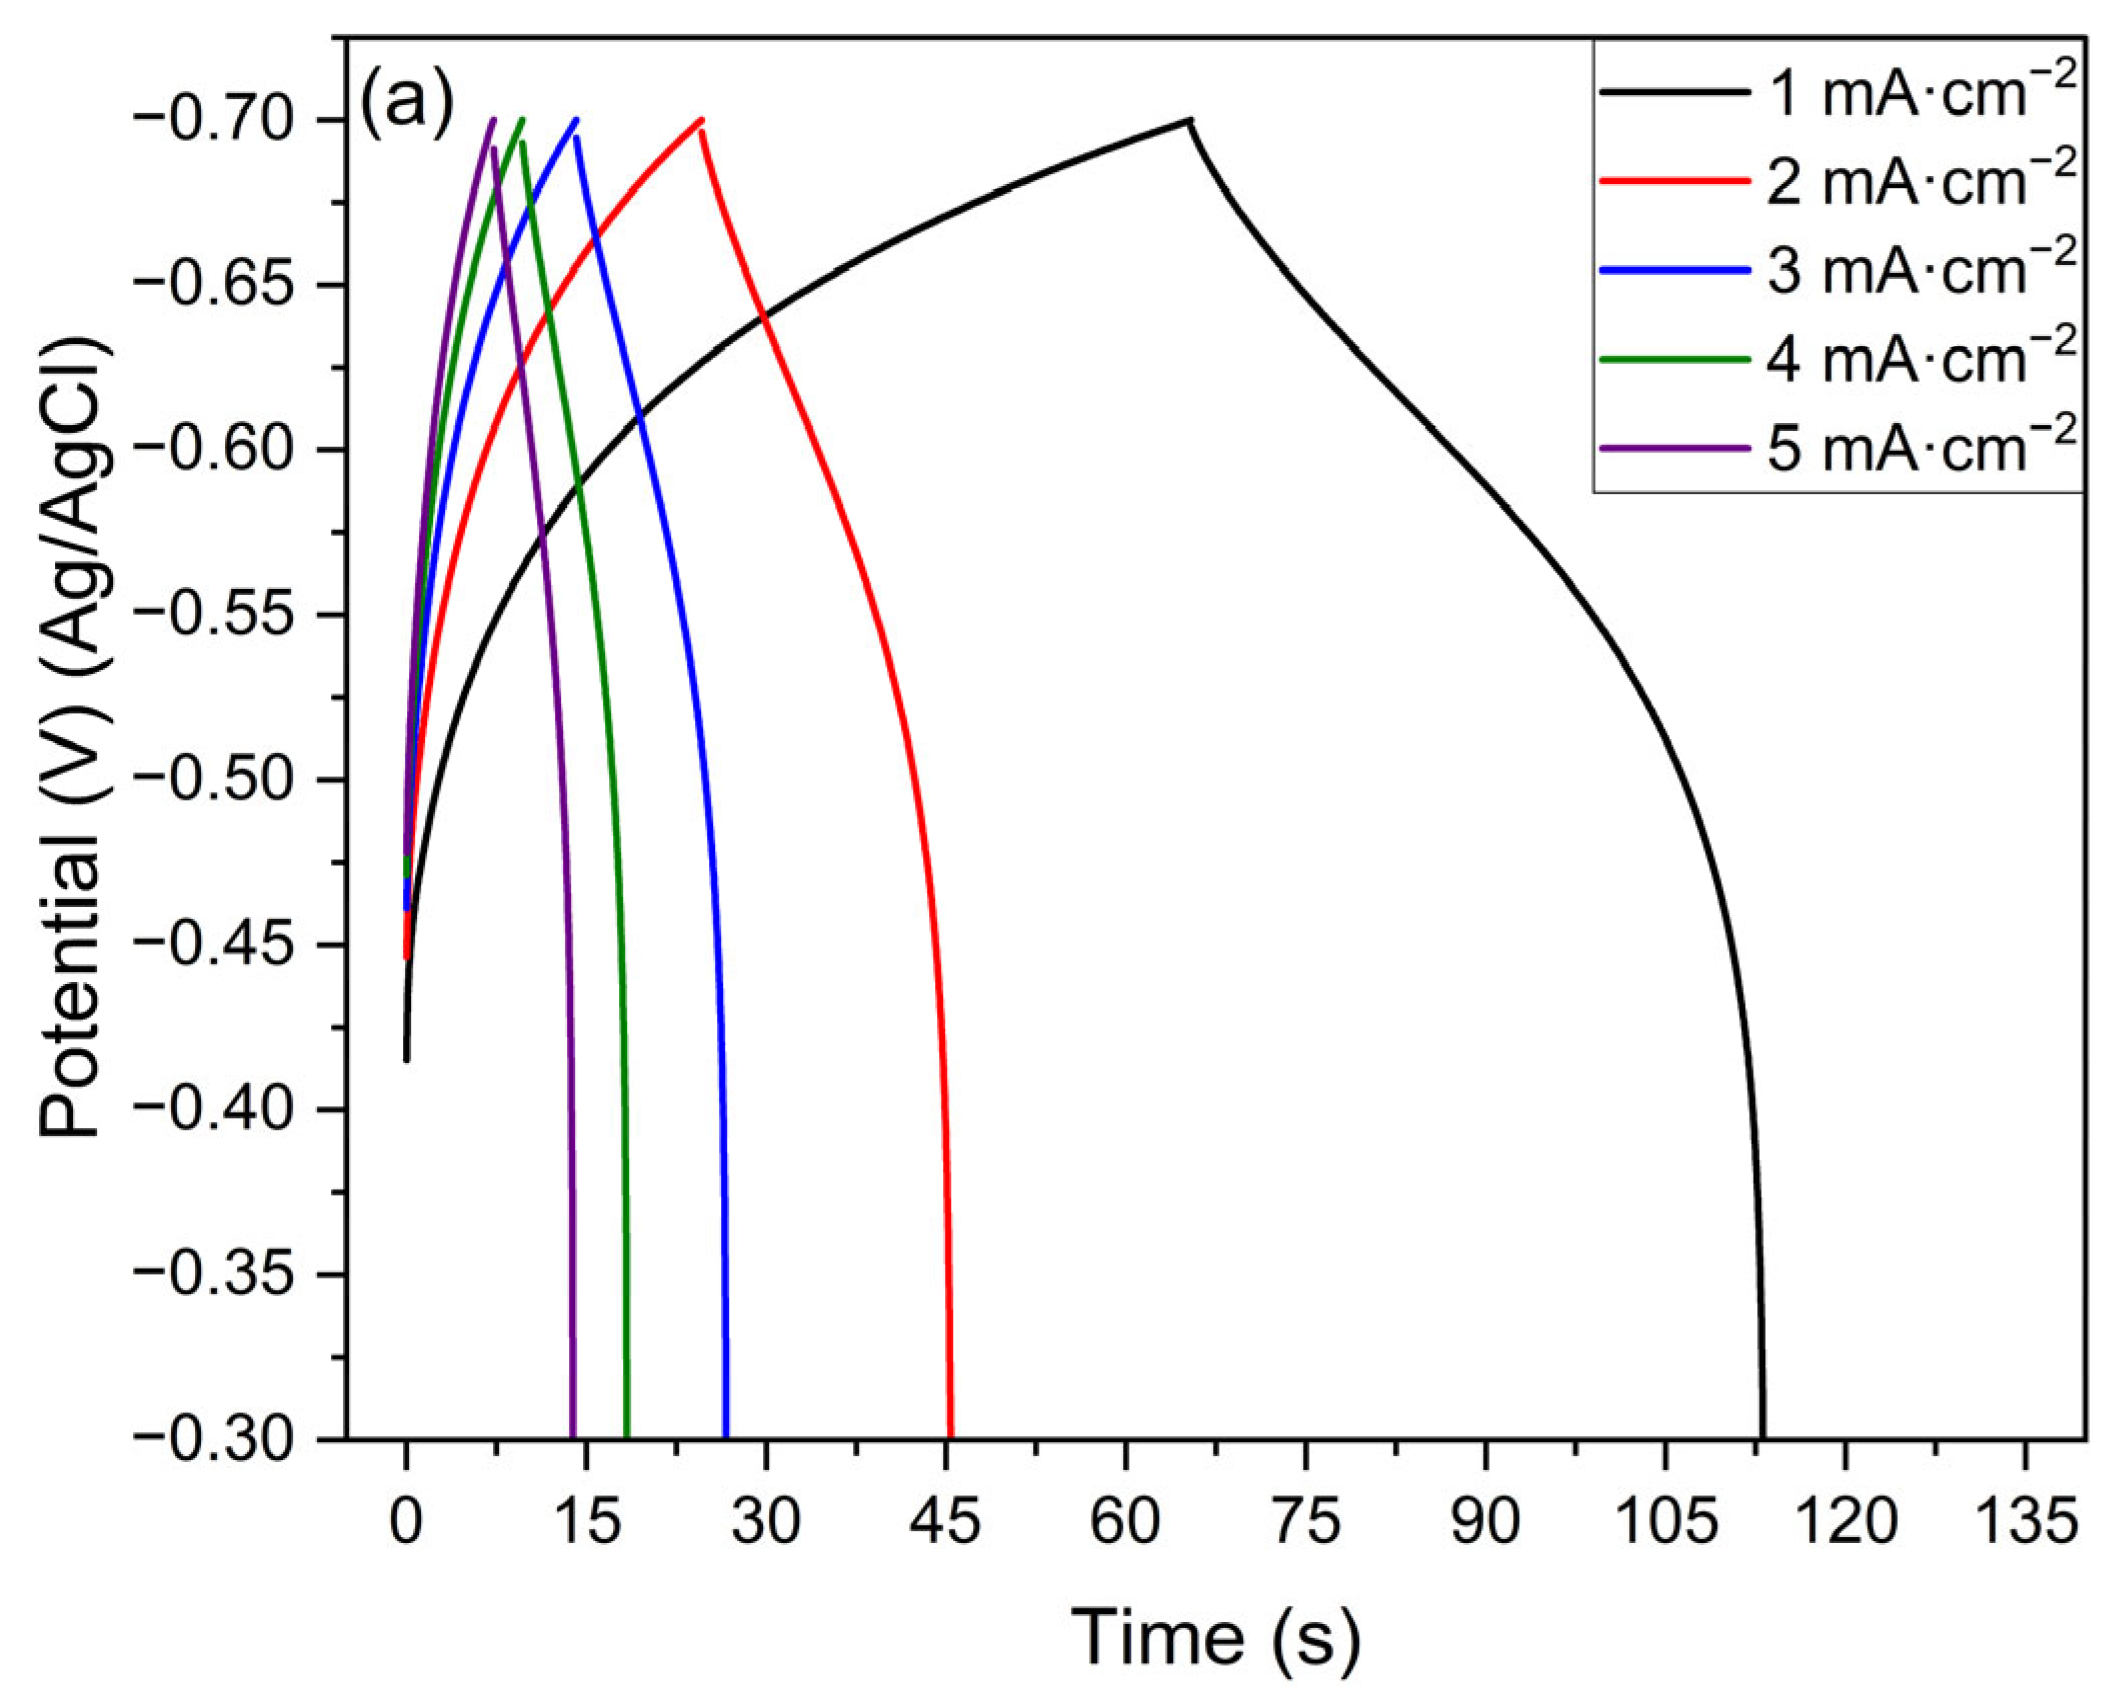
  • Protonic niobate obtained with HNO3 2 M presented better specific capacitance than the sample obtained with HNO3 0.1 M. This result suggests that the structure of the protonic niobate is more important than the morphology in terms of energy storage.
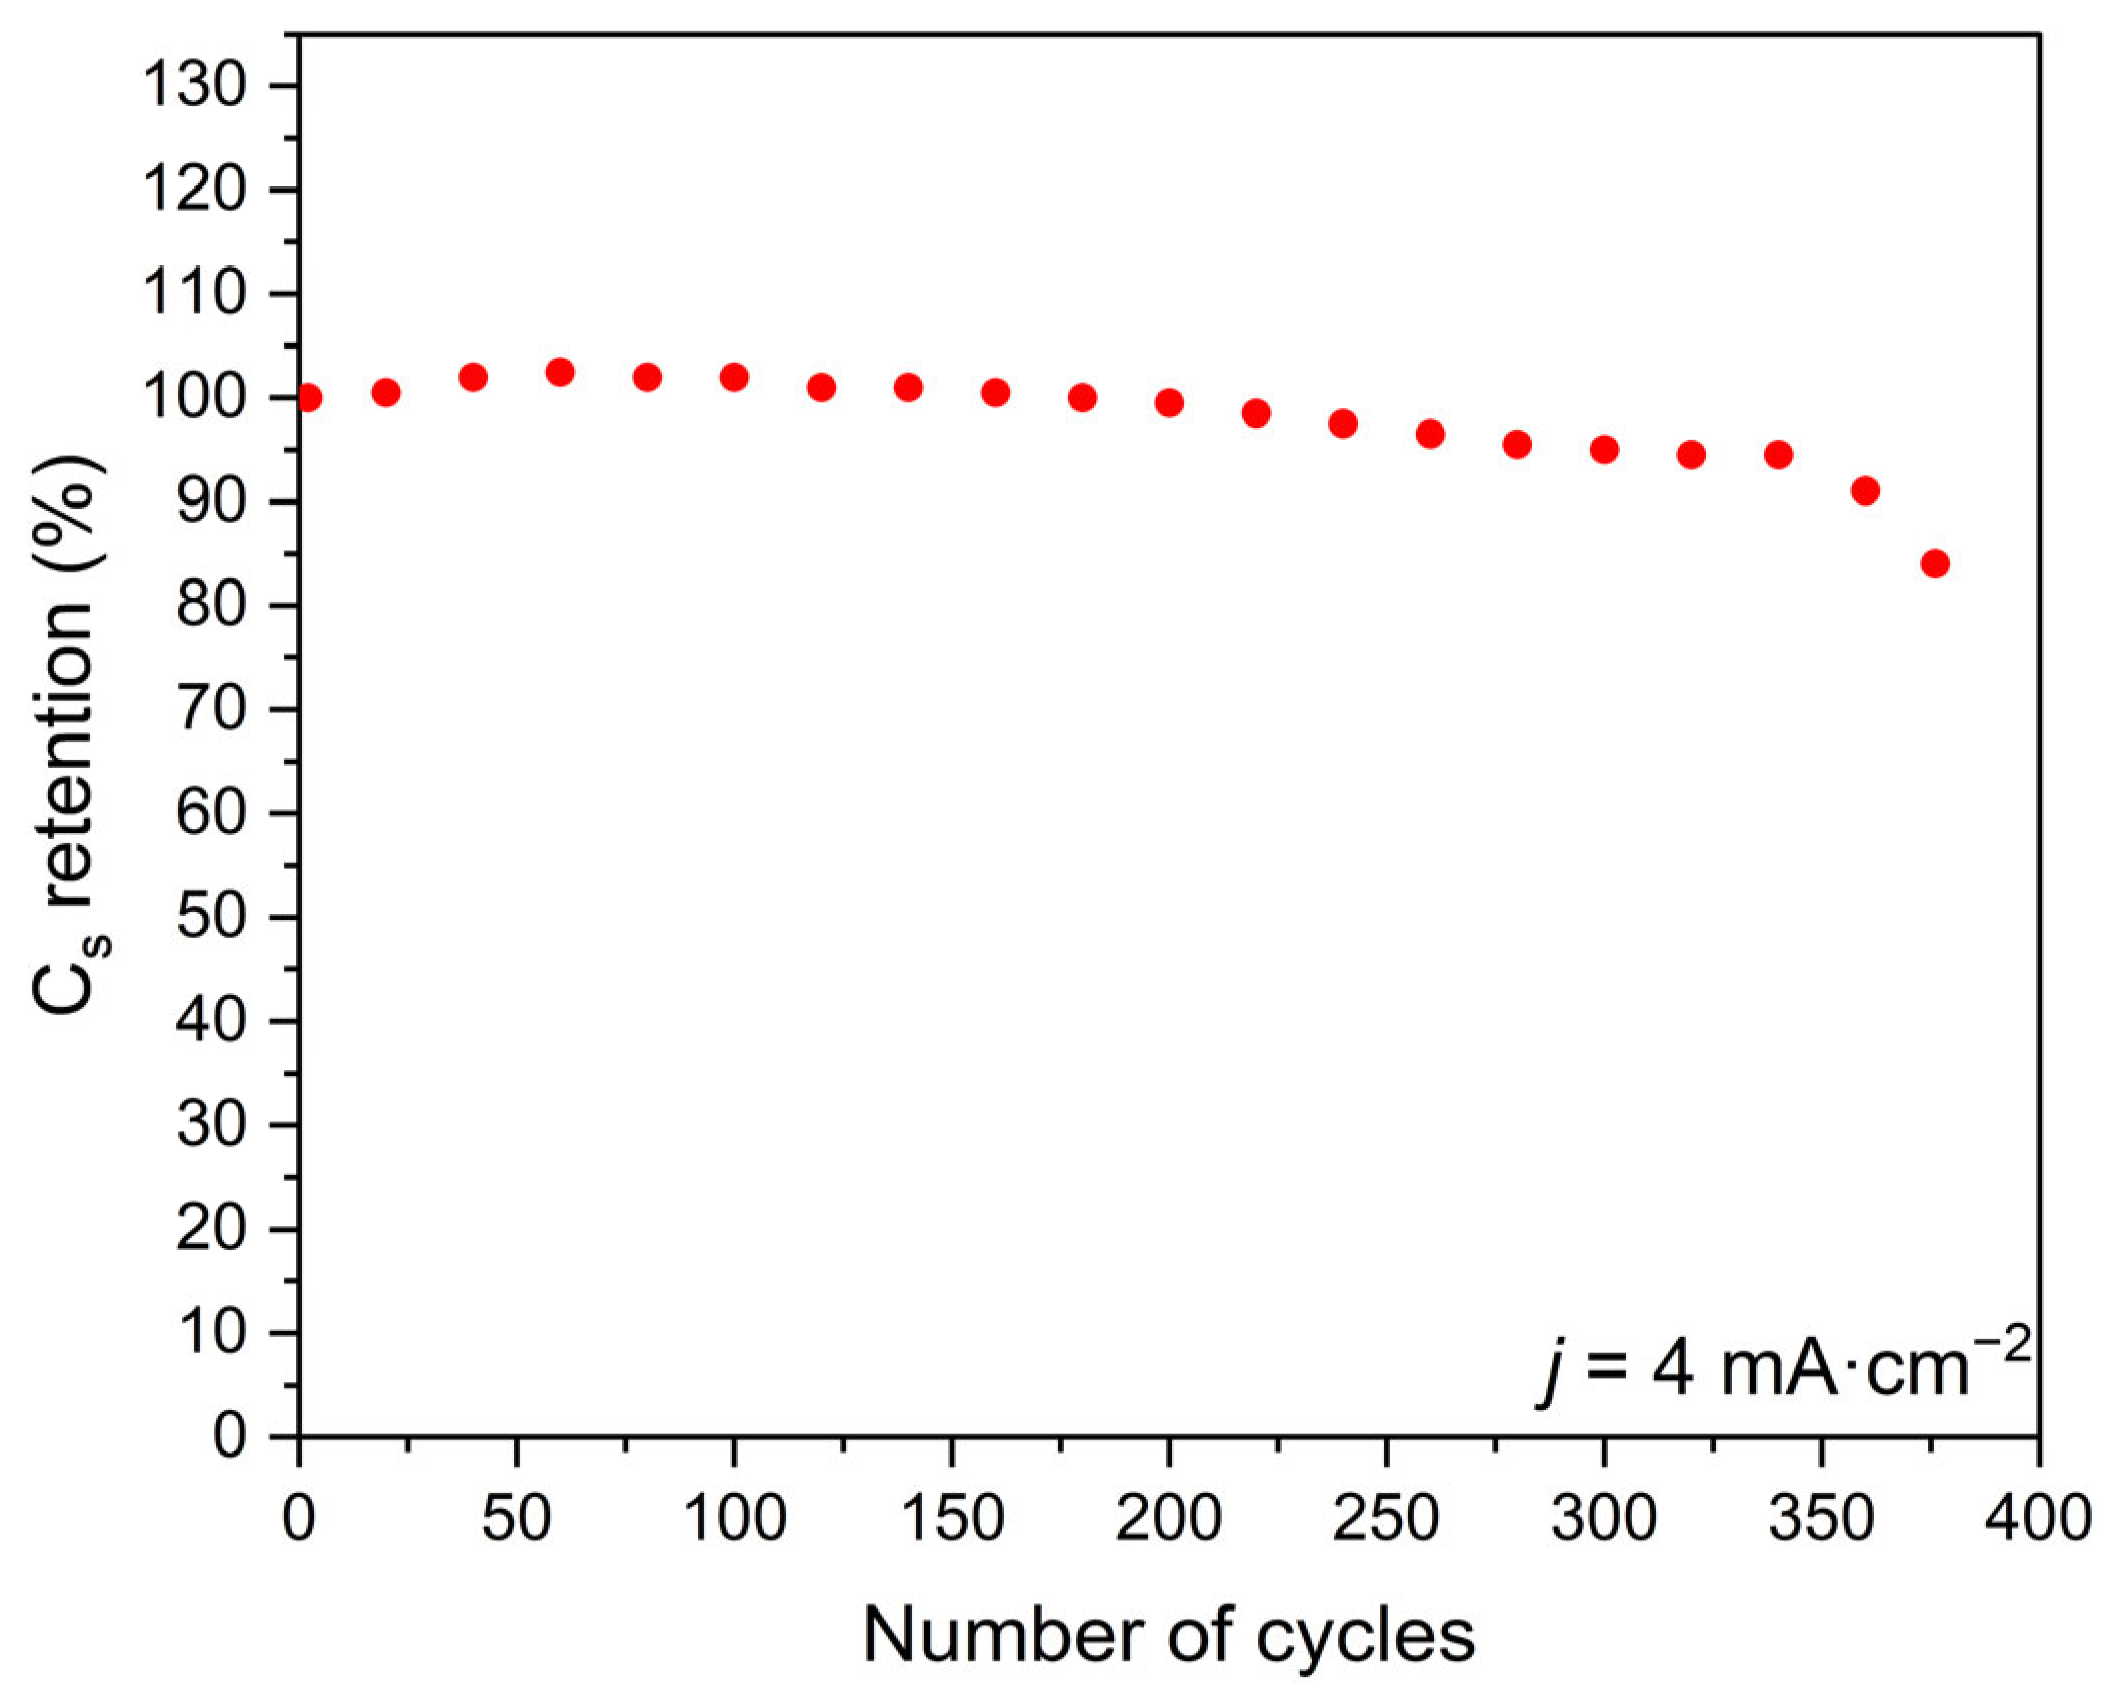
  • The protonic niobate obtained with 2 M HNO3 2 showed excellent reversibility of the specific capacitance up to approximately 350 cycles.
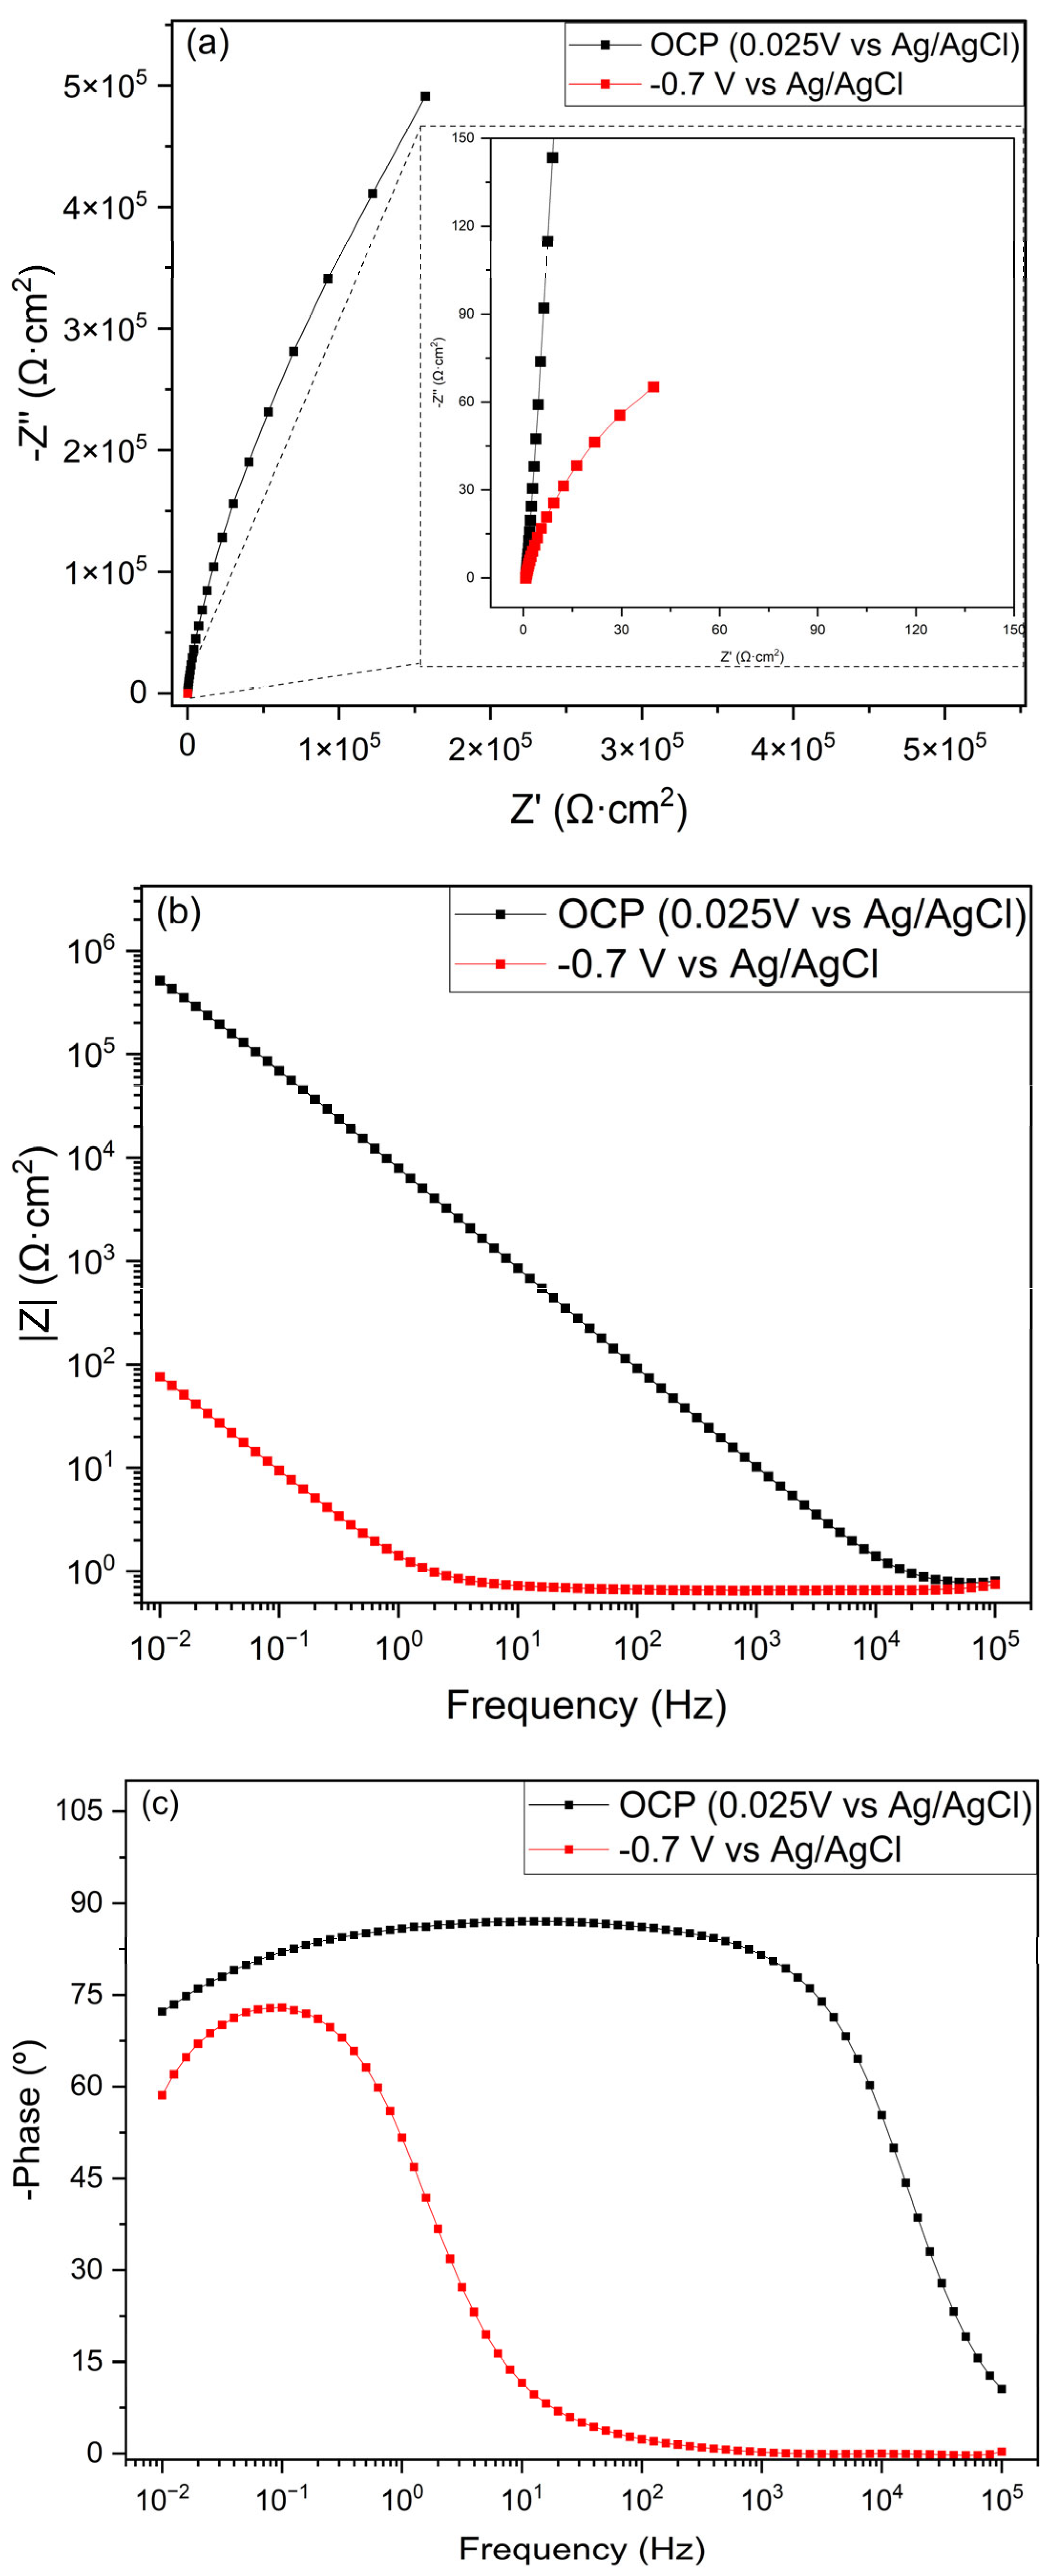
  • The EIS measurements indicated that the material had to be excited to present good conductivity.
  • The good energy storage of the protonic niobate can be attributed to the nanometric morphology and the structural arrangement of the material, which allow the energy to be stored by the double electrochemical layer, surface oxidation–-reduction reactions, and ion intercalation/deintercalation.

Supplementary Materials

The following supporting information can be downloaded at: https://www.mdpi.com/article/10.3390/ceramics8020059/s1, Derivation of chemical bond Strength reduction from infrared wavenumber shifts: analysis of HNO3-treated samples (0.1 M vs. 2 M).

Author Contributions

Conceptualization, A.G.d.S.J. and C.d.F.M.; methodology, A.G.d.S.J., J.G. and E.J.P.S.; validation, formal analysis, and investigation, A.G.d.S.J., J.G., E.J.P.S., C.C.A., G.L.R., A.M.H.d.A., R.H. and A.C.S.; writing—original draft preparation, A.G.d.S.J.; writing—review and editing; A.G.d.S.J. and C.d.F.M.; supervision, project administration, and funding acquisition, C.d.F.M. All authors have read and agreed to the published version of the manuscript.

Funding

The authors acknowledge the support of the Conselho Nacional de Desenvolvimento Científico e Tecnológico (CNPq)/MCTI (405948/2022-0) and Capes/PROEX (88881.844968/2023-01). Adilar Gonçalves dos Santos Júnior thanks CNPq (grant 351108/2023-8); Célia Malfatti thanks CNPq (grant 313493/2023-5); Edna Jerusa Pacheco Sampaio thanks CNPq (grant 350271/2024-0).

Institutional Review Board Statement

Not applicable.

Informed Consent Statement

Not applicable.

Data Availability Statement

The data presented in this study are available upon request from the corresponding author.

Acknowledgments

The authors would like to thank Companhia Brasileira de Metalurgia e Mineração (CBMM) for supplying the niobium sheets used in this work.

Conflicts of Interest

Companhia Brasileira de Metalurgia e Mineração (CBMM) supplied the niobium sheets used in these studies but had no role in the design of this study; in the collection, analyses, or interpretation of the data; in the writing of this manuscript; or in the decision to publish the results.

References

  1. International Energy Agency. Global Energy Review 2025. 2025. Available online: https://www.iea.org/reports/global-energy-review-2025 (accessed on 8 May 2025).
  2. Yin, T.; Guo, Y.; Huang, X.; Yang, X.; Qin, L.; Ning, T.; Tan, L.; Li, L.; Zou, K. Heteroatom Doping Strategy of Advanced Carbon for Alkali Metal-Ion Capacitors. Batteries 2025, 11, 69. [Google Scholar] [CrossRef]
  3. Yan, L.; Rui, X.; Chen, G.; Xu, W.; Zou, G.; Luo, H. Recent advances in nanostructured Nb-based oxides for electrochemical energy storage. Nanoscale 2016, 8, 8443–8465. [Google Scholar] [CrossRef] [PubMed]
  4. Shen, F.; Sun, Z.; He, Q.; Sun, J.; Kaner, R.B.; Shao, Y. Niobium pentoxide based materials for high rate rechargeable electrochemical energy storage. Mater. Horiz. 2021, 8, 1130–1152. [Google Scholar] [CrossRef]
  5. Liu, Y.; Russo, P.A.; Montoro, L.A.; Pinna, N. Recent developments in Nb-based oxides with crystallographic shear structures as anode materials for high-rate lithium-ion energy storage. Batter. Energy 2023, 2, 20220037. [Google Scholar] [CrossRef]
  6. Ding, H.; Song, Z.; Zhang, H.; Li, X. Niobium-based oxide anodes toward fast and safe energy storage: A review. Mater. Today Nano 2020, 11, 100082. [Google Scholar] [CrossRef]
  7. Sampaio, E.J.P.; Júnior, A.G.d.S.; Araújo, C.C.; Malfatti, C.d.F. A Review on Pseudocapacitors: Advances in Nb Oxide—Sodium-Ion Systems. Adv. Mater. Sci. Technol. 2023, 5, 1. [Google Scholar] [CrossRef]
  8. Gomes, M.A.B.; Bulhoes, L.O.S.; DE Castro, S.C.; Damiao, A.J. ChemInform Abstract: The Electrochromic Process at Nb2O5 Electrodes Prepared by Thermal Oxidation of Niobium. ChemInform 1990, 21, 3067. [Google Scholar] [CrossRef]
  9. Upadhyay, K.K.; Cha, G.; Hildebrand, H.; Schmuki, P.; Silva, T.M.; Montemor, M.F.; Altomare, M. Capacitance response in an aqueous electrolyte of Nb2O5 nanochannel layers anodically grown in pure molten o-H3PO4. Electrochim. Acta 2018, 281, 725–737. [Google Scholar] [CrossRef]
  10. Beknalkar, S.; Teli, A.; Bhat, T.; Amate, R.; Morankar, P.; Baik, S.; Wu, Y.; Lee, J.; Kim, H.; Shin, J. A brief review on niobium oxide for supercapacitors: Unveiling fundamentals, recent breakthroughs, and promising future horizons. J. Alloys Compd. 2024, 1010, 177473. [Google Scholar] [CrossRef]
  11. Yi, T.-F.; Sari, H.M.K.; Li, X.; Wang, F.; Zhu, Y.-R.; Hu, J.; Zhang, J.; Li, X. A review of niobium oxides based nanocomposites for lithium-ion batteries, sodium-ion batteries and supercapacitors. Nano Energy 2021, 85, 105955. [Google Scholar] [CrossRef]
  12. Yuan, T.; Soule, L.; Zhao, B.; Zou, J.; Yang, J.; Liu, M.; Zheng, S. Recent Advances in Titanium Niobium Oxide Anodes for High-Power Lithium-Ion Batteries. Energy Fuels 2020, 34, 13321–13334. [Google Scholar] [CrossRef]
  13. Hu, L.; Luo, L.; Tang, L.; Lin, C.; Li, R.; Chen, Y. Ti2Nb2xO4+5x anode materials for lithium-ion batteries: A comprehensive review. J. Mater. Chem. A 2018, 6, 9799–9815. [Google Scholar] [CrossRef]
  14. Zhang, S.; Liu, G.; Qiao, W.; Wang, J.; Ling, L. Oxygen vacancies enhance the lithium ion intercalation pseudocapacitive properties of orthorhombic niobium pentoxide. J. Colloid Interface Sci. 2020, 562, 193–203. [Google Scholar] [CrossRef] [PubMed]
  15. Kim, J.W.; Augustyn, V.; Dunn, B. The Effect of Crystallinity on the Rapid Pseudocapacitive Response of Nb2O5. Adv. Energy Mater. 2012, 2, 141–148. [Google Scholar] [CrossRef]
  16. Fic, K.; Lota, G.; Meller, M.; Frackowiak, E. Novel insight into neutral medium as electrolyte for high-voltage supercapacitors. Energy Environ. Sci. 2012, 5, 5842–5850. [Google Scholar] [CrossRef]
  17. Zhong, C.; Deng, Y.; Hu, W.; Qiao, J.; Zhang, L.; Zhang, J. A review of electrolyte materials and compositions for electrochemical supercapacitors. Chem. Soc. Rev. 2015, 44, 7484–7539. [Google Scholar] [CrossRef]
  18. Shao, Y.; El-Kady, M.F.; Sun, J.; Li, Y.; Zhang, Q.; Zhu, M.; Wang, H.; Dunn, B.; Kaner, R.B. Design and Mechanisms of Asymmetric Supercapacitors. Chem. Rev. 2018, 118, 9233–9280. [Google Scholar] [CrossRef]
  19. Júnior, A.G.d.S.; Antonini, L.M.; Sampaio, E.J.P.; de Andrade, A.M.H.; Aguzzoli, C.; Malfatti, C.d.F. Sodium niobates and protonic niobates nanowires obtained from hydrothermal synthesis: Electrochemical behavior in aqueous electrolyte. Ceram. Int. 2022, 48, 1522–1531. [Google Scholar] [CrossRef]
  20. Sampaio, E.J.P.; Antonini, L.M.; Júnior, A.G.d.S.; de Andrade, A.M.H.; Malfatti, C.d.F.; Hubler, R.; Aguzzoli, C. Highly ordered nanotubular niobium oxide obtained by self-organizing anodization: A study of capacitive behavior. Ceram. Int. 2022, 48, 25424–25430. [Google Scholar] [CrossRef]
  21. Sharma, A.; Bhardwaj, U.; Jain, D.; Kushwaha, H.S. NaNbO3 Nanorods: Photopiezocatalysts for Elevated Bacterial Disinfection and Wastewater Treatment. ACS Omega 2022, 7, 7595–7605. [Google Scholar] [CrossRef]
  22. Haring, M.M.M.; McDonald, A.M. Franconite, NaNb2O5(OH)·3H2O: Structure determination and the role of H bonding, with comments on the crystal chemistry of franconite-related minerals. Miner. Mag. 2014, 78, 591–607. [Google Scholar] [CrossRef]
  23. Yang, J.-L.; Chen, H.-Y.; Wang, Z. Synthesis of sodium-potassium niobate (K, Na)NbO3 lead-free piezoelectric powders using solvothermal and hydrothermal processing. In Proceedings of the 2010 Symposium on Piezoelectricity, Acoustic Waves, and Device Applications (SPAWDA 2010), Xiamen, China, 10–13 December 2010; pp. 249–253. [Google Scholar]
  24. Da, L.; Zhu, J.; He, J.; Hu, L.; Zhang, P.; Li, Q.; Zhou, P. Construction and Photocatalytic Properties of TiO2@HNb3O8-NS. J. Mol. Struct. 2020, 1212, 128126. [Google Scholar] [CrossRef]
  25. Mannino, G.; Condorelli, M.; Compagnini, G.; Faraci, G. Raman amplification for trapped radiation in crystalline single Si nanoparticle. Sci. Rep. 2023, 13, 1014. [Google Scholar] [CrossRef] [PubMed]
  26. Colomban, P.; Slodczyk, A. Raman Intensity: An Important Tool in the Study οf Nanomaterials and Nanostructures. Acta Phys. Pol. A 2009, 116, 7–12. [Google Scholar] [CrossRef]
  27. Júnior, A.G.d.S.; Gotardi, J.; Pilger, D.A.; Gnoatto, S.C.B.; Hubler, R.; Pitthan, E.; Etcheverry, L.P.; Bernardi, F.; Malfatti, C.d.F. Free-standing sodium niobate nanowires film: Morphological and chemical surface characterization. Surf. Interfaces 2024, 54, 105223. [Google Scholar] [CrossRef]
  28. Wang, S.-L.; Wang, P.-C. In situ XRD and ATR-FTIR study on the molecular orientation of interlayer nitrate in Mg/Al-layered double hydroxides in water. Colloids Surf. A 2007, 292, 131–138. [Google Scholar] [CrossRef]
  29. Xingfu, Z.; Zhaolin, H.; Yiqun, F.; Su, C.; Weiping, D.; Nanping, X. Microspheric Organization of Multilayered ZnO Nanosheets with Hierarchically Porous Structures. J. Phys. Chem. C 2008, 112, 11722–11728. [Google Scholar] [CrossRef]
  30. Orel, B.; Maček, M.; Grdadolnik, J.; Meden, A. In situ UV-Vis and ex situ IR spectroelectrochemical investigations of amorphous and crystalline electrochromic Nb2O5 films in charged/discharged states. J. Solid State Electrochem. 1998, 2, 221–236. [Google Scholar] [CrossRef]
  31. Hossain, S.; Ahmed, S. FTIR spectrum analysis to predict the crystalline and amorphous phases of hydroxyapatite: A comparison of vibrational motion to reflection. RSC Adv. 2023, 13, 14625–14630. [Google Scholar] [CrossRef]
  32. Tossici, R.; Marassi, R.; Berrettoni, M.; Stizza, S.; Pistoia, G. Study of amorphous and crystalline Li1+xV3O8 by FTIR, XAS and electrochemical techniques. Solid State Ion. 1992, 57, 227–234. [Google Scholar] [CrossRef]
  33. Shaner, S.E.; Stone, K.L. Determination of Stretching Frequencies by Isotopic Substitution Using Infrared Spectroscopy: An Upper-Level Undergraduate Experiment for an In-Person or Online Laboratory. J. Chem. Educ. 2023, 100, 2347–2352. [Google Scholar] [CrossRef]
  34. Nedjar, R.; Borel, M.; Raveau, B. H3ONb3O8 and HNb3O8: New protonic oxides with a layer structure involving ion exchange properties. Mater. Res. Bull. 1985, 20, 1291–1296. [Google Scholar] [CrossRef]
  35. Gao, B.; Xiao, X.; Su, J.; Zhang, X.; Peng, X.; Fu, J.; Chu, P.K. Synthesis of mesoporous niobium nitride nanobelt arrays and their capacitive properties. Appl. Surf. Sci. 2016, 383, 57–63. [Google Scholar] [CrossRef]
Figure 1. Flowchart of the experimental methods and characterizations carried out in this work.
Ceramics 08 00059 g001
Figure 2. X-ray diffraction results: spectrum (a) is sodium niobate; spectrum (b) is protonic niobate (2 M HNO3); spectrum (c) is protonic niobate (0.1 M HNO3).
Ceramics 08 00059 g002
Figure 3. Raman spectroscopy results: (a) sodium niobate; (b) protonic niobates.
Ceramics 08 00059 g003
Figure 4. FEG-SEM images of sodium niobate: (a) magnification 2000×; (b) magnification 10,000×; (c) magnification 40,000×.
Ceramics 08 00059 g004
Figure 5. FEG-SEM images of protonic niobate obtained after ionic exchange in 2 M HNO3: (a) magnification 2000×; (b) magnification 10,000×; (c) magnification 40,000×.
Ceramics 08 00059 g005
Figure 6. FEG-SEM images of protonic niobate obtained after ionic exchange in 0.1 M HNO3: (a) magnification 2000×; (b) magnification 10,000×; (c) magnification 40,000×.
Ceramics 08 00059 g006
Figure 7. EDS analysis: (a) sodium niobate; (b) protonic niobate (2 M HNO3); (c) protonic niobate (0.1 M HNO3).
Ceramics 08 00059 g007
Figure 8. ATR-FTIR results: (a) sodium niobate; (b) protonic niobate (2 M HNO3); (c) protonic niobate (0.1 M HNO3).
Ceramics 08 00059 g008
Figure 9. Cyclic voltammetry results for different potential windows for protonic niobate (2 M HNO3) in 1 M H2SO4 electrolyte. The arrows indicate the direction of the scan.
Ceramics 08 00059 g009
Figure 10. Cyclic voltammetry results of protonic niobate (2 M HNO3) in the operational potential window for 1 M Na2SO4 and 1 M H2SO4 electrolytes.
Ceramics 08 00059 g010
Figure 11. Images of protonic niobate (2 M HNO3) polarized in 1 M H2SO4 electrolyte: (a) before polarization; (b) polarized in the cathodic direction up to −0.7 V.
Ceramics 08 00059 g011
Figure 12. Evaluation of the reversibility behavior of protonic niobate (HNO3 2 M): 50 cycles of cyclic voltammetry of (a) 1 M Na2SO4 and (b) 1 M H2SO4.
Ceramics 08 00059 g012
Figure 13. GCD results of protonic niobate in 1 M H2SO4: (a) 2 M HNO3 (b) 0.1 M HNO3; (c) Cs conservation rate.
Ceramics 08 00059 g013aCeramics 08 00059 g013b
Figure 14. Cs retention (%) of protonic niobate obtained with 2 M HNO3 in 1 M H2SO4 electrolyte.
Ceramics 08 00059 g014
Figure 15. Electrochemical impedance spectroscopy (EIS) measurements of protonic niobate (2 m HNO3) in 1 M H2SO4 electrolyte at open circuit potential (OCP) and at −0.7 V versus Ag/AgCl: (a) Nyquist plot; (b,c) Bode plots.
Ceramics 08 00059 g015
Table 1. Cs results of the protonic niobate samples in 1 M H2SO4 electrolyte.
Current Density (j): (mA·cm−2)12345
Specific capacitance (CS) (mF·cm−2) HNO3 2 M119.8104.894.587.583.1
Specific capacitance (CS) (mF·cm−2) HNO3 0.1 M68.566.362.659.556.9
Disclaimer/Publisher’s Note: The statements, opinions and data contained in all publications are solely those of the individual author(s) and contributor(s) and not of MDPI and/or the editor(s). MDPI and/or the editor(s) disclaim responsibility for any injury to people or property resulting from any ideas, methods, instructions or products referred to in the content.

