Article

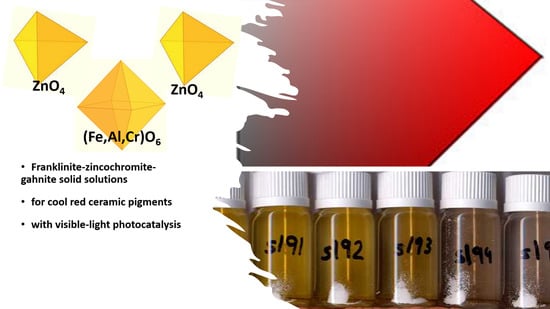
Franklinite-Zincochromite-Gahnite Solid Solutions for Cool Red Ceramic Pigments with Visible Light Photocatalysis

Department of Inorganic and Organic Chemistry, Jaume I University, Av. de Vicent Sos Baynat, s/n., 12071 Castellón, Spain
*
Author to whom correspondence should be addressed.
Ceramics 2024, 7(1), 342-363; https://doi.org/10.3390/ceramics7010022
Submission received: 11 December 2023 / Revised: 16 February 2024 / Accepted: 21 February 2024 / Published: 1 March 2024
(This article belongs to the Special Issue Advances in Ceramics, 2nd Edition)

Abstract

:
Franklinite-zincochromite-gahnite solid solutions were prepared using ceramic or coprecipitation methods, and their pigmenting capacity as cool ceramic pigments in different glazes (double and single firing frits and porcelain frit) was studied. XRD, UV–Vis–NIR diffuse reflectance, CIEL*a*b* colour analysis, band gap measurements, and the photocatalytic degradation of Orange II were carried out to characterise the samples. The following criteria for high red colouring capacity and high NIR reflectance at the minimum Cr amount were found to be the optimal compositions for an intense reddish cool pigment: Zn(Fe1.8Cr0.2), Zn(Al1.5Cr0.5) and Zn(Al1.3Cr0.5Fe0.2)O4. All the powders showed a direct semiconductor behaviour, with a band gap of approximately 2 eV, which fell in the visible range (620 nm); the visible light photocatalysis of Orange II was moderate, but franklinite-zincochromite Zn(Fe1.8Cr0.2) stood out compared with silver orthophosphate.

Graphical Abstract

1. Introduction

Spinel ferrites show interesting magnetic and pigmenting applications; red spinel was confused with rare “ruby” (Cr doped alumina) and was considered a gemstone until very recently. In the normal spinel, AB2O4 (SG. Fd-3m) with four O2− ions in FCC, the A ions occupy one-eighth of the tetrahedral sites (one per formula), and the B ions occupy half of the octahedral sites (two per formula). However, in the inverse spinel all the A ions replaced the sites with B ions (B(AB)O4) [1]. The crystal field stabilisation energy (CFSE) of the ions is used to explain the cation distribution in the structure; however, Burdett [2] proposed that the relative sizes of the s and p atomic orbitals of the ions determine their site preferences. The crystal field effects make a difference only when the size-based effect is similar. Similarly, the distribution of cations in the spinel determines the stability, thermochemistry, and physical properties of spinel solid solutions, which often exhibit complex disorder in their cationic distribution [3].
The red “Ruby Spinel” [3] is the most valuable; however, there are spinel gems of all colours, which are based on the presence of chromophores (Cr, Fe, V, Mn…) of different compositions, such as those of the spinels of zinc: gahnite ZnAl2O4, franklinite ZnFe2O4, and zincochromite ZnCr2O4.
Franklinite is a normal spinel paramagnetic in bulk form; however, in nanocrystalline thin films, it is ferrimagnetic [4]. Tanaka et al. [5] prepared antiferromagnetic zinc ferrite nanoparticles (Néel temperature of 10 K). Owing to their high refractive indices, zinc ferrites are used as magenta ceramic pigments [6], which exhibit both high thermal stability and high corrosion resistance in paints [7]. On the other hand, considering eco-friendly requirements, Calbo et al. [8] reported black ceramic pigments based on Ni(Fe,Cr)2O4 spinels; these pigments were optimised to reduce toxic and hazardous components by replacing toxic Ni with inert elements such as Mg and Zn and minimising the Cr content. Schwarz et al. [9] reported that MFe2O4 (M=Ca, Zn) pigments can be prepared from metallurgical slag industrial wastes from the production of non-ferrous metals.
Gahnite (ZnAl2O4) is a classic normal spinel that has attracted considerable attention in recent years owing to its multifunctional applications in phosphors, hydrogen generation, and catalysis. Depending on the method and growth conditions, the degree of inversion varies between 0.01 and 0.35 [10]. Granone et al. [11] studied the effect of the degree of inversion on the electrical properties of zinc ferrite and showed that the electrical conductivity of ZnFe2O4 increased with an increase in the degree of inversion. Quintero et al. [12] investigated the effects of inversion on the magnetic properties of zinc ferrite.
The synthesis of zincochromite (ZnCr2O4) by a solid-state reaction requires elevated temperatures for several hours. Peng et al. [13] synthesised nanoparticles (particle size < 5 nm) of zincochromite via a hydrothermal route, which showed apparent photocatalytic activity on methylene blue under UV irradiation. Subsequently, Mousavi et al. [14] synthesised ZnCr2O4 nanoparticles using a coprecipitation method and confirmed their photocatalytic activity on anionic dyes such as eosin-Y and phenol red under UV light irradiation.
Cool pigments show high reflectance in the NIR region (700–2500 nm, the heat production region); therefore, their coatings reflect heat on sunny days, avoiding energy expenditure in the conditioned air. When the light is incident light, both diffuse and specular reflections occur. Diffuse reflection is the result of subsurface scattering; hence, it depends on the concentration of light-absorbent species (associated with charge transfer and d-d transitions of metal ions in lattice environments, which ideally do not have wavelengths > 700 nm) or on the stretching and deformation modes of the functional groups (vibrations of supported species), i.e., of the specific composition and crystallographic structure. On the other hand, the ideal reflective particle size in the NIR region should be around 0.35–1.25 μm, which is more than half the light wavelength to be reflected (700–2500 nm) [15]. Preferably, the IR emittance of a cool pigment should be high to promote the radiative cooling of the material in which it is embedded [16].
The greenhouse gas emissions associated with the primary energy consumption of buildings contribute to climate change [6]. The reflectance of a specific surface depends largely on the colour in the visible range: light colours are cool, and dark colours are warm. Visible light comprises only 43% of sunlight; approximately 50% of solar radiation is near-infrared radiation (NIR), and the reflectance of this radiation is not dependent on colour [17].
Photocatalysts utilise light energy to perform the oxidation and reduction reactions. In order for a photocatalyst to effectively absorb visible solar energy, a maximum band gap of 3.1 eV (400 nm) is required. TiO2 shows a wide band gap (3.03 eV rutile and 3.18 eV anatase) and absorbs a small portion of sunlight. There are two approaches in which visible light irradiation can be utilised by photocatalysts: (a) the doping of a UV-active photocatalyst with elements that narrow the band gap (C, S, N, Si, or heavy metals Co, Ag, Pt, Ru, etc., are used as dopants for TiO2) [18] and (b) the development of materials that have a narrow band gap that falls in the visible range, such as the ferrites ZnFe2O4, ZnCr2O4, or Zn(Al,Fe)2O4 [19].
In effect, ferrites offer several advantages as photocatalysts: (a) they have a band gap capable of absorbing visible light; (b) they have a spinel crystal structure, which enhances efficiency owing to the available extra catalytic sites; (c) they have magnetic properties, when used alone as photocatalysts or in combination with others; therefore, they can be easily separated from the reaction mixture; (d) to enhance the production of reactive oxygen species, oxidants such as H2O2 are added to the reaction mixture for a Fenton-type system, and they are used as solid iron compounds to replace soluble Fe2+ in traditional Fenton-type systems; and (e) combined with TiO2, the composite photocatalyst shows higher efficiency and becomes effective under visible light irradiation, whereas TiO2 alone is effective only under UV light [19].
Therefore, although solid solutions of Al, Cr, and Fe in zinc spinel have been widely studied in electrical, magnetic, paint (anti-corrosion paints, pink or brown ceramic pigments), and photocatalytic applications, to the best of our knowledge there is no a systematic study in the literature for the optimisation of the red coloration of binary and ternary solid solutions in glazes of increasing aggressiveness (using the red of cadmium sulfoselenide encapsulated in zircon as a reference) or for the maximisation of NIR reflectance with the minimum presence of toxic Cr (in order to obtain ecofriendly cool pigments). There has also not been a systematic study of the possibilities of the optimised solid solutions obtained as visible light photocatalysts when compared with silver orthophosphate as a reference.
In this study, the compositions of binary franklinite-zincochromite Zn(Fe,Cr)2O4 or gahnite-zincochromite Zn(Al,Cr)2O4 and ternary Zn(Al,Fe,Cr)2O4 spinel solid solutions were optimised for their cation distribution and composition as cool ceramic pigments, with the following criteria: (a) high colouring capacity in ceramic glazes of increasing aggressiveness (associated with visible light absorptions of the pigment), using the red of cadmium sulfoselenide encapsulated in zircon as a reference; (b) high NIR reflectance (associated with near-infrared light absorption of the pigment, independently of the colour); and (c) the minimum amount of toxic chromium in order to obtain ecofriendly cool pigments. The resulting optimal compositions were studied as photocatalysts for Orange II under visible light.

2. Materials and Methods

2.1. Samples Preparation

The solid state or ceramic procedure and the ammonia coprecipitation method have been used for the synthesis of solid solutions. The ceramic method was employed for the franklinite-zincochromite Zn(Fe,Cr)2O4 solid solutions, and ammonia coprecipitation was used for the gahnite-zincochromite Zn(Al,Cr)2O4 and ternary spinel Zn(Al,Fe,Cr)2O4. With the ceramic method (CE), the respective oxides, with particle sizes between 0.3 and 5 µm, were employed as precursors (ZnO, hematite Fe2O3, eskolaite Cr2O3, and aluminium oxohydroxide AlO(OH), supplied by ALDRICH (99 wt.% quality). The precursors were mechanically homogenised in an electric grinder (20,000 rpm) for 5 min. The mixture was then fired at the corresponding temperature and soaking time. With the coprecipitation method (CO), the soluble precursors and the nitrates of the corresponding cations (Zn(NO3)2·6H2O, Fe(NO3)3·9 H2O, Cr(NO3)·9H2O, and Al(NO3)3·6H2O, supplied by ALDRICH (99 wt.% quality)) were solved in 200 mL of water for the preparation of 10 g of the final product; then, 30% ammonia was dropped in while the temperature of 70 °C was maintained, with continuous stirring until gelation of the mixture occurred (around pH 6 for the samples with aluminium). The gel was aged for 24 h at room temperature and then dried in an oven at 110 °C. Finally, the dried gels were fired at the corresponding temperatures and soaking times (3 h and 1 h for the CE and CO samples, respectively). The coprecipitation route produces homogeneous and nanoparticulate precursors with high reactivity; therefore, at a relatively low temperature and soaking time, the solid reaction is completed, and the reaction product crystallises [17].

2.2. Samples Characterisation

X-ray diffraction (XRD) was performed with a Siemens D5000 diffractometer (München, Berlin, Germany) using Cu Kα radiation (10–70°2θ range, scan rate 0.02°2θ, 4 s per step and 40 kV and 20 mA conditions). From the (°2θ) positions of the diffraction peaks, the volume of the cubic cell (a3) was calculated using Equation (1):
1 d 2 = h 2 + k 2 + l 2 a 2
where d is the interplanar distance of the respective (hkl) lattice plane, obtained from °2θ using Bragg’s law, and a is the cubic cell edge.
The L*a*b* colour parameters of the powders and glazed samples were measured by the CIE-L*a*b* (“Commission Internationale de l’Éclairage”) colorimetric method using an X-Rite SP60 spectrometer (X-Rite Europe GmbH, Regensdorf, Switzerland) with standard lighting D65 and a 10° observer. With this method, L* measures the lightness (100 = white, 0 = black) and a* and b* of the colour parameters (−a* = green, +a* = red, −b* = blue, +b* = yellow) [20].
The UV–Vis–NIR spectra of both the fired powder and the glazed samples were collected with a Jasco V670 spectrometer (JASCO, Tokyo, Japan) using the diffuse reflectance technique, which provides data in absorbance or reflectance units (R (%)). The band gaps of the samples were estimated using the Tauc method [21]. The total solar reflectance R, the solar reflectance in the NIR range RNIR, and the solar reflectance in the visible range RVis were evaluated from the UV–Vis–NIR spectra using the diffuse reflectance technique, as the integral of the measured spectral reflectance and the solar irradiance divided by the integral of the solar irradiance in the corresponding wavelength range of R (350–2500 nm), RVis (350–700 nm), and RNIR (700–2500 nm), using Equation (2):
R = 350 2500 r λ i λ d λ 350 2500 i λ d λ
where r(λ) is the spectral reflectance (Wm−2) measured by UV–Vis–NIR spectroscopy, and i(λ) is the standard solar irradiation (Wm−2 nm−1) according to [22].
The photoactivity of the powders was evaluated based on the degradation of the azo dye Orange II (OII) in an aqueous solution. The photocatalytic tests were carried out by adding a catalyst loading of 0.5 g/L to an OII solution of 0.6 × 10⁻⁴ mol/L, which was prepared by dissolving Orange II (C16H11N2NaO4S) in a pH 7.42 phosphate buffer medium (NaH2PO4, H2O 3.31 g and Na2HPO4·7H2O 33.77 g solved in 1 L of water). The irradiation source was a white LED lamp (Philips, 19 W, 1300 lumens) with an estimated irradiance of 70 mW/cm2. Before measurement, the suspensions were stirred in the dark for 15 min to reach sorption/desorption equilibrium. The evolution of the reaction was followed by sampling every 15 min. The Orange II concentrations in the different samples were determined using UV–Vis spectroscopy at 485 nm. Coprecipitated Ag3PO4 [23] was used as a reference for comparison with the home-prepared samples. Similarly, a test with the red ceramic pigment used as a reference ((S0.5Se0.5)Cd@ZrSiO4, supplied by FERRO SP) was also carried out.
The photocatalytic degradation followed the Langmuir–Hinshelwood model of heterogeneous catalysis, which considers the reaction between two species adsorbed on the catalyst (adsorbates); the so-called Eley–Rideal model postulates the reaction between an adsorbate and an incoming molecule [24].
The microstructures of the samples were characterised by scanning electron microscopy (SEM) using a JEOL 7001F electron microscope (JEOL, Tokyo, Japan) and by transmission electron microscopy (TEM) using a 2000 kV JEOL JEM 2100 (using the conventional preparation and imaging techniques). The chemical composition and homogeneity of the corresponding sample were determined by semi-quantitative elemental analysis using an EDS analyser (supplied by Oxford University) attached to the SEM microscope.

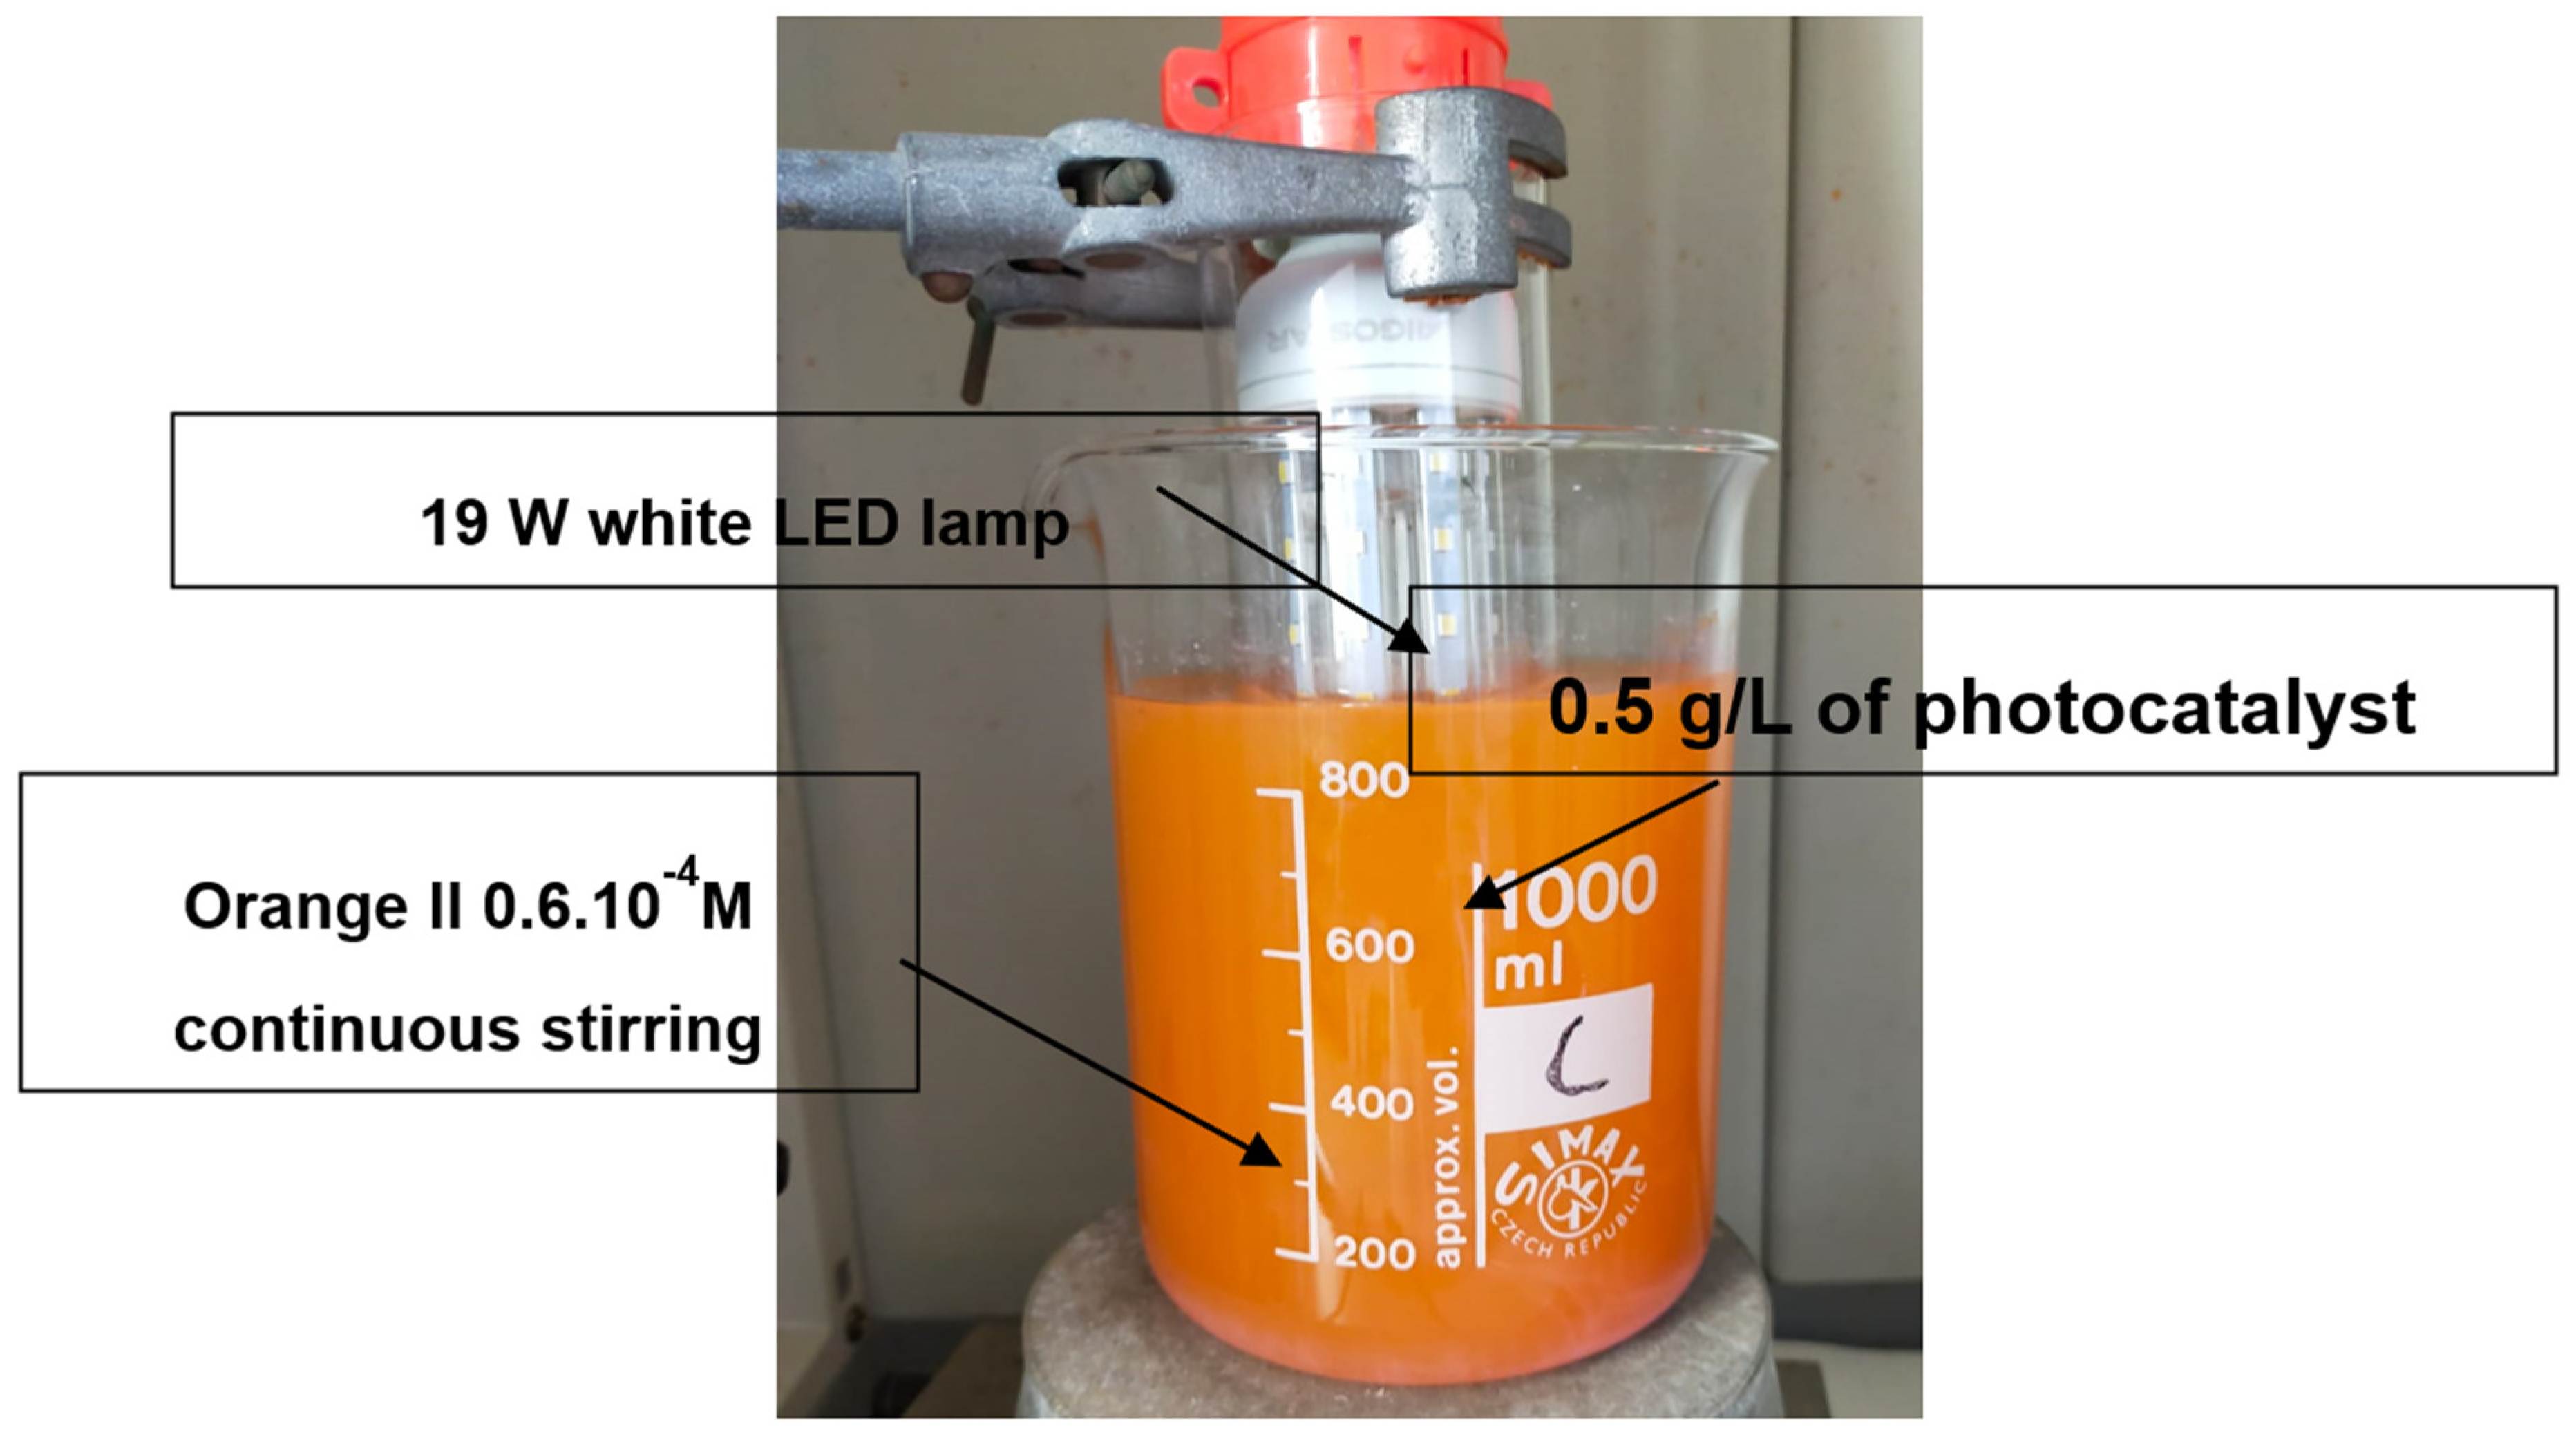
2.3. Application of Pigments

The colouring capacity of the corresponding pigment was studied in three matrices: (a) 5 wt.% glazed in double firing frit with some lead (6 wt.% PbO), 1000 °C of maturation point; (b) 5 wt.% glazed in single firing frit, 1080 °C; and (c) 5 wt.% glazed in porcelain single firing frit, 1200 °C. The oxide composition of the frits is summarised in Table 1.
The glazed samples were prepared using substrates of white stoneware tiles coated with glaze prepared by manual mixing of the frit, pigment, and water at a weight ratio of 97:3:40 in an agata mortar, with a thickness of (~1500 μm), using the doctor blade technique. Molten glazes attack pigment particles by dissolving or reacting with them, resulting in the degradation or alteration of the colour. The aggressiveness of the glaze increases with the maturation temperature and chemical composition (increases in sequences a, b, and c in Table 1). A good ceramic pigment should maintain its pigmentation capacity in aggressive glazes.

3. Results and Discussion

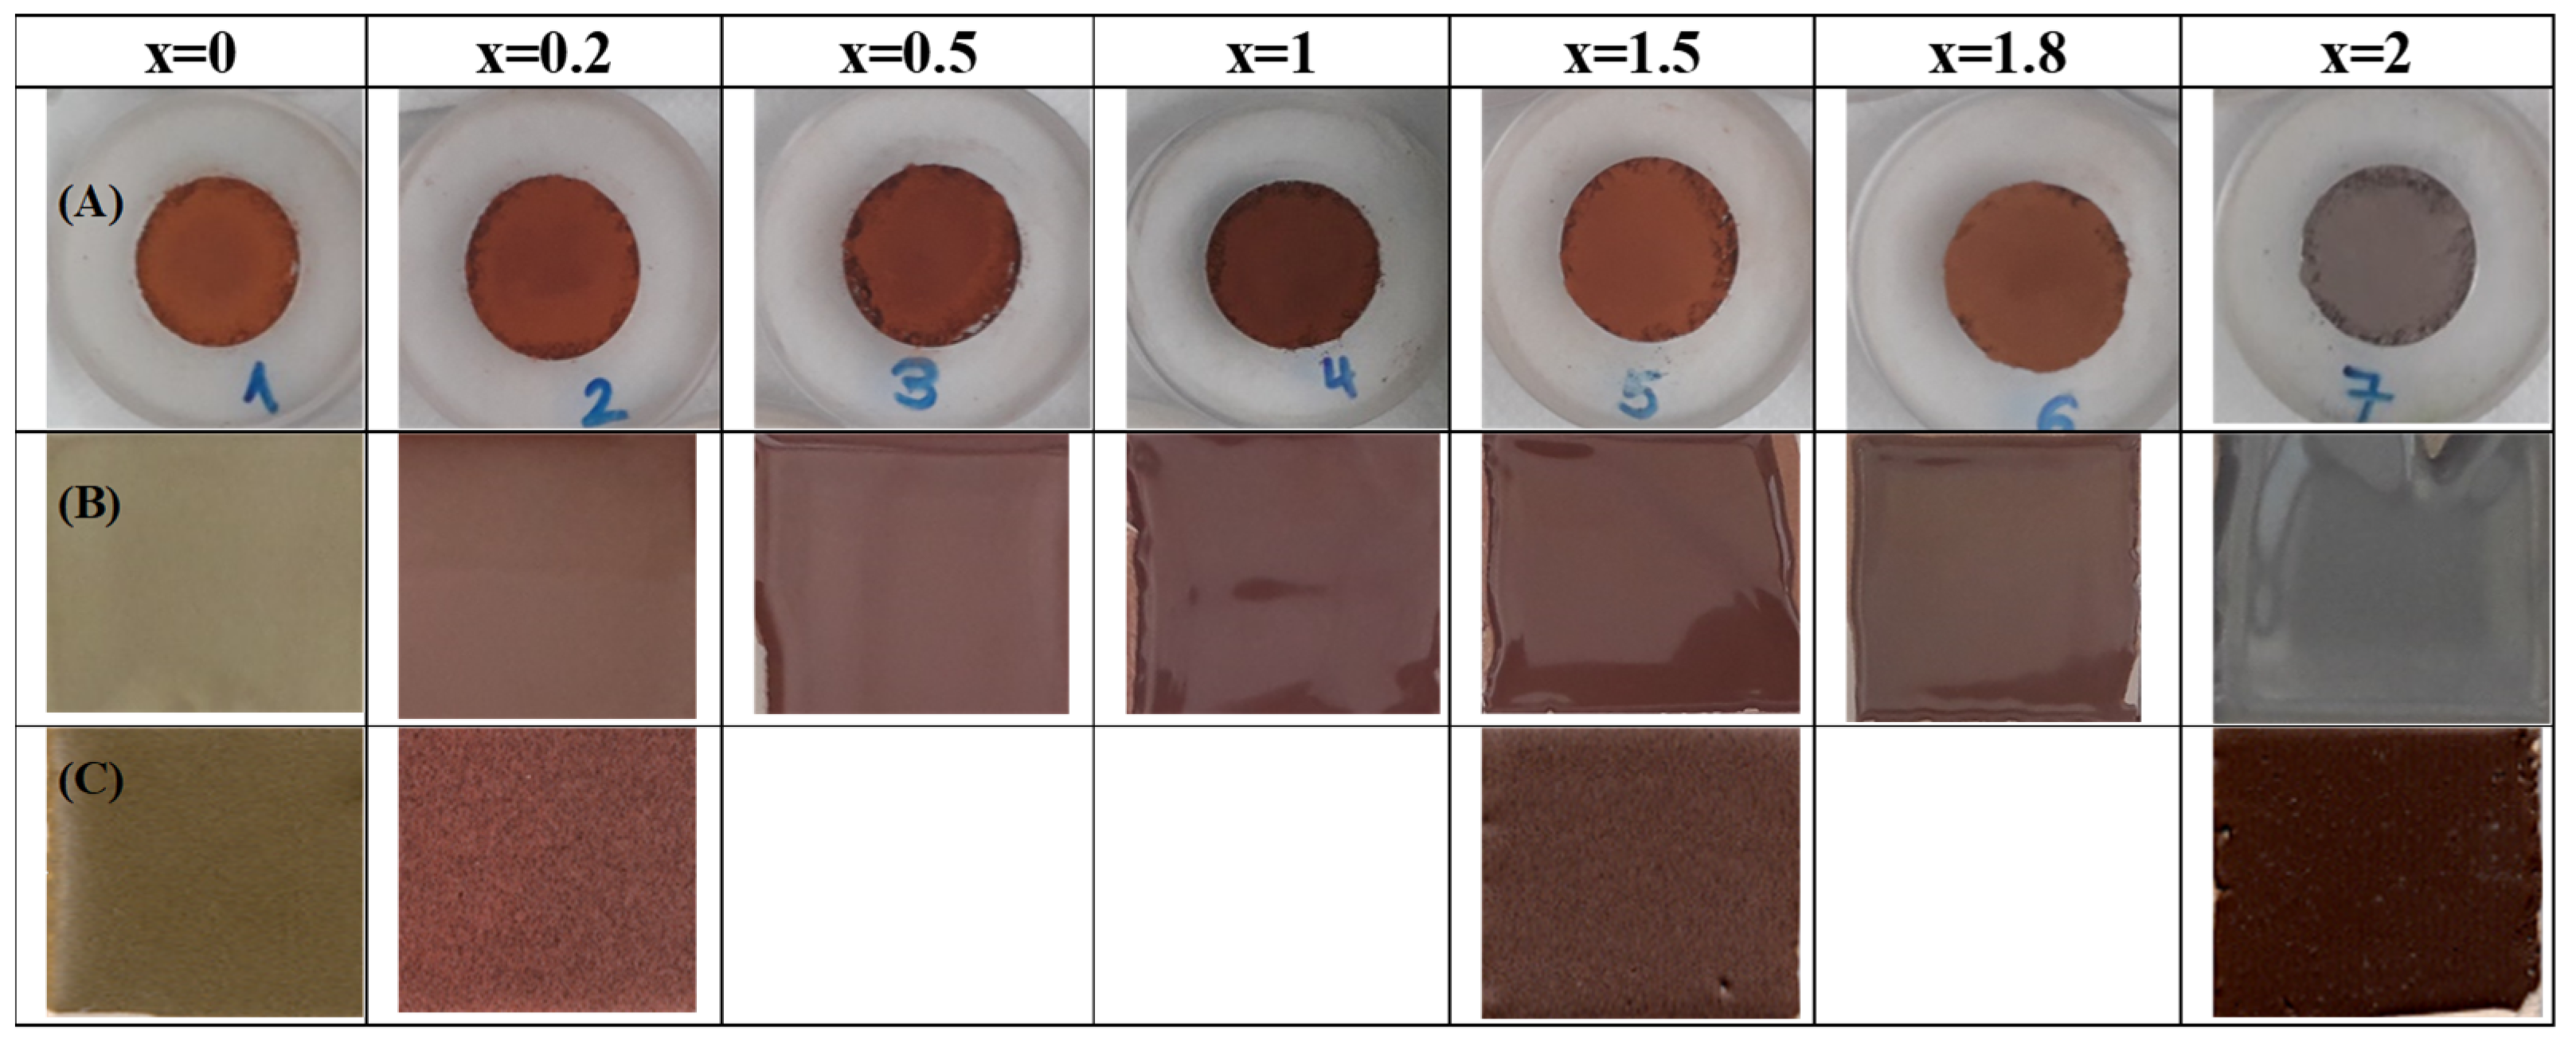
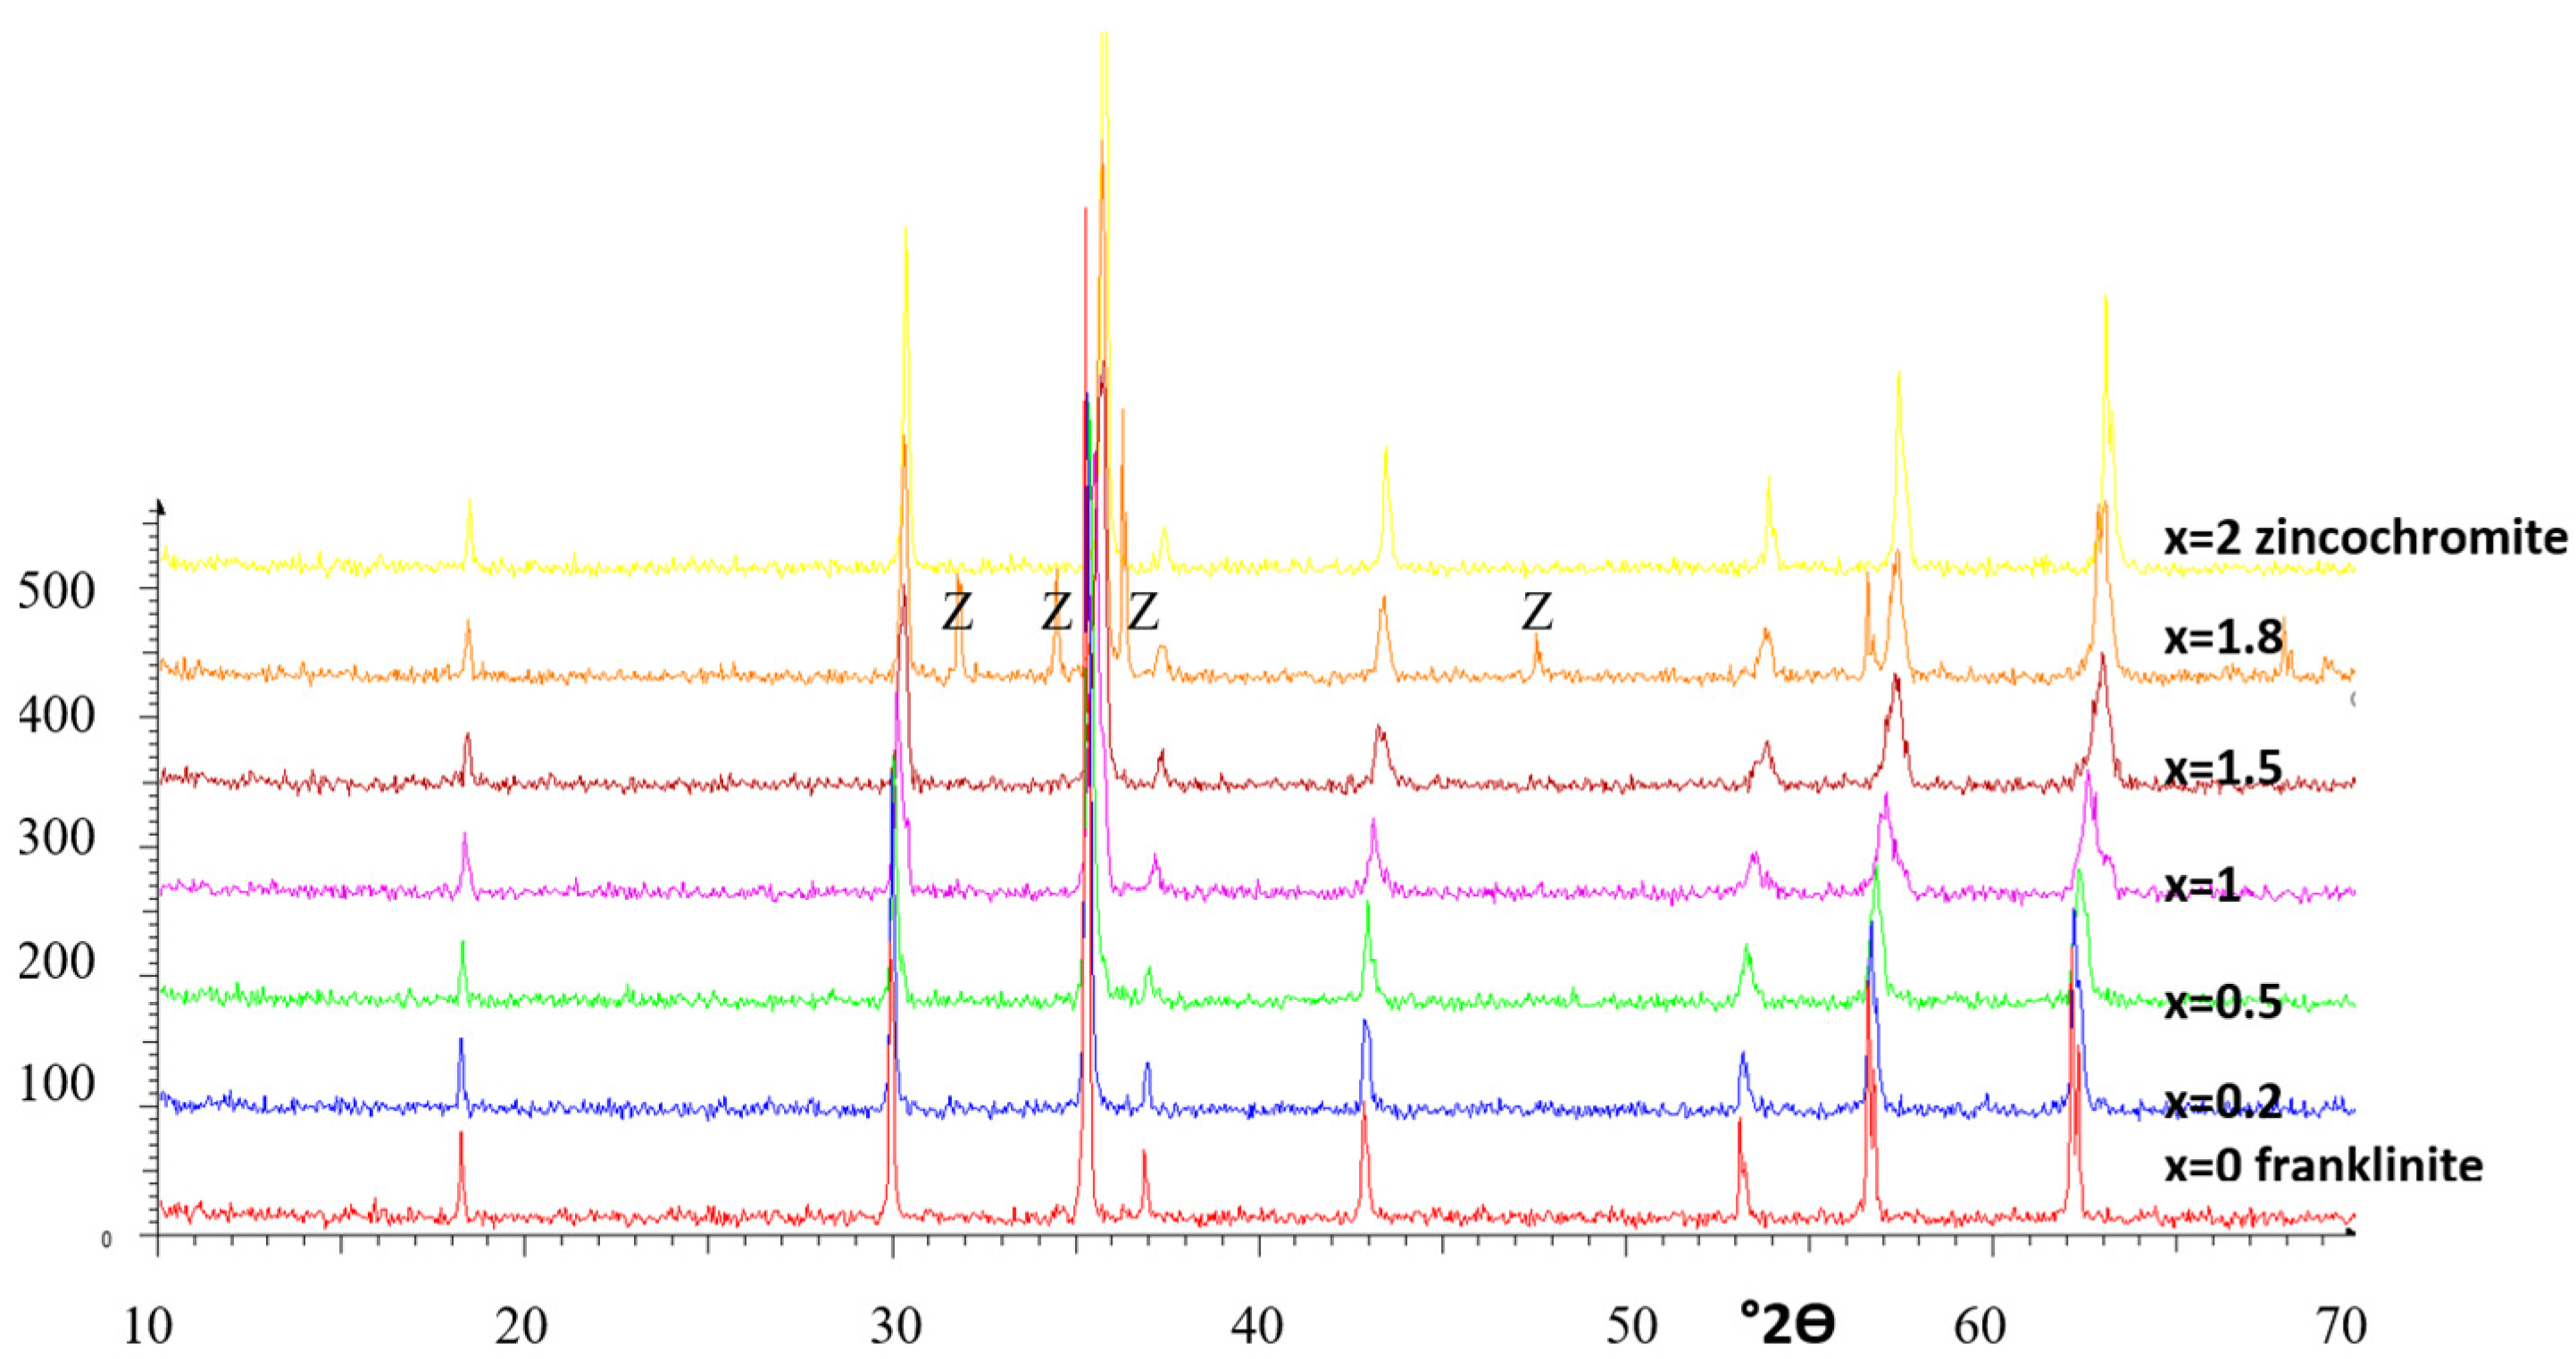
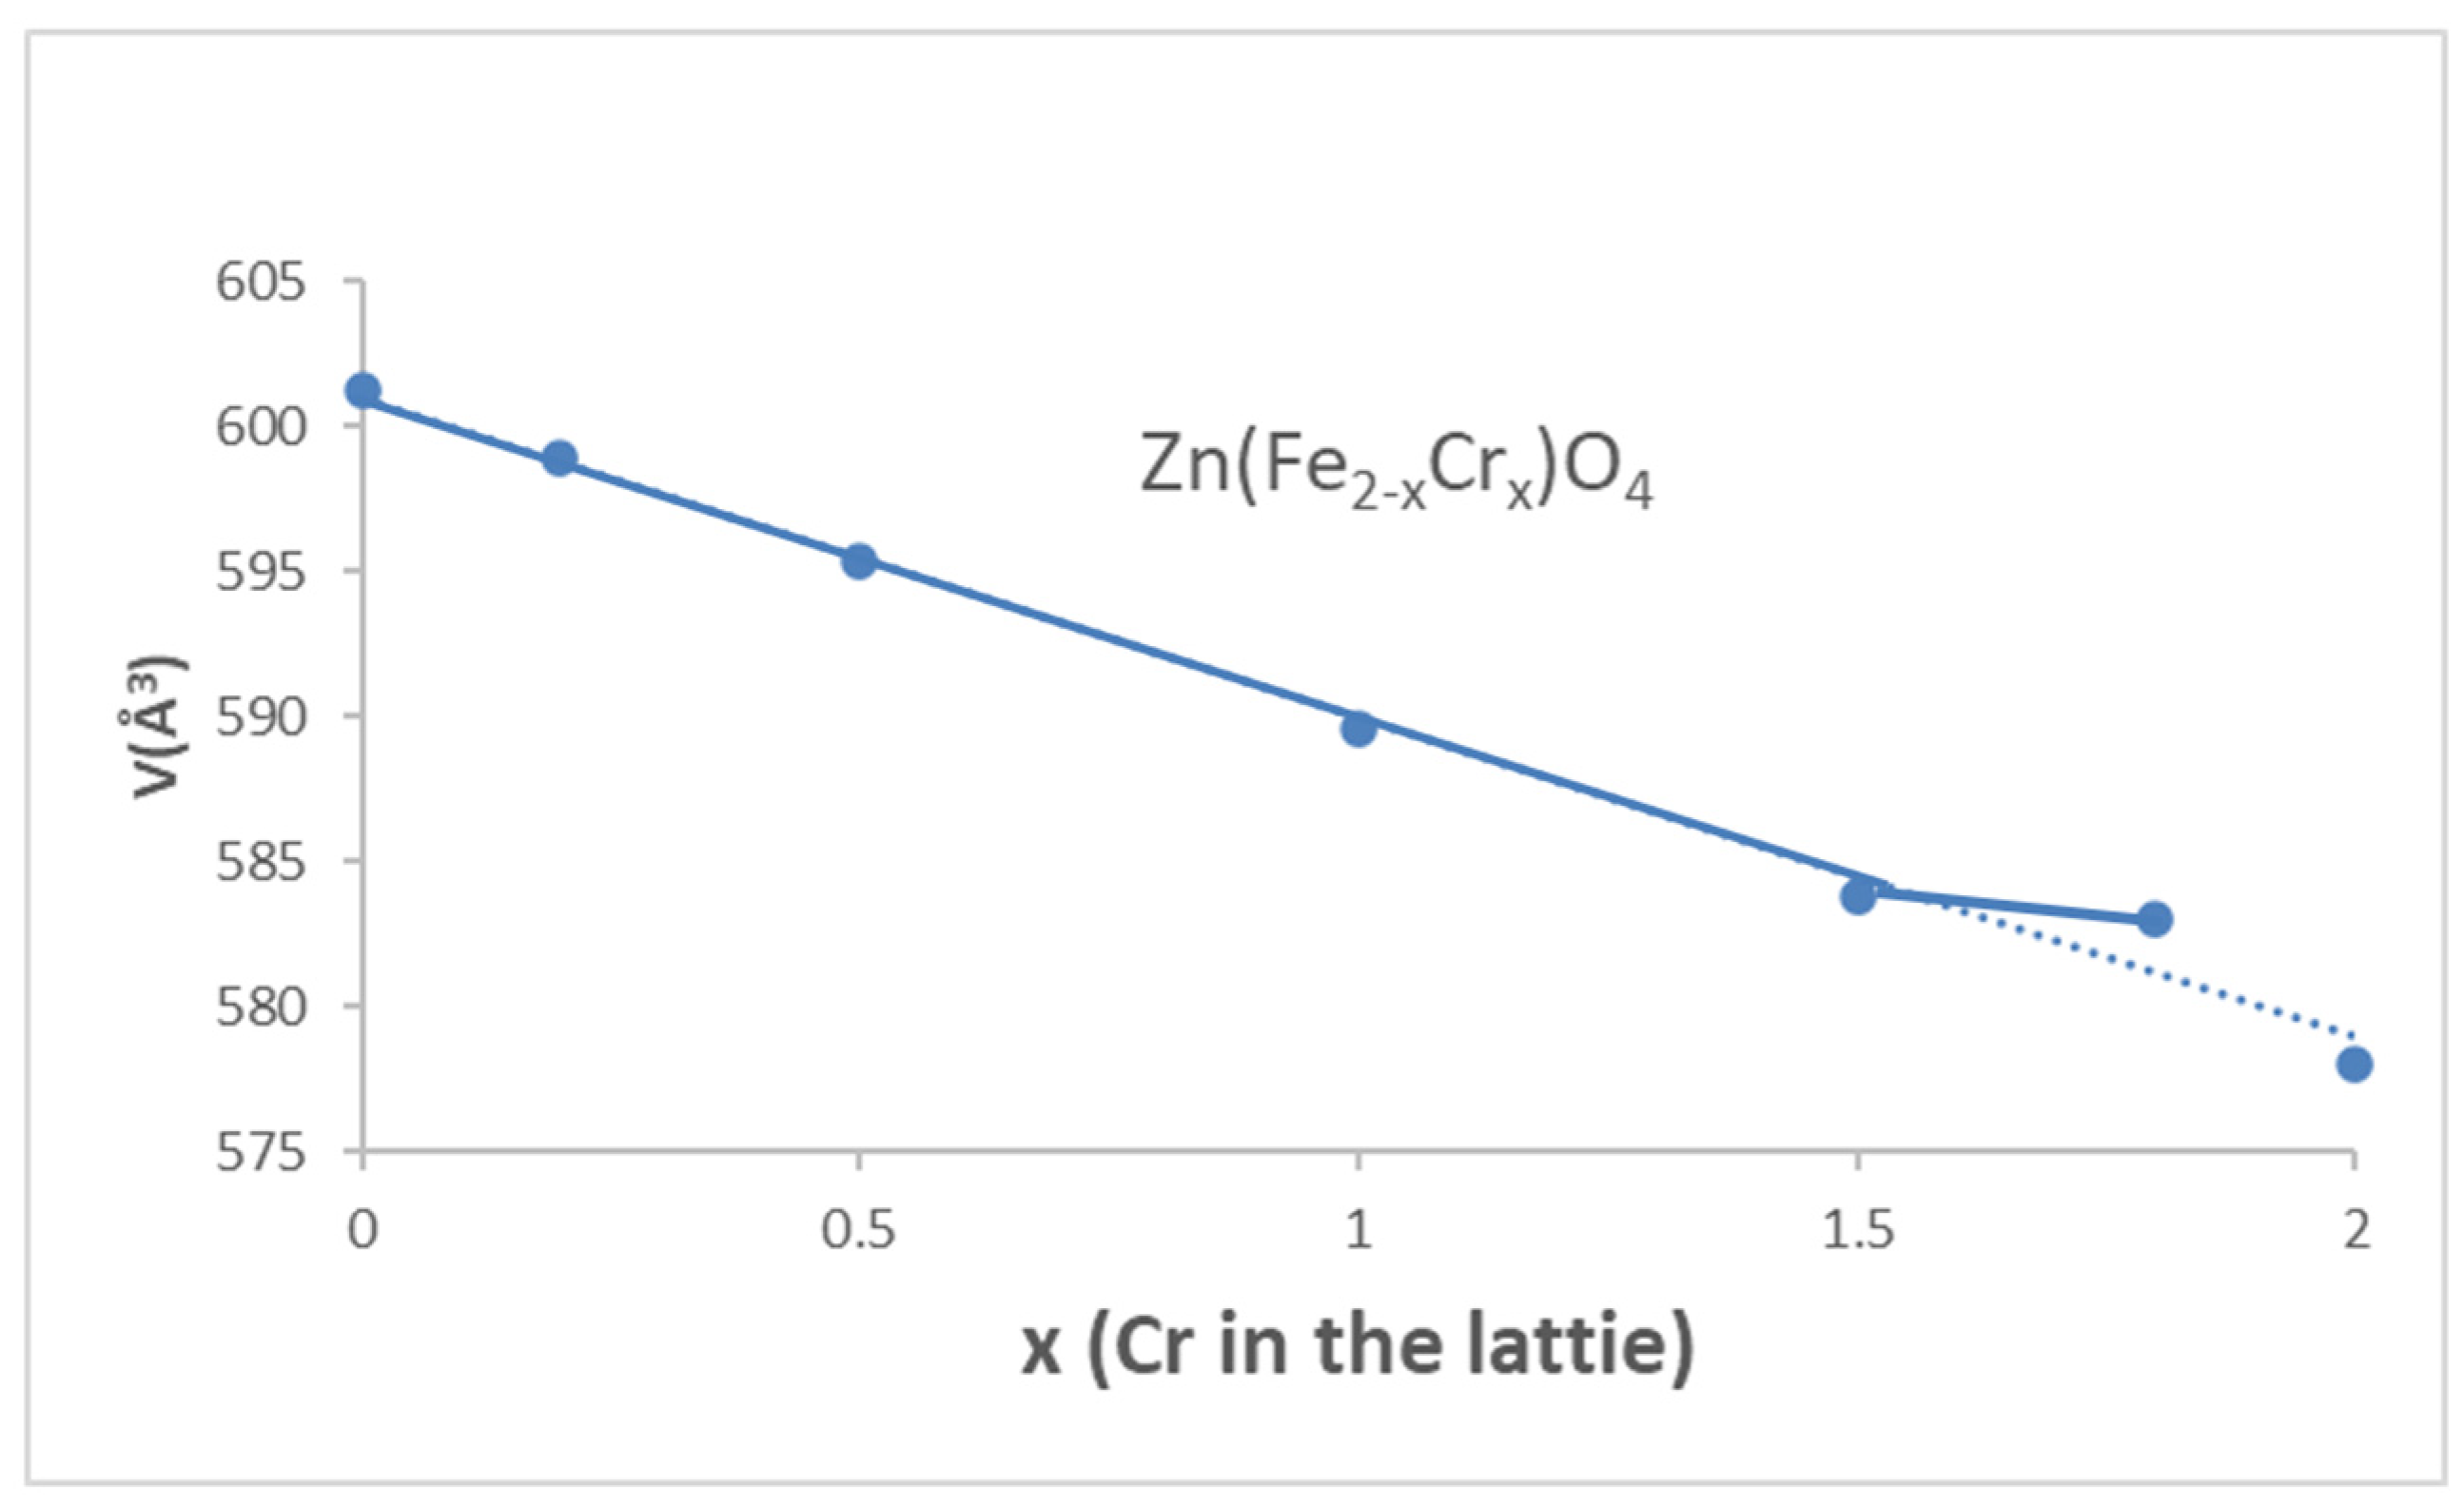
3.1. Franklinite-Zincochromite Zn(Fe2−xCrx)O4 Solid Solutions

Figure 1 shows the franklinite-zincochromite Zn(Fe2−xCrx)O4 solid solutions synthesized at 1000 °C for 3 h and 5 wt.% glazed in a single firing frit (1080 °C) and a porcelain single firing frit (1200 °C). The CIEL*a*b* values and reflectance characteristics of the samples are presented in Table 2.
Red colours (a* parameter higher than 20) were obtained, except for x = 2, corresponding to pure zincochromite, which shows a grey shade due to the absence of iron in the composition.
The glazed samples also show red shades (a* between 17 and 23), except for x = 0 (pure franklinite, yellow-coloured) and x = 2 (pure zincochromite, grey-coloured). The solid solution of the two chromophores (Cr3+ and Fe3+) stabilises the spinel lattice and maintains its identity and colour in the molten glaze, which usually reacts with simple franklinite or zincochromite to produce the gahnite reacting with the Al3+ of the glaze (24):
Al3+(glaze) + ZnFe2O4 → ZnAl2O4 + Fe3+(glaze, yellow shade)
Al3+(glaze) + ZnCr2O4 → ZnAl2O4 + Cr3+(glaze, green shade)
In the porcelain frit at 1200 °C, all the samples darkened and showed a low red parameter a*, indicating the destabilisation of the pigments at this relatively high temperature and aggressive glaze medium. The darkened behaviour can be associated with the Cr enrichment of the spinel phase by the reaction with the porcelain glaze, as reported by Verger et al. [25]:
Zn(Fe2−xCrx)O4 → x/y[ZnFe2−yCryO4] +(1 − x/y)[ZnFe2O4]
The best red colour in the single firing frit at 1080 °C was x = 0.2 with L*a*b* = 37.5/23.4/28.9, with a balanced distribution of cations in the solid solution that maximised its stability.
Figure 2 shows the X-ray diffractograms (XRD) of the franklinite-zincochromite Zn(Fe2−xCrx)O4 solid solutions synthesised at 1000 °C for 3 h. A single phase associated with the corresponding cubic spinel was detected in all the samples, except for x = 1.8, which exhibited weak peaks associated with ZnO (Z in Figure 2), indicating the saturation of the solid solution of Cr3+ in franklinite under the experimental conditions. It can be observed that the diffraction peaks shift to the higher °2ϴ degrees associated with a decrease in the interplanar distances d in Equation (1), in accordance with the replacing of the bigger Fe3+ (Shannon–Prewit radius in octahedral site = 1.03 Å) by the smaller Cr3+ (0.755 Å); then, a decrease in the cubic cell edge of the spinel with x is detected. In effect, from Equation (1), the cell volume evolution with x (Figure 3) shows that the cell volume decreases progressively with x, rigorously accomplishing Vegard’s law [26], except for the saturated solid solution at x = 1.8. The absence of residual iron oxide in the x = 1.8 diffractogram can be explained by the reduction of some Fe3+ to Fe2+, which is located in the tetrahedral site of the spinel (Shannon–Prewit radius in octahedral site = 0.77 Å), replacing Zn2+ (0.74 Å) and attenuating the decrease associated with the replacement of Fe3+ by Cr3+ [26].
Figure 4 shows the UV–Vis–NIR diffuse reflectance spectra of the franklinite-zincochromite Zn(Fe2−xCrx)O4 solid solutions. In the case of the powders fired at 1000 °C for 3 h (Figure 4A, the spectra are similar, except for x = 1.8 and 2, which are associated with ZnO segregation at x = 1.8 and the absence of iron at x = 2 (pure zincochromite), respectively. The reflectance decreases from 54% for x = 0 to 32% for x = 2 in the NIR range (Table 2). For the x = 0 sample (franklinite), 2 intense absorbance bands (minima of reflectance) centred at 1180 and 770 nm with a wide band of absorption between 400 and 500 nm are detected and are associated with the 6A1g(S) → 4A1g,4E(G) transition, which overlaps with the charge transfer band at 400–500 nm of Fe(III) in an octahedral coordination. With the entrance of Cr, the band at 1180 nm shifts to a lower wavelength, and two bands at 720 and 680 nm appear. Finally, for x = 2 (zincochromite), the bands at 1180 and 790 nm disappear, and reflectance minima associated with octahedral Cr(III) are detected at 680, 570, 440, and 250 nm, respectively. The bands at 770 and 1200 nm are typical characteristics of zinc ferrite and are attributable to 6A1g(S) → 4T2g(G) and 6A1g(S) → 4T1g(S) for the d-d electron transition of Fe3+. These Fe3+ bands overlap with those of Cr3+ in an octahedral coordination, namely: (a) three main parity-forbidden transitions (4A2(4F) → 4T2(4F) at 570 nm and 4A2(4F) → 4T1(4F) at 440 nm, which partially overlap, and 4A2(4F) → 4T2(4P) at 240 nm, which overlaps with the Cr3+-O2− charge transfer) and (b) two weak Cr3+ spin-forbidden transitions A2(4F) → 2T1(2G) and 4A2(4F) → 2E(2G), which overlap at 670 and 710 nm [6,17].
In the case of the 5 wt.% glazed samples in a single firing frit at 1080 °C (Figure 4B), this behaviour is similar to that of the powders; the reflectance decreased with x from 48% for x = 0 to 32% for x = 2 (Table 2). The NIR reflectance of pure franklinite (x = 0) significantly decreased in the glaze, indicating destabilisation of the franklinite particles by the exsolution of iron in the interaction with the melting glaze, as described above. The entrance of chromium into the lattice increases the stability of the pigment and its resistance to glaze attack, as discussed above for the franklinite-zincochromite solid solutions. In the case of the colour behaviour (associated with RVis), this effect produces the best results for x = 0.2 (a* = 23.4, Table 2), and in the case of the cooling behaviour (associated with RNIR), this effect produces the best result for x = 0.1 (RNIR = 49%, Table 2). This indicates the need to consider the interaction of the ceramic pigment particles with the matrix to optimise both the colour and the cooling behaviour.
Considering the criteria of the high colouring capacity and high NIR reflectance at the minimum Cr amount, the x = 0.2 sample results in the optimal composition for a red cool pigment based on the franklinite-zincochromite system.

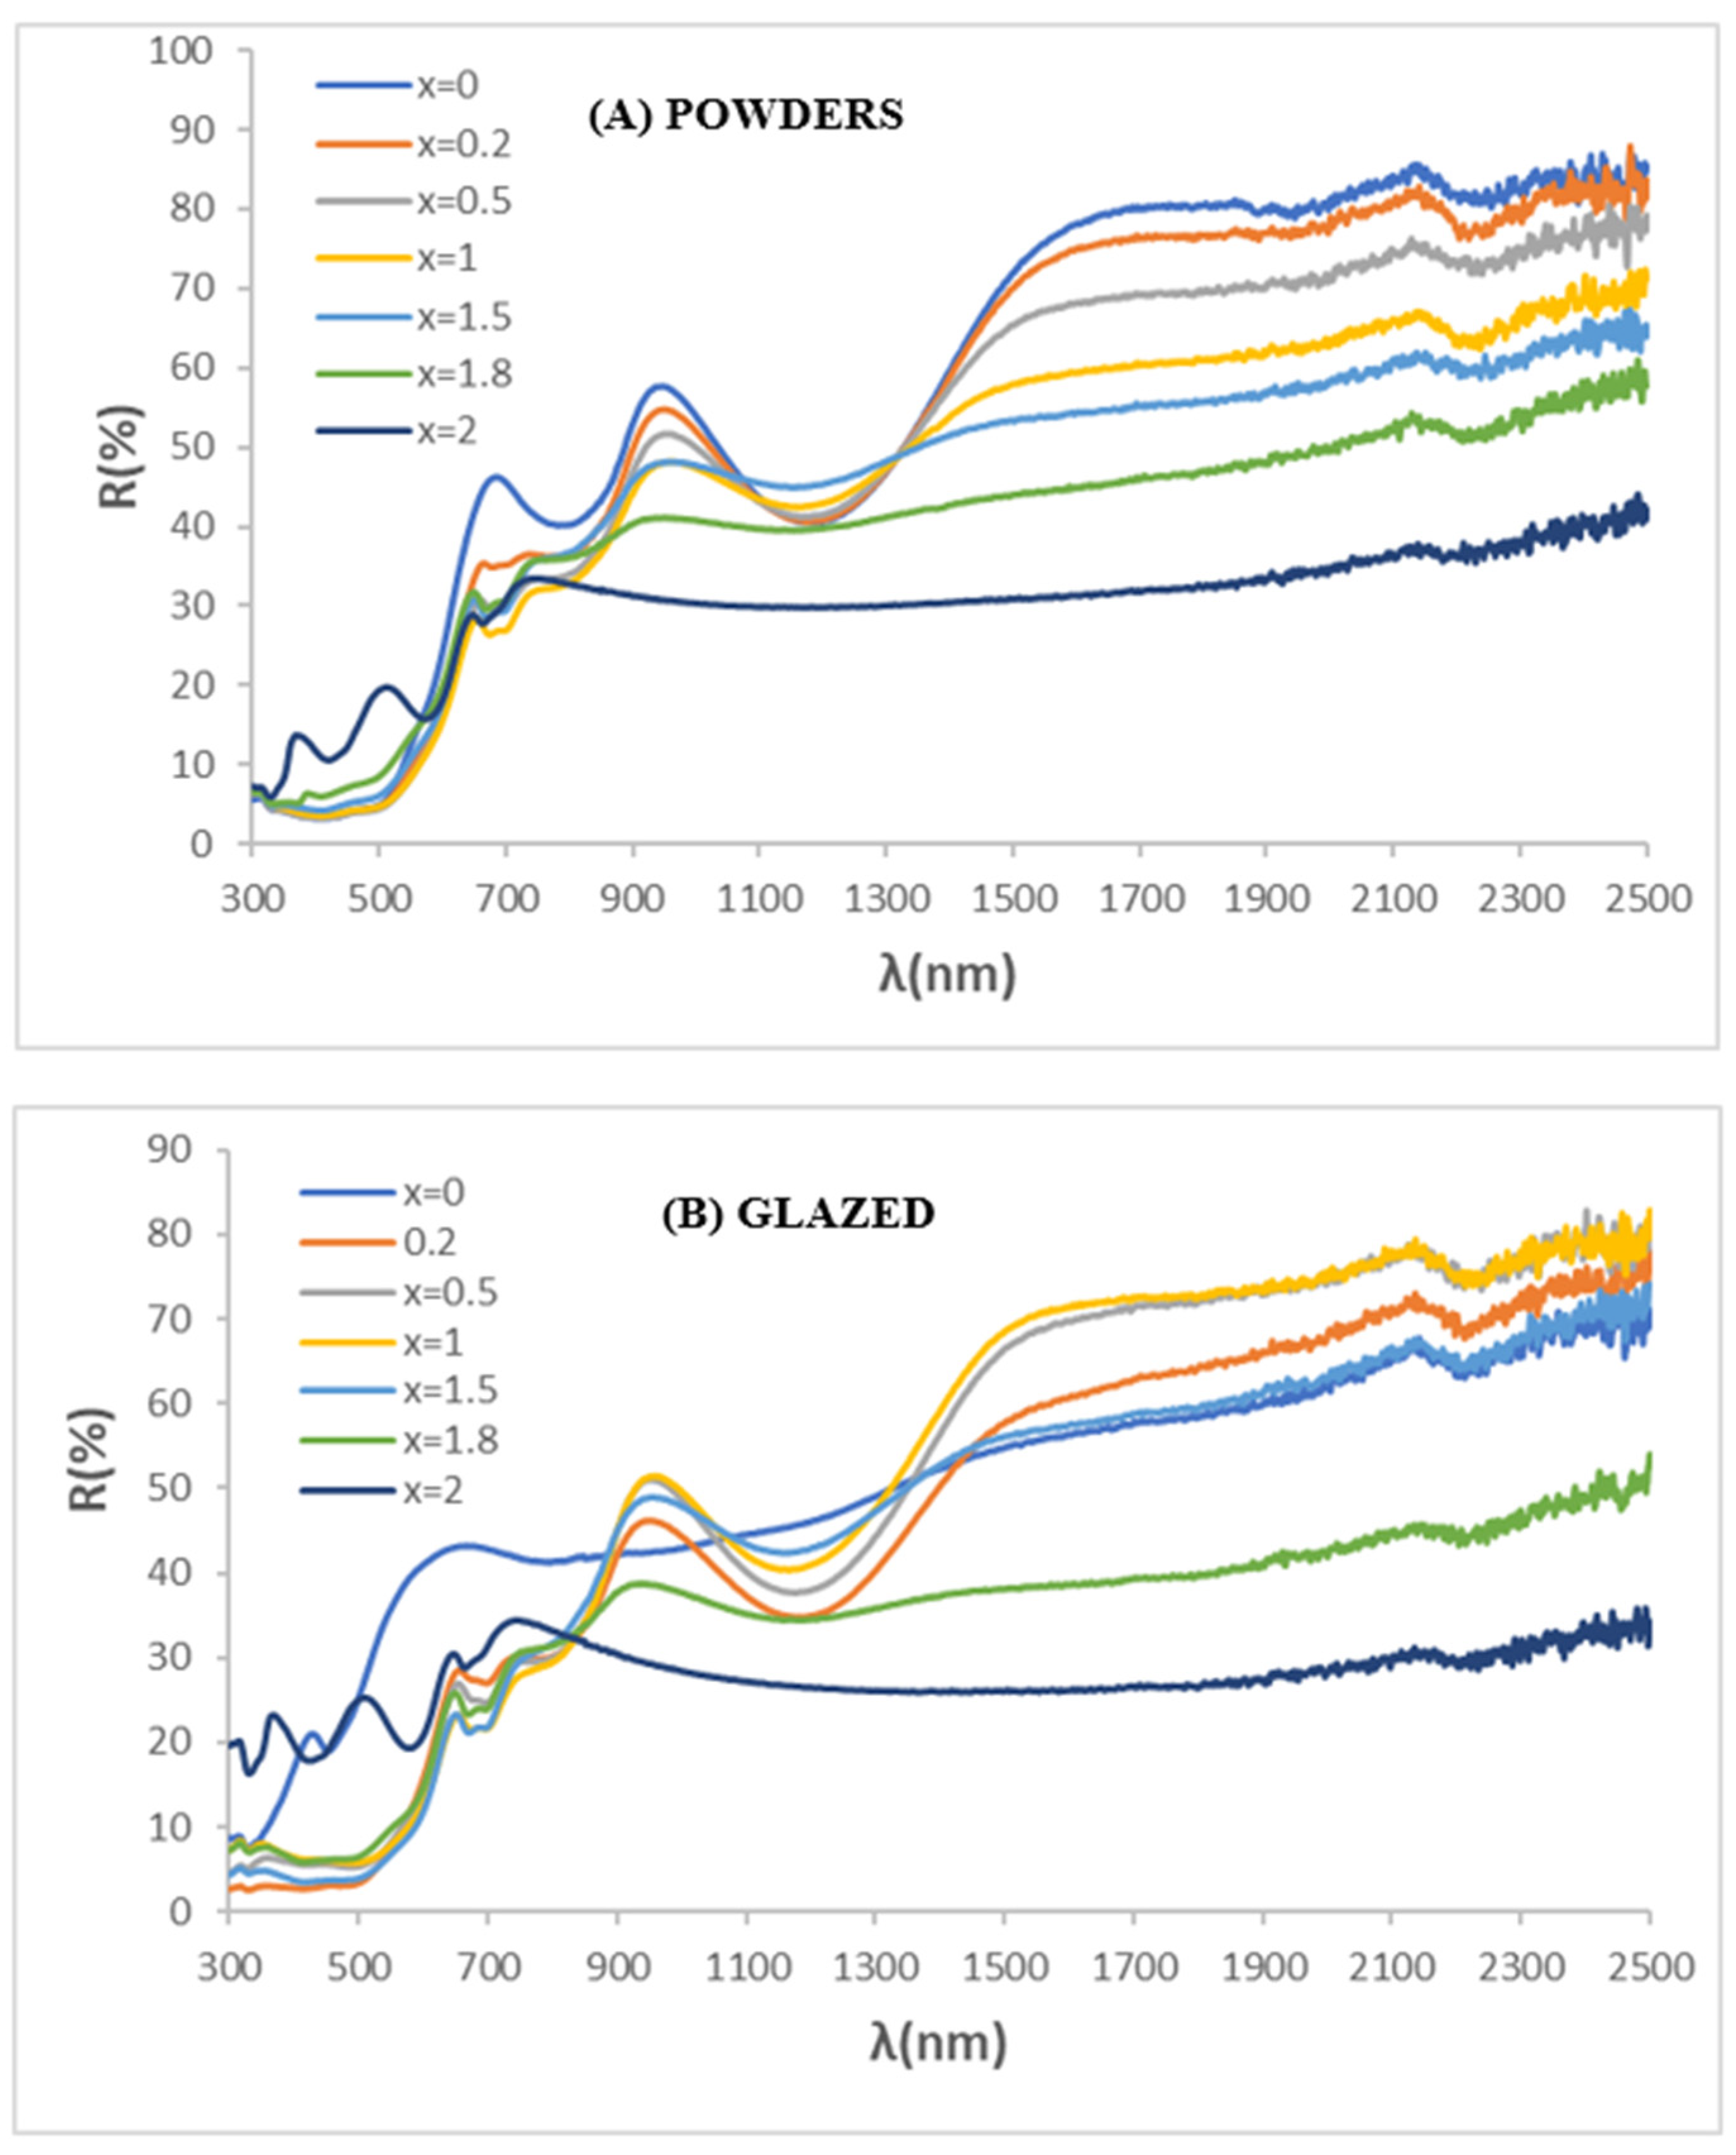
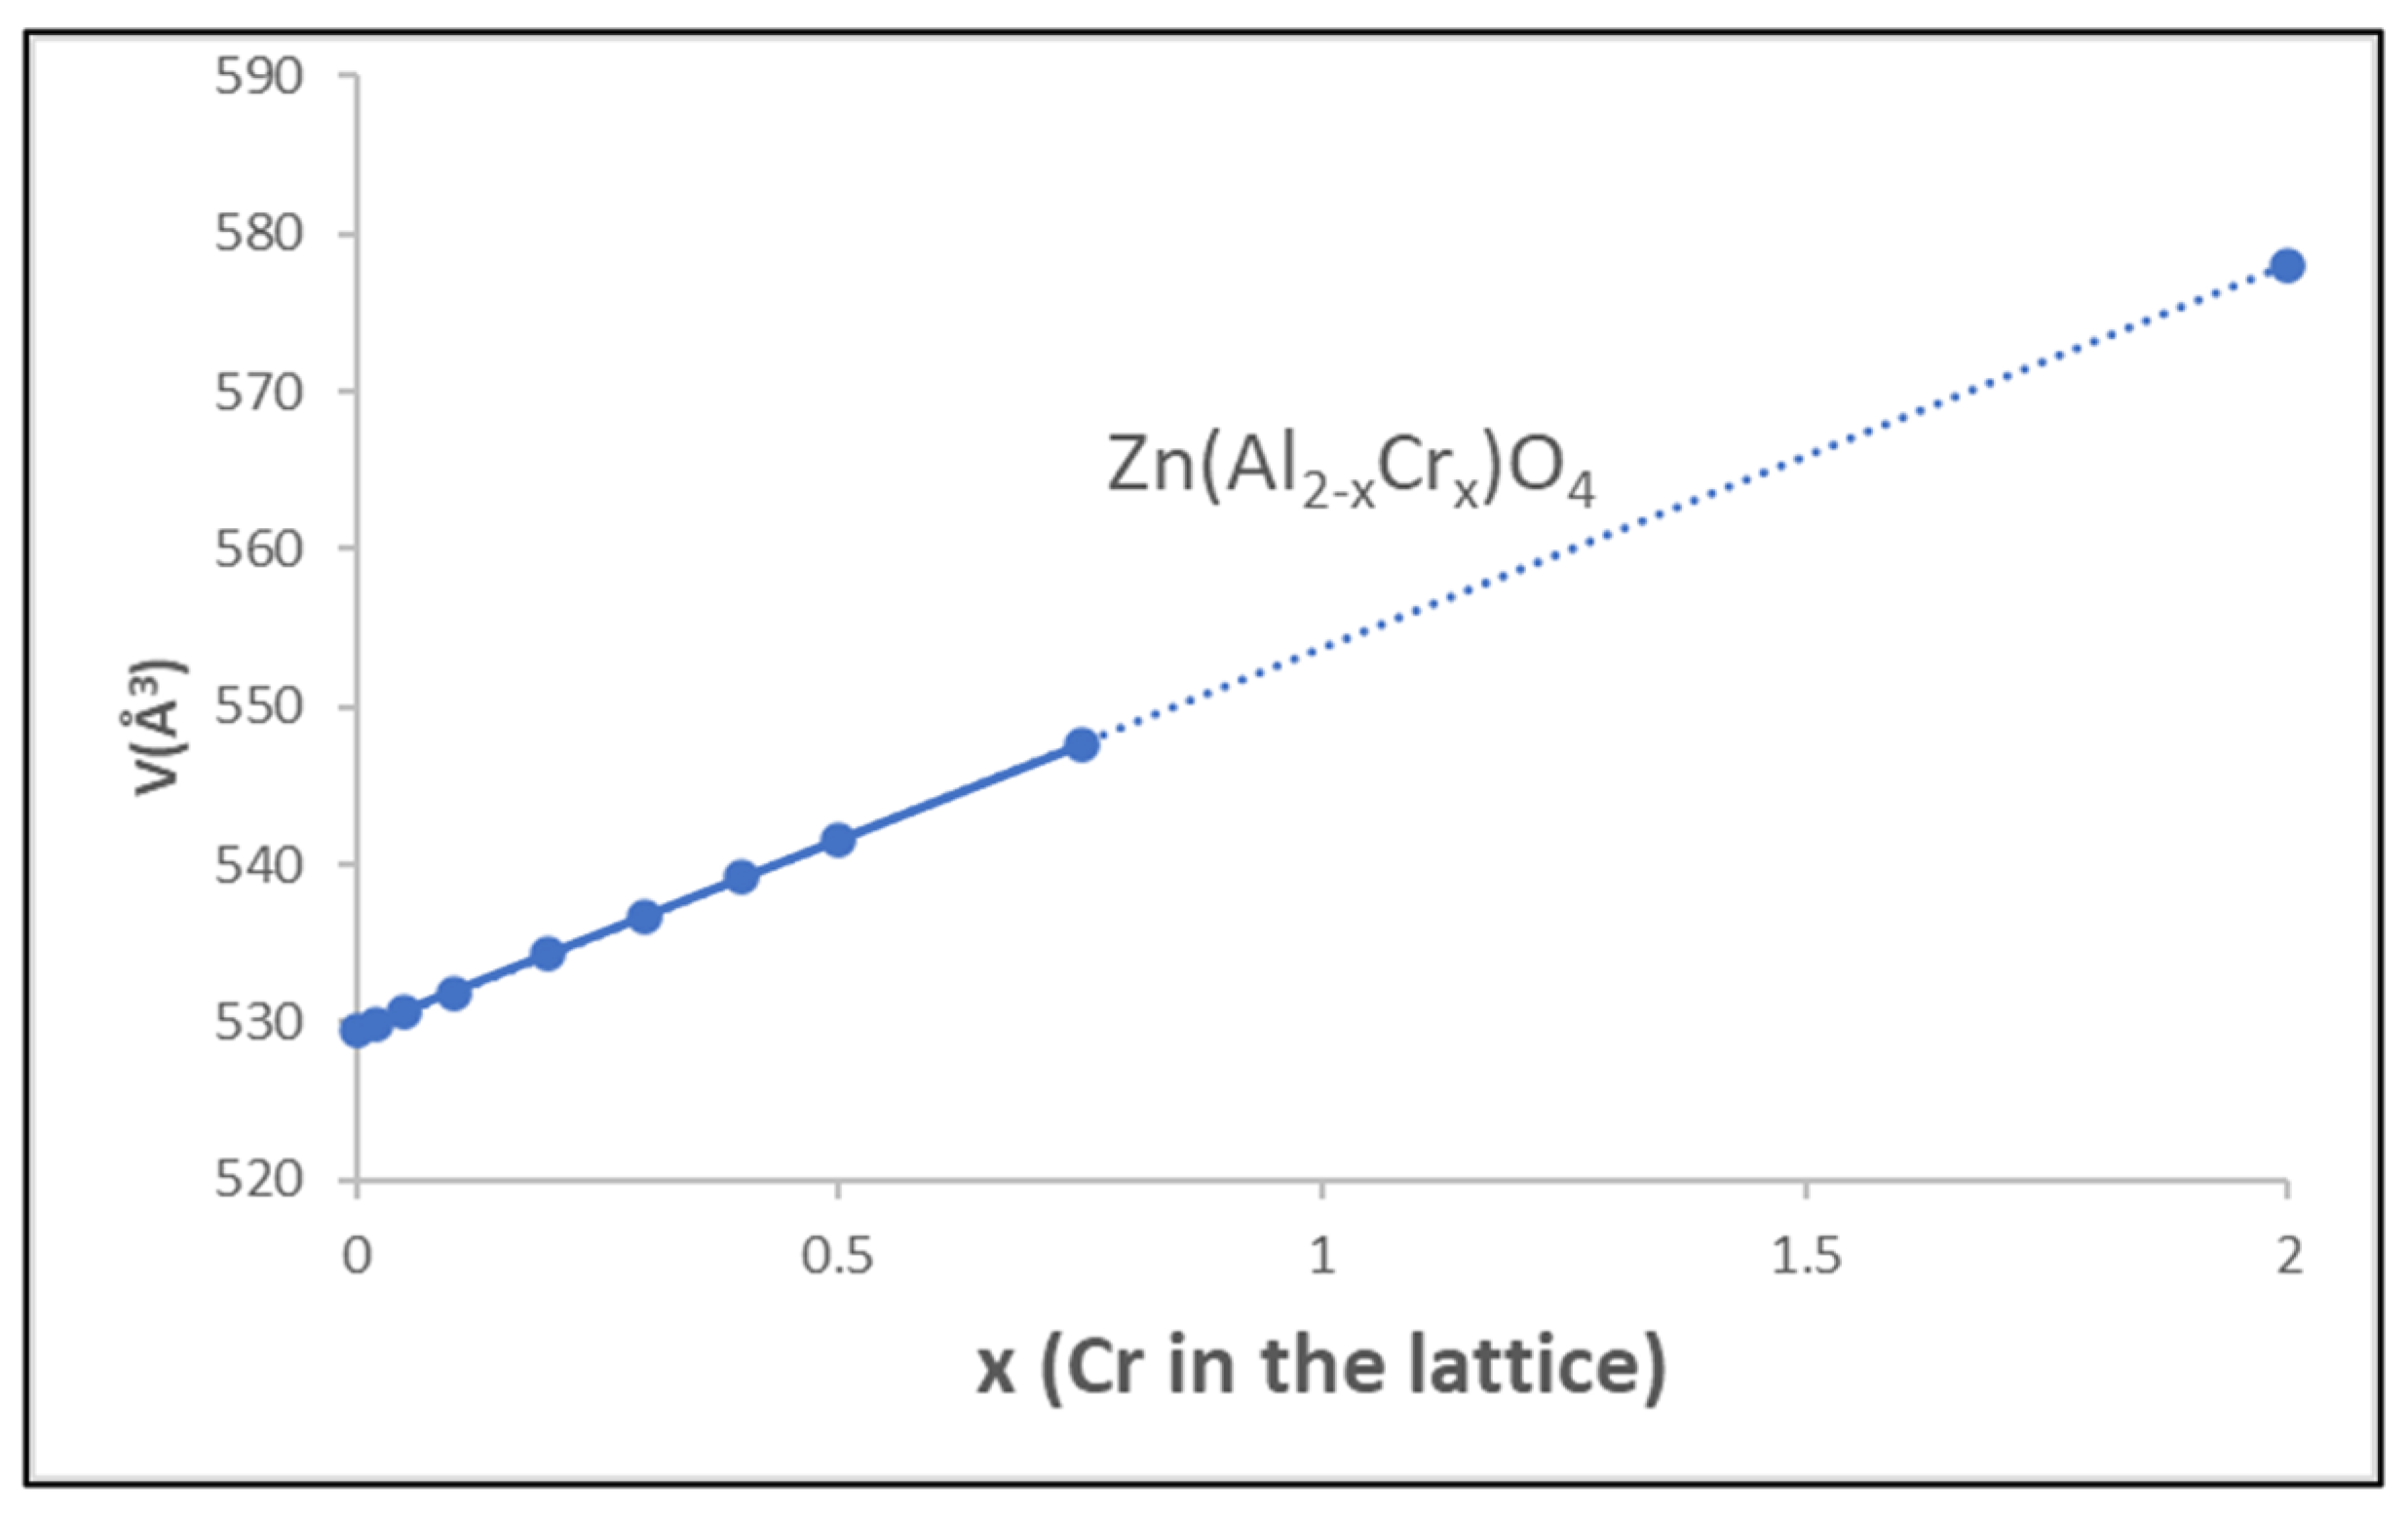
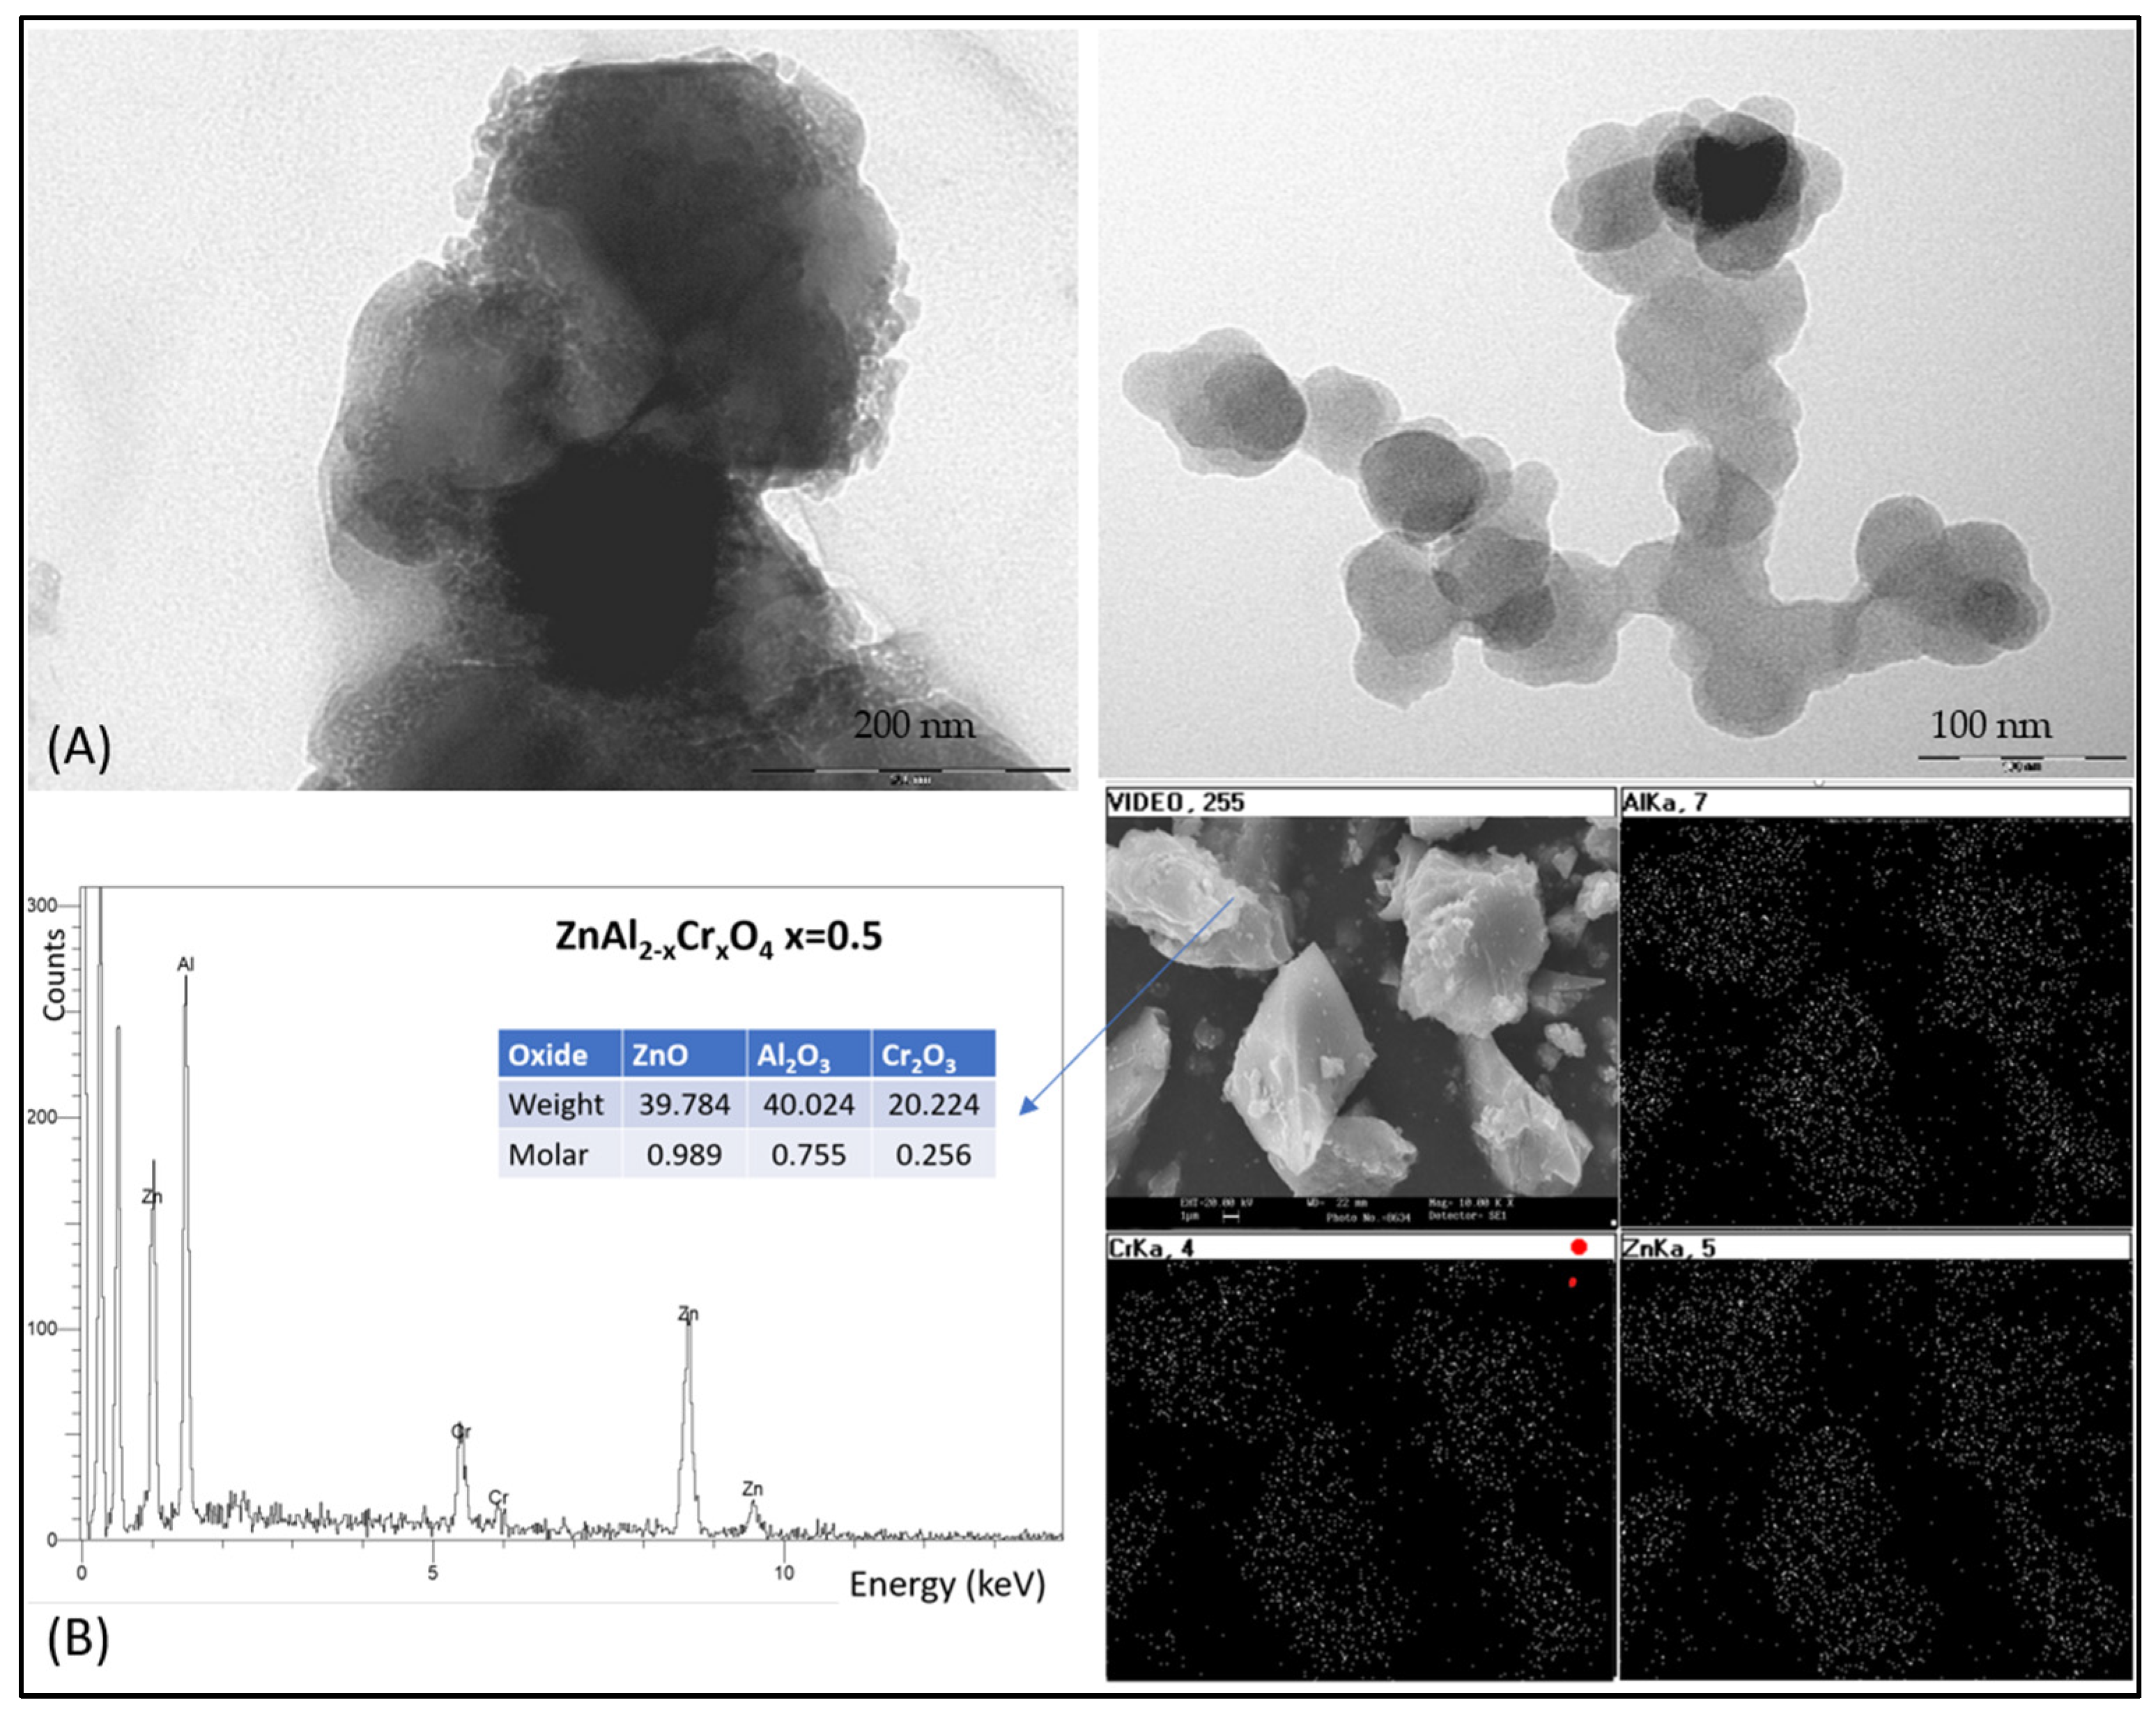
3.2. Gahnite-Zincochromite Zn(Al2−xCrx)O4 Solid Solutions

Figure 5 shows the powder and glazed samples of the gahnite-zincochromite Zn(Al2−xCrx)O4 solid solutions synthesised using the ammonia coprecipitation method (CO) described above. Zn(NO3)2·6H2O, Al(NO3)3·6H2O, and Cr(NO3)3·9H2O were used as precursors for Zn, Al, and Cr, respectively. The raw dried gels exhibited a homogeneous appearance with a purple-blue colour that intensified with the chromium content (L* decreased, a* greenish and b* blueish). The CIEL*a*b* values and reflectance characteristics of the samples are presented in Table 3. The powders fired at 1000 °C for 1 h showed that the colour intensified (L* decreased) and became reddish (a* increased) with an increase in the amount of Cr3+ in the composition.
The 5 wt.% glazed samples in the double firing frit with some lead (6 wt.% PbO, maturation point 1000 °C) (Figure 5C) show that the colour intensifies (L* decreases) and becomes reddish (a* increases) with the chromium amount, producing interesting red shades in the samples between x = 0.2 and 0.5. Lower chromium amounts give light colours, and the x = 0.75 sample produces a dark grey colour associated with the Cr enrichment process described above (Equation (5)). In the single firing frit (1080 °C) and porcelain single firing frit (1200 °C), the x = 0.5 glazed sample showed the best colour.
Figure 6 shows the X-ray diffractograms (XRD) of the gahnite-zincochromite Zn(Al2−xCrx)O4 solid solutions, and Figure 7 shows the evolution of the volume of the cubic cell of the corresponding spinel with x. Only peaks associated with the corresponding cubic spinel were detected. It can be observed that the diffraction peaks shift to the lower °2ϴ degrees associated with an increase in the interplanar distances d, based on the replacement of smaller Al3+ (Shannon–Prewit radius in octahedral site = 0.675 Å) by larger Cr3+ (0.755 Å). Therefore, an increase in the cubic cell edge of the spinel with x is expected. The evolution of the cell volume with x (Figure 7) shows that the cell volume increases progressively with x, rigorously accomplishing Vegard’s law in the studied range of x = 0–0.75 [22].
Figure 8 shows the UV–Vis–NIR spectra of the gahnite-zincochromite Zn(Al2−xCrx)O4 solid solutions synthesised by ammonia coprecipitation fired at 1000 °C for 1 h. The reflectance in the visible range, which is responsible for the colour, decreased with the amount of chromium. Bands (minimum reflectance) centred at 240, 430, 570, and 700 nm, which are associated with Cr3+ in the octahedral coordination, were detected.
The bands shifted to higher wavelengths with increasing amounts of chromium x in the sample, indicating a weakness in the crystal field associated with the entrance of larger Cr3+ (0.755 Å), replacing Al3+ (Shannon–Prewit radius in octahedral sites = 0.675 Å) in the small and constrained lattice of ZnAl2O4. The progressive increase in absorbance and the shift to a red wavelength intensifies the colour and the a* parameter increases; however, at x = 0.75, the absorption is excessive and the colour darkens (associated with Cr enrichment of the particles described above), producing the dark brown shades observed in Figure 5 due to reaction (6), which is homologous to reaction (5) but involves gahnite segregation [24].
Zn(Al2−xCrx)O4 → x/y[ZnAl2−yCryO4] + (1 − x/y)[ZnAl2O4]
The NIR reflectance of the powder and the 5 wt.% glazed in double firing at 1000 °C is relatively high (Table 3), with values higher than 45%, and the sample x = 0.5 shows the higher value.
Following the criteria of high colouring capacity and high NIR reflectance at the minimum Cr amount, the x = 0.5 sample results in the optimal composition for a cool pigment based on the gahnite-zincochromite system. Figure 9 shows the microstructure of the optimised sample. Figure 9A shows the morphology by TEM of nanoparticles around 25 nm forming the raw gel. Figure 9B shows the SEM image and the EDS composition of the mapping and global analysis, respectively, of the particles of the same sample fired at 1000 °C for 1 h: rough aggregates of the particles of 1–5 µm can be observed; in these aggregates, the distribution of Zn, Al, and Cr appears homogeneous, and the EDS global oxide composition analysis evidences the stoichiometry of the sample.

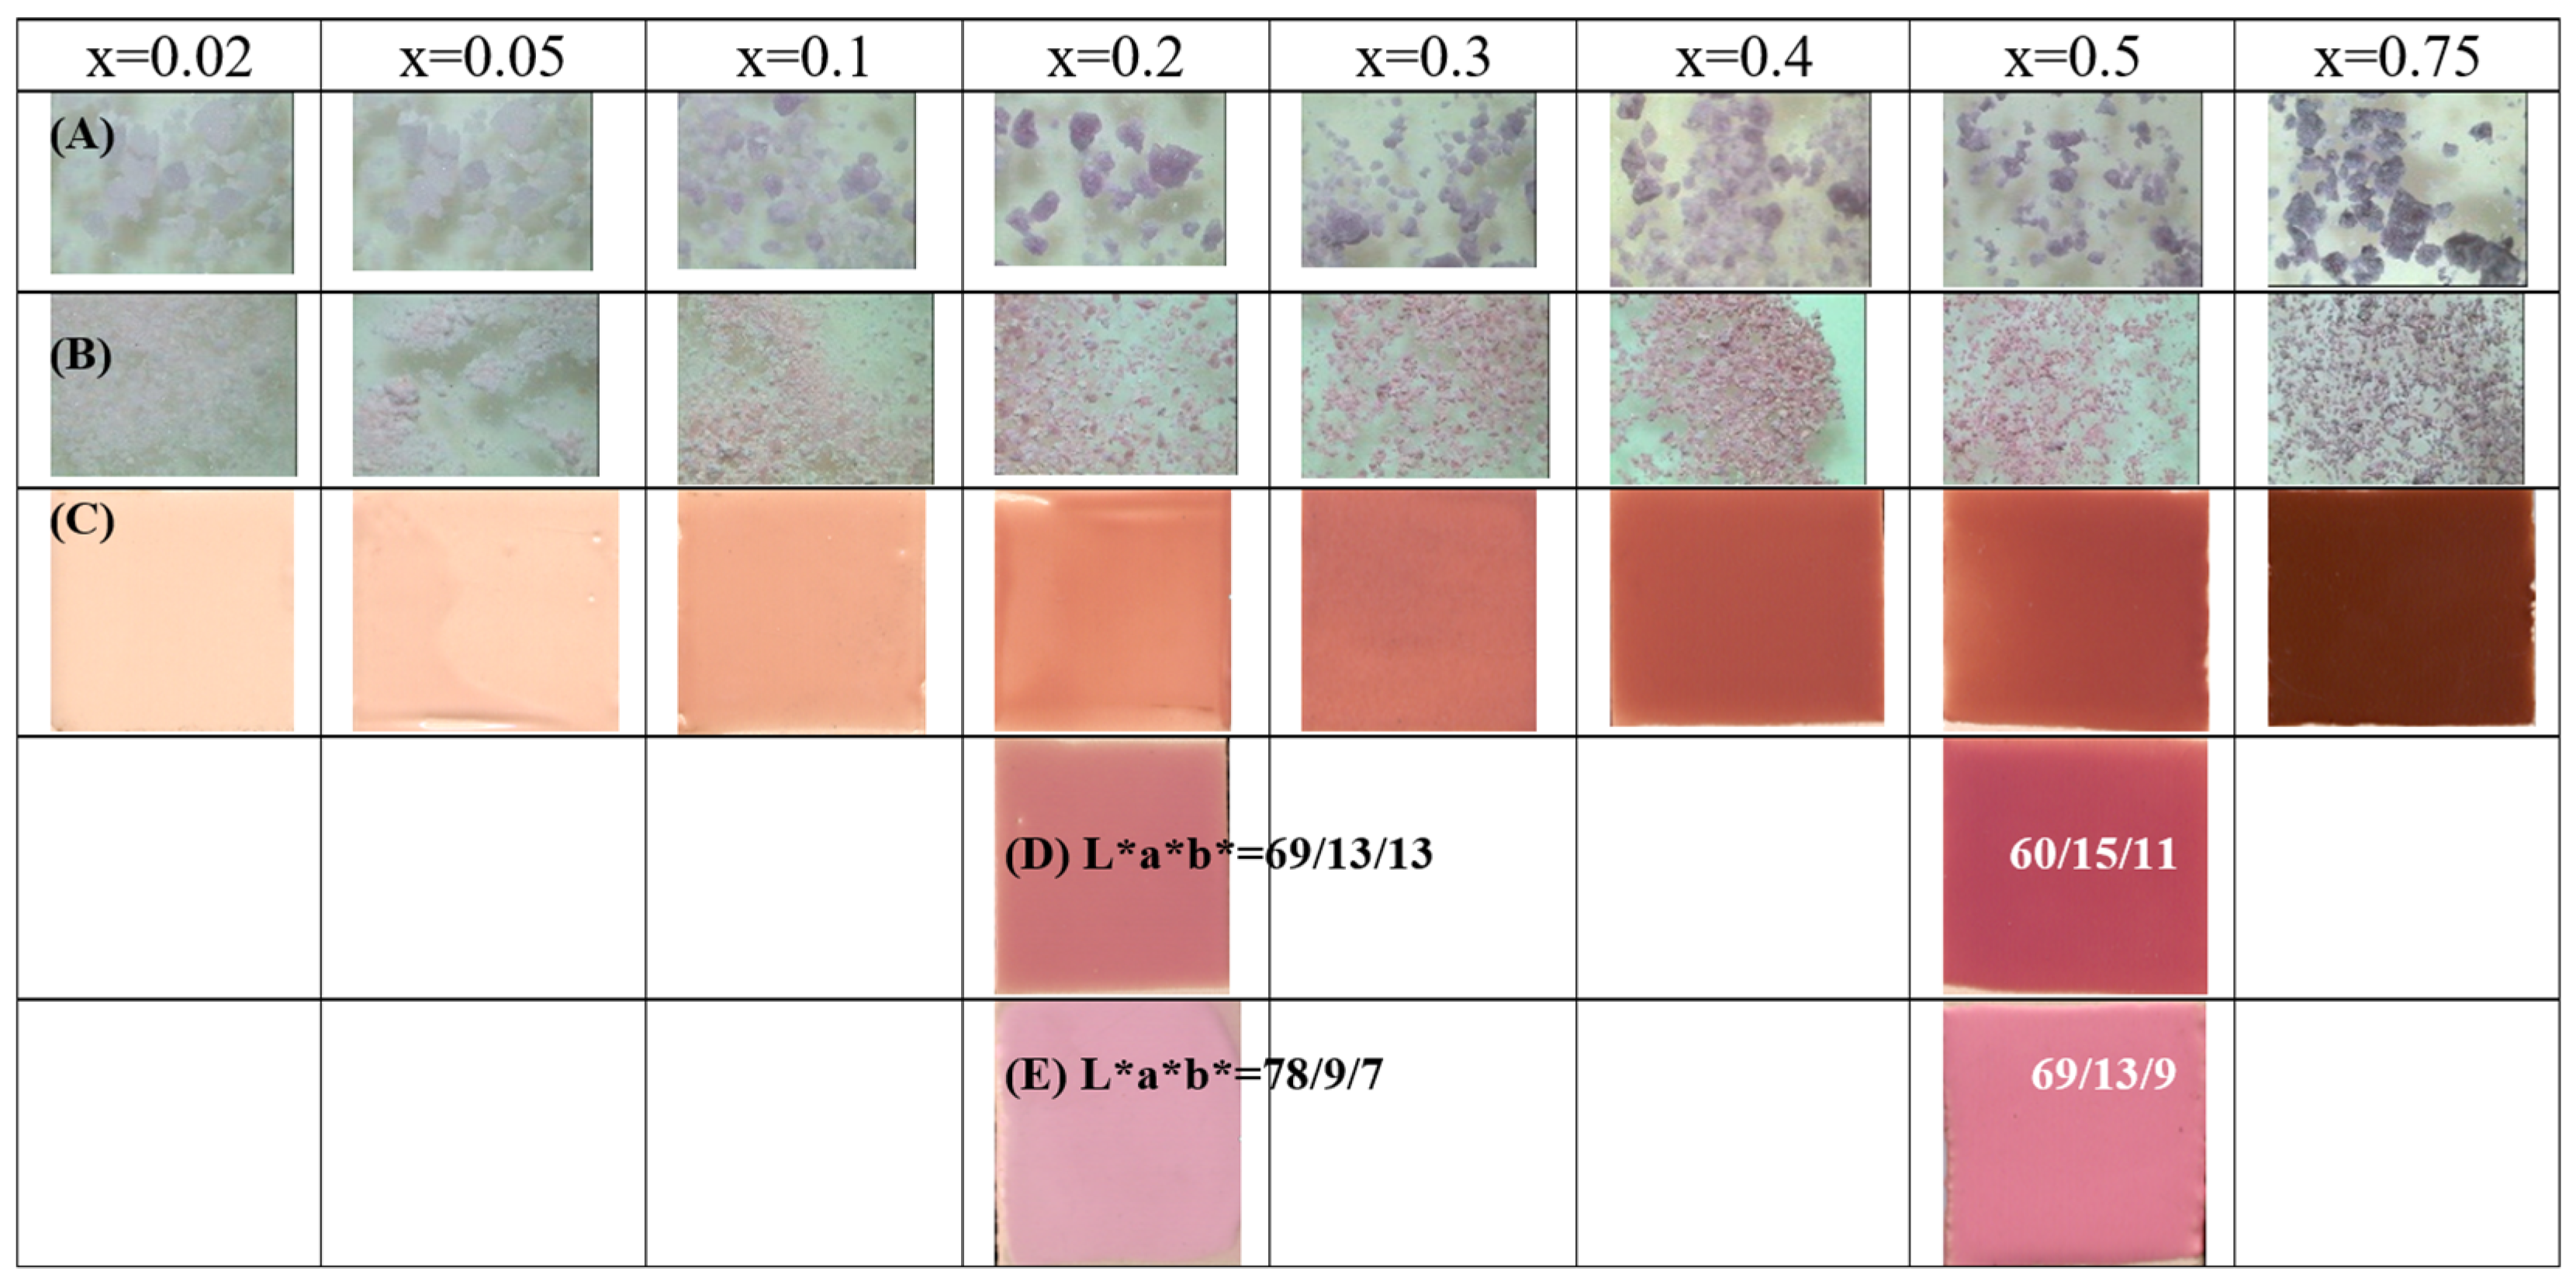
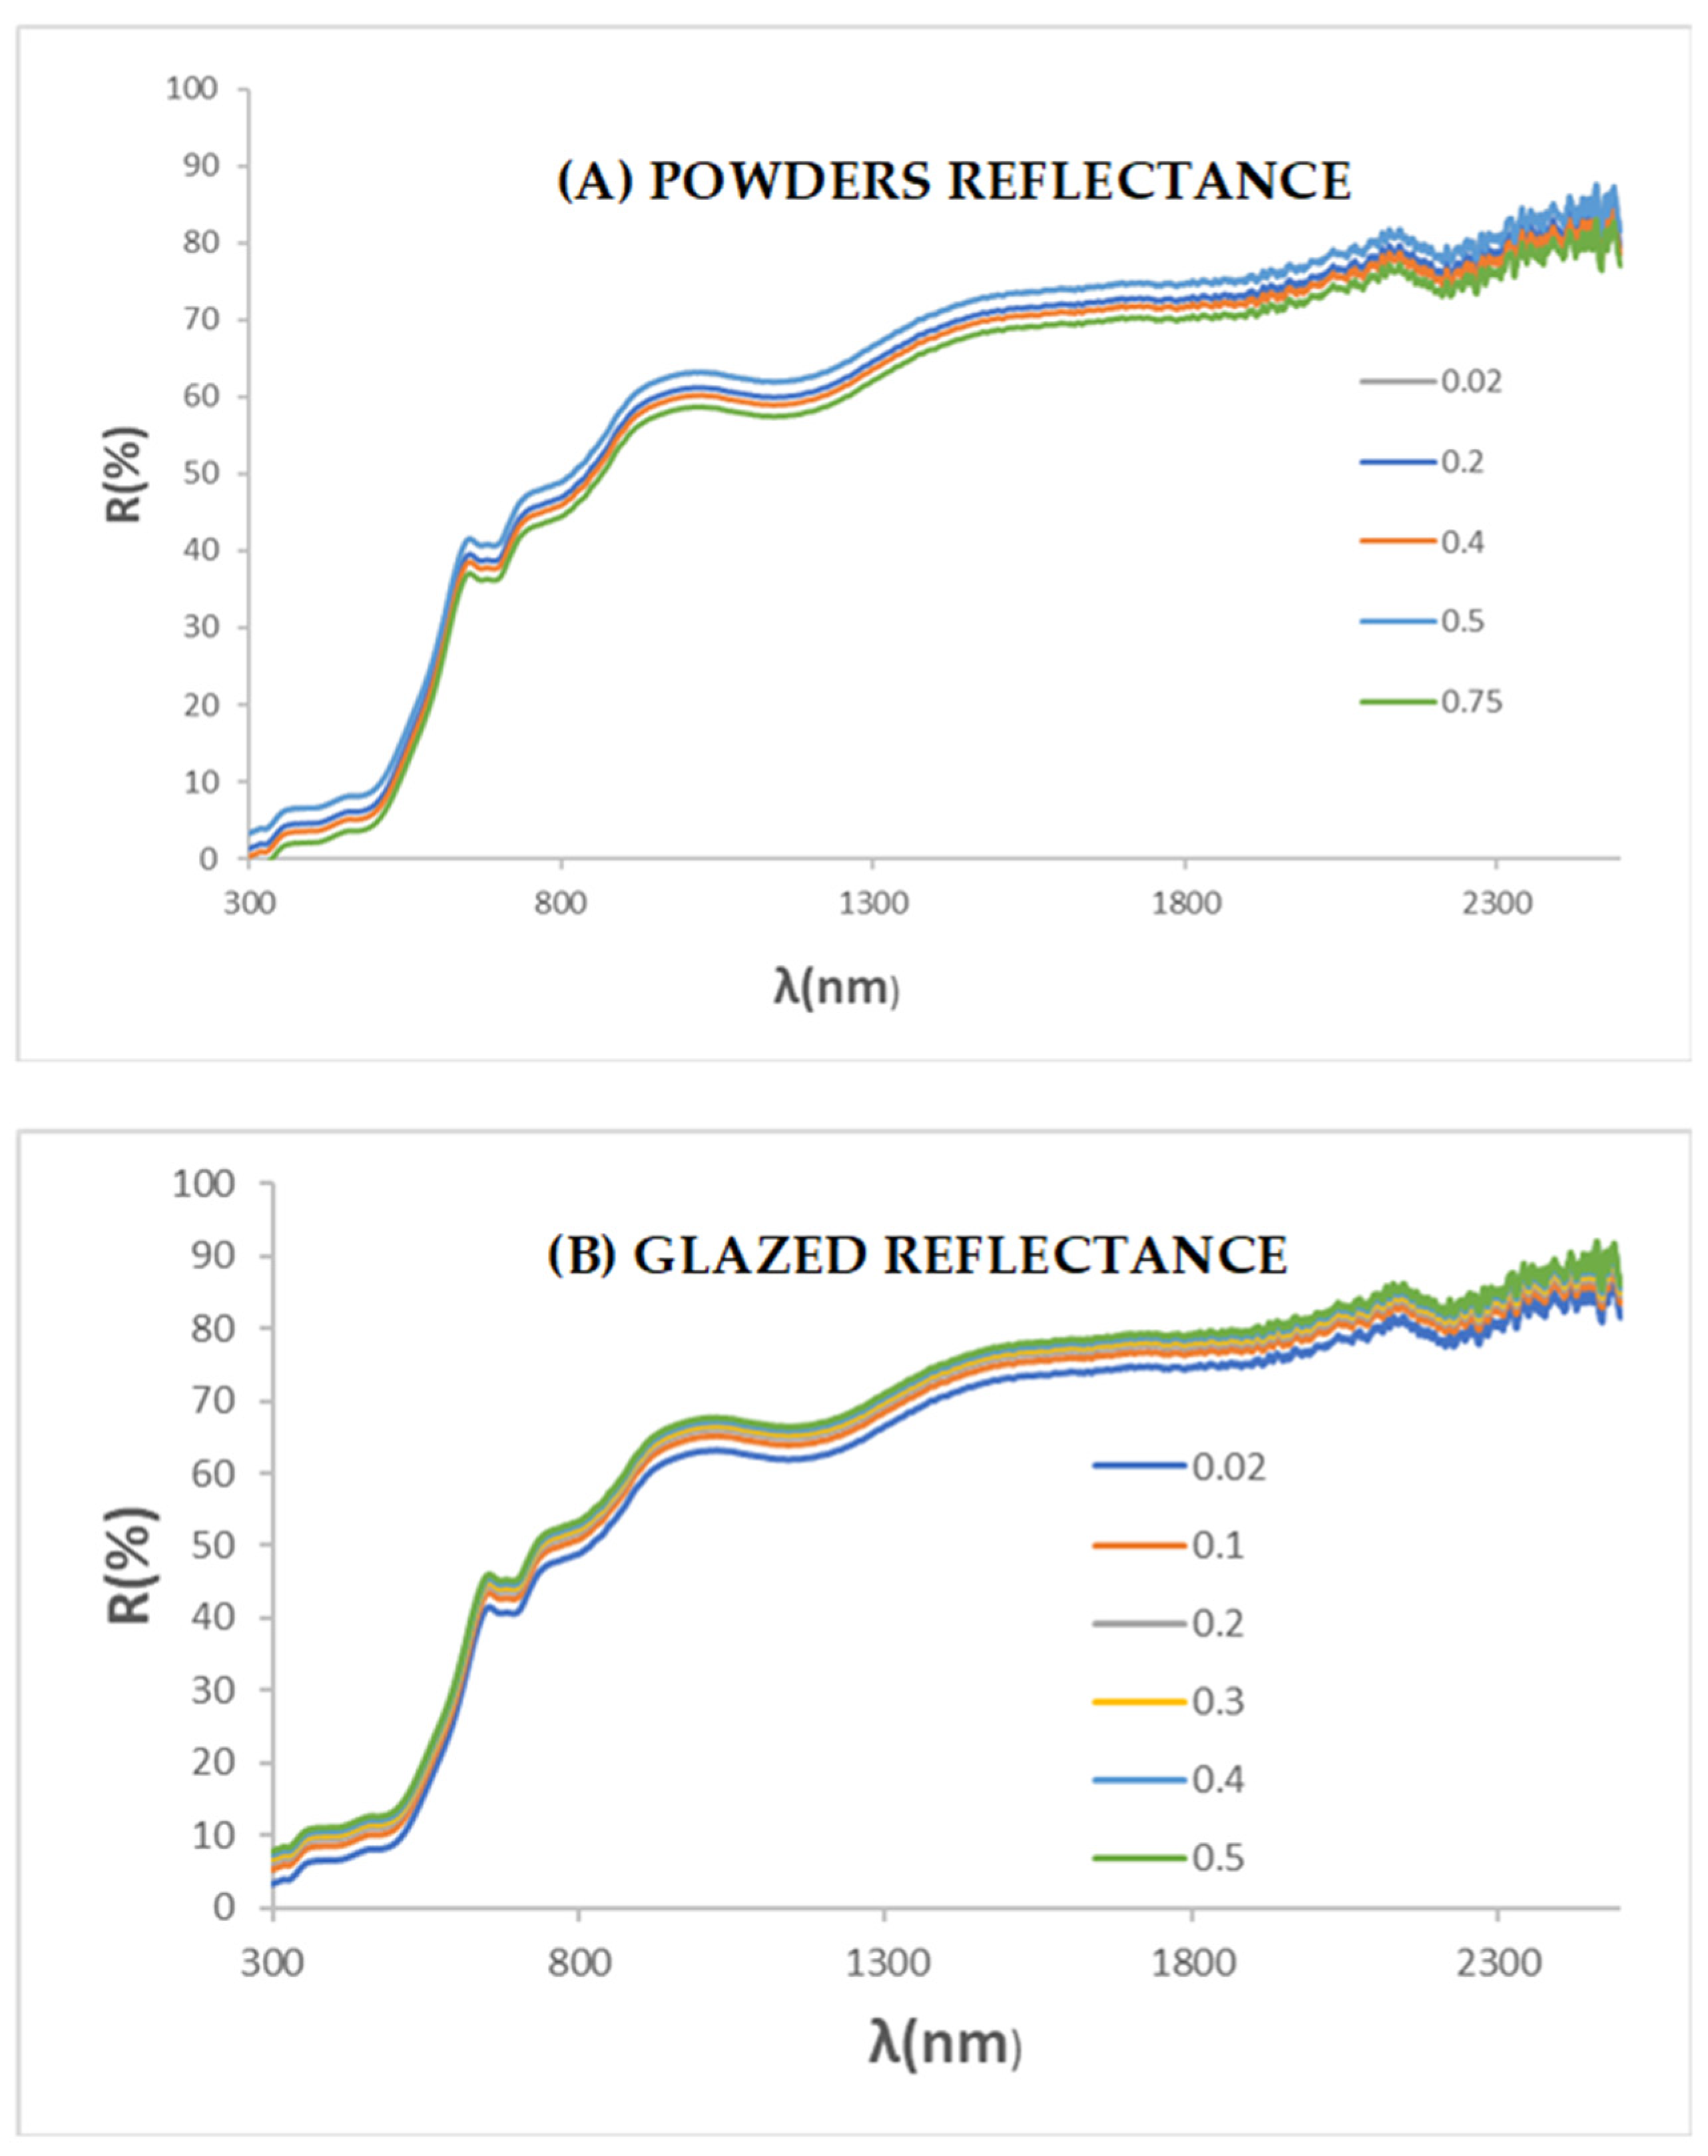
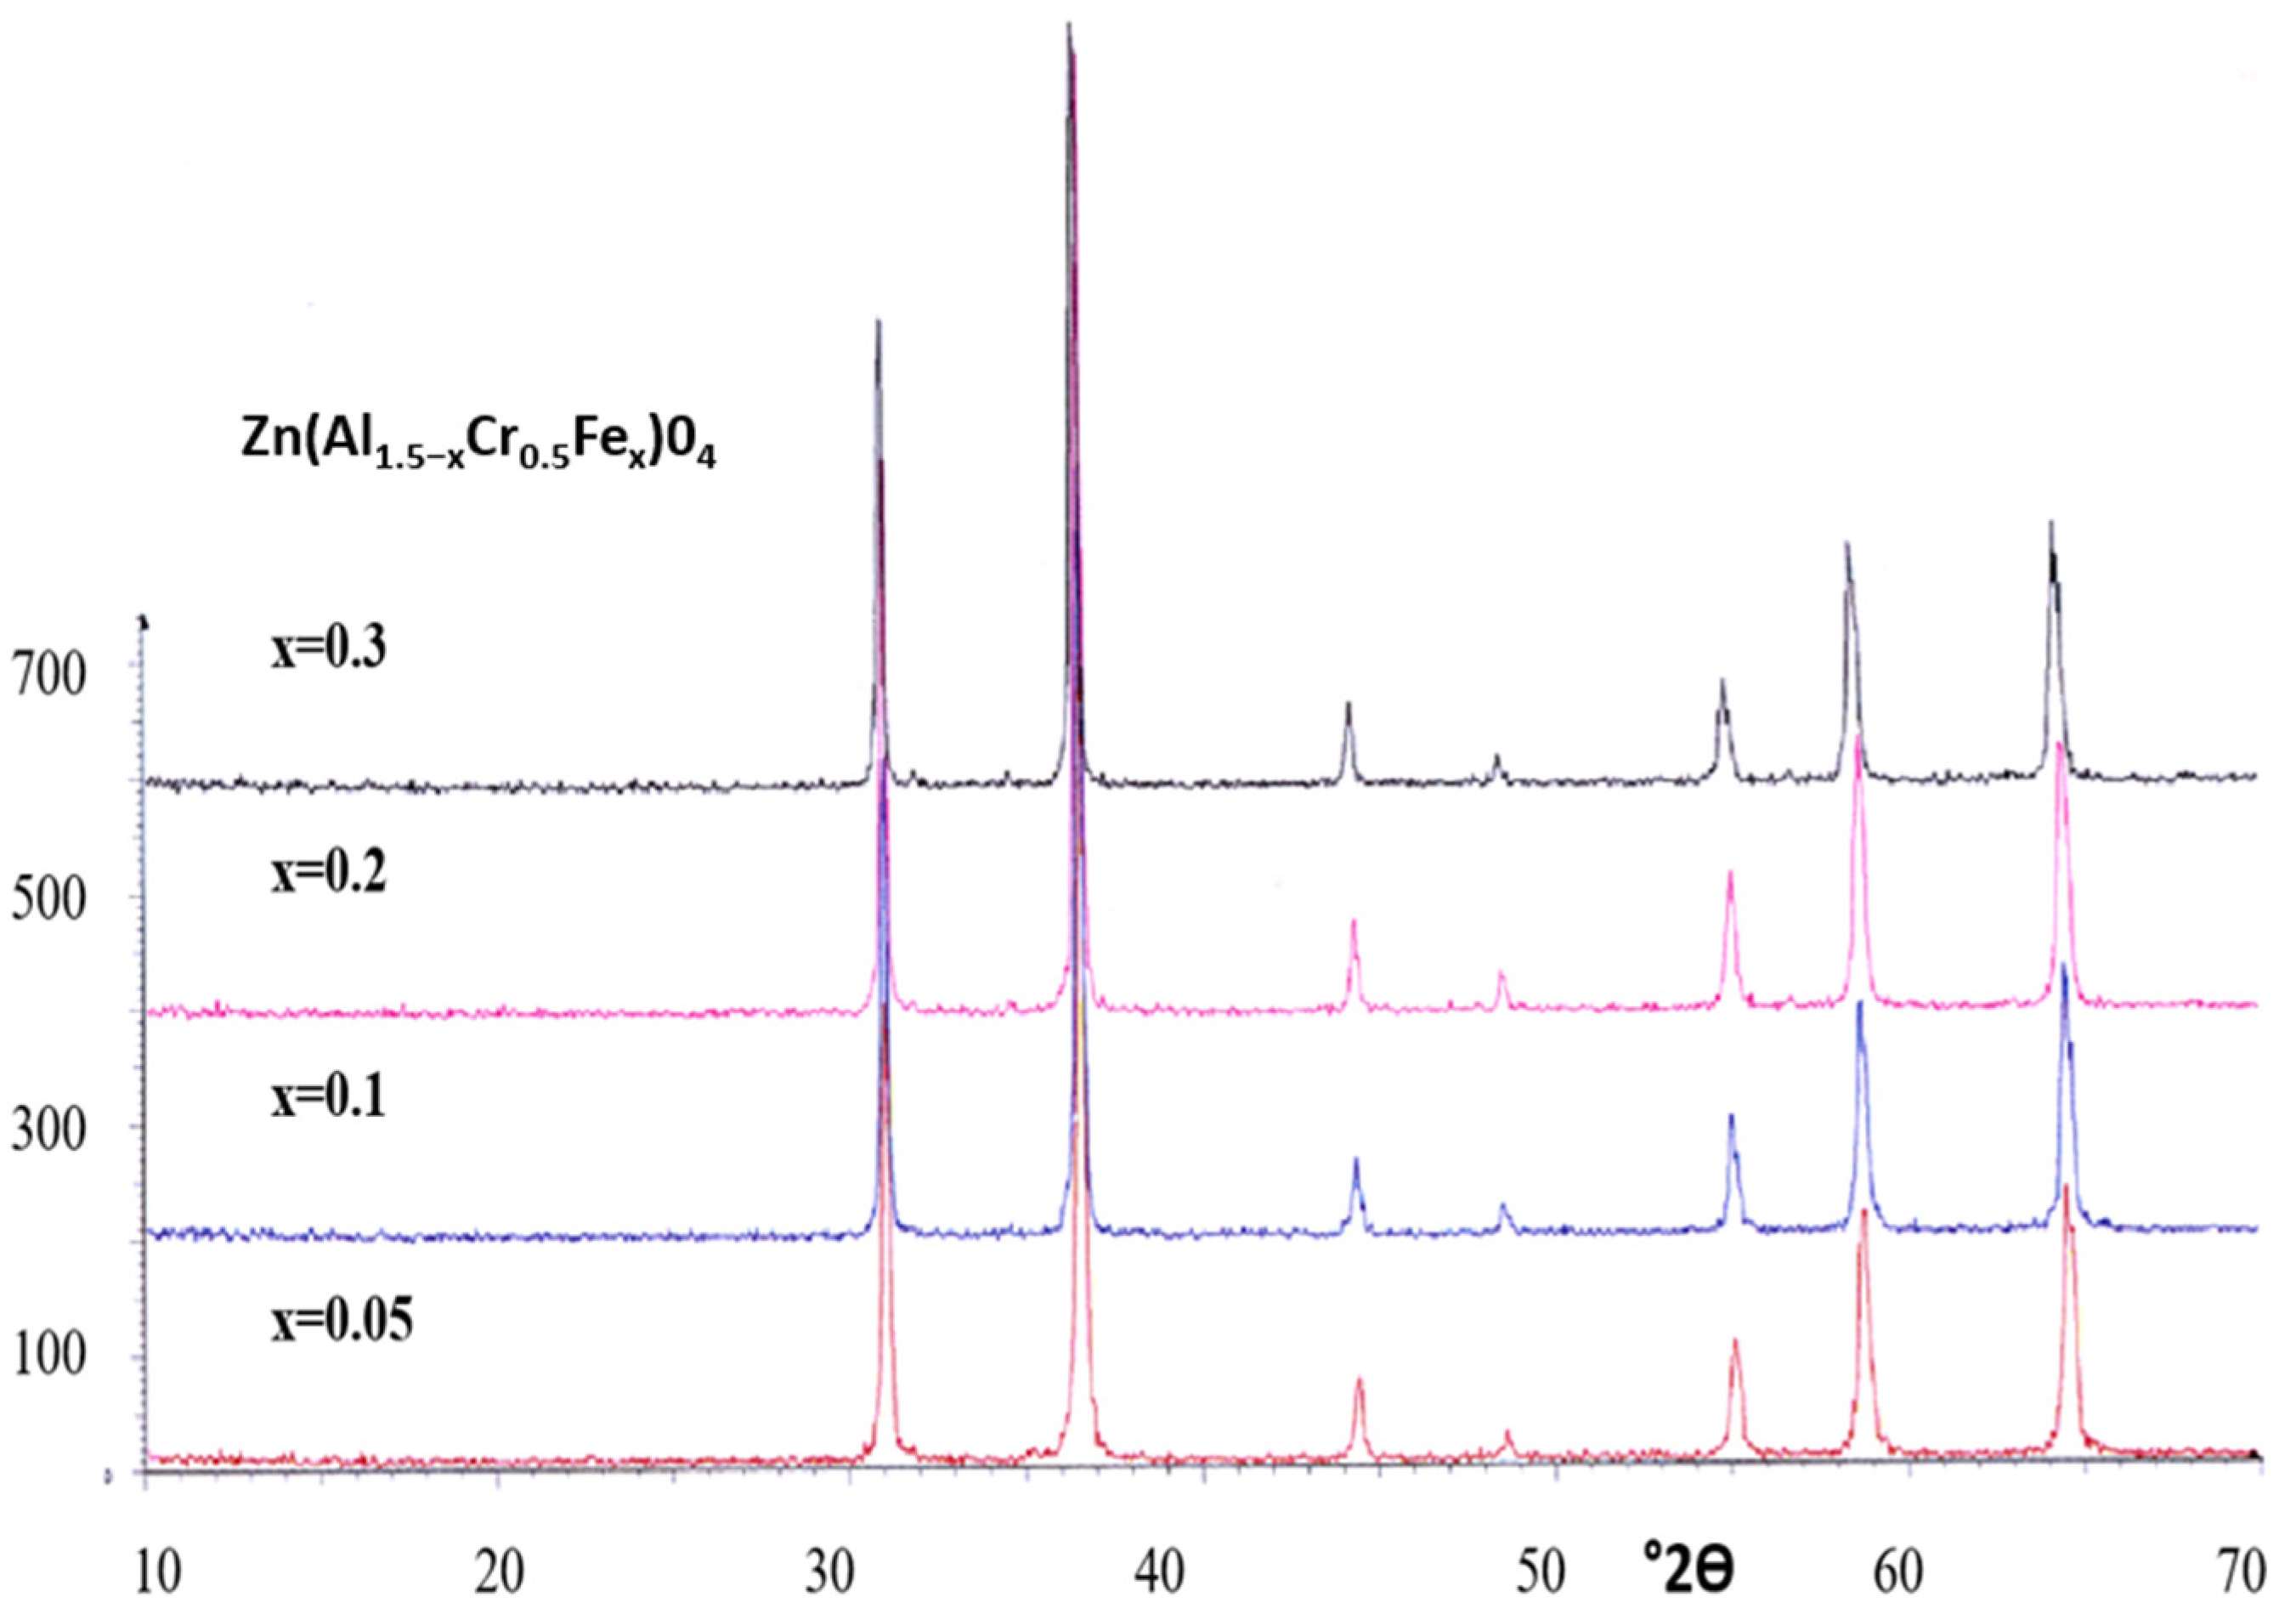
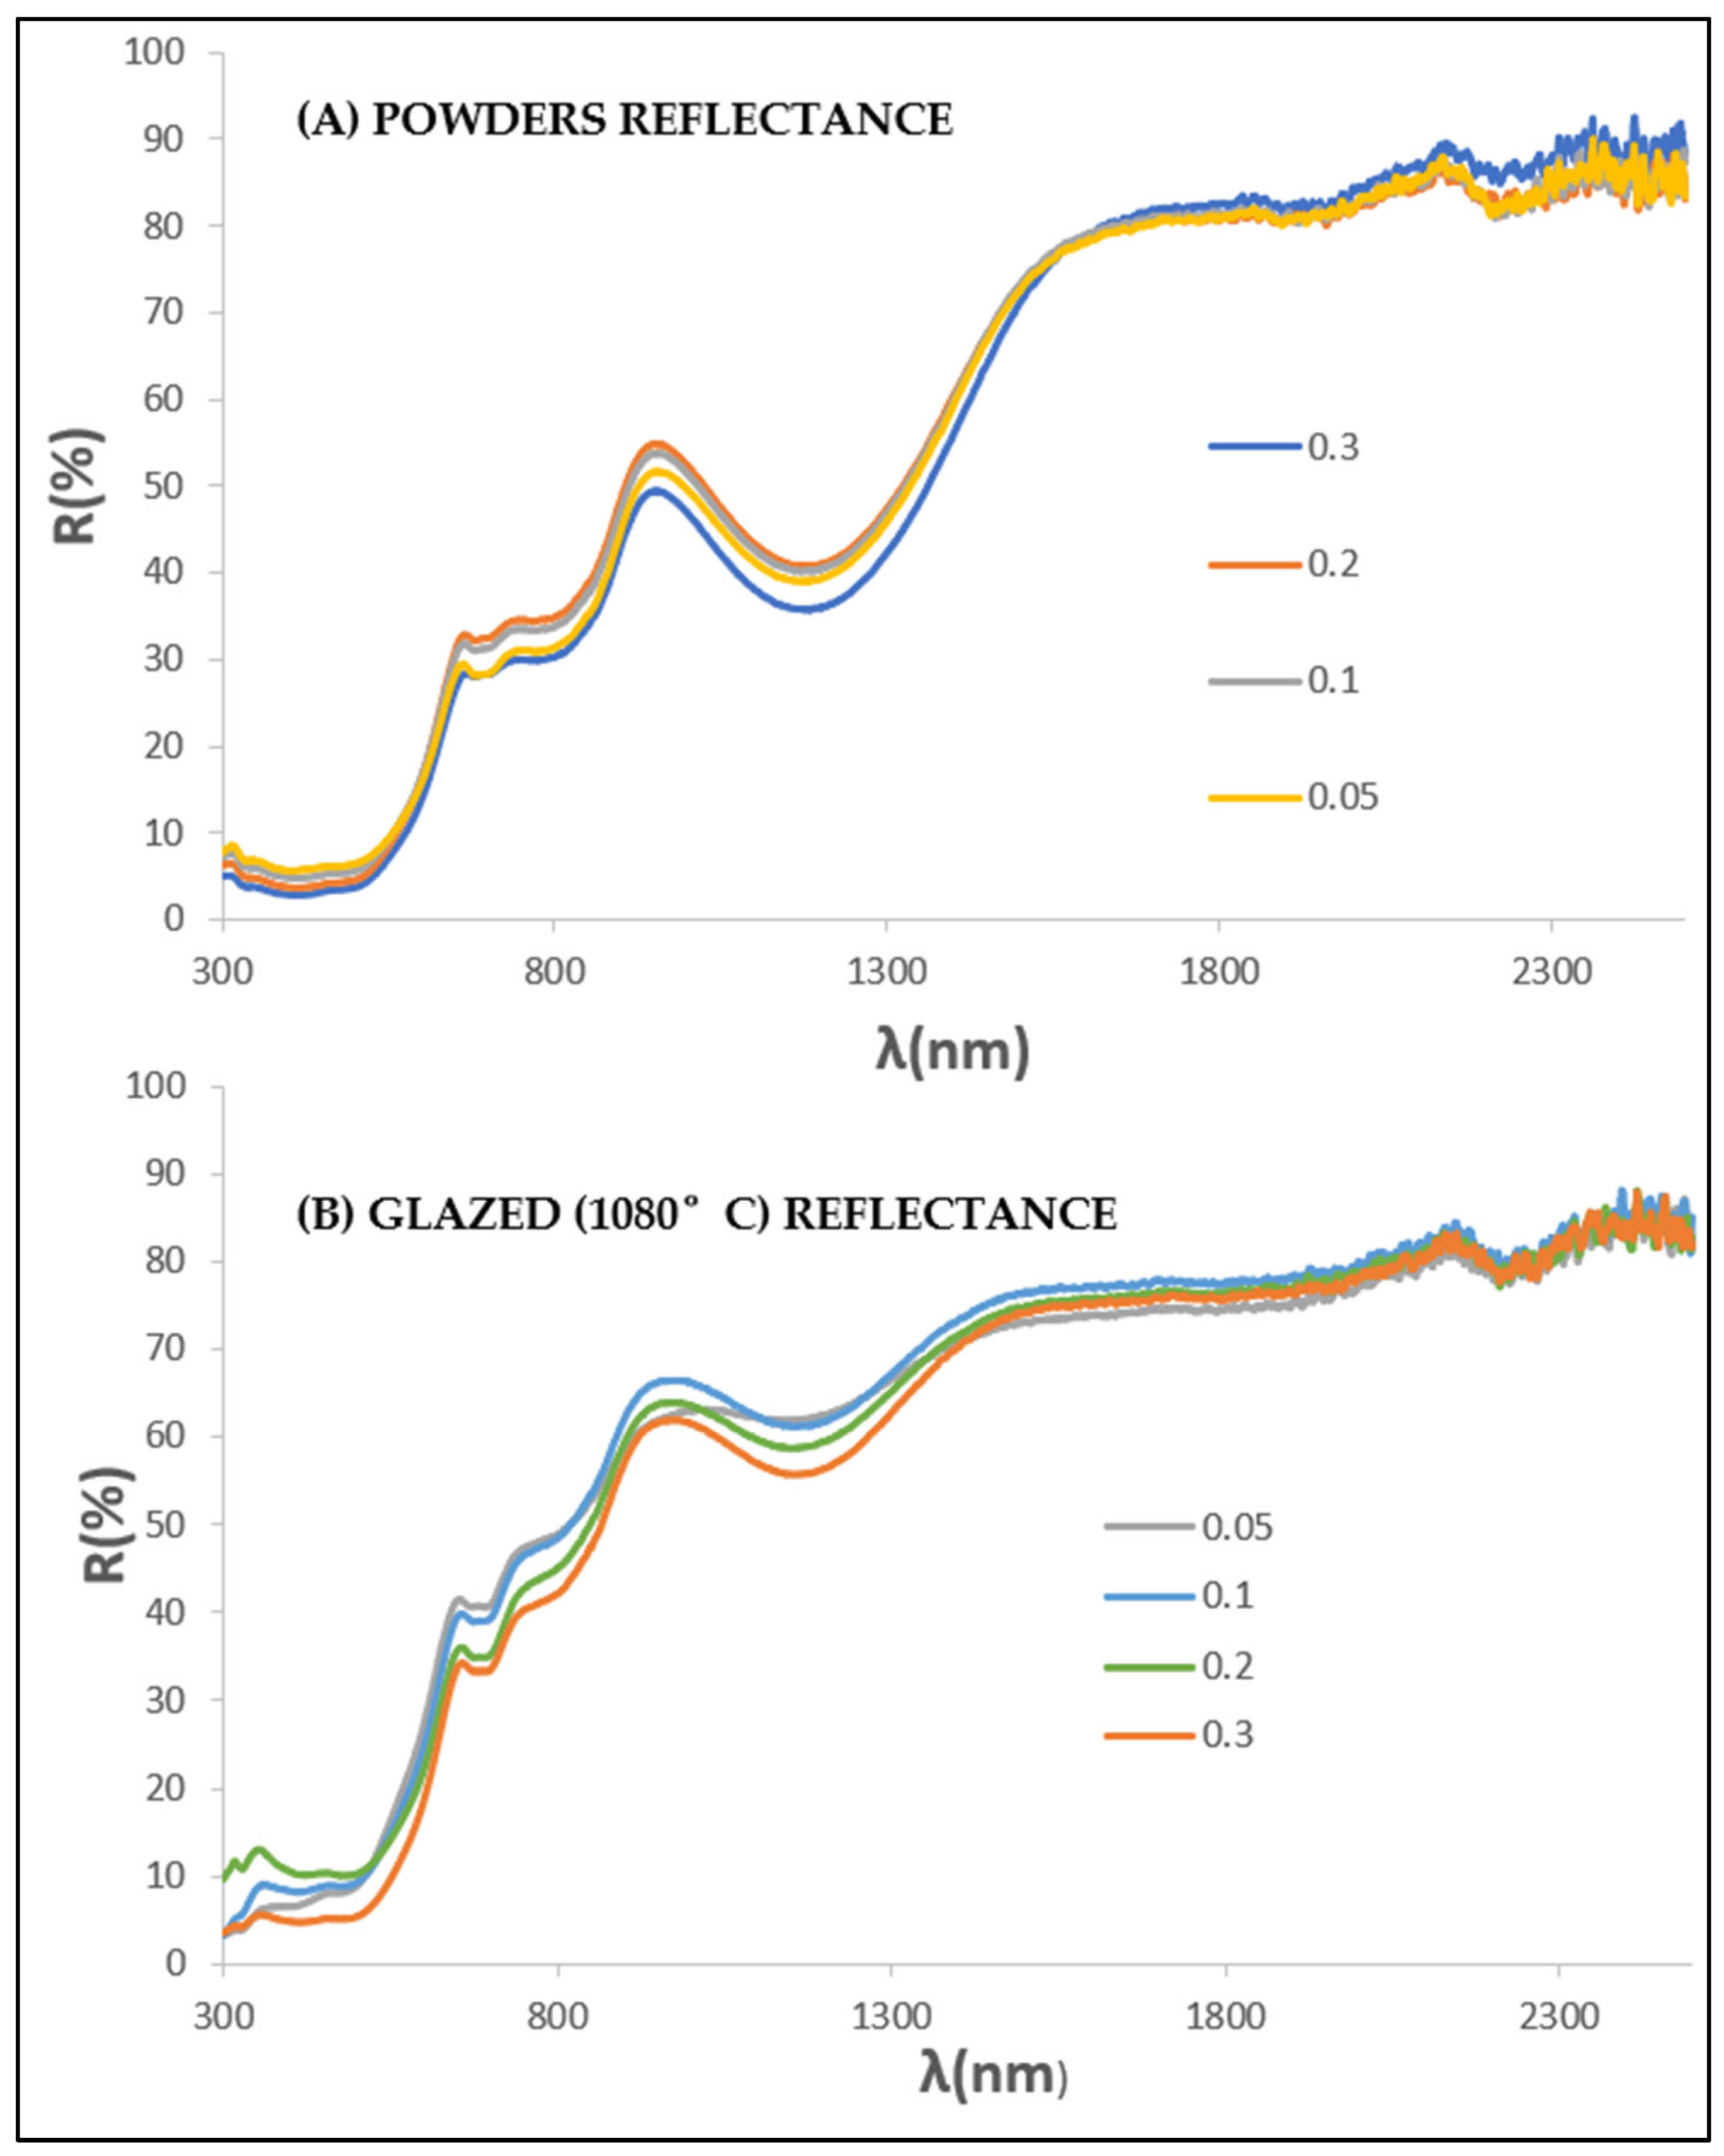
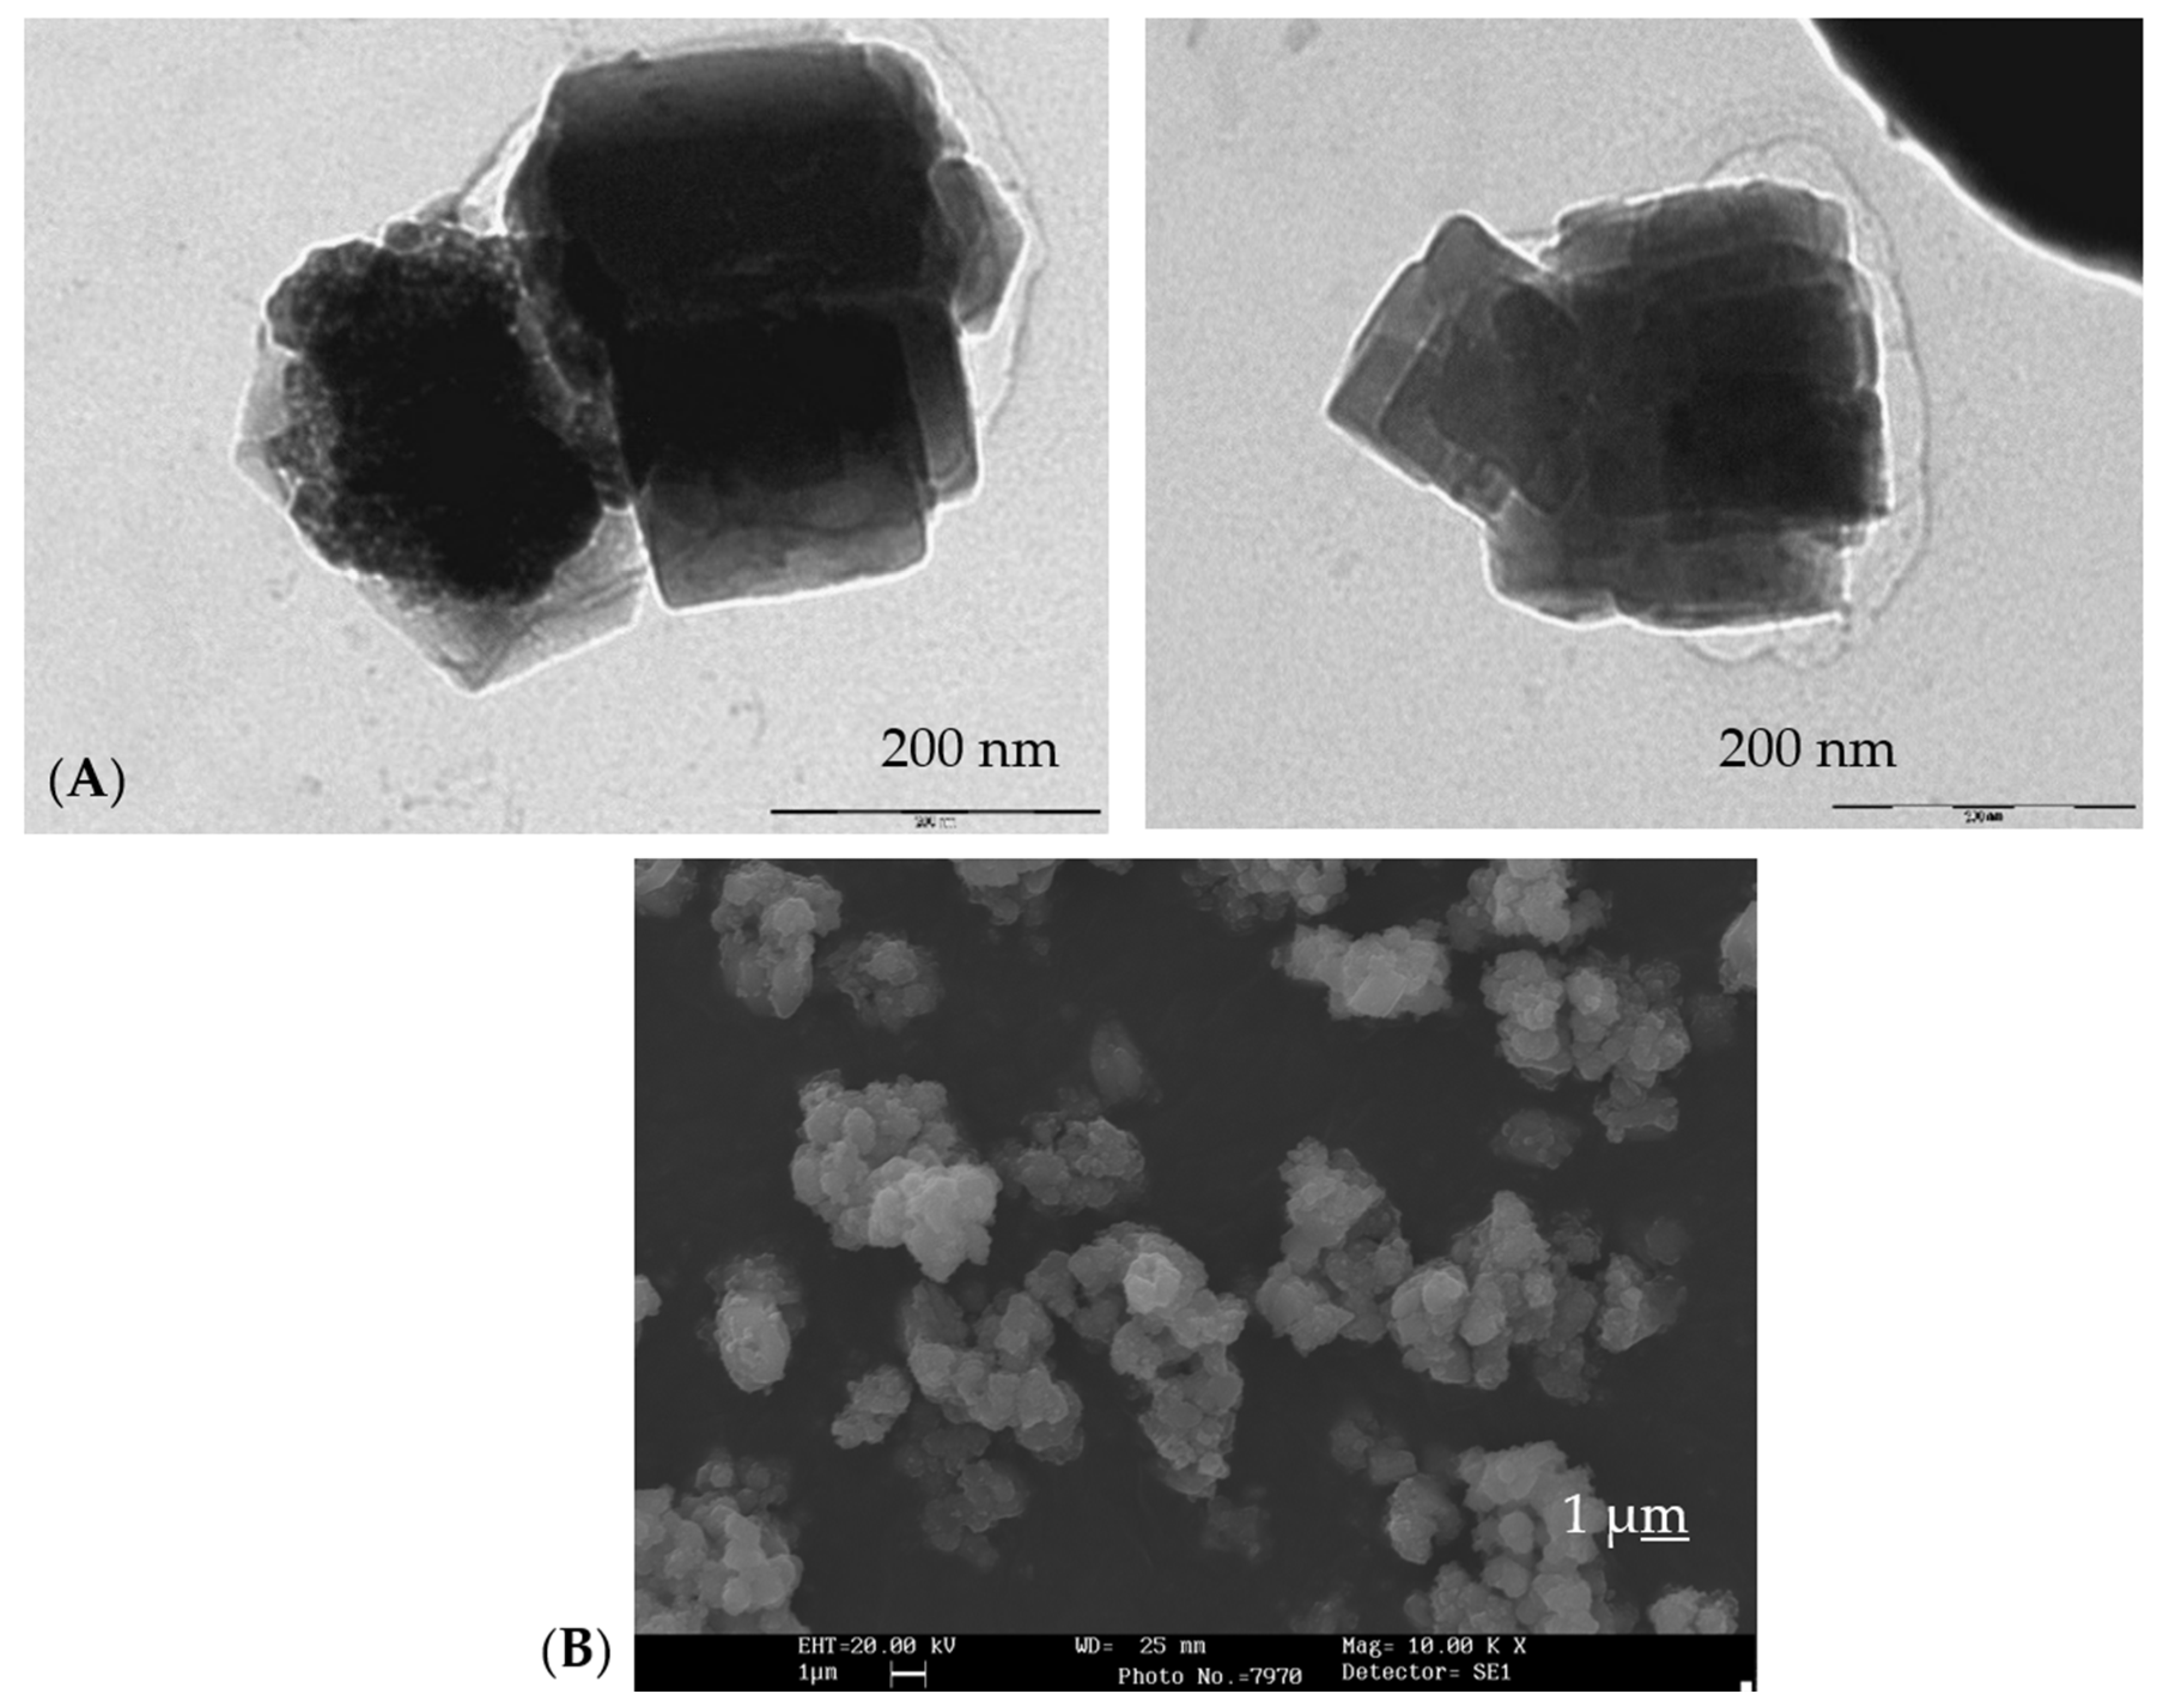
3.3. Gahnite-Zincochromite-Franklinite Zn(Al1.5−xCr0.5Fex)O4 Solid Solutions

To optimise the ternary system with Al, Cr, and Fe, the compositions based on the previous optimal sample Zn(Al1.5−xCr0.5Fex)O4 x = 0–0.3 were synthesised using the ammonia coprecipitation method (CO). Figure 10 shows images of the raw gels, the powders fired at 1000 °C for 1 h (×40), and the glazed samples. The CIEL*a*b* values and reflectance characteristics of the samples are presented in Table 4. The raw dried gels show a homogeneous appearance with a purple-blue colour for x = 0 and a progressive reddish colour with the addition of iron. The powders fired at 1000 °C for 1 h show that the colour intensified (L* decreased) and became reddish (a* increased) with the increasing iron content.
The 5 wt.% glazed samples in a single firing frit that matures at 1080 °C (Figure 10C), show that the colour slightly intensifies (L* decreases one point) and becomes reddish (a* increases) with the iron amount; interesting red shades are observed in the samples, from the pink of x = 0 to the red of x = 0.2; the x = 0.3 sample darkens and the a* value falls slightly, which is associated with the Cr enrichment effect; this was also observed in the previous samples when the pigment particles interacted with the glazes. In contrast, for the glazed samples in a porcelain firing frit that matures at 1200 °C (Figure 10D), the colour intensifies (L* decreases) and becomes reddish (a* increases) with an iron amount up to that of the x = 0.3 sample, which darkens slightly, and the red a* value decreases owing to the Cr enrichment effect. The glazing in the single firing frit at 1080 °C and the porcelain single firing frit at 1200 °C gave the best colour for the x = 0.2 sample (Zn(Al1.3Cr0.5Fe0.2)O4), with a balanced distribution of the cations in the spinel that maximises the stability demonstrated in its behaviour in glazes.
Figure 11 shows the XRD diffractograms of the Zn(Al1.5−xCr0.5Fex)O4 coprecipitated samples fired at 1000 °C for 1 h: only the peaks of the corresponding spinel were detected.
Figure 12 shows the UV–Vis–NIR diffuse reflectance spectra of the Zn(Al1.5−xCr0.5Fex)O4 samples. The reflectance decreases with x in the visible range, which is responsible for the colour, and is similar in the NIR range. Bands at 240, 450–500, 570, 670, 710, 780 (shoulder), and 1200 nm can be observed, and as discussed above for the franklinite-zincochromite samples, the bands centred at 1200 and 780 nm, with a wide band of absorption between 400 and 500 nm, are associated with 6A1g(S) → 4A1g,4E(G), which overlapped with the charge transfer band at 400–500 nm of Fe3+ in the octahedral coordination. These Fe3+ bands overlap with those of Cr3+ in the octahedral coordination, as described above [6,17].
Associated with the UV–Vis–NIR reflectance spectra, the RNIR of the samples shown in Table 4 shows a slight increase with the amount of iron, from 46 to 52% in the powders and ~58% for all the samples with added iron.
Considering the criteria of the high colouring capacity and high NIR reflectance at the minimum Cr amount, the x = 0.2 sample results in the optimal composition for a cool pigment based on the franklinite-gahnite-zincochromite system.
Figure 13A shows the TEM images of the gel of this optimal sample. In this case, the amorphous gel exhibited homogeneous cubic nanoparticles with edges between 50 and 90 nm. In contrast, Figure 13B shows the particles of the powder fired at 1000 °C for 1 h: fine cubic particles with an edge of ~1 µm can be observed.

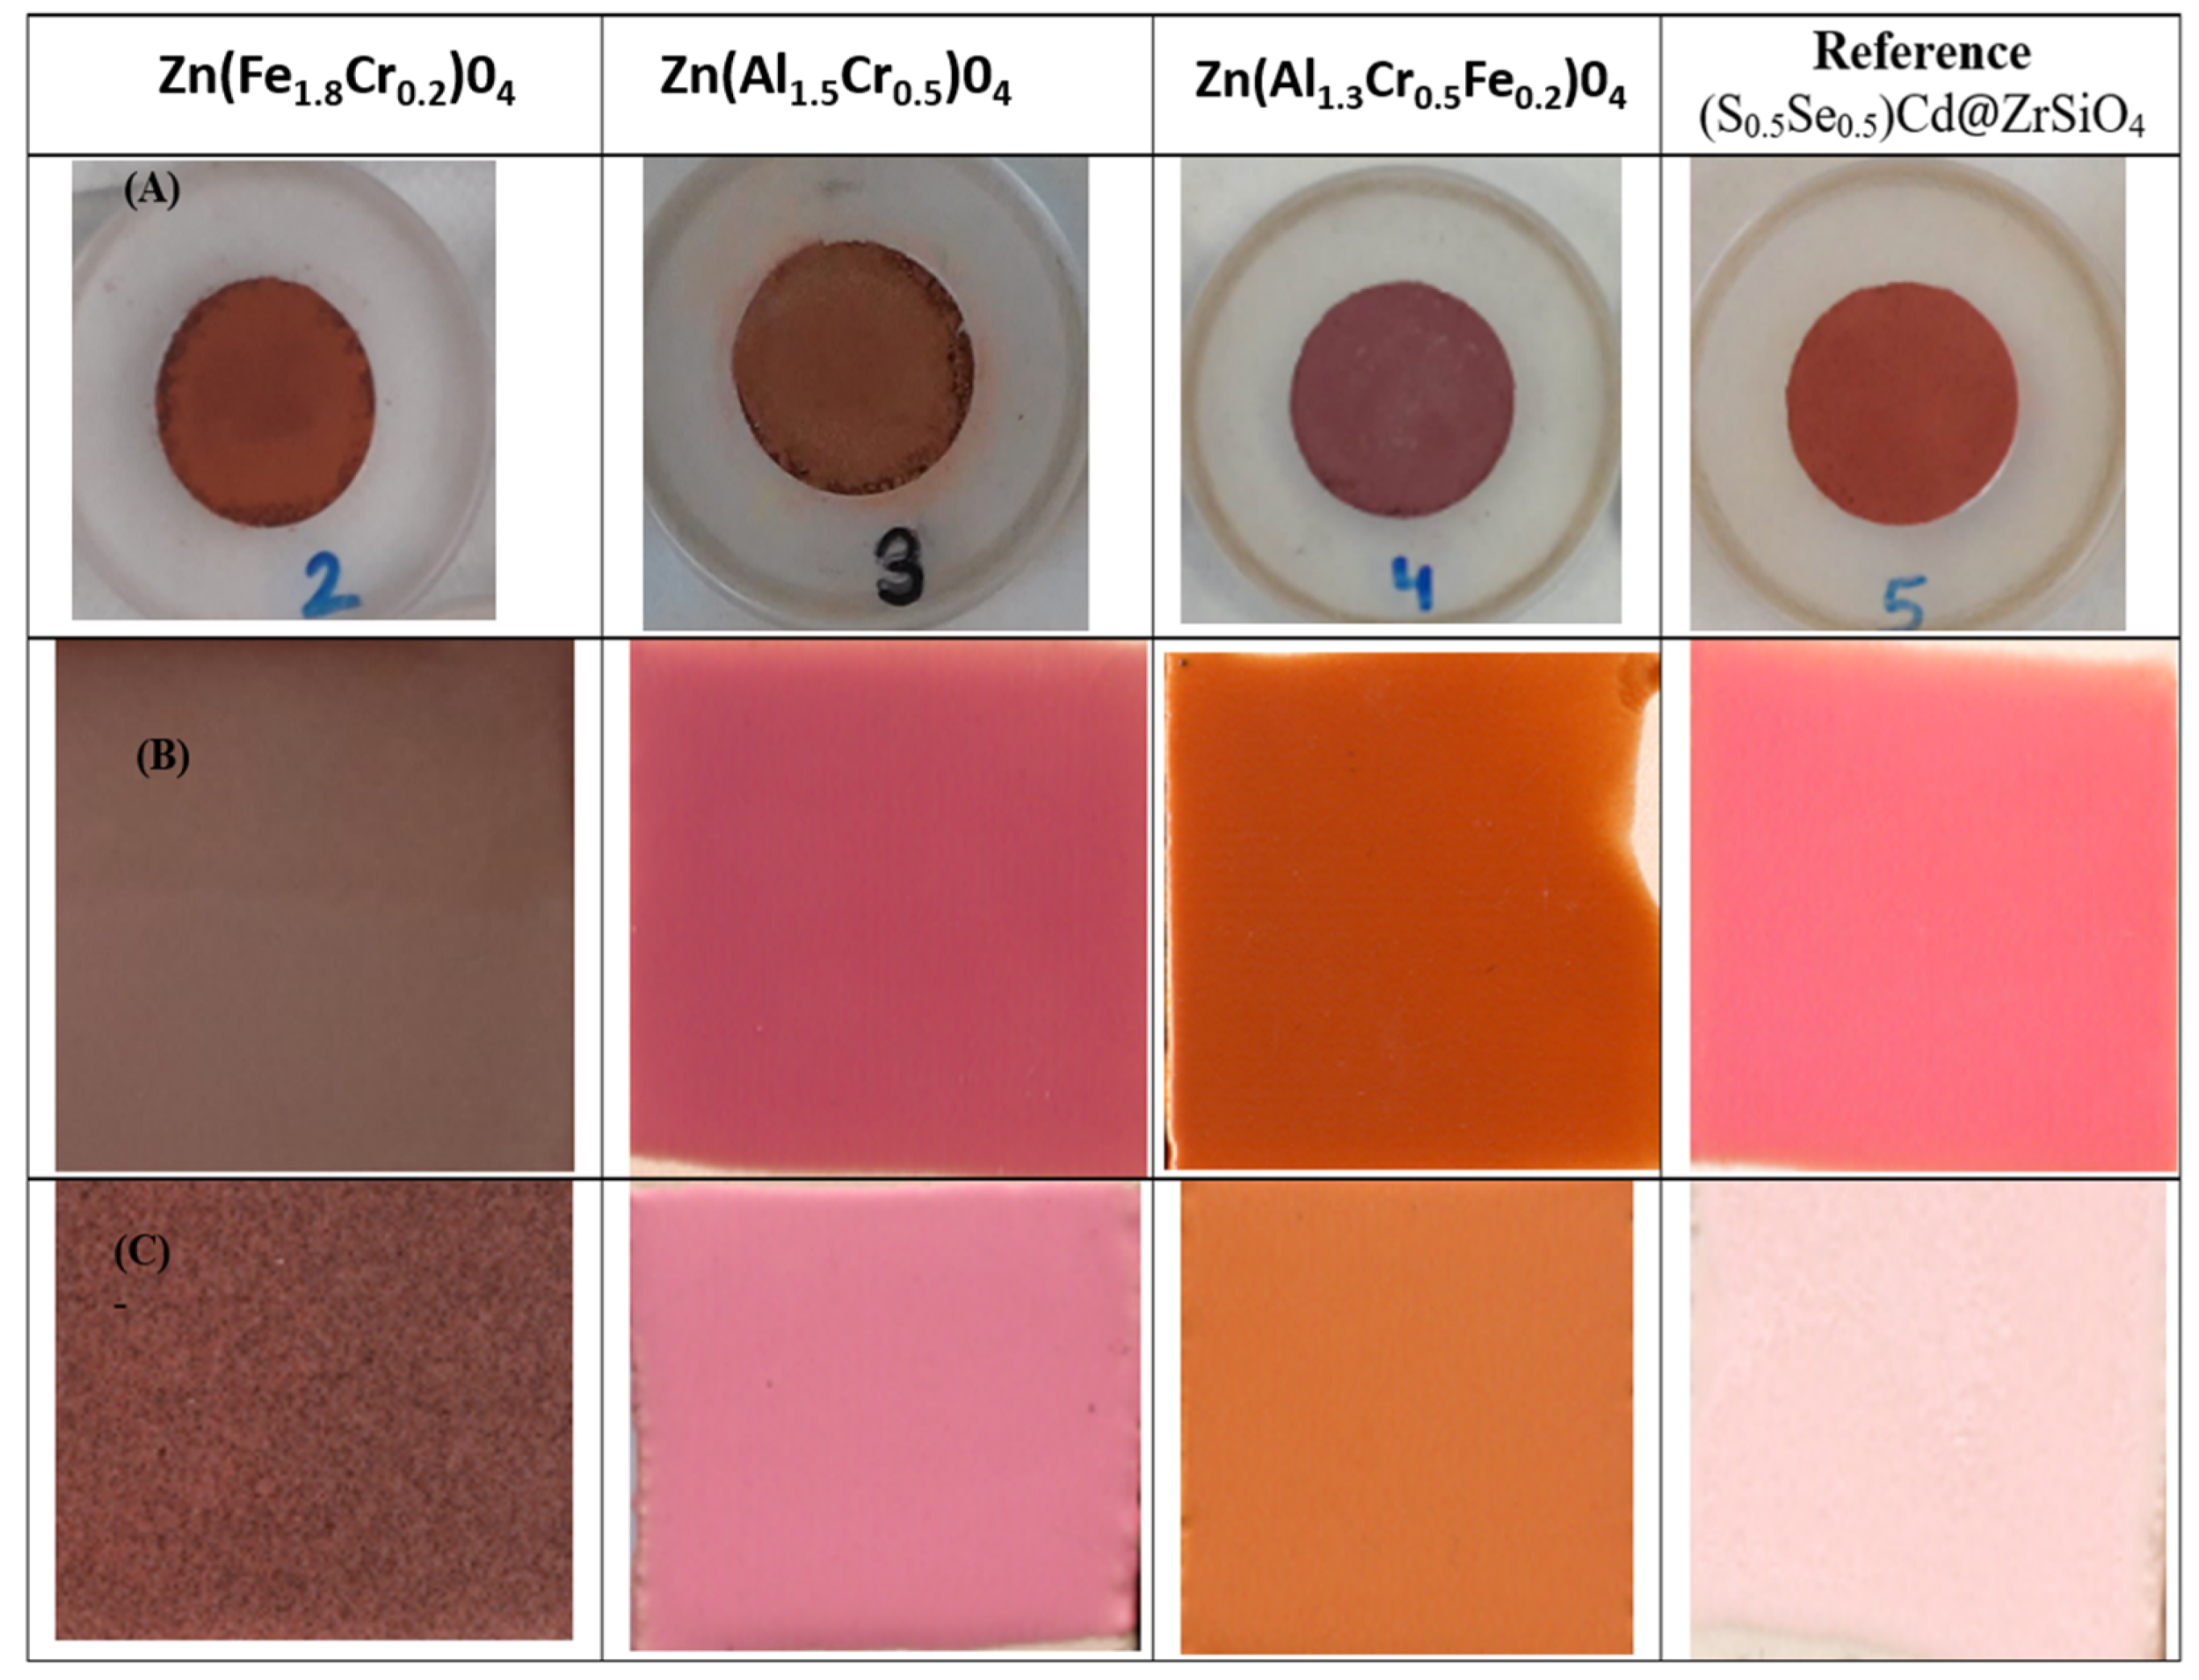
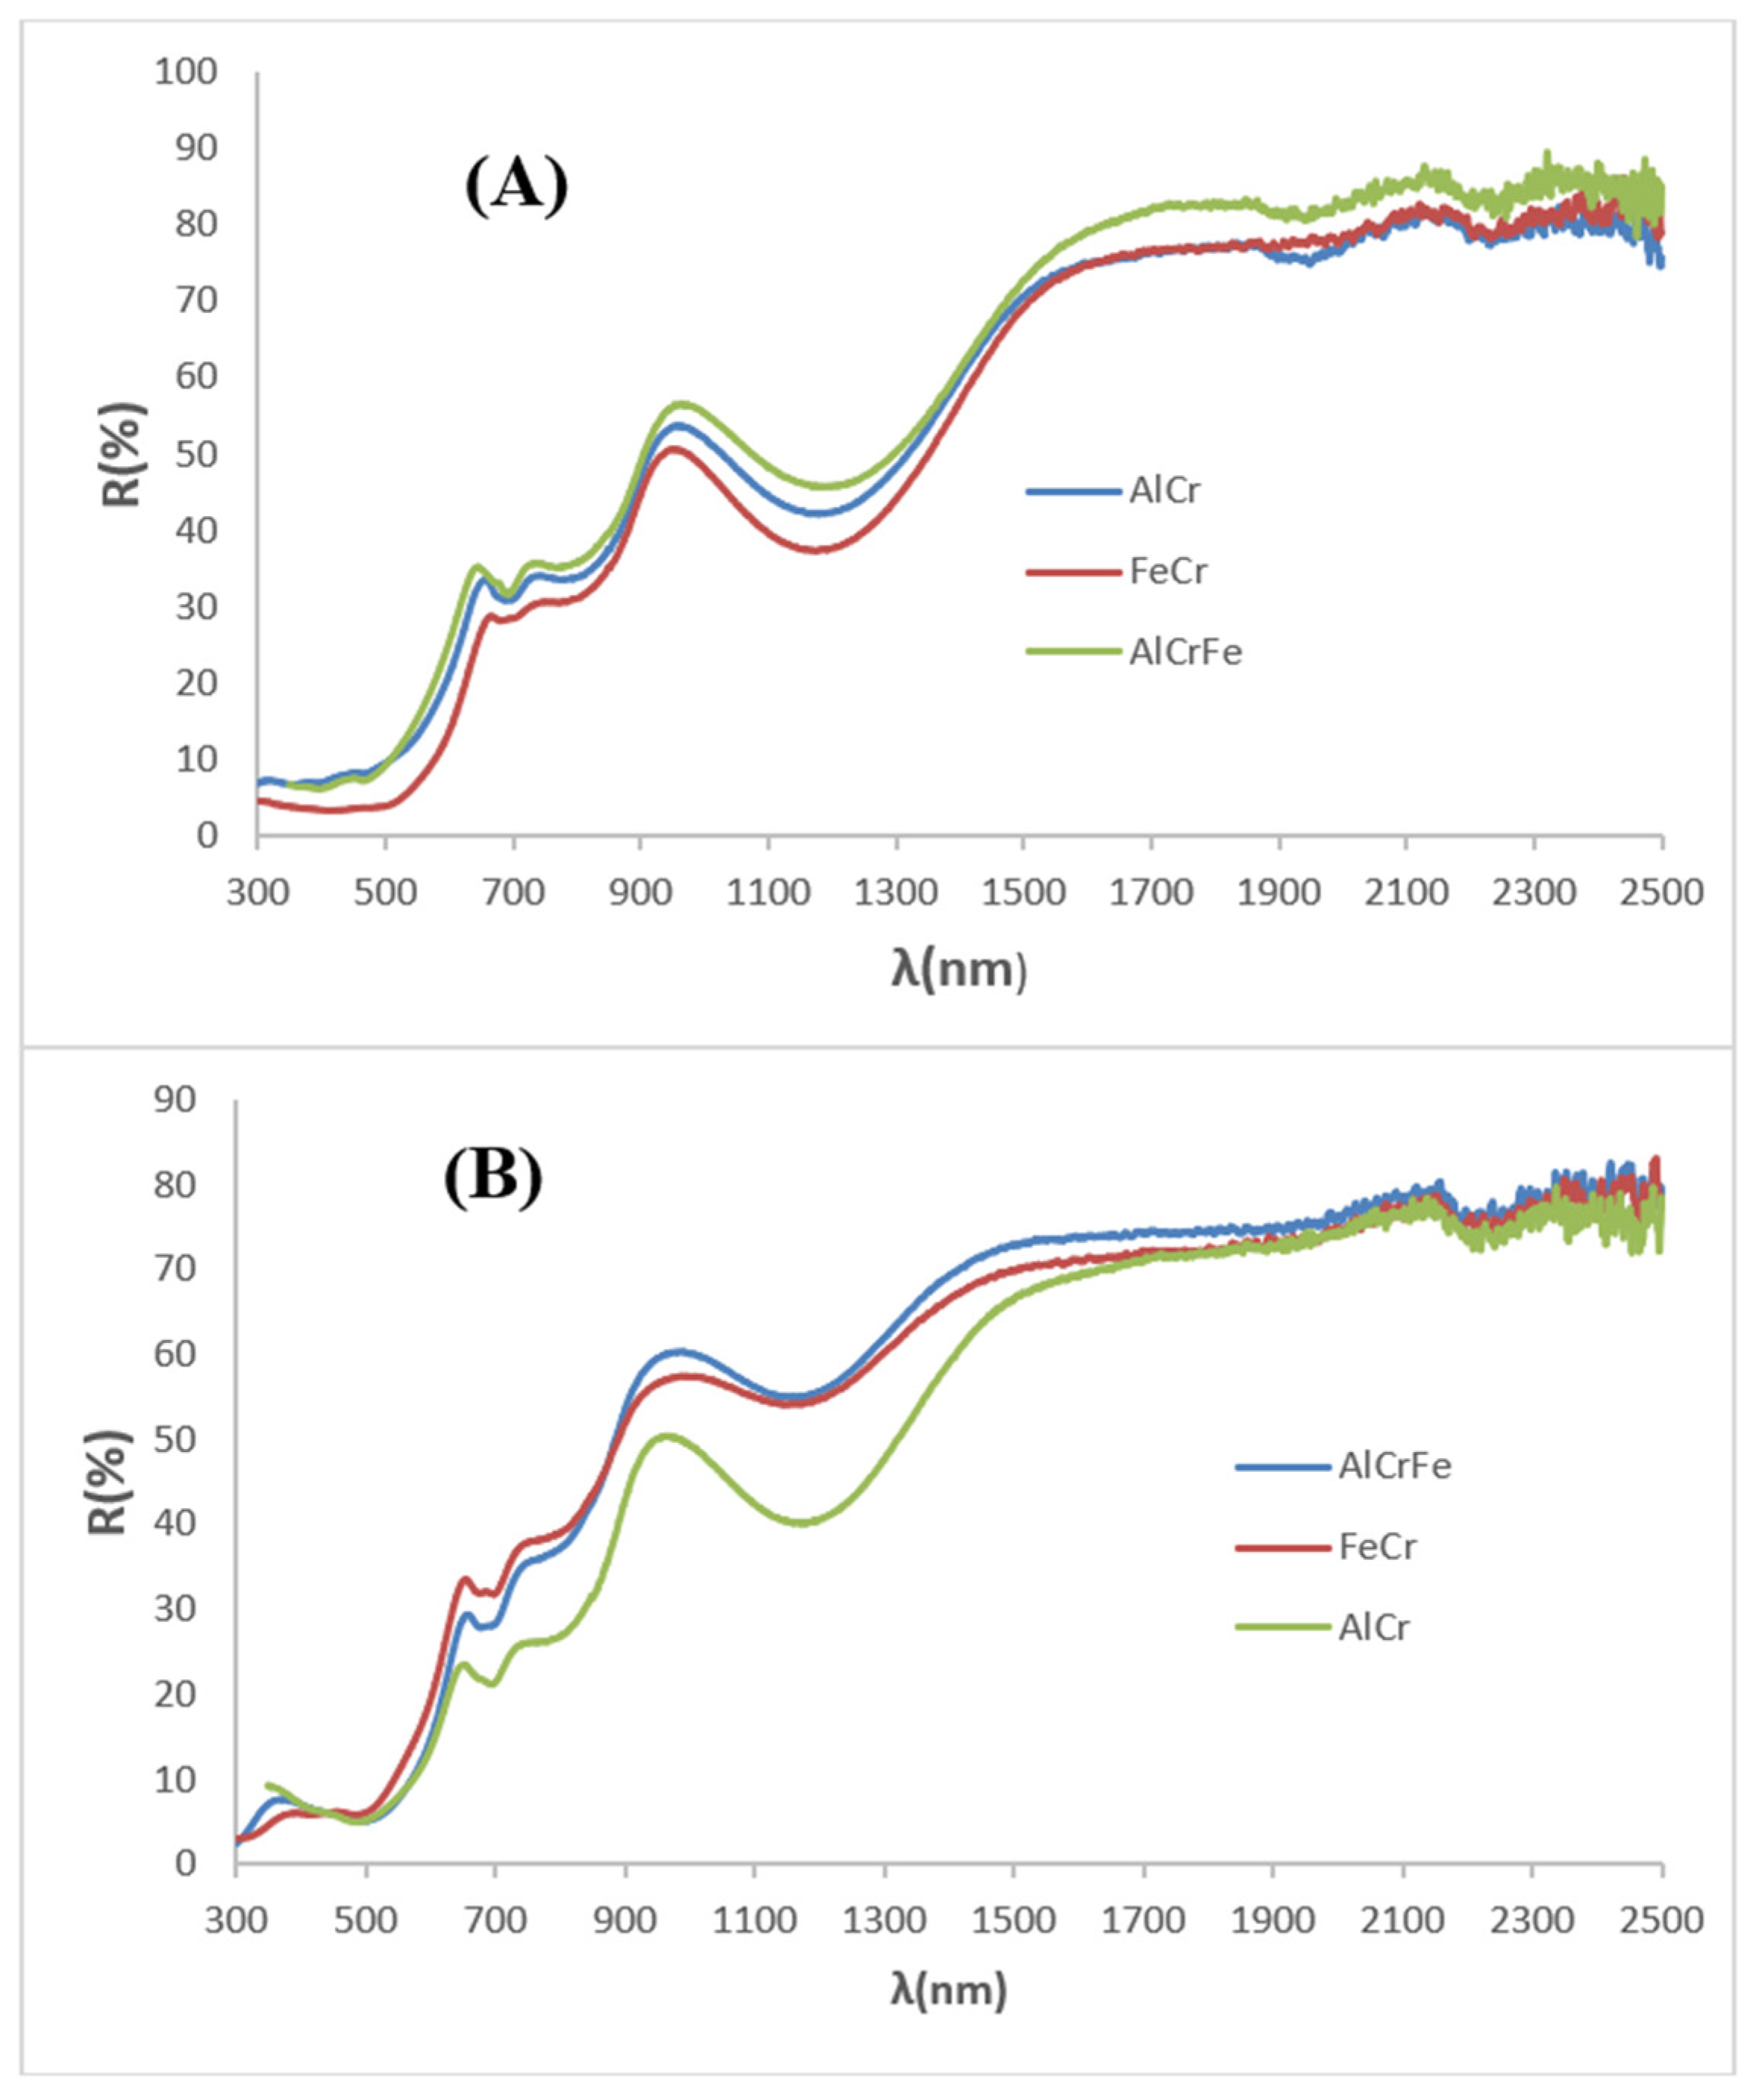
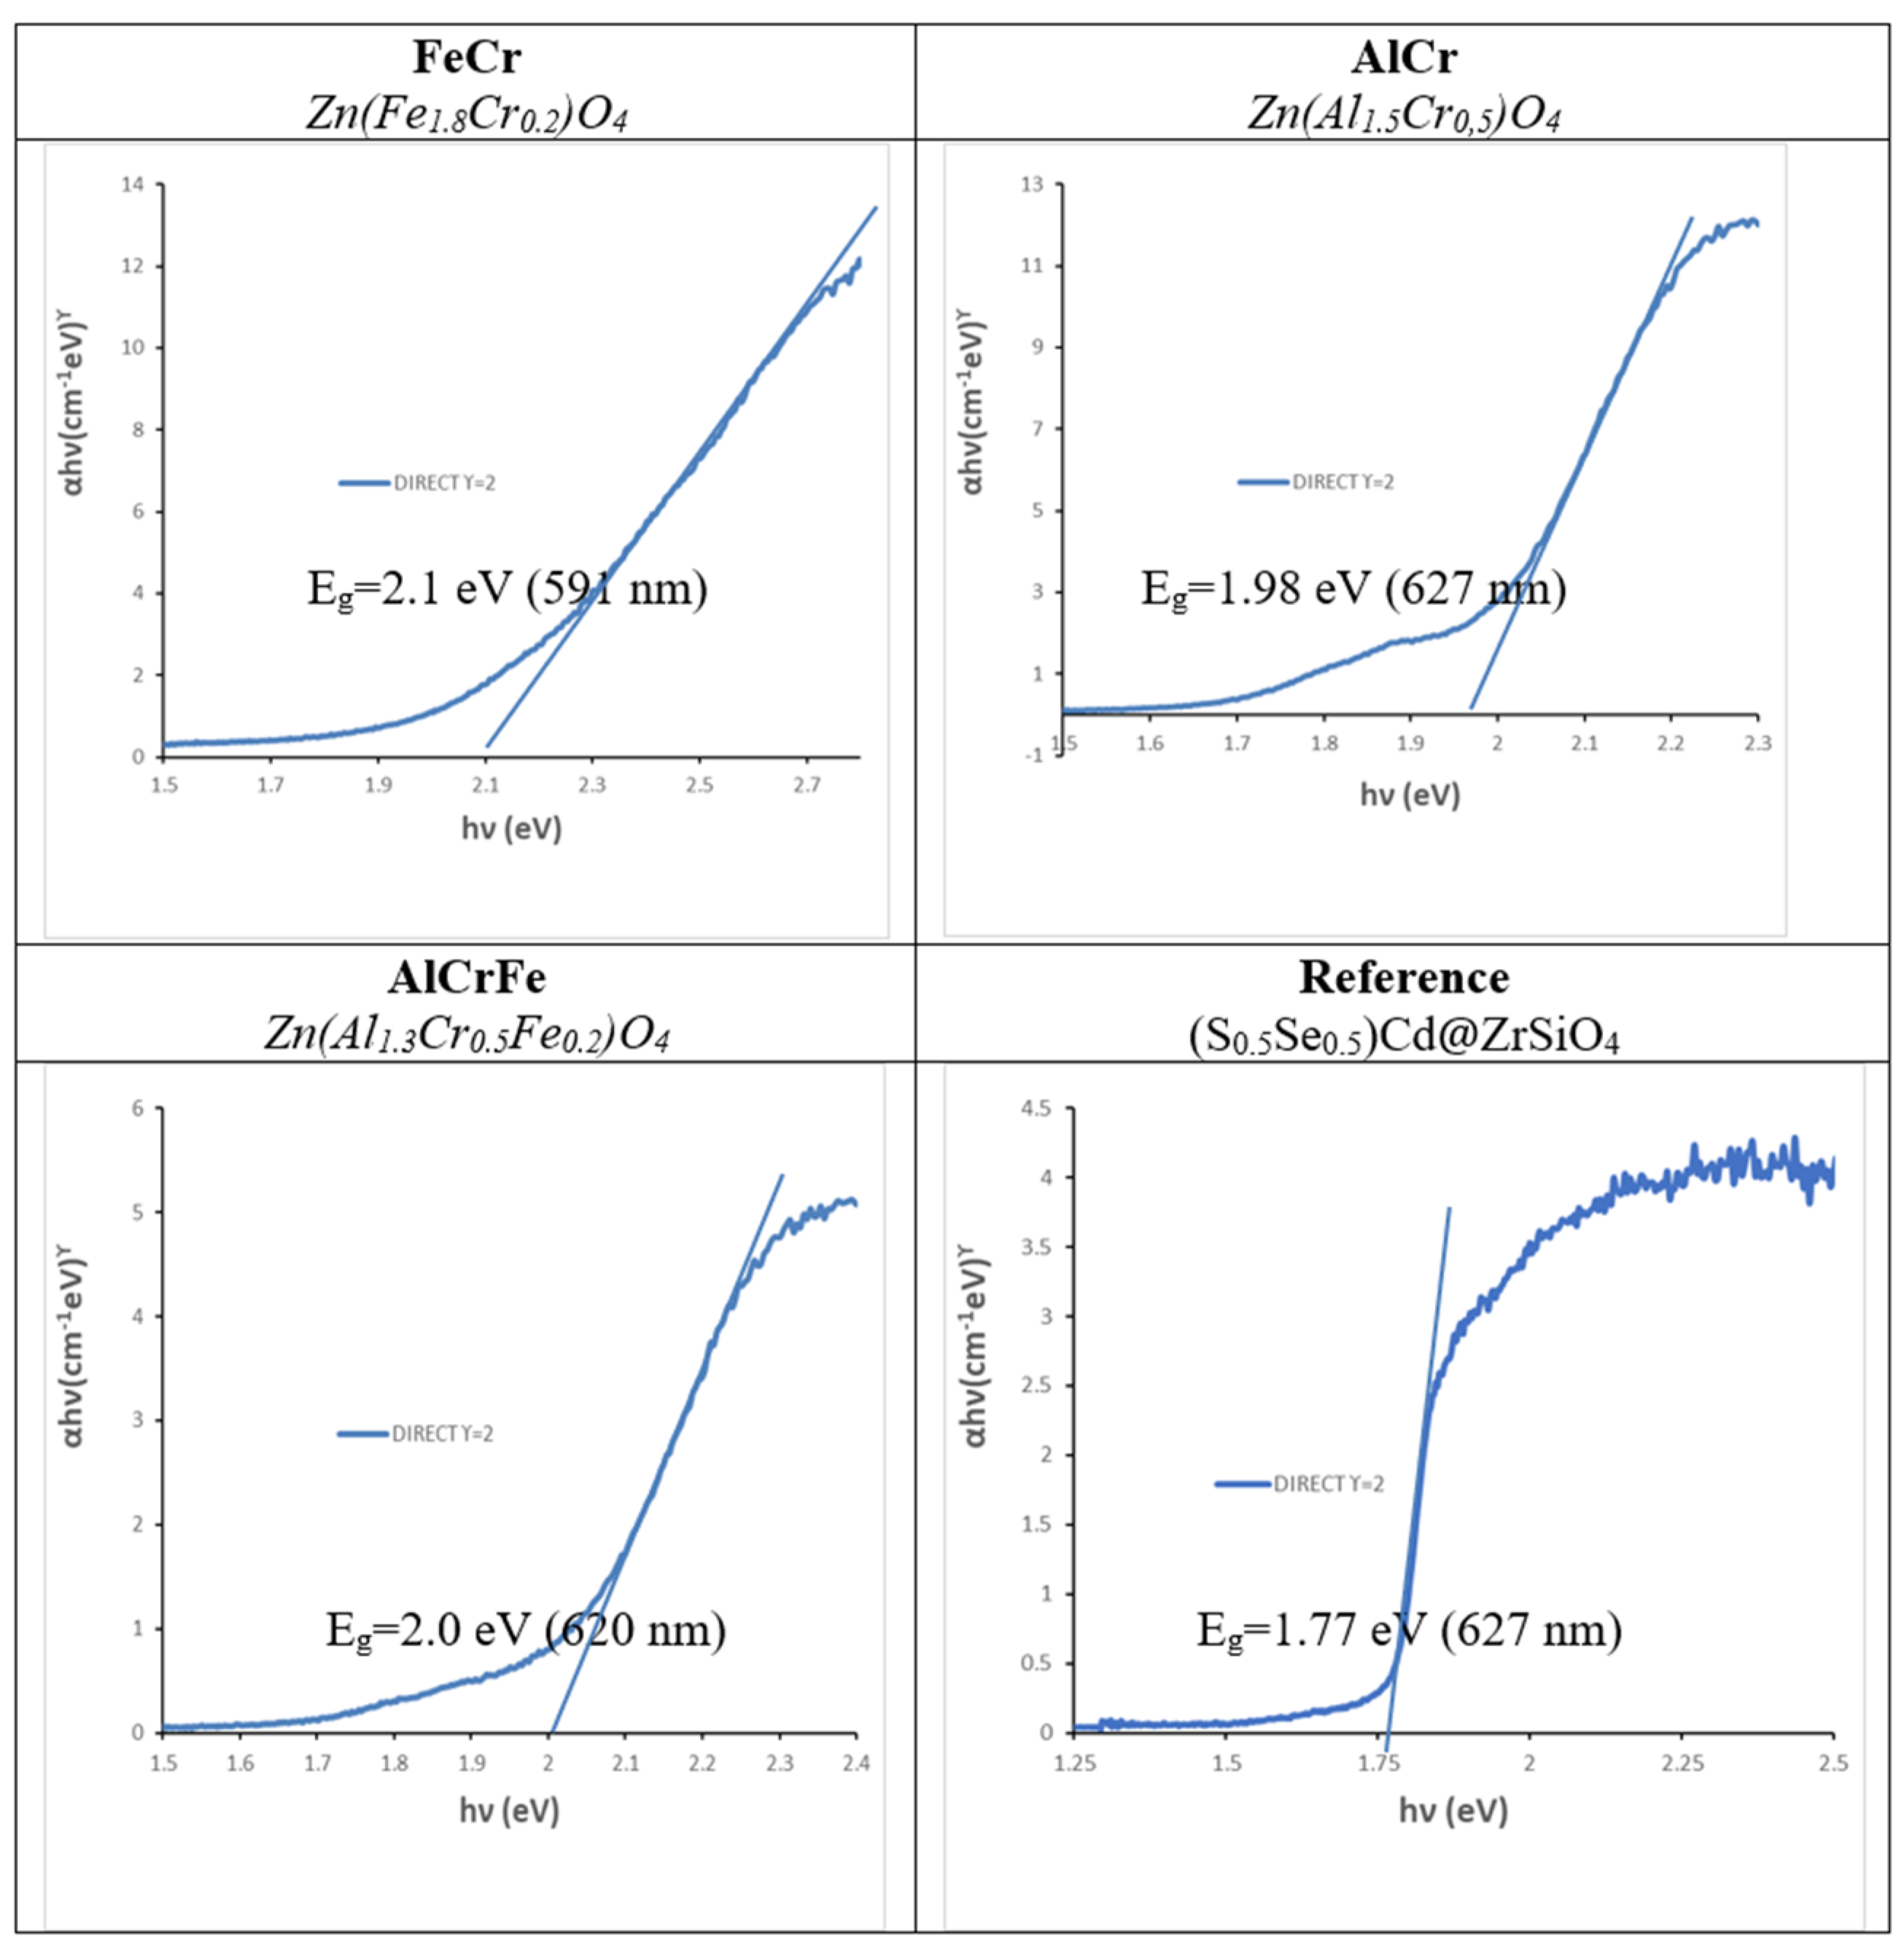
3.4. Summary of Optimised Samples Compared with a Reference

Figure 14 shows a summary of the three reddish optimised samples in the analysed systems compared with cadmium sulfoselenide encapsulated in zircon ((S0.5Se0.5)Cd@ZrSiO4), which is considered the best red ceramic pigment [27] but is considered toxic because of the presence of sulfoselenide. The CIEL*a*b* values and reflectance characteristics of the samples are presented in Table 5. The colour of the powders (Figure 14A) changed from an intense red colour (L* = 32 and a* = 22) for franklinite-zincochromite to a lighter pink shade for the gahnite-zincochromite sample and the franklinite-zincochromite-gahnite system (L* = 51 and 47, a* = 12 and 18, respectively), which was more intense (lower L*) but less reddish (lower a*) than the cadmium sulfoselenide-zircon reference (L* = 53, a* = 23). In the glazed samples at relatively low temperatures (Figure 14B), the evolution was similar, and the spinel colours (with intense clear brown, pink, and red shades, respectively) showed a higher intensity and a lower reddish tone than the red reference; however, in the porcelain frit at a higher temperature (1200 °C), the reference was colourless because the glazes destabilised and dissolved the pigment (Figure 14C).
Figure 15 compares the UV–Vis–NIR diffuse reflectance spectra of the optimised samples ((A) powder samples and (B) glazed samples at low temperature), which show the bands of absorption (minimum reflectance) associated with Cr3+ in the octahedral coordination, overlapped with the bands of Fe3+ in the same coordination when it was present. The NIR reflectance was high for all the powders (45–51%) but slightly lower than that of the reference (RNIR = 58%). In the case of the glazed samples, the RNIR values of the samples and the reference were similar (in the range of 54–60%).
Figure 16 shows the Tauc plots for the three optimised powders, which exhibit direct semiconductor behaviour with a very similar band gap (~2.0 eV, corresponding to visible light at 620 nm). The sulfoselenide zircon reference exhibits a band gap of 1.77 eV.
Figure 17 displays an image of the photoreactor used with the main characteristics of the visible light source and the amounts of photocatalyst and Orange II. Figure 18 shows the results of the photodegradation test of Orange II using the optimised powders, and Table 6 summarises the photodegradation parameters. The results indicate the poor activity of all the samples; only Cr-ZnFe2O4 (Zn(Fe1.8Cr0.2: FeCr in Figure 18) shows a value lower than 300 min for the half-degradation time t1/2; it is similar to that of Ag3PO4 (coprecipitated ~99%), which was used as a reference. In terms of cyclability, the samples lost their activity (t1/2 > 400 min) in the third cycle.
In agreement with Casbeer et al. [19], the moderate results obtained with the microparticles (particle size between 1 and 5 µm) of the studied high NIR reflective reddish pigments and the relative success of Cr-franklinite can be explained by the fact that although ferrites are effective when applied as photocatalysts alone, their activity is more efficient as nanoparticles in composites with other photocatalysts, as well as with other oxidants, such as H2O2. In this regard, Zhu et al. [28] report that magnetic zinc ferrite fine nanoparticles, synthesised by a soft chemical solution process, showed high activity, good reusability, and easy separation ability for visible light-induced Orange II degradation, but in an integrated ZnFe2O4/PMS (peroxymonosulfate, 2KHSO5·KHSO4·K2SO4, OXONE) aqueous system. The photocatalytic mechanism of Zn(Fe1.8Cr0.2 should follow the known mechanism steps triggered by ferrite heterogeneous photocatalysis; photons with energies greater than their band gap energies are absorbed and produce an electron–hole pair in the valence and conduction bands of the semiconductor, which activates the production of the reactive oxygen species (ROS) (hydroxyl radicals, hydroperoxyl radicals, etc.) that oxidise Orange II [29].

4. Conclusions

Franklinite-zincochromite-gahnite solid solutions were prepared by ceramic or coprecipitation methods, and their pigmenting capacity as cool ceramic pigments in different glazes (double and single firing frits and porcelain frit) were studied.
In the case of the franklinite-zincochromite Zn(Fe2−xCrx)O4 solid solutions, the solid solution was saturated at x = 1.8, and unreacted ZnO was detected in this sample. The glazed samples showed red shades, except for x = 0 (pure franklinite, yellow-coloured) and x = 2 (pure zincochromite, grey-coloured), indicating that the solid solution of the two chromophores (Cr3+ and Fe3+) stabilised the spinel lattice while maintaining its identity and colour in the molten glaze, which usually reacts with simple franklinite or zincochromite to produce gahnite by reaction with the Al3+ of the glaze. The best red colour in the single firing glazes was for the x = 0.2 sample (L*a*b* = 37.5/23.4/28.9), with a balanced distribution of cations in the solid solution that maximised its stability. However, the samples darkened with the most aggressive porcelain frit because of the Cr enrichment effect of the spinel phase by the reaction with the porcelain glaze.
The gahnite-zincochromite Zn(Al2−xCrx)O4 solid solutions synthesised by the ammonia coprecipitation method (CO) intensified their red colour with the chromophore (Cr3+) amount in the composition; however, the samples with high chromium darkened in the glazes owing to the Cr enrichment process, and the optimal pink colour in the glazes was obtained with the Zn(Al1.5Cr0.5) composition.
In the case of the ternary gahnite-zincochromite-franklinite Zn(Al1.5−xCr0.5Fex)O4 solid solutions, the red colour increases with the amount of iron; however, as in the binary systems, the samples with a high iron content degrade and darken in the glazes, and Zn(Al1.3Cr0.5Fe0.2)O4 optimises the red colour.
Therefore, according to the criteria of the high red colouring capacity and the high NIR reflectance with the minimum Cr content, Zn(Fe1.8Cr0.2), Zn(Al1.5Cr0.5), and Zn(Al1.3Cr0.5Fe0.2)O4 resulted in the optimal compositions for an intensely reddish cool pigment based on the franklinite-zincochromite, gahnite-zincochromite, and franklinite-zincochromite-gahnite systems, respectively, showing CIEL*a*b* around L*a*b* = 38/23/29 (clear brown), 60/15/11 (pink), and 51/23/25 (red), respectively, in the 5 wt.% glazed samples in a single firing frit.
The NIR reflectance of the optimised samples was high and was associated with their specific composition, particle size, and ionic distribution; it reached values between 45 and 51% in the powder and between 54 and 59% in the glazed samples. All the powders showed direct semiconductor behaviour, with a band gap of approximately 2 eV, which falls in the visible range (620 nm). Its associated visible light photocatalysis on Orange II stands out with the franklinite-zincochromite Zn(Fe1.8Cr0.2) sample, which shows an activity similar to that of the Ag3PO4 that was used as a reference.

Author Contributions

Conceptualisation, G.M.; methodology, G.M. and M.L.; software, J.A.B., G.M. and C.D.; validation, G.M. and C.D.; formal analysis, G.M.; investigation, J.A.B., G.M. and M.L.; resources, J.A.B. and G.M.; original draft preparation, C.D., G.M. and M.L.; writing—review and editing, G.M. and C.D.; visualisation, J.A.B. and G.M.; supervision, G.M.; project administration, G.M.; funding acquisition, G.M. and M.L. All authors have read and agreed to the published version of the manuscript.

Funding

This research was funded by Universitat Jaume I. The authors gratefully acknowledge the financial support of Universitat Jaume I (UJI-B2021-73 project).

Institutional Review Board Statement

Not applicable.

Informed Consent Statement

Not applicable.

Data Availability Statement

The data presented in this study are available in this article.

Conflicts of Interest

The authors declare no conflict of interest.

References

  1. Sickafus, K.E.; Wills, J.M.; Grimes, N.W. Structure of Spinel. J. Am. Ceram. Soc. 1999, 82, 3279–3292. [Google Scholar] [CrossRef]
  2. Burdett, J.K.; Price, G.L.; Price, S.L. Role of the crystal-field theory in determining the structures of spinels. J. Am. Chem. Soc. 1982, 104, 92–95. [Google Scholar] [CrossRef]
  3. O’Neil, H.S.T.; Navrotsky, A. Simple spinels: Crystallographic parameters, cation radii, lattice energies, and cation distribution. Am. Mineral. 1983, 68, 181–194. [Google Scholar]
  4. Bohra, M.; Prasad, S.; Kumar, N.; Misra, D.S.; Sahoo, S.C.; Venkataramani, N.; Krishnan, R. Large room temperature magnetization in nanocrystalline zinc ferrite thin films. Appl. Phys. Lett. 2006, 488, 262506. [Google Scholar] [CrossRef]
  5. Tanaka, K.; Katsuta, M.; Nakashima, S.; Fujita, K.J. Hydrothermal Synthesis and Magnetic Properties of Zinc Ferrite Nanocrystals. Jpn. Soc. Powder Powder Metall. 2004, 52, 221–227. [Google Scholar] [CrossRef]
  6. Monrós, G.; Badenes, J.A.; Llusar, M. Ecofriendly High NIR Reflectance Ceramic Pigments Based on Rare Earths Compared with Classical Chromophores Prepared by DPC Method. Ceramics 2022, 5, 614–641. [Google Scholar] [CrossRef]
  7. Ayana, Y.M.A.; El-Sawy, S.M.; Salah, S.H. Zinc-ferrite pigment for corrosion protection. Anti-Corros. Methods Mater. 1997, 44, 381–388. [Google Scholar] [CrossRef]
  8. Calbo, J.; Sorlí, S.; Llusar, M.; Tena, M.A.; Monrós, G. Minimisation of toxicity in nickel ferrite black pigment. Br. Ceram. Trans. 2004, 103, 3–9. [Google Scholar] [CrossRef]
  9. Schwarz, M.; Veverka, M.; Michalková, E.; Lalík, V.; Veverková, D. Utilisation of industrial waste for ferrite pigments production. Chem. Pap. 2012, 66, 248–258. [Google Scholar] [CrossRef]
  10. Lahmer, M.A. The effect of degree of inversion on the electronic and optical properties of ZnAl2O4: A first-principles study. Comput. Condens. Matter 2023, 37, e00857. [Google Scholar] [CrossRef]
  11. Granone, L.I.; Dillert, R.; Heitjans, P.; Bahnemann, D.W. Effect of the degree of inversion on the electrical conductivity of spinel ZnFe2O4. ChemistrySelect 2019, 4, 1232–1239. [Google Scholar] [CrossRef]
  12. Quintero, J.J.M.; Rodríguez, K.L.S.; Torres, C.E.R.; Errico, L.A. Ab initio study of the role of defects on the magnetic response and the structural, electronic and hyperfine properties of ZnFe2O4. J. Alloy Compd. 2019, 775, 1117. [Google Scholar] [CrossRef]
  13. Peng, C.; Gao, L. Optical and Photocatalytic Properties of Spinel ZnCr2O4 Nanoparticles Synthesized by a Hydrothermal Route. J. Am. Ceram. Soc. 2008, 9, 2388–2390. [Google Scholar] [CrossRef]
  14. Mousavi, Z.; Soofivand, F.; Mahdiyeh Esmaeili-Zare, M.; Salavati-Niasari, M.; Bagheri, S. ZnCr2O4 Nanoparticles: Facile Synthesis, Characterization and Photocatalytic Properties. Sci. Rep. 2016, 6, 20071. [Google Scholar] [CrossRef] [PubMed]
  15. Bendiganavale, A.K.; Malshe, V.C. Infrared Reflective Inorganic Pigments. Recent Pat. Chem. Eng. 2008, 1, 67–79. [Google Scholar]
  16. Kortüm, G. Reflectance Spectroscopy, Principles, Methods, Applications; Springer: Berlin/Heidelberg, Germany, 1969; ISBN 978-3-642-88071. [Google Scholar]
  17. Monrós, G. Scheelite and Zircon: Brightness, Color and NIR Reflectance in Ceramics; Nova Science Publishers: New York, NY, USA, 2021; ISBN 978-1-53619-332-9. [Google Scholar]
  18. May-Lozano, M.; Mendoza-Escamilla, V.; Rojas-García, E.; López-Medina, V.; Rivadeneyra-Romero, G.; Martinez-Delgadillo, S.A. Sonophotocatalytic degradation of Orange II dye using low cost photocatalyst. J. Clean. Prod. 2017, 148, 836–844. [Google Scholar] [CrossRef]
  19. Casbeer, E.; Sharma, V.K.; Li, X. Synthesis and photocatalytic activity of ferrites under visible light: A review. Sep. Purif. Technol. 2012, 87, 1–14. [Google Scholar] [CrossRef]
  20. CIE Comission International de l’Eclairage. Recommendations on Uniform Color Spaces, Colour Difference Equations, Psychometrics Colour Terms; Bureau Central de la CIE: Paris, France, 1978; Available online: https://cie.co.at/ (accessed on 14 September 2022).
  21. Tauc, J.; Grigorovici, R.; Vancu, A. Optical Properties and Electronic Structure of Amorphous Germanium. Phys. Status Solidi 1996, 15, 627–637. [Google Scholar] [CrossRef]
  22. Standard G173-03; Standard Tables for Reference Solar Spectral Irradiances: Direct Normal and Hemispherical on 37° Tilted Surface. ASTM International: West Conshohocken, PA, USA, 2013.
  23. Liu, J.J.; Fu, X.L.; Chen, S.F.; Zhu, Y.F. Electronic structure and optical properties of Ag3PO4 photocatalyst calculated by hybrid density functional method. Appl. Phys. Lett. 2011, 99, 191903. [Google Scholar] [CrossRef]
  24. Kumar, K.V.; Porkodi, K.; Rocha, F. Langmuir–Hinshelwood kinetics—A theoretical study. Catal. Commun. 2008, 9, 82–84. [Google Scholar] [CrossRef]
  25. Verger, L.; Olivier, D.; Rousse, G.; Cotte, M.; Cormier, L. The Stability of Gahnite Doped with Chromium Pigments in Glazes from the French Manufacture of Sèvres. J. Am. Ceram. Soc. 2016, 100, 86–95. [Google Scholar] [CrossRef]
  26. Zen, E. Validity of Vegard’s law. Am. Mineral. 1956, 41, 523–524. [Google Scholar]
  27. Lambies, L.V.; Rincon, L.J.M. Mechanism of formation of a zircon-cadmium sulfoselenide pigment. Trans. J. Br. Ceram. Soc. 1981, 80, 105–108. [Google Scholar]
  28. Zhu, K.; Wang, J.; Wang, Y.; Jina, C.; Ganeshrajaa, A.S. Visible-light-induced photocatalysis and peroxymonosulfate activation over ZnFe2O4 fine nanoparticles for degradation of Orange II. Catal. Sci. Technol. 2016, 6, 2296–2304. [Google Scholar] [CrossRef]
  29. Kumbhar, S.S.; Mahadik, M.A.; Shinde, S.S.; Rajpure, K.Y.; Bhosale, C.H. Fabrication of ZnFe2O4 films and its application in photoelectrocatalytic degradation of salicylic acid. J. Photochem. Photobiol. B Biol. 2015, 142, 118–123. [Google Scholar] [CrossRef]
Figure 1. Franklinite-zincochromite Zn(Fe2−xCrx)O4 solid solutions: (A) powders synthesised at 1000 °C for 3 h, (B) 5 wt.% glazed powders in a single firing frit 1080 °C, (C) 5 wt.% glazed powders in a single firing porcelain frit 1200 °C.
Ceramics 07 00022 g001
Figure 2. X-ray diffractograms (XRD) of franklinite-zincochromite Zn(Fe2−xCrx)O4 solid solutions synthesised at 1000 °C for 3 h (Z=ZnO).
Ceramics 07 00022 g002
Figure 3. Evolution of the volume of the cubic cell of the corresponding spinel Zn(Fe2xCrx)O4 solid solution synthesised at 1000 °C for 1 h.
Ceramics 07 00022 g003
Figure 4. UV–Vis–NIR diffuse reflectance spectra of franklinite-zincochromite Zn(Fe2−xCrx)O4 solid solutions: (A) fired powders at 1000 °C for 3 h; (B) 5 wt.% glazed in a single firing frit at 1080 °C.
Ceramics 07 00022 g004
Figure 5. Gahnite-zincochromite Zn(Al2−xCrx)O4 solid solutions synthesised by ammonia coprecipitation: (A) raw dried gels, (B) powders fired at 1000 °C for 1 h, (C) 5 wt.% glazed in double firing frit with some lead (6 wt.% PbO) 1000 °C, (D) 5 wt.% glazed in single firing frit 1080 °C, and (E) 5 wt.% glazed in porcelain single firing frit 1200 °C, with indication of the CIEL*a*b* values.
Ceramics 07 00022 g005
Figure 6. X-ray diffractograms (XRD) of gahnite-zincochromite Zn(Al2−xCrx)O4 solid solutions synthesised at 1000 °C for 1 h with the evolution of the volume of the cubic cell of the corresponding spinel with x.
Ceramics 07 00022 g006
Figure 7. Evolution of the volume of the cubic cell of the corresponding spinel Zn(Al2−xCrx)O4 solid solutions synthesised at 1000 °C for 1 h.
Ceramics 07 00022 g007
Figure 8. UV–Vis–NIR spectra of powders and glazed samples of gahnite-zincochromite Zn(Al2−xCrx)O4 solid solutions synthesised by ammonia coprecipitation fired at 1000 °C for 1 h.
Ceramics 07 00022 g008
Figure 9. (A) TEM micrographs of raw gel of coprecipitated sample Zn(Al2−xCrx)O4 x = 0.5; (B) SEM images and EDS composition of global particles and mapping, respectively, of the same sample fired at 1000 °C for 1 h.
Ceramics 07 00022 g009
Figure 10. Effect of addition of Al and Cr (Zn(Al1.5−xCr0.5Fex)O4): (A) raw dried gels, (B) fired powders at 1000 °C for 1 h, (C) 5 wt.% glazed samples in a single firing frit at 1080 °C, (D) 5 wt.% glazed samples in a porcelain single firing frit at 1200 °C.
Ceramics 07 00022 g010
Figure 11. XRD of Zn(Al1.5−xCr0.5Fex)O4 coprecipitated samples fired at 1000 °C for 1 h.
Ceramics 07 00022 g011
Figure 12. UV–Vis–NIR diffuse reflectance spectra of Zn(Al1.5−xCr0.5Fex)O4 coprecipitated samples fired at 1000 °C for 1 h: (A) powder, (B) glazed samples in single firing frit at 1080 °C.
Ceramics 07 00022 g012
Figure 13. (A) TEM micrographs of raw gel nanoparticles of the optimal coprecipitated sample Zn(Al1.3Cr0.5Fe0.2)O4; (B) SEM micrograph of the same sample fired at 1000 °C for 1 h.
Ceramics 07 00022 g013
Figure 14. Summary of the three reddish optimised samples compared with a commercial cadmium sulfoselenide encapsulated in zircon ((S0.5Se0.5)Cd@ZrSiO4): (A) powders, (B) 5 wt.% glazed in single firing frit at 1080 °C, (C) 5 wt.% glazed in porcelain single firing frit at 1200 °C.
Ceramics 07 00022 g014
Figure 15. UV–Vis–NIR diffuse reflectance spectra of optimised samples: (A) powders; (B) glazed samples in single firing frit.
Ceramics 07 00022 g015
Figure 16. Tauc plots of optimised samples.
Ceramics 07 00022 g016
Figure 17. Image of the photoreactor employed and conditions of photodegradation test.
Ceramics 07 00022 g017
Figure 18. Photodegradation test of Orange II with the optimised powders.
Ceramics 07 00022 g018
Table 1. Weight composition (% in oxides) of the employed frits.
OXIDE(a) Double Firing with Pb, 1000 °C(b) Single Firing, 1080 °C(c) Single Firing
Porcelain, 1200 °C
SiO2756567
Na2O52-
K2O243
CaO21112.5
MgO-21.5
ZnO-7.56.5
Al2O3108.59
PbO6--
Table 2. Reflectance of Zn(Fe2−xCrx)O4 solid solutions (1000 °C for 3 h) and 5 wt.% glazed samples in a single firing frit 1080 °C: in the visible (RVis), in the near-infrared (RNIR), and the total (R).
xL*a*b*RVis/RNIR/R (%)
Powder
046.6/25.3/34.822/54/36
0.244.6/20.4/22.618/52/33
0.542.5/20.1/22.516/50/31
1.042.9/18.3/19.815/47/29
1.547.5/16.6/19.317/47/30
1.845.9/15.3/23.119/41/29
2.053.6/0.4/10.921/32/26
Glazed
1080 °C
064.1/5.3/25.433/48/39
0.237.5/23.4/28.915/44/28
0.537.9/20.4/18.615/48/29
1.036.9/18.1/14.914/49/29
1.534.9/19.8/21.413/47/28
1.839.2/16.7/19.015/37/25
2.050.7/−2.0/8.025/29/27
Glazed
1200 °C
038.5/6.4/4.3
0.248/8.9/15.2
0.5-
1.0-
1.546.2/6.2/8.1
1.8-
2.032.5/2.1/6.4
Table 3. Reflectance of Zn(Al2−xCrx)O4 solid solutions (raw gels and fired at 1000 °C for 3 h) and 5 wt.% glazed samples in double firing frit with some lead (6 wt.% PbO) 1000 °C: in the visible (RVis), in the near-infrared (RNIR), and the total (R).
xL*a*b*RVis/RNIR/R (%)
Gels
0.0268.2/1.3/2.2
0.0565.3/0.0/4.3
0.160.5/−1.4/6.4
0.254.1/−1.2/7.3
0.348.1/−2.2/6.3
0.444.2/−2.3/7.1
0.540.2/−3.2/2.3
0.7531.1/−3.2/−1.2
Powder
0.0272.1/1/.2/2.136/45/41
0.0570.4/3.2/3.125/45/35
0.163.4/6.2/4.222/45/33
0.257.3/8.2/5.320/44/32
0.351.2/8.3/4.319/43/31
0.447.1/9.2/4.220/43/31
0.545.2/11.2/3.221/45/32
0.7536.4/2.1/2.018/42/28
Glazed
1000 °C
0.0280.2/5.1/16.272/46/59
0.0580.0/7.1/17.066/46/56
0.172.5/10.3/20.044/49/47
0.266.0/13.4/21.136/51/42
0.361.4/15.2/20.324/50/37
0.456.1/14.2/16.421/52/36
0.554.2/14.3/16.120/54/37
0.7544.3/5.2/13.017/43/29
Table 4. L*a*b* colour parameters and reflectance of (Zn(Al1.5−xCr0.5Fex)O4) raw gels and fired powders at 1000 °C for 3 h) and 5 wt.% glazed samples in a single firing frit at 1080 °C and in a porcelain single firing frit at 1200 °C: in the visible (RVis), in the near-infrared (RNIR), and the total (R).
xL*a*b*RVis/RNIR/R (%)
Gels
054.2/−1.1/7.0
0.0552.3/2.2/5.4
0.144.3/5.1/9.0
0.244.2/5.2/8.3
0.342.3/6.4/8.0
Powder
057.0/8.1/5.221/45/33
0.0552.1/10.0/12.122/46/34
0.153.2/12.2/17.220/50/37
0.250.2/11.1/17.219/51/34
0.349.2/12.1/18.219/50/33
Glazed
1080 °C
060.2/15.3/11.220/54/37
0.0555.2/17.2/18.120/58/39
0.156.3/21.2/25.022/58/40
0.251.2/23.2/25.117/59/38
0.351.2/21.2/24.319/58/38
Glazed
1200 °C
069.1/13.0/9.2
0.0566.1/14.2/17.0
0.166.4/16.0/22.2
0.261.5/18.3/27.2
0.357.5/15.2/24.3
Table 5. L*a*b* colour parameters and reflectance of the three reddish optimised samples compared with a commercial cadmium sulfoselenide encapsulated in zircon ((S0.5Se0.5)Cd@ZrSiO4): (a) powders, (b) 5 wt.% glazed in single firing frit 1080 °C, (c) 5 wt.% glazed in porcelain single firing frit 1200 °C.
L*a*b*RVis/RNIR/R (%)
Powder
Zn(Fe1.8Cr0.2)O436.2/22.1/21.014/48/30
Zn(Al1.5Cr0.5)O451.3/12.5/8.221/45/32
Zn(Al1.3Cr0.5Fe0.2)O447.0/17.1/19.219/51/34
Reference
(S0.5Se0.5)Cd@ZrSiO4
53.2/23.1/12.221/58/39
Glazed
1080 °C
Zn(Fe1.8Cr0.2)O438.3/23.2/29.318/56/36
Zn(Al1.5Cr0.5)O460.2/15.0/11.020/54/37
Zn(Al1.3Cr0.5Fe0.2)O451.5/23.4/25.317/59/38
Reference
(S0.5Se0.5)Cd@ZrSiO4
62.2/33.4/16.226/64/45
Glazed
1200 °C
Zn(Fe1.8Cr0.2)O448.0/8.9/15.215/43/29
Zn(Al1.5Cr0.5)O469.3/13.2/9.126/57/42
Zn(Al1.3Cr0.5Fe0.2)O461.0/18.2/27.320/62/41
Reference
(S0.5Se0.5)Cd@ZrSiO4
colourless-
Table 6. Photodegradation parameters of the photodegradation test on Orange II with the optimised powders with visible light (t1/2 is the half-time of Orange II degradation and R2 the coefficient of determination in the Langmuir–Hinshelwood model).
Eg (eV)t1/2 (min)R2
Zn(Fe1.8Cr0.2)2.102130.8341
Zn(Al1.5Cr0.5)1.983460.9679
Zn(Al1.3Cr0.5Fe0.2)O42.004330.8177
((S0.5Se0.5)Cd@ZrSiO41.772670.9870
Ag3PO42.452300.9976
Disclaimer/Publisher’s Note: The statements, opinions and data contained in all publications are solely those of the individual author(s) and contributor(s) and not of MDPI and/or the editor(s). MDPI and/or the editor(s) disclaim responsibility for any injury to people or property resulting from any ideas, methods, instructions or products referred to in the content.

