

Silicon Carbide Precursor: Structure Analysis and Thermal Behavior from Polymer Cross-Linking to Pyrolyzed Ceramics

 , ,
, ,
Abstract
1. Introduction
2. Materials and Methods
2.1. Materials
2.2. NMR Characterization of the Raw Polysiloxane
2.3. Characterizations of Cross-Linked Silres H62C
3. Results and Discussion
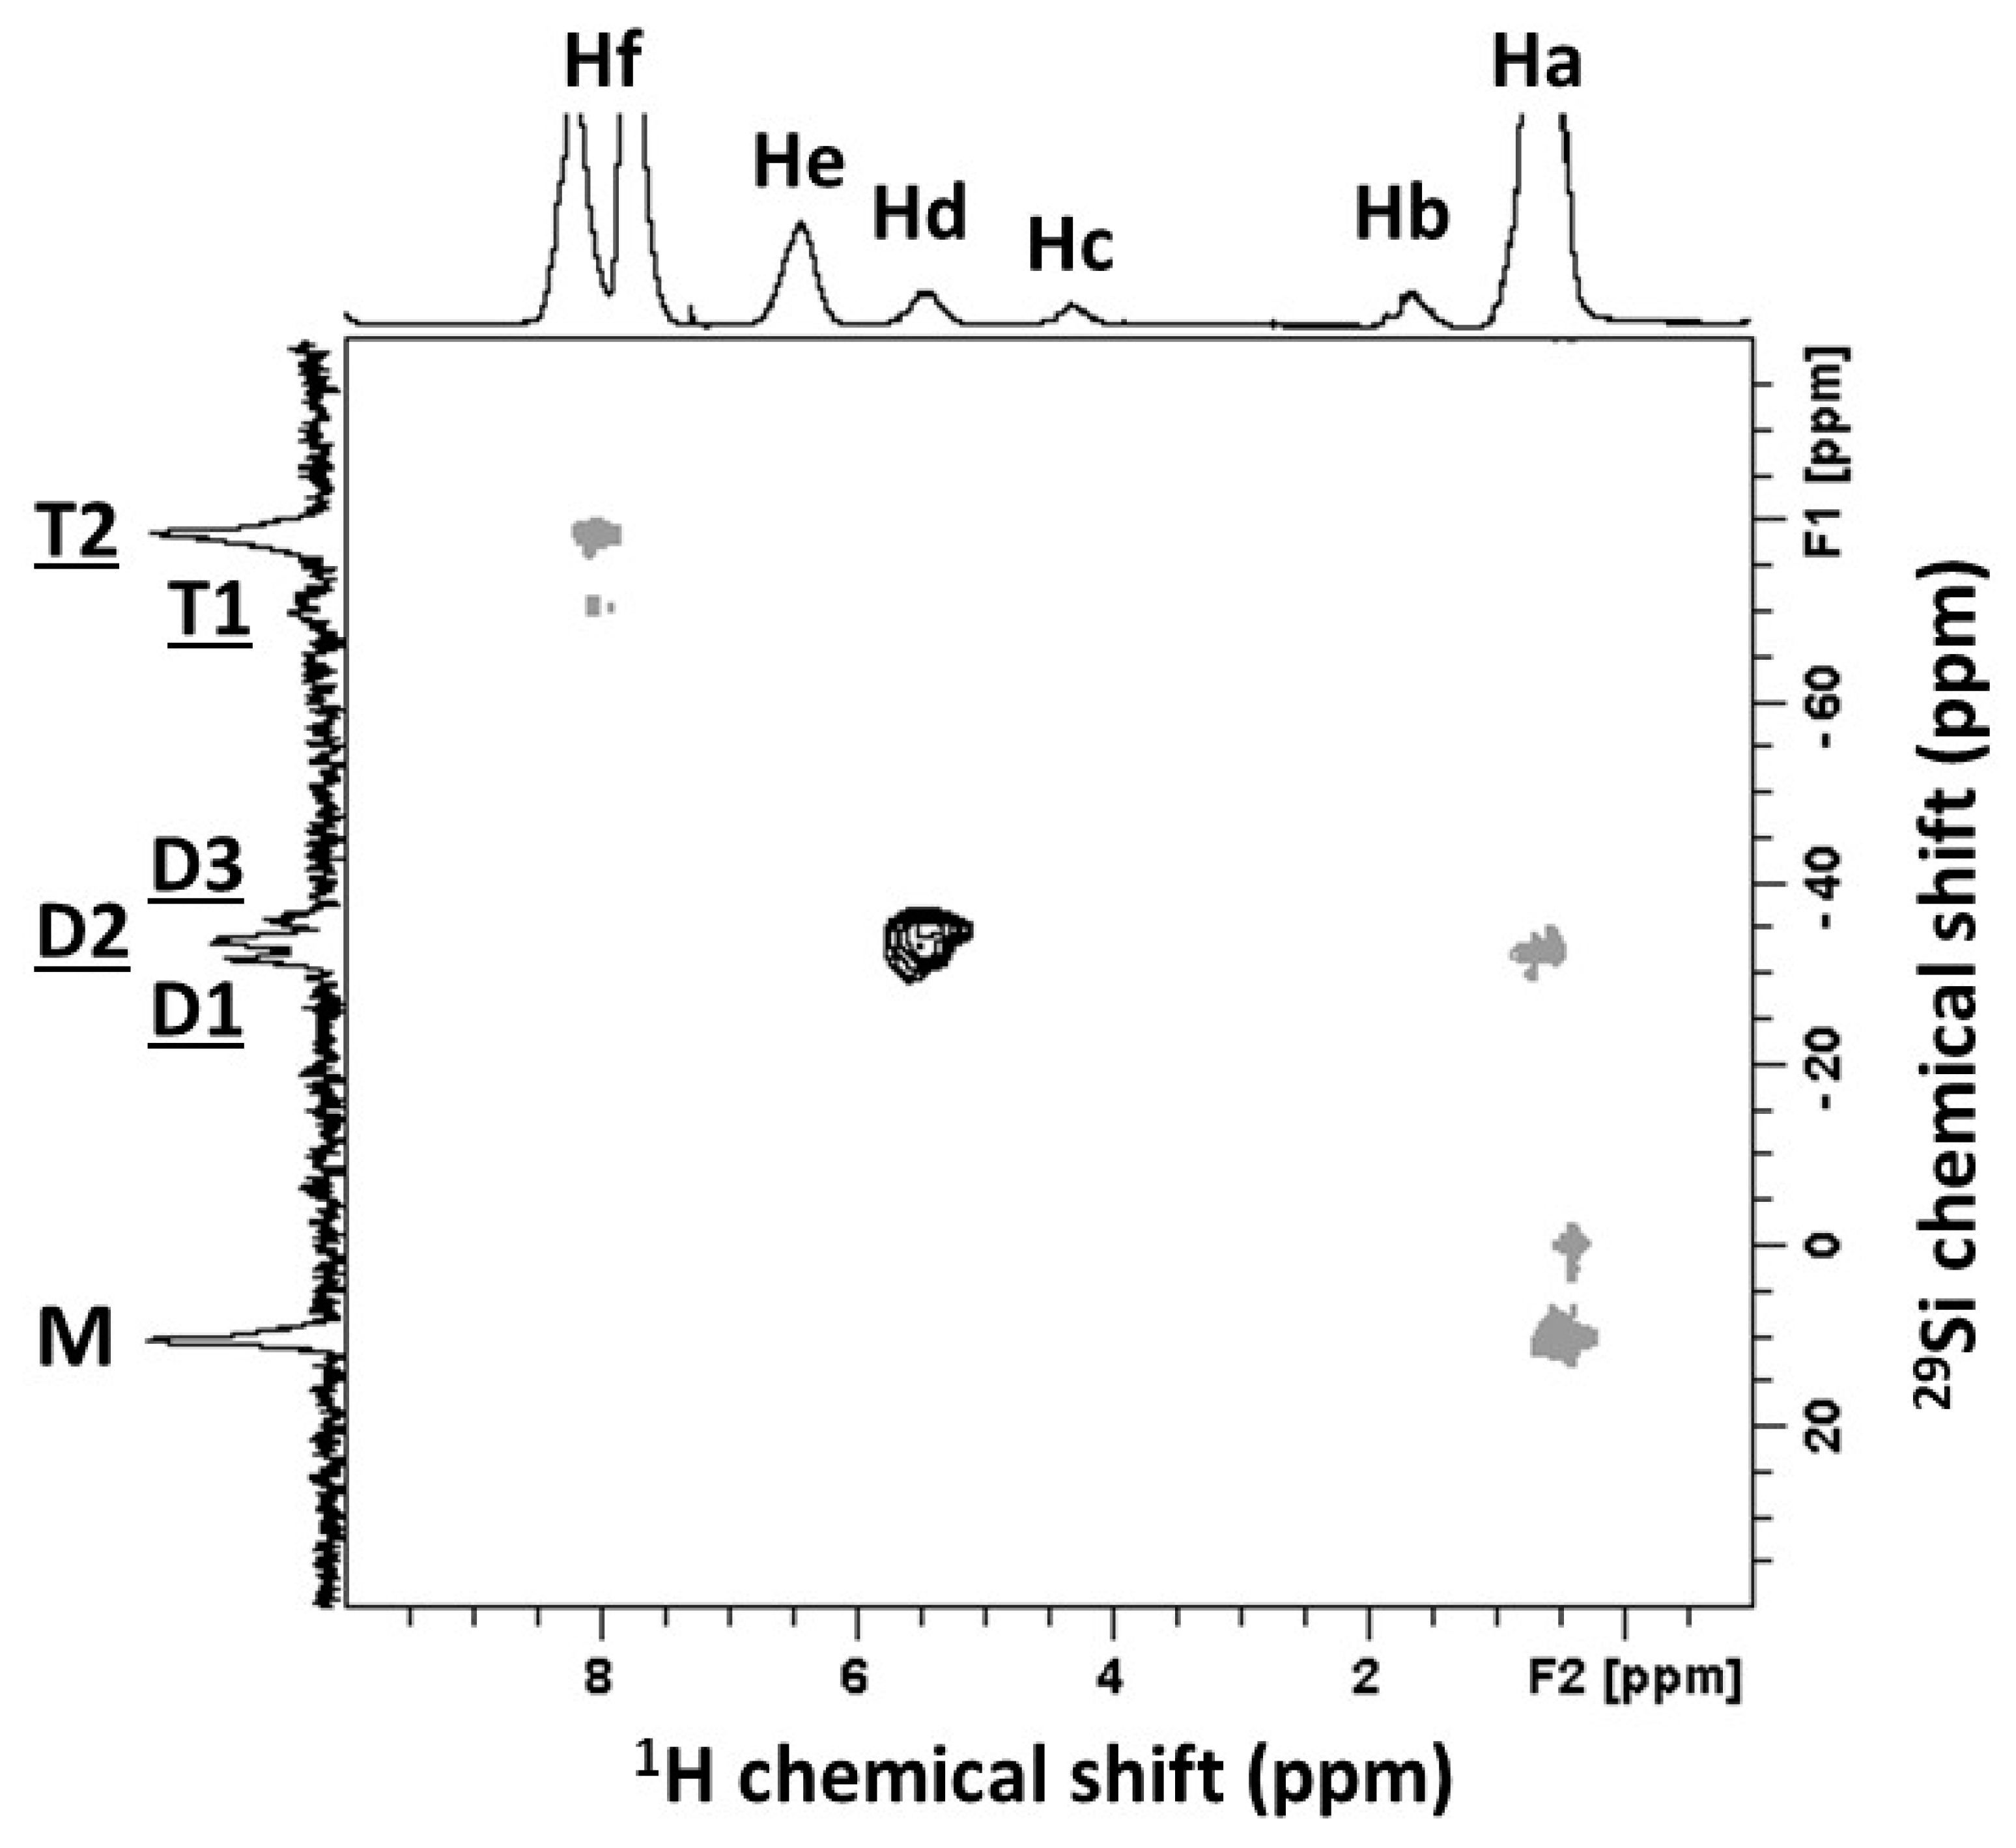
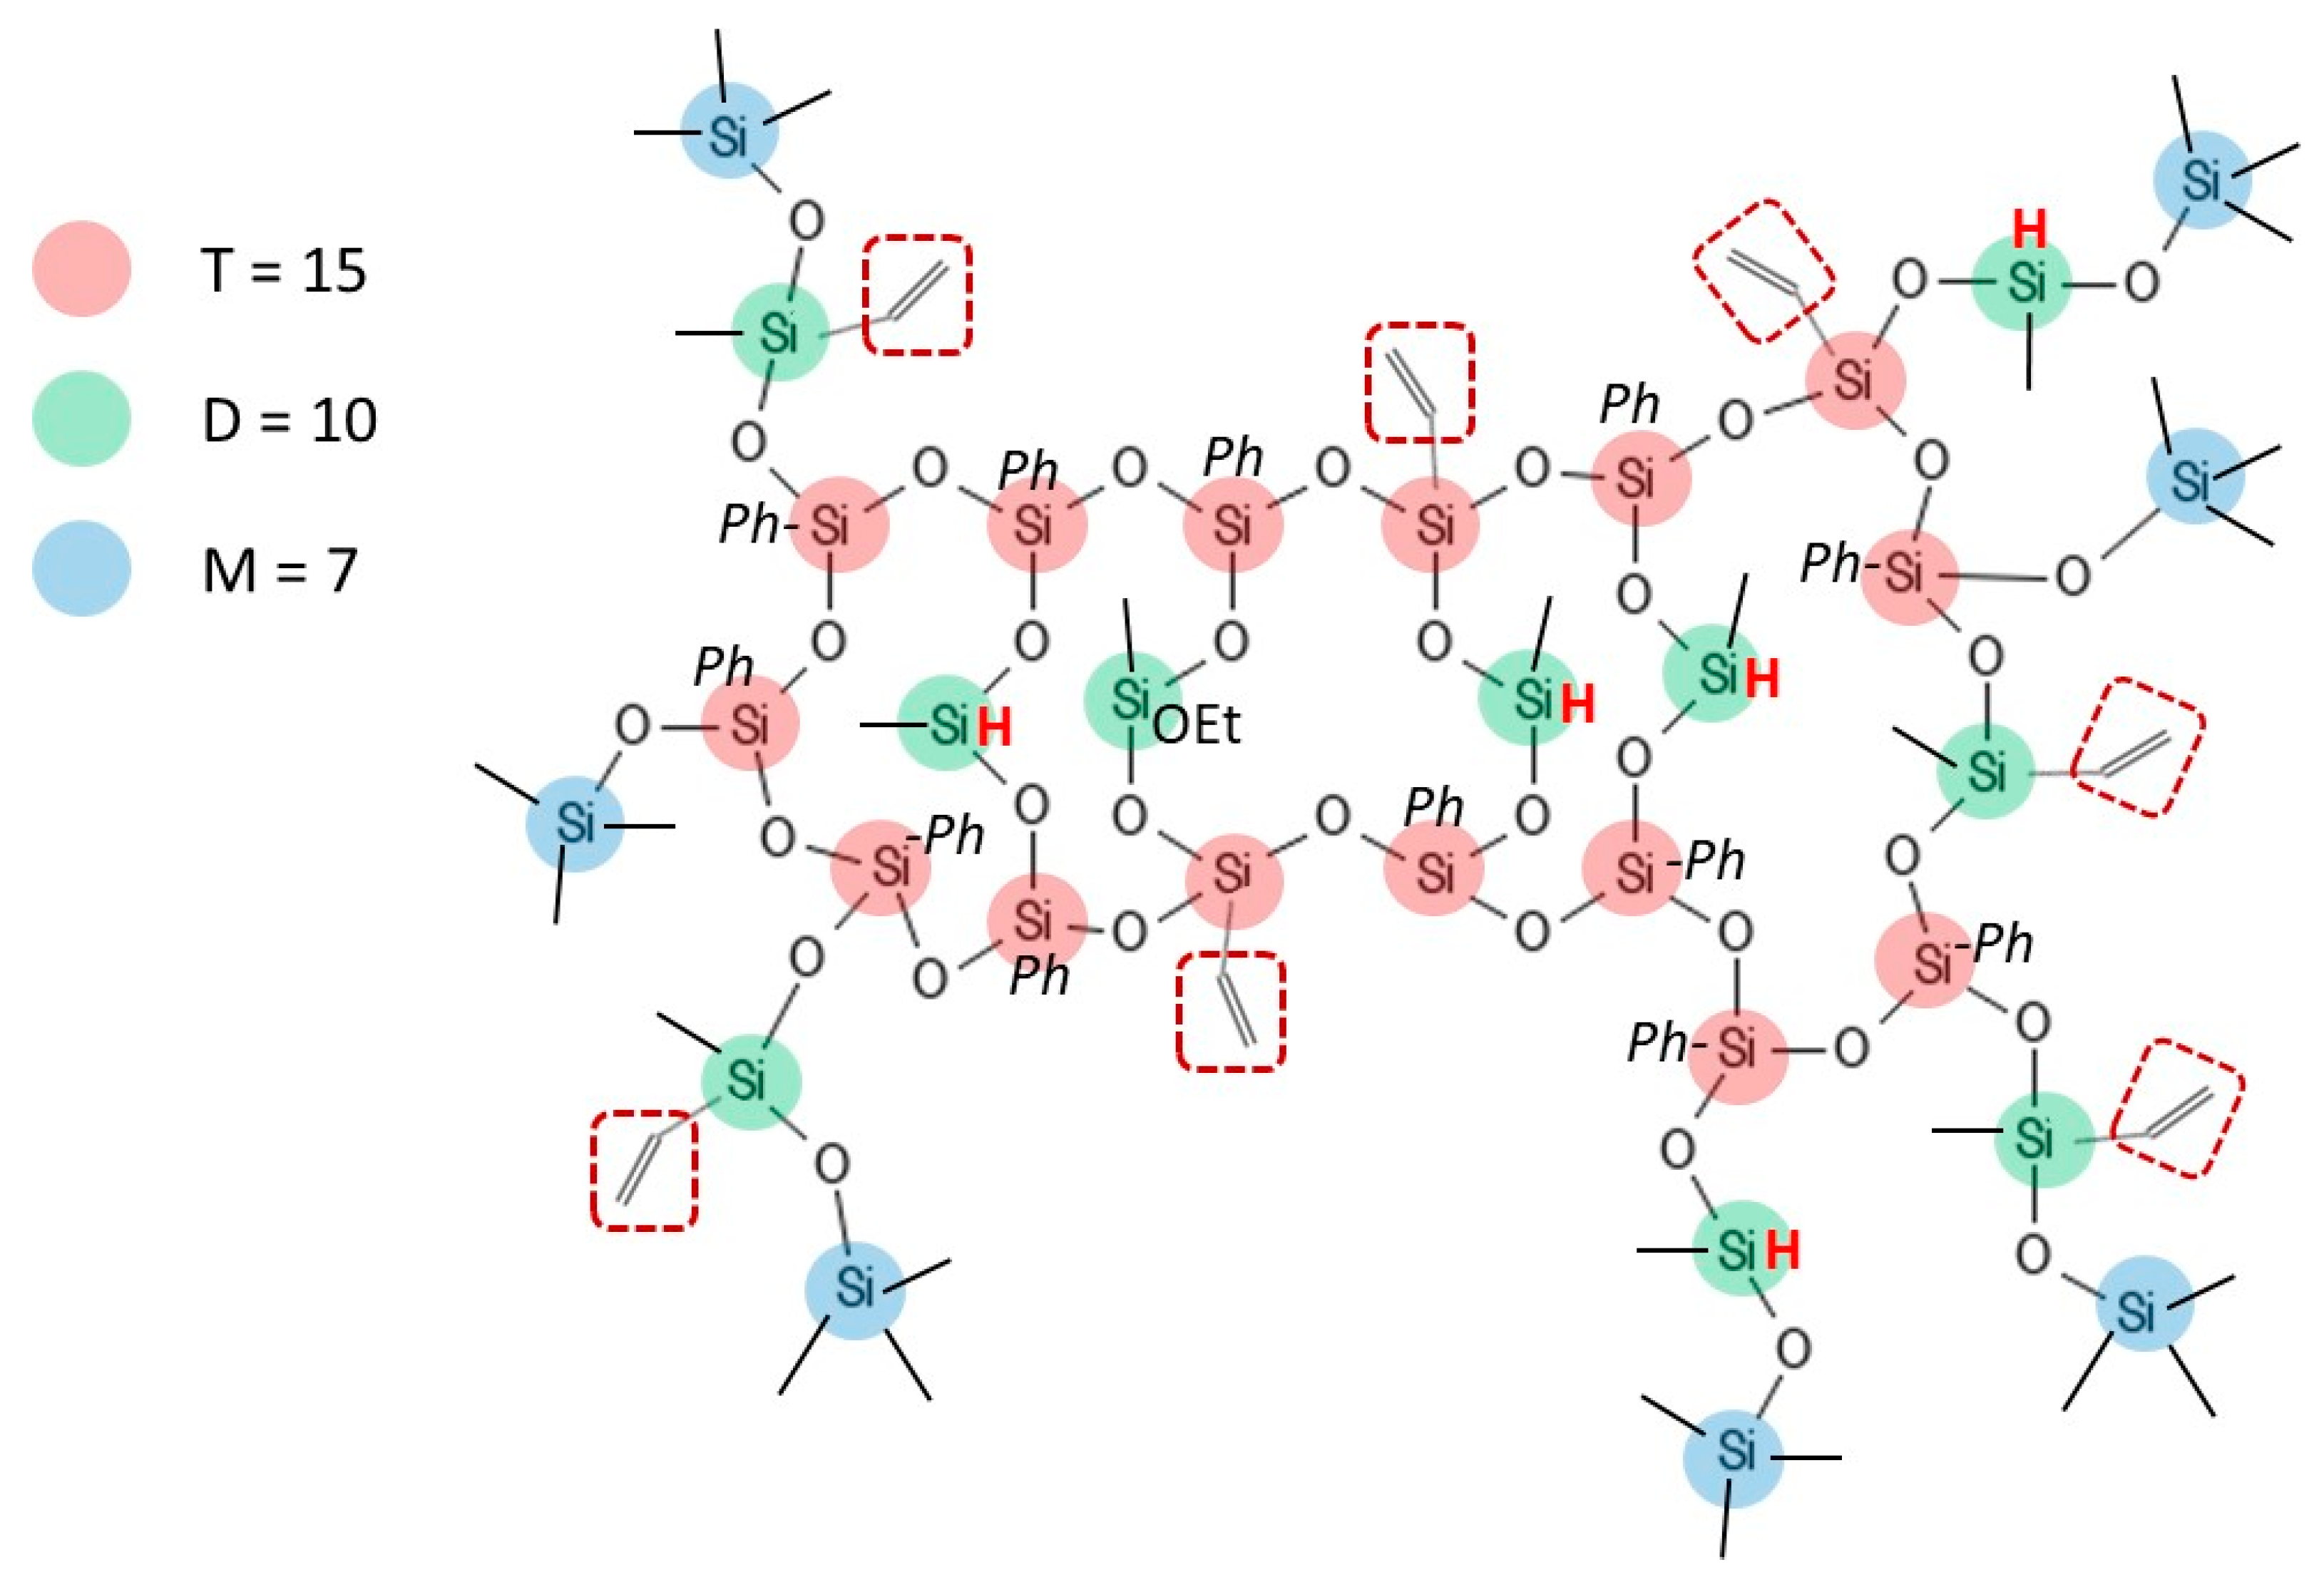
3.1. Identification of the H62C Structure Using NMR Spectroscopy
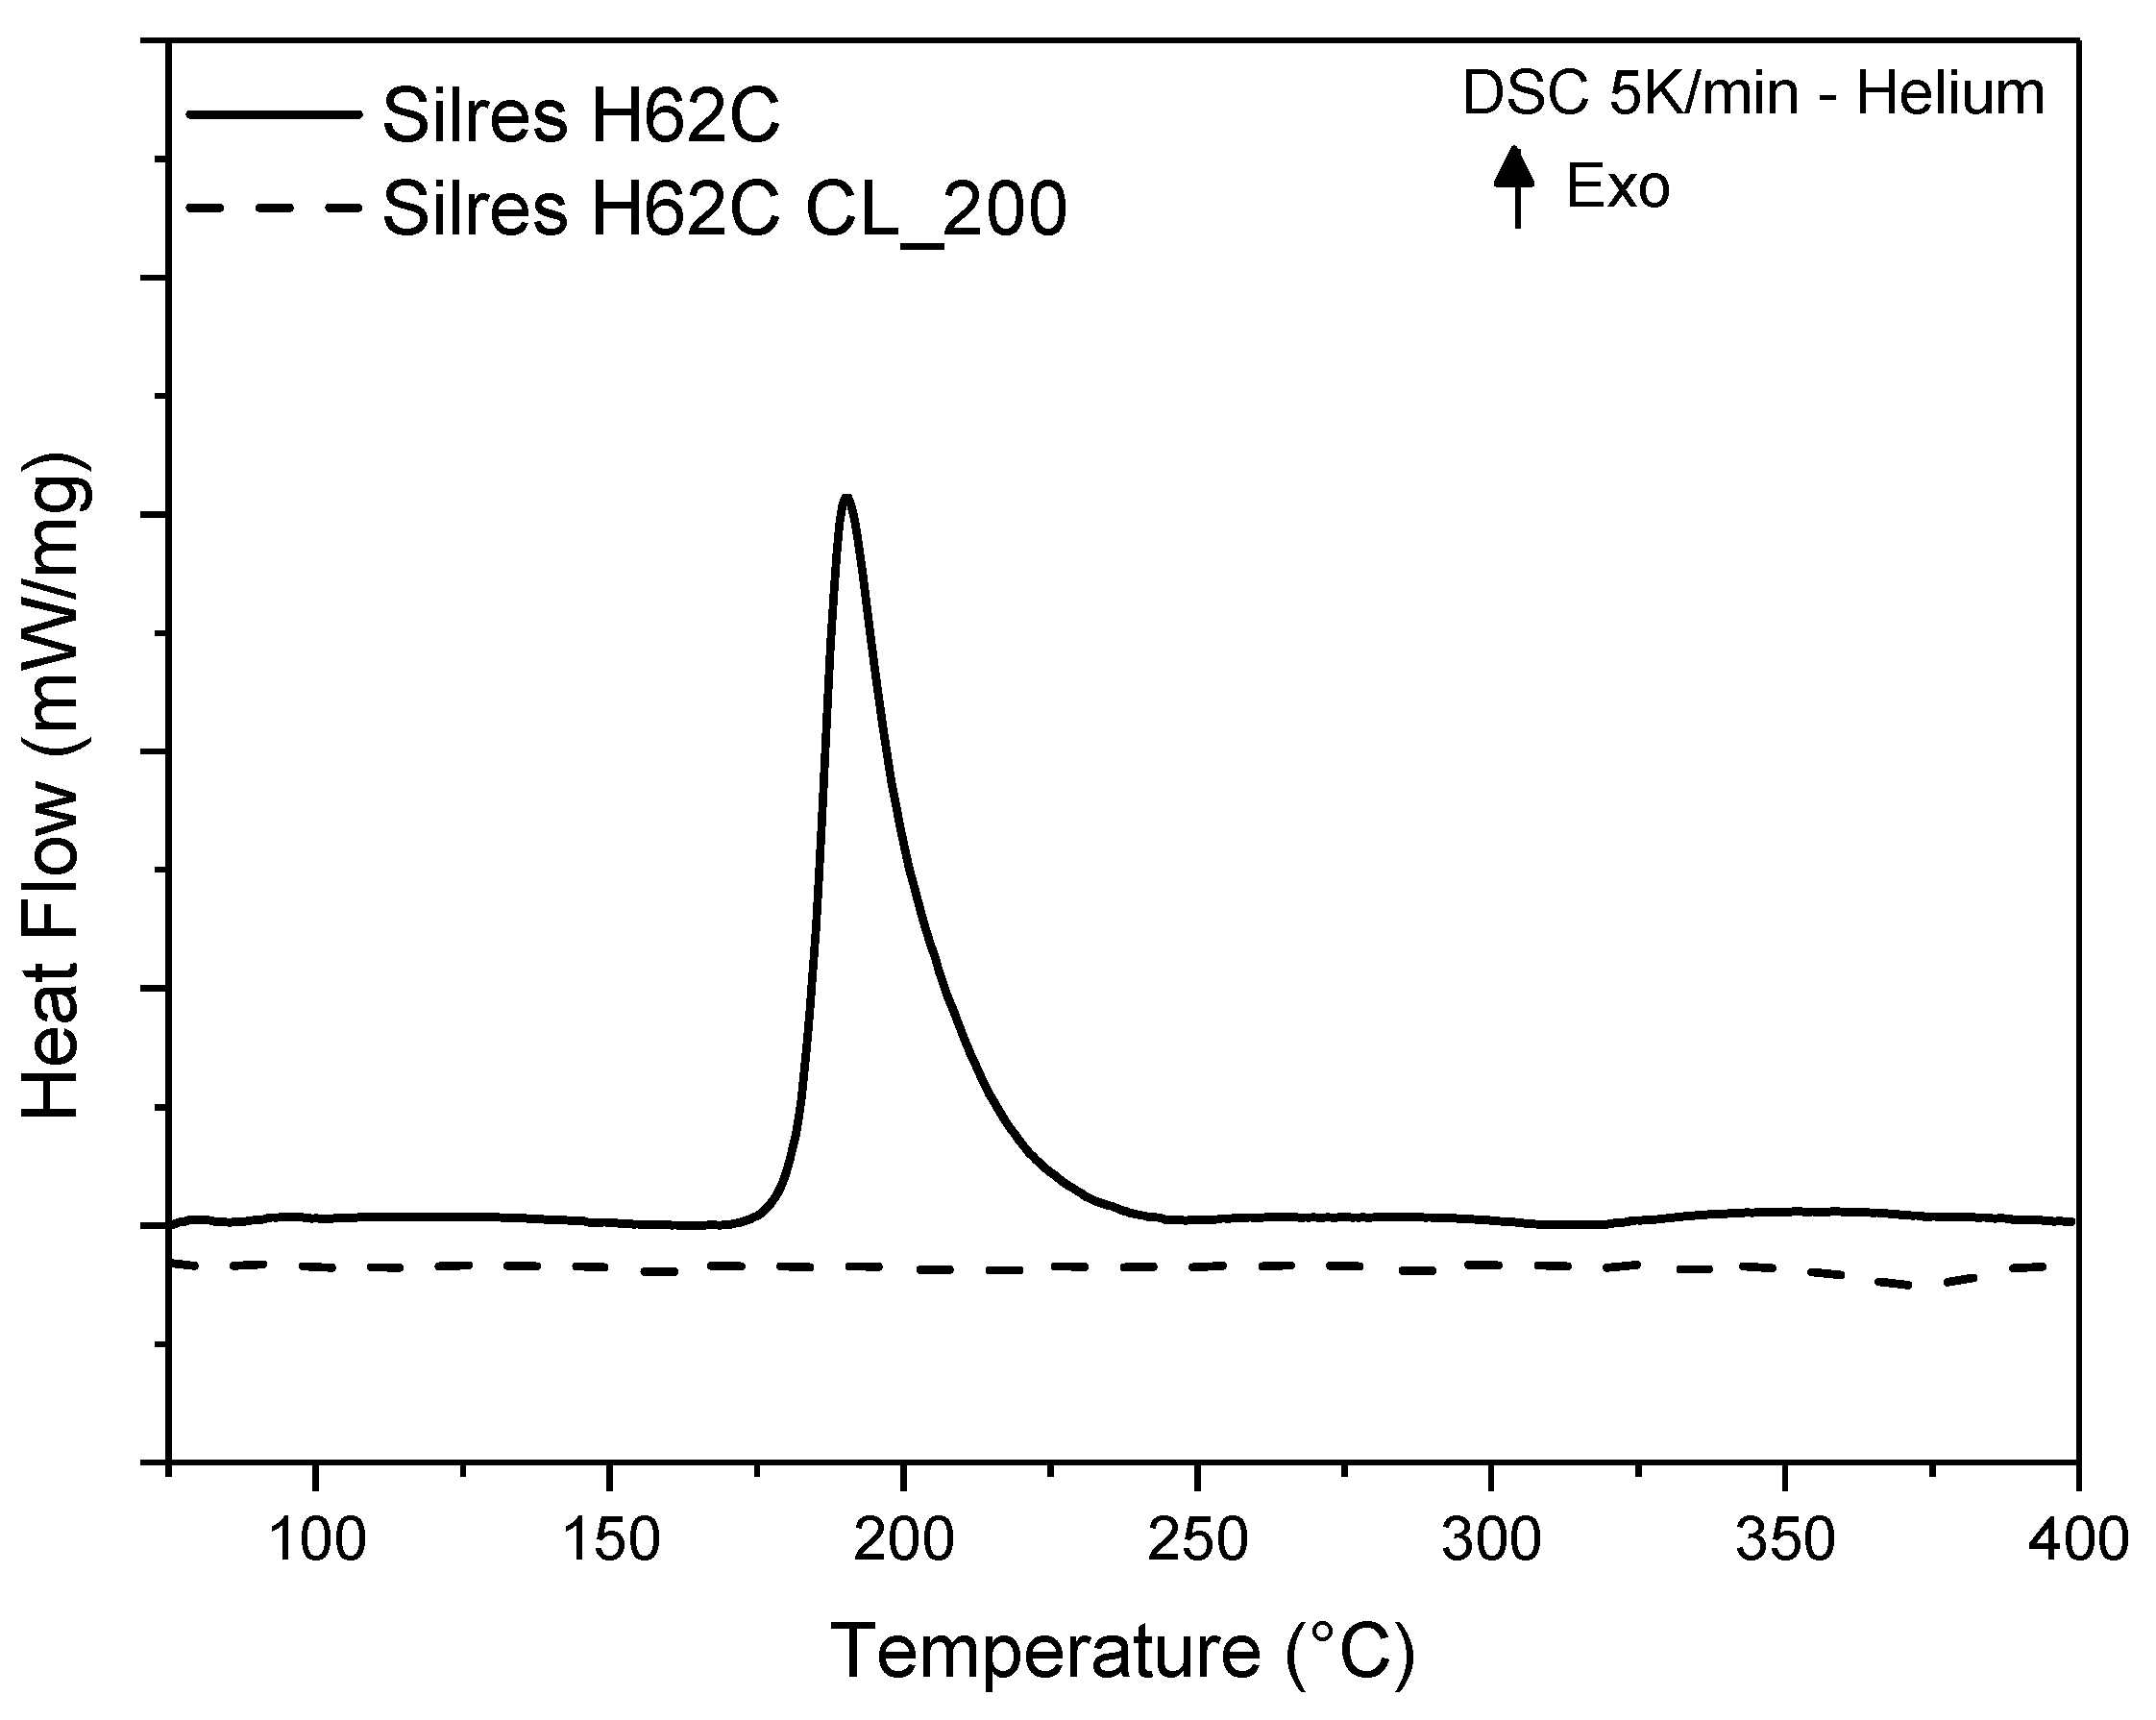
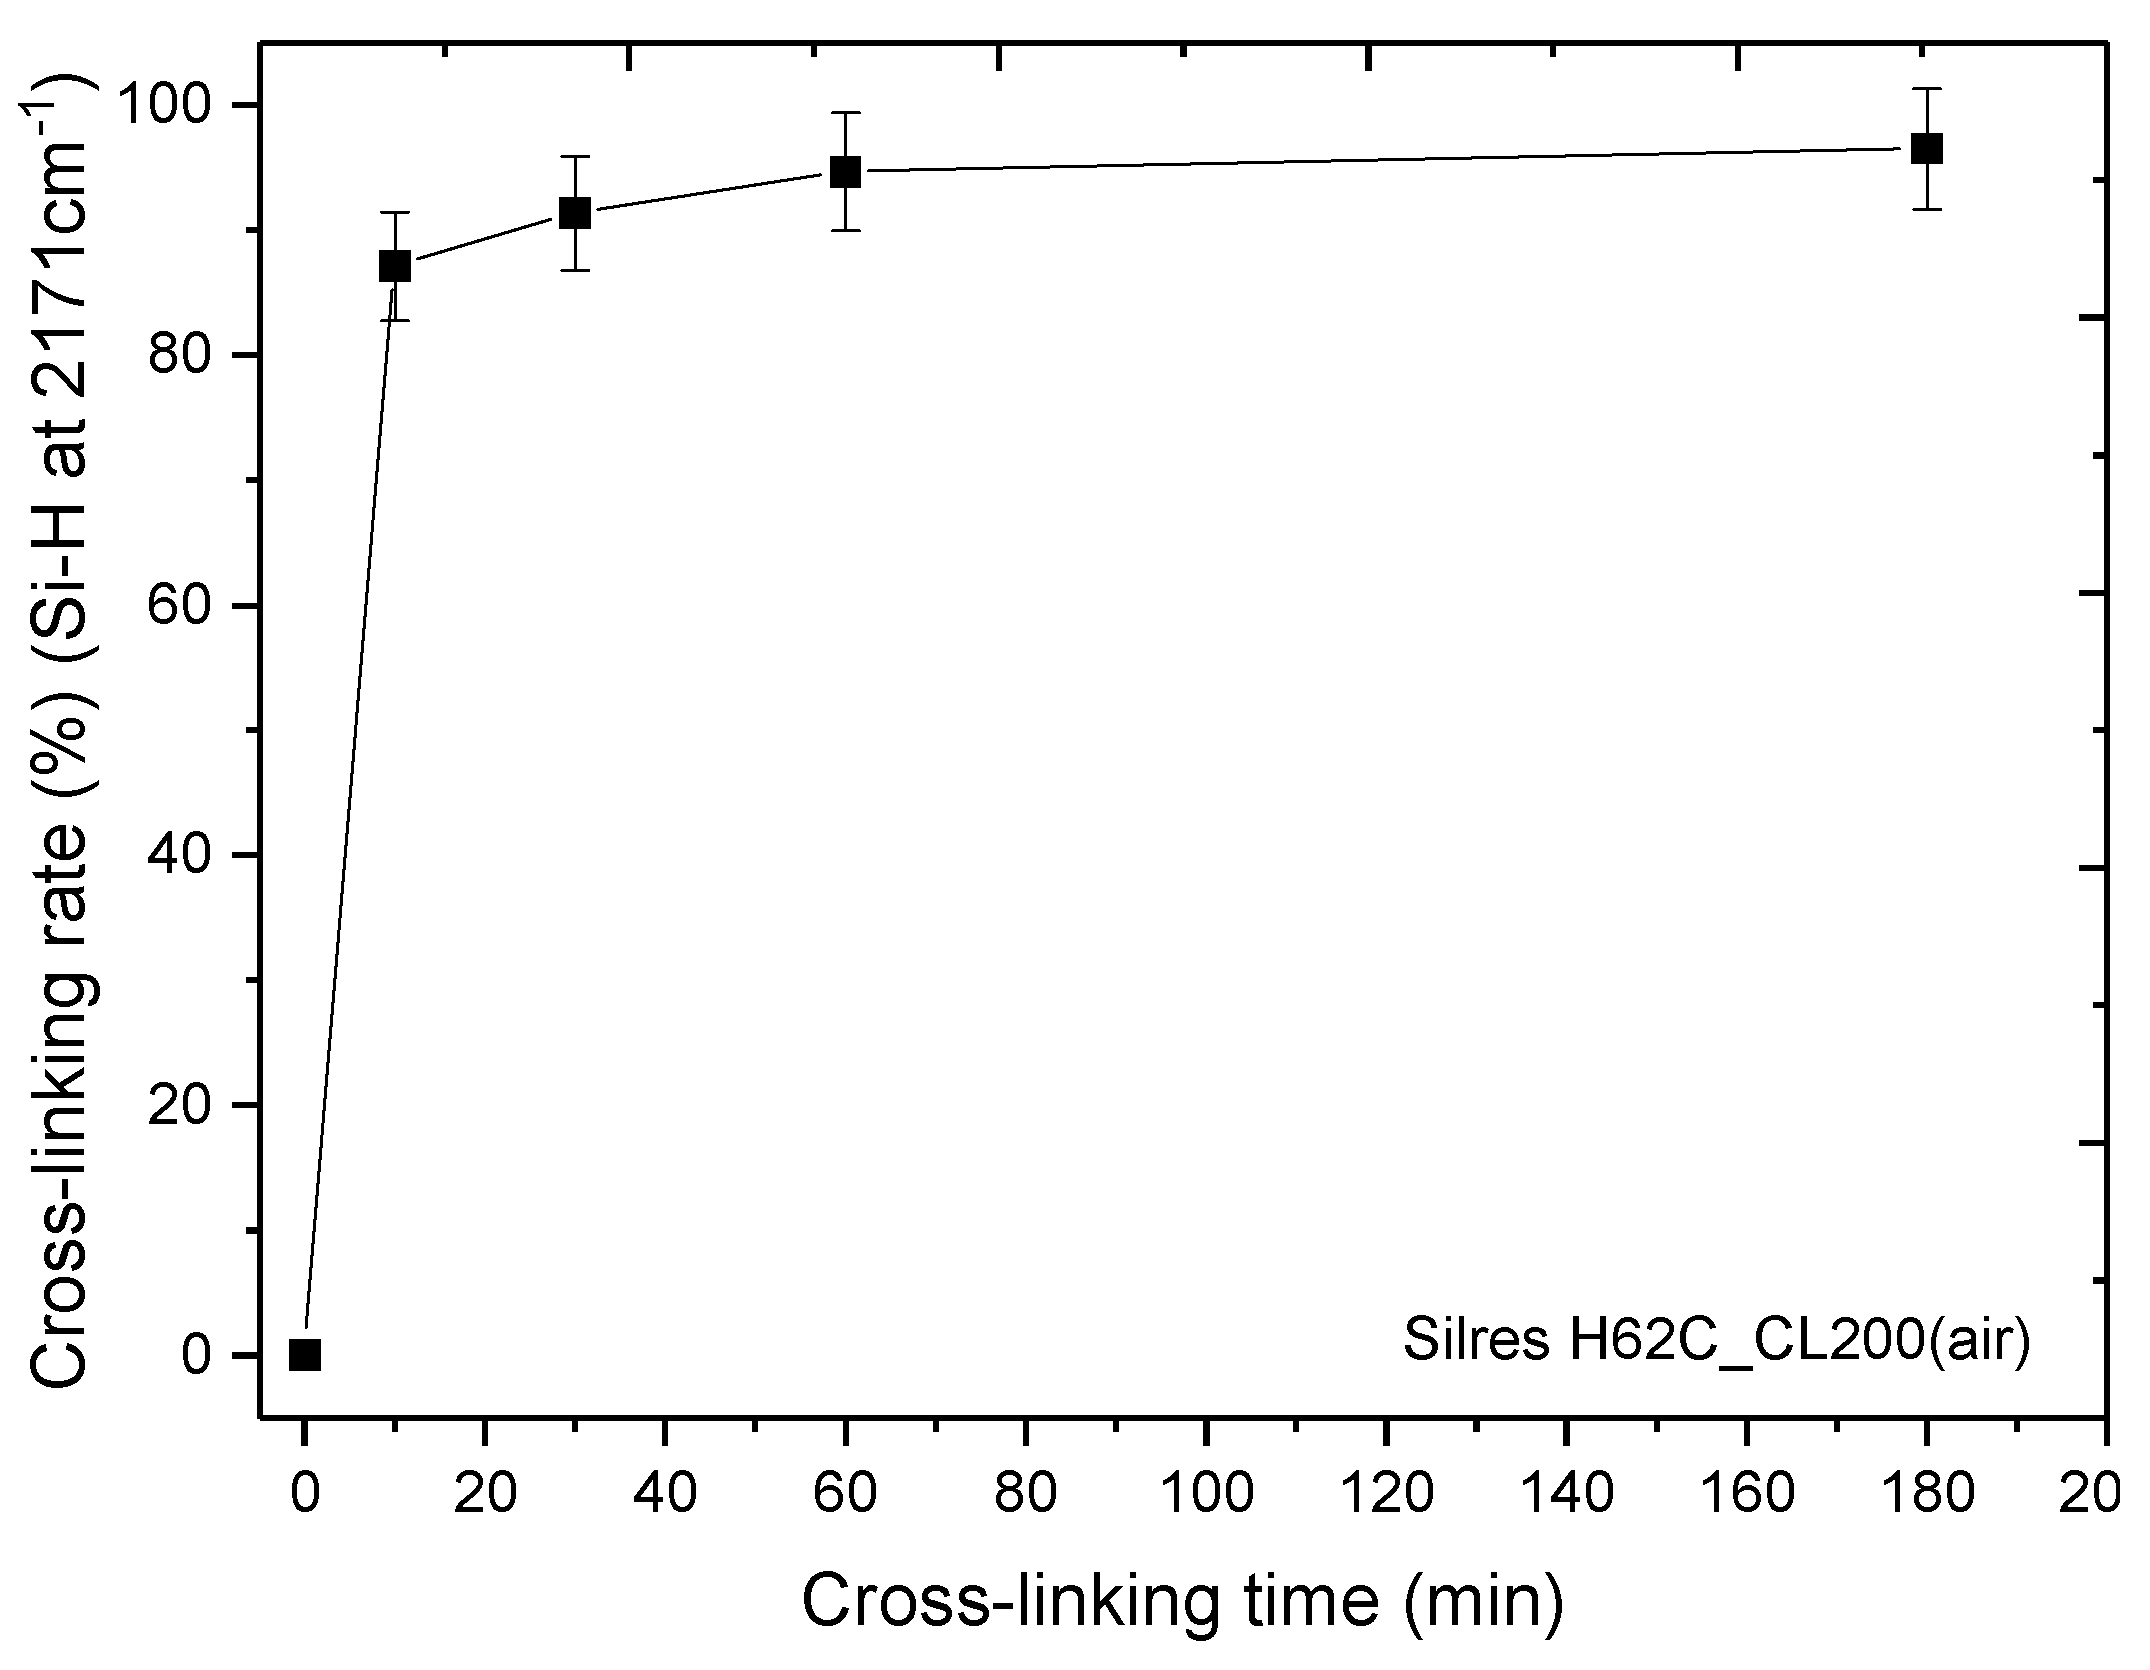
3.2. Thermal Cross-Linking
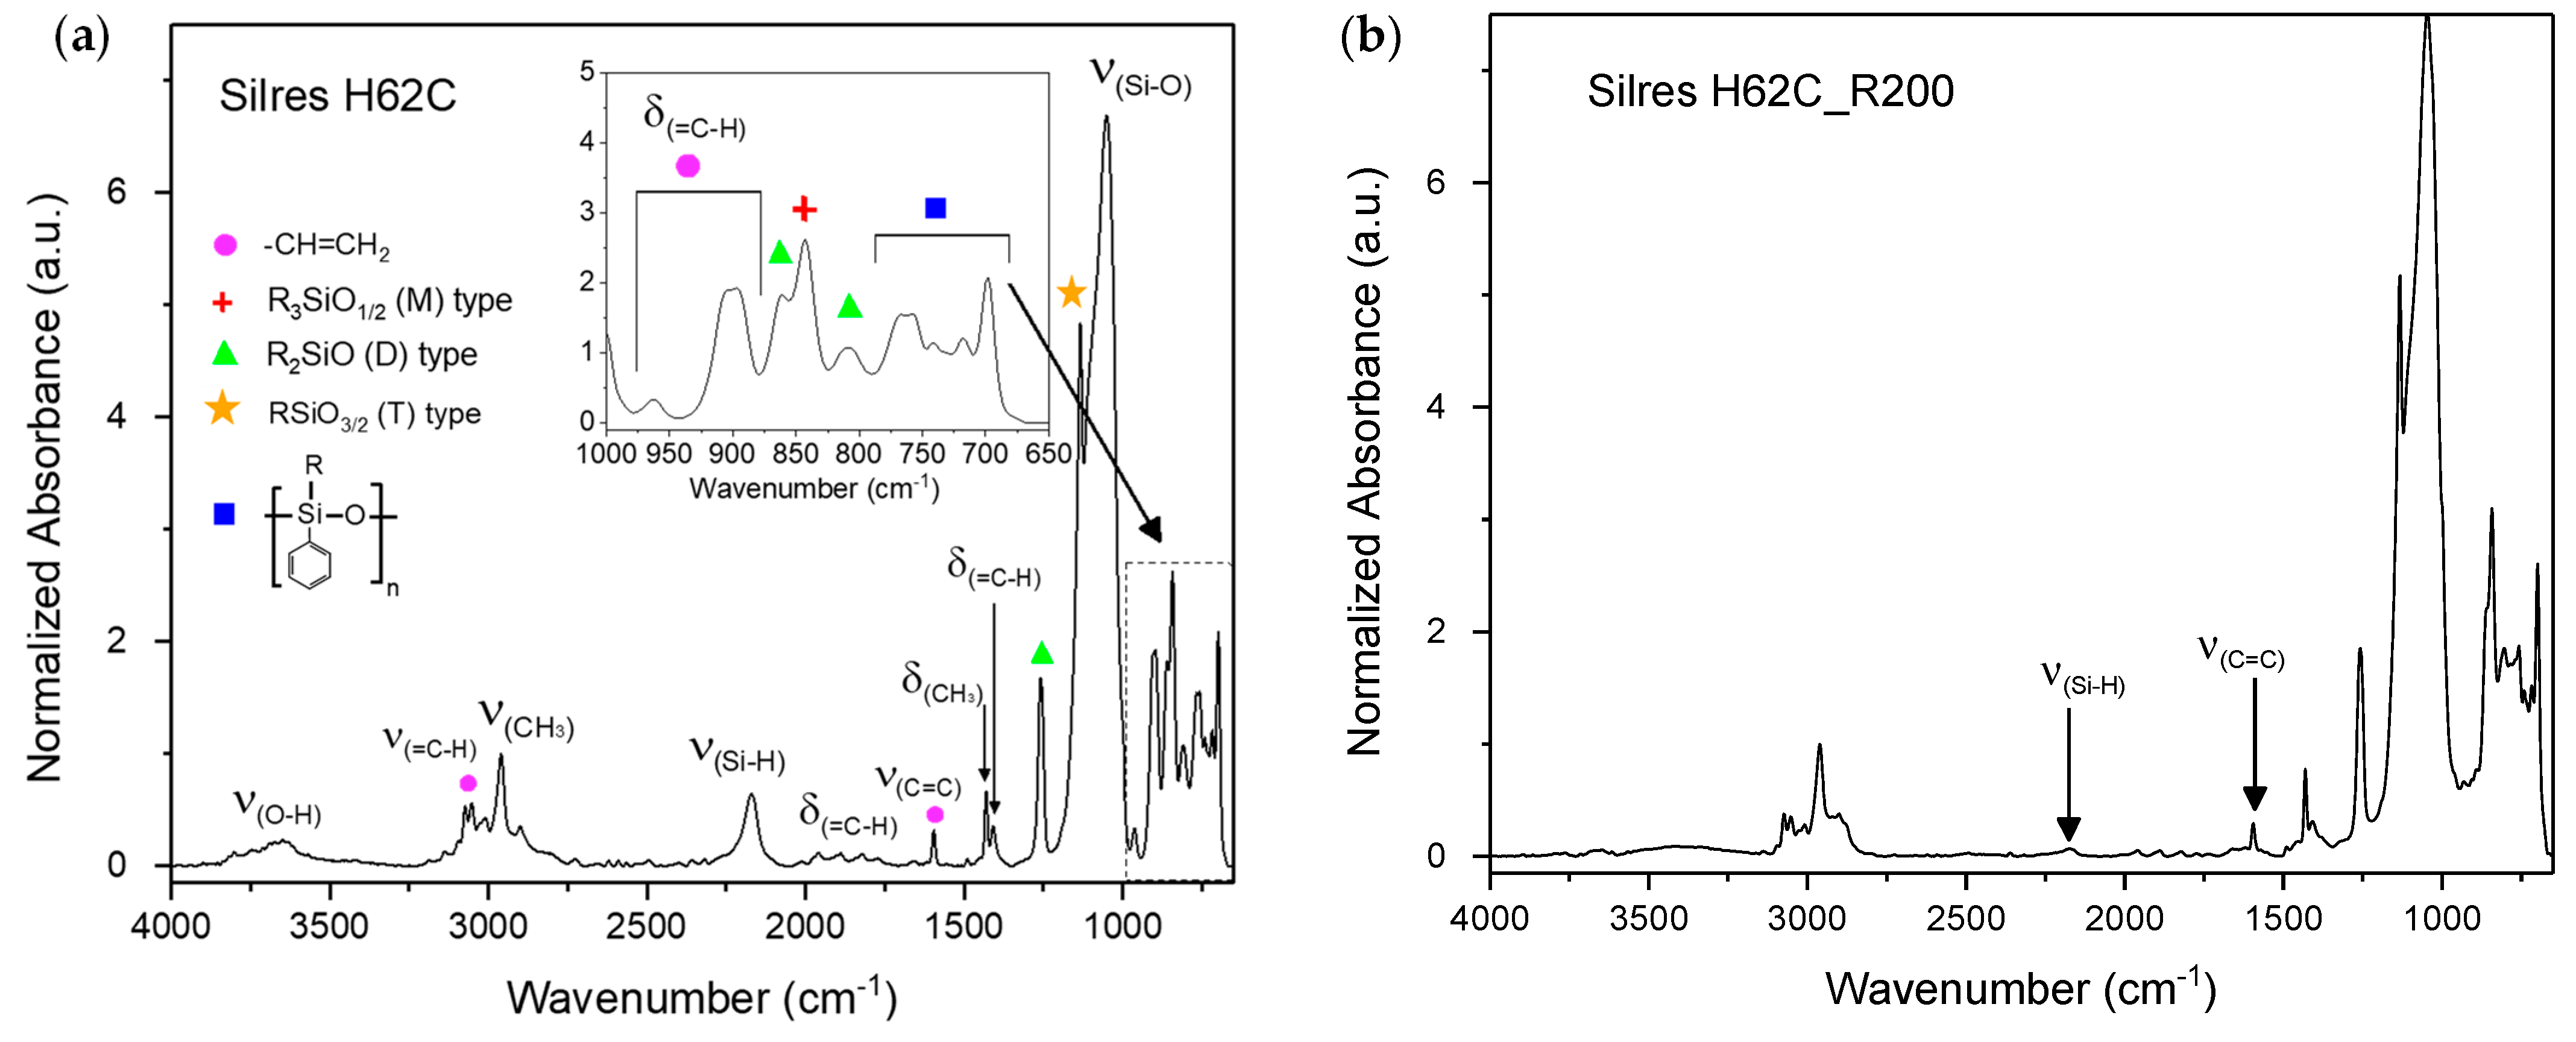
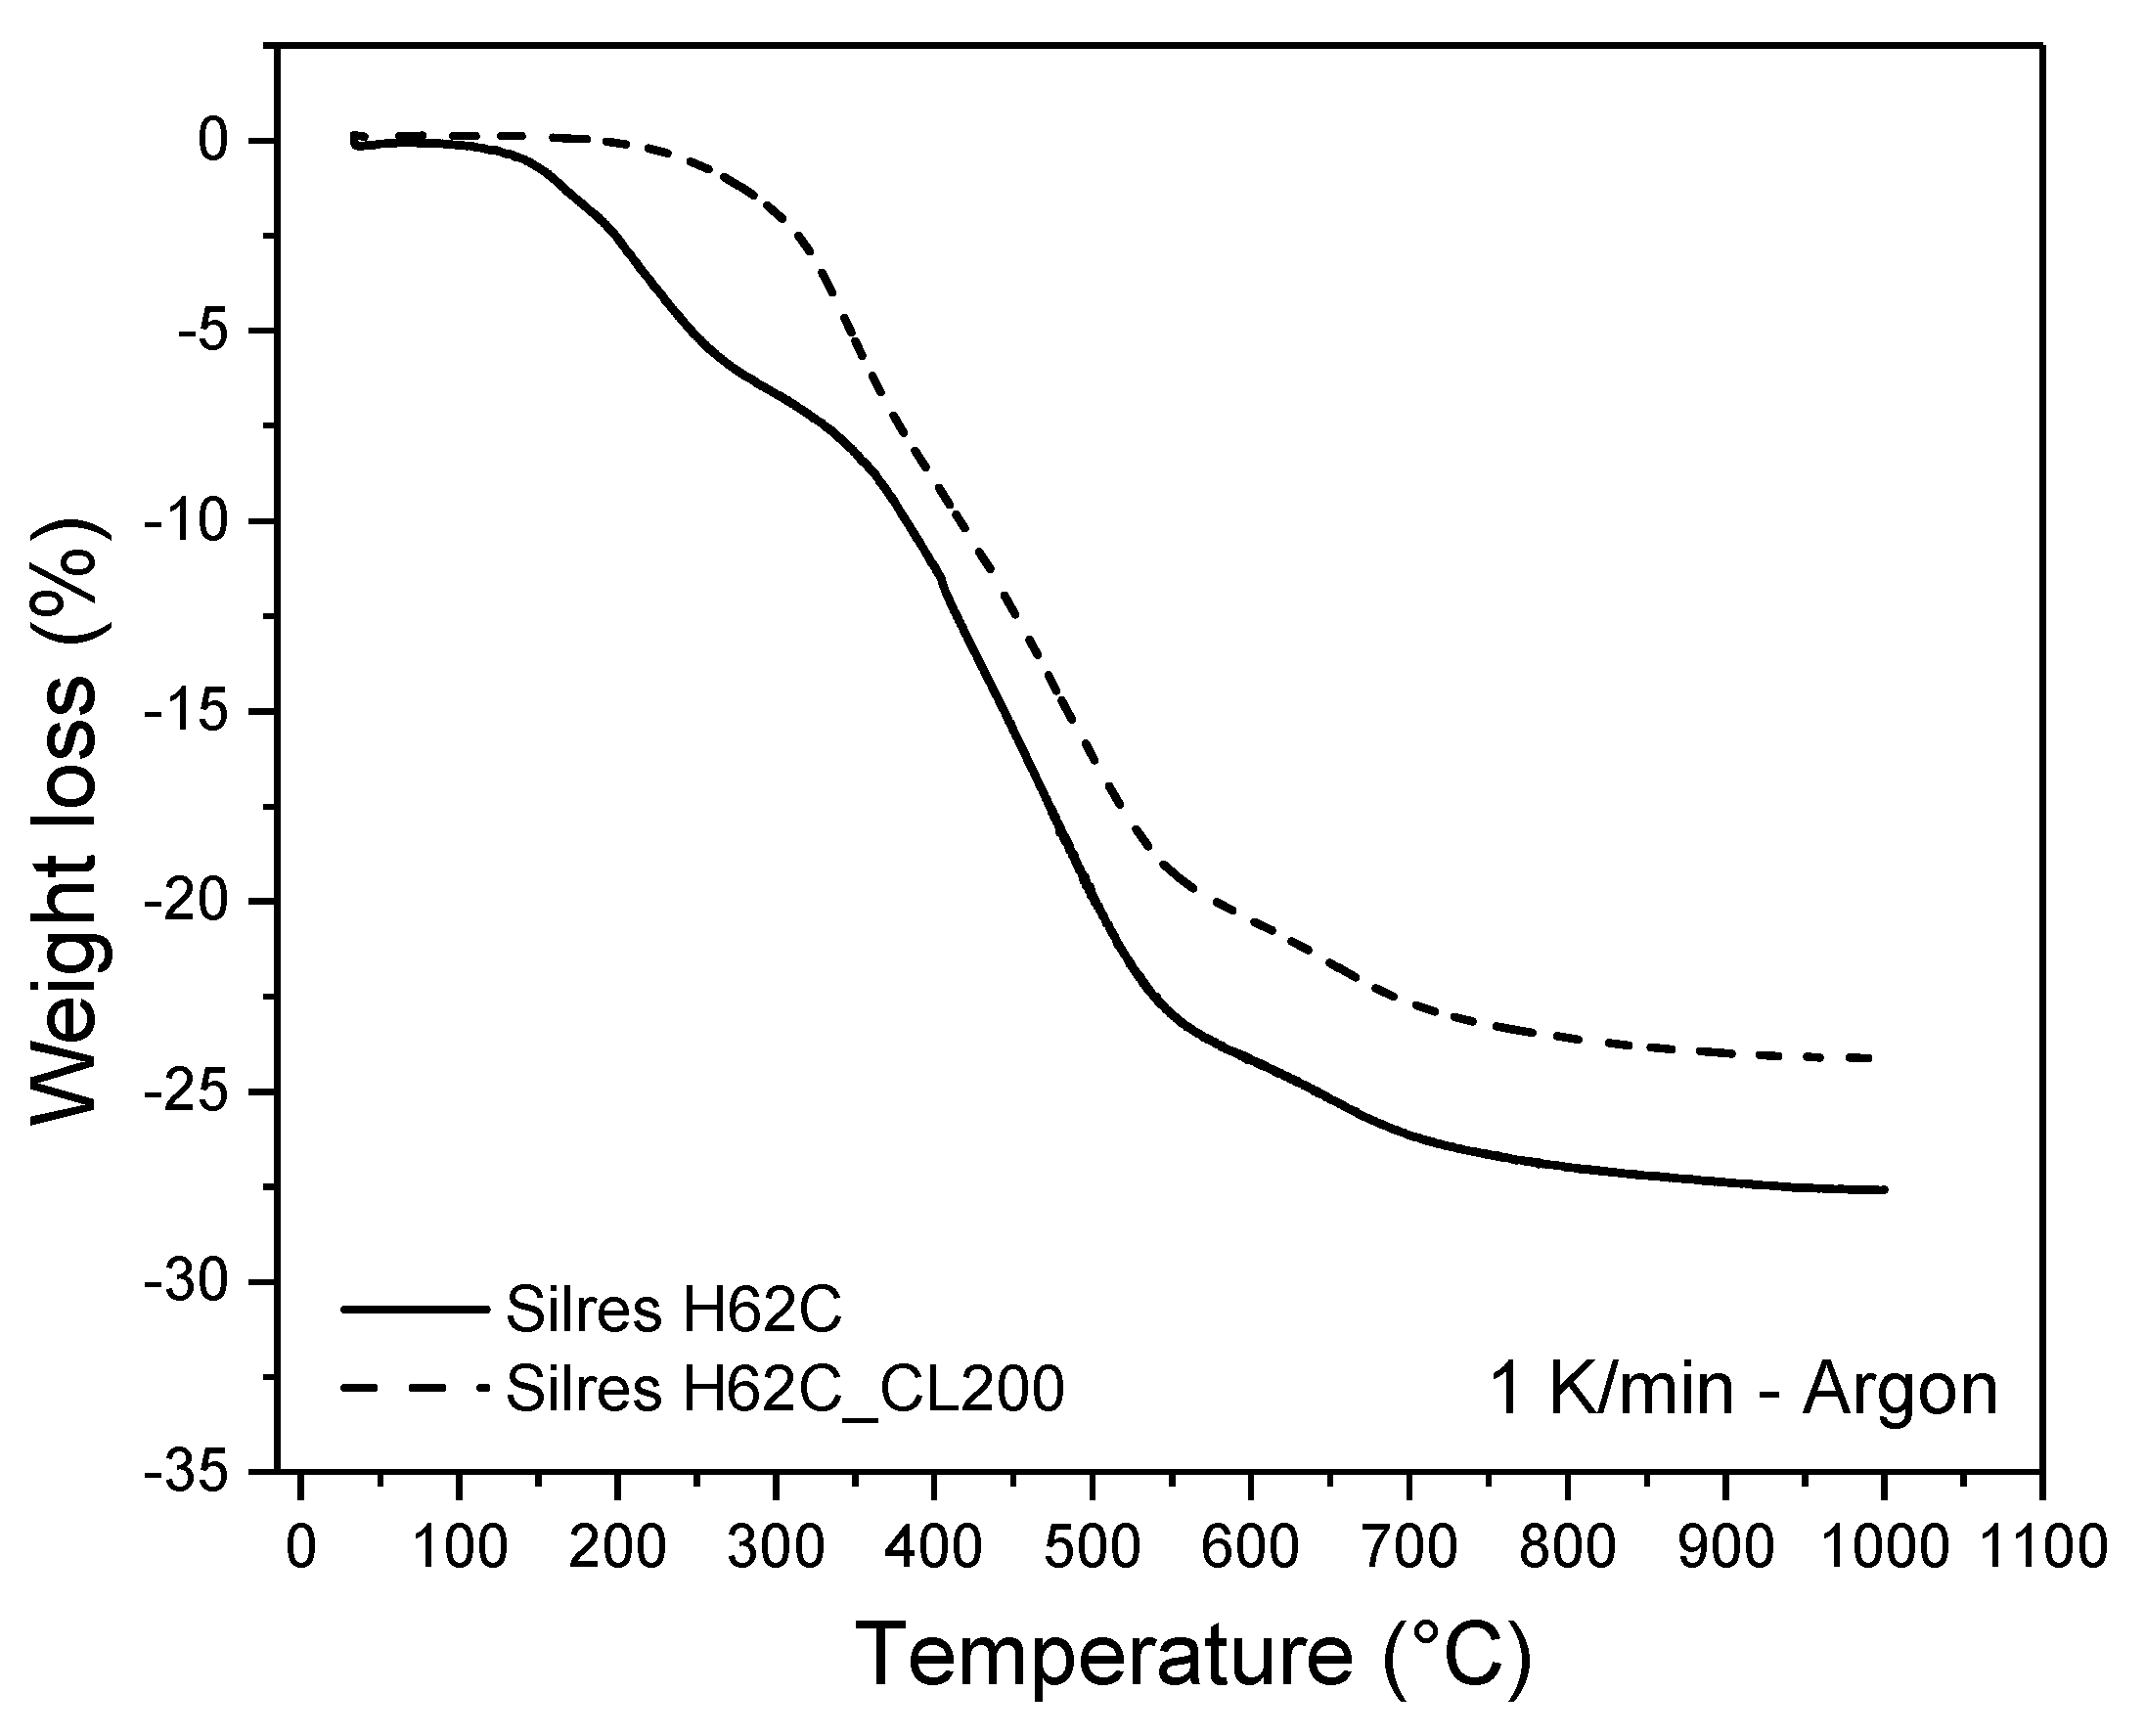
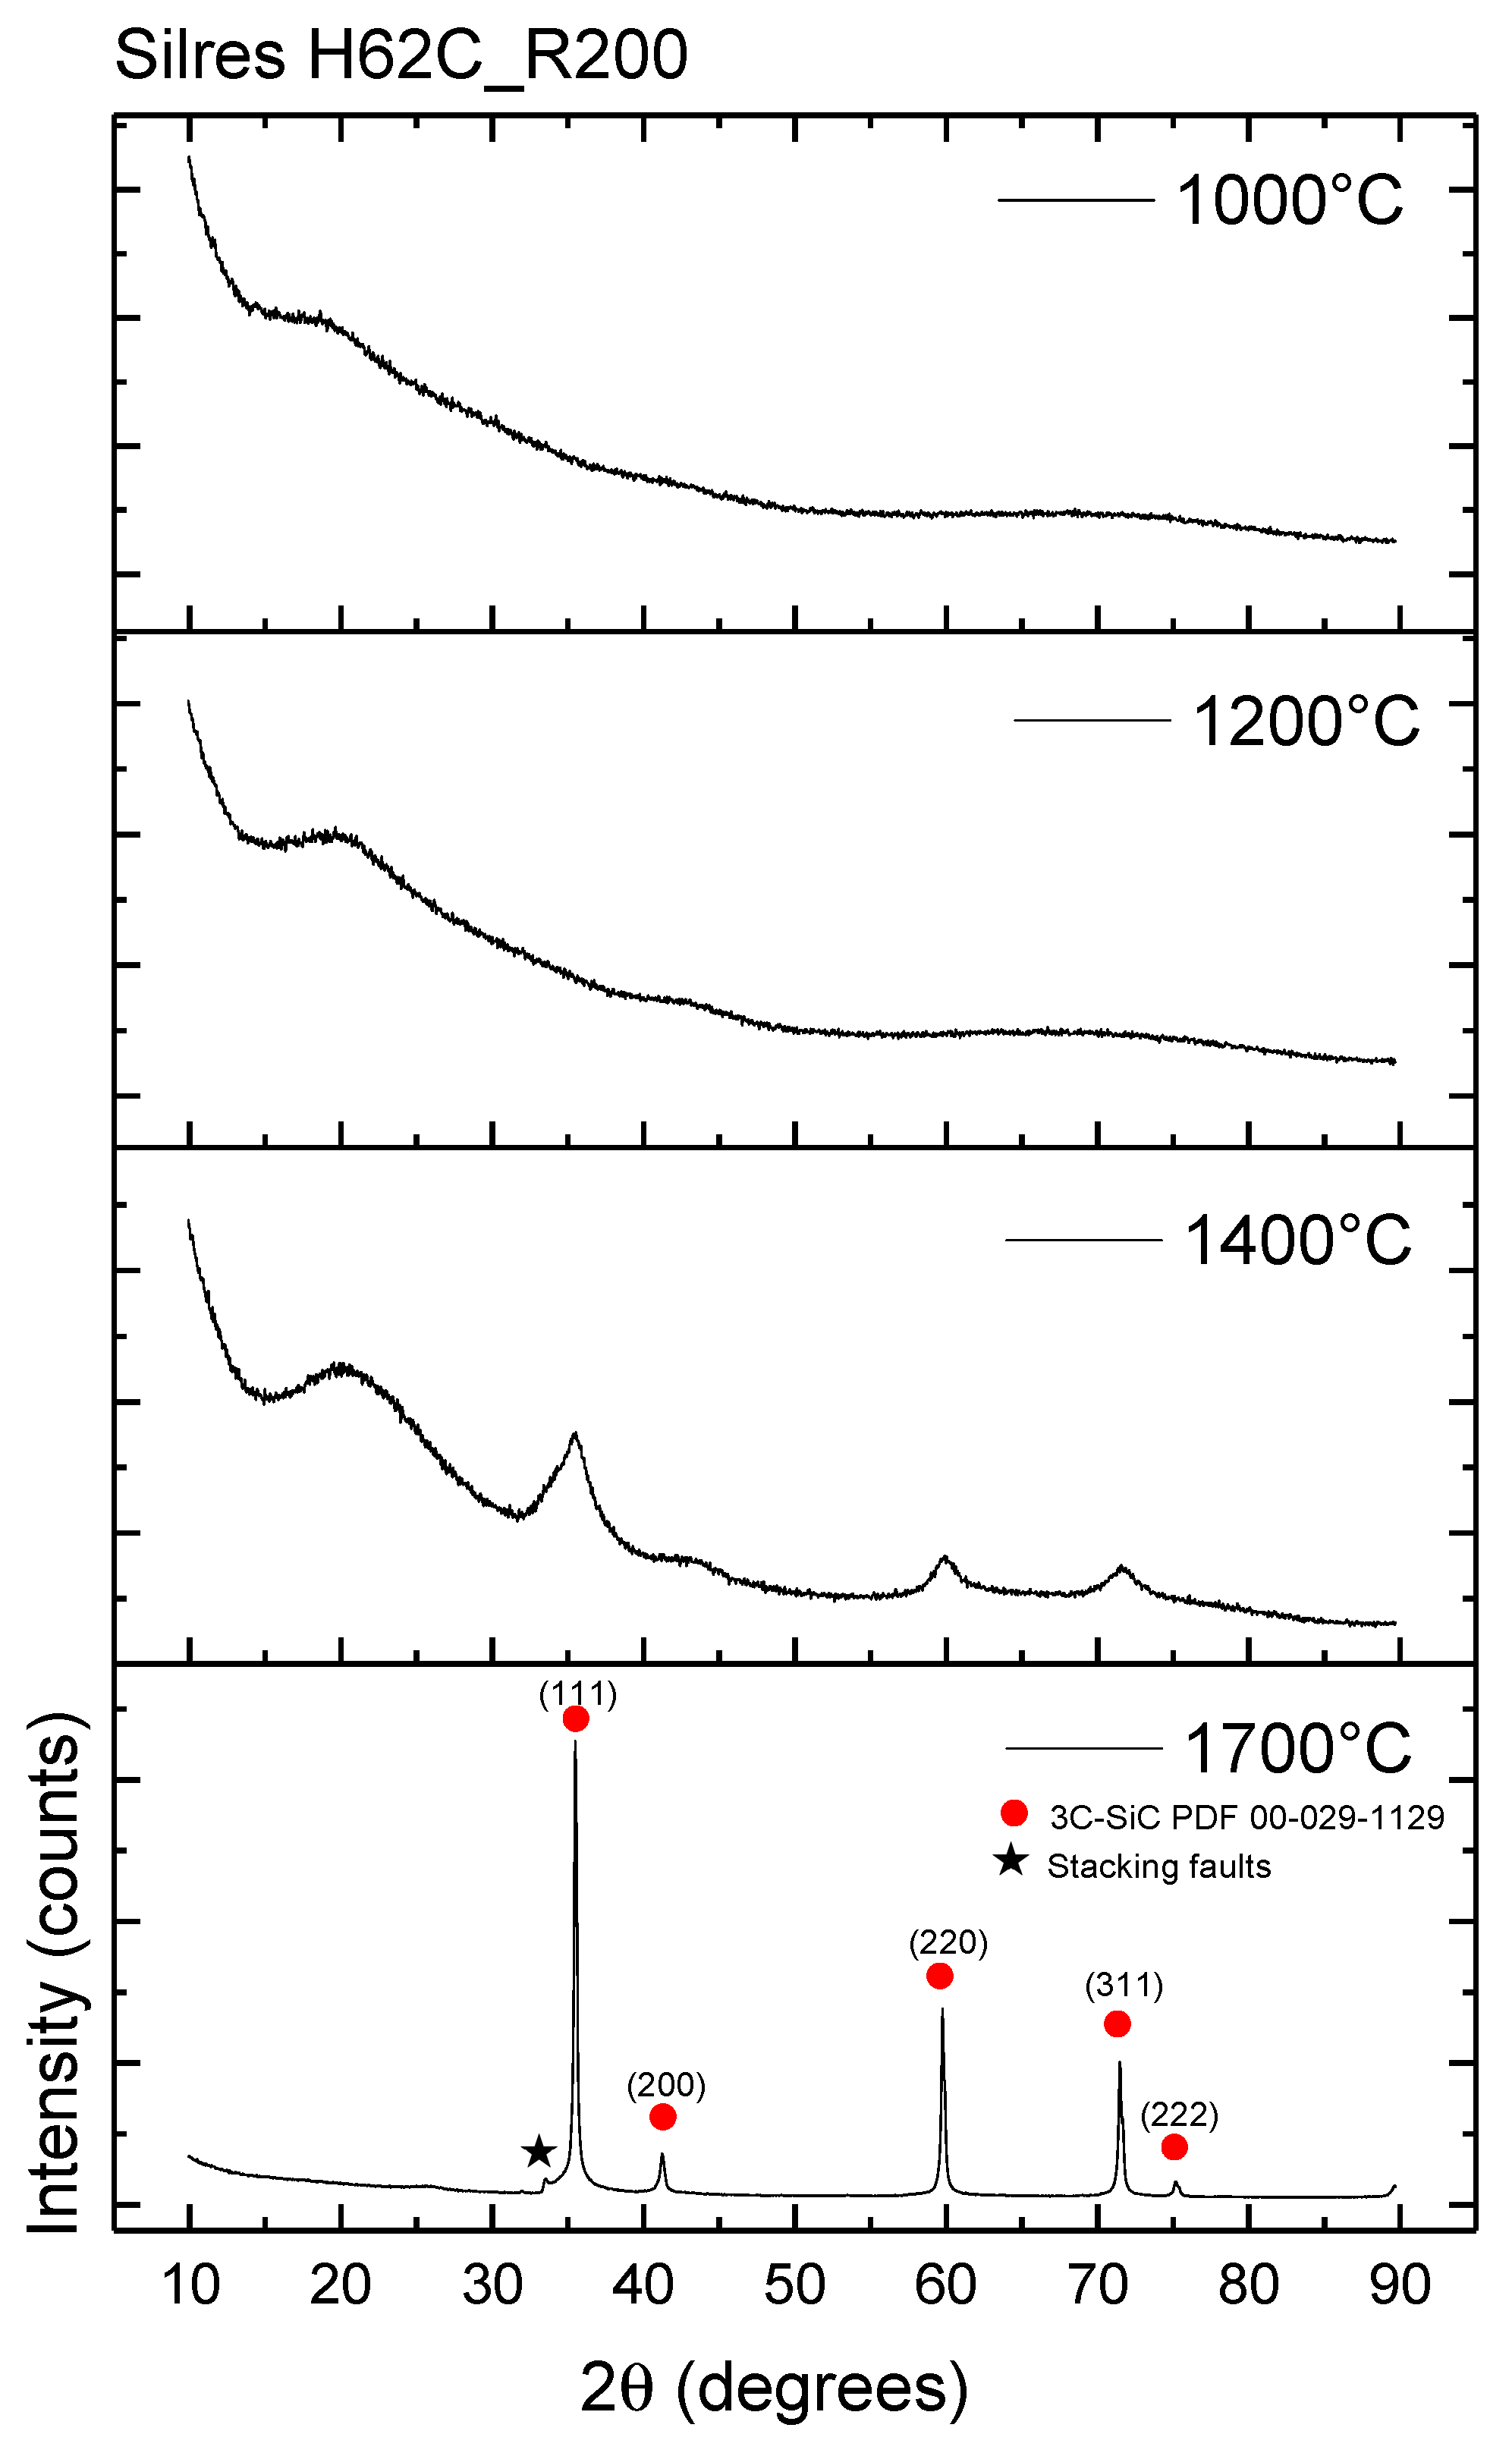
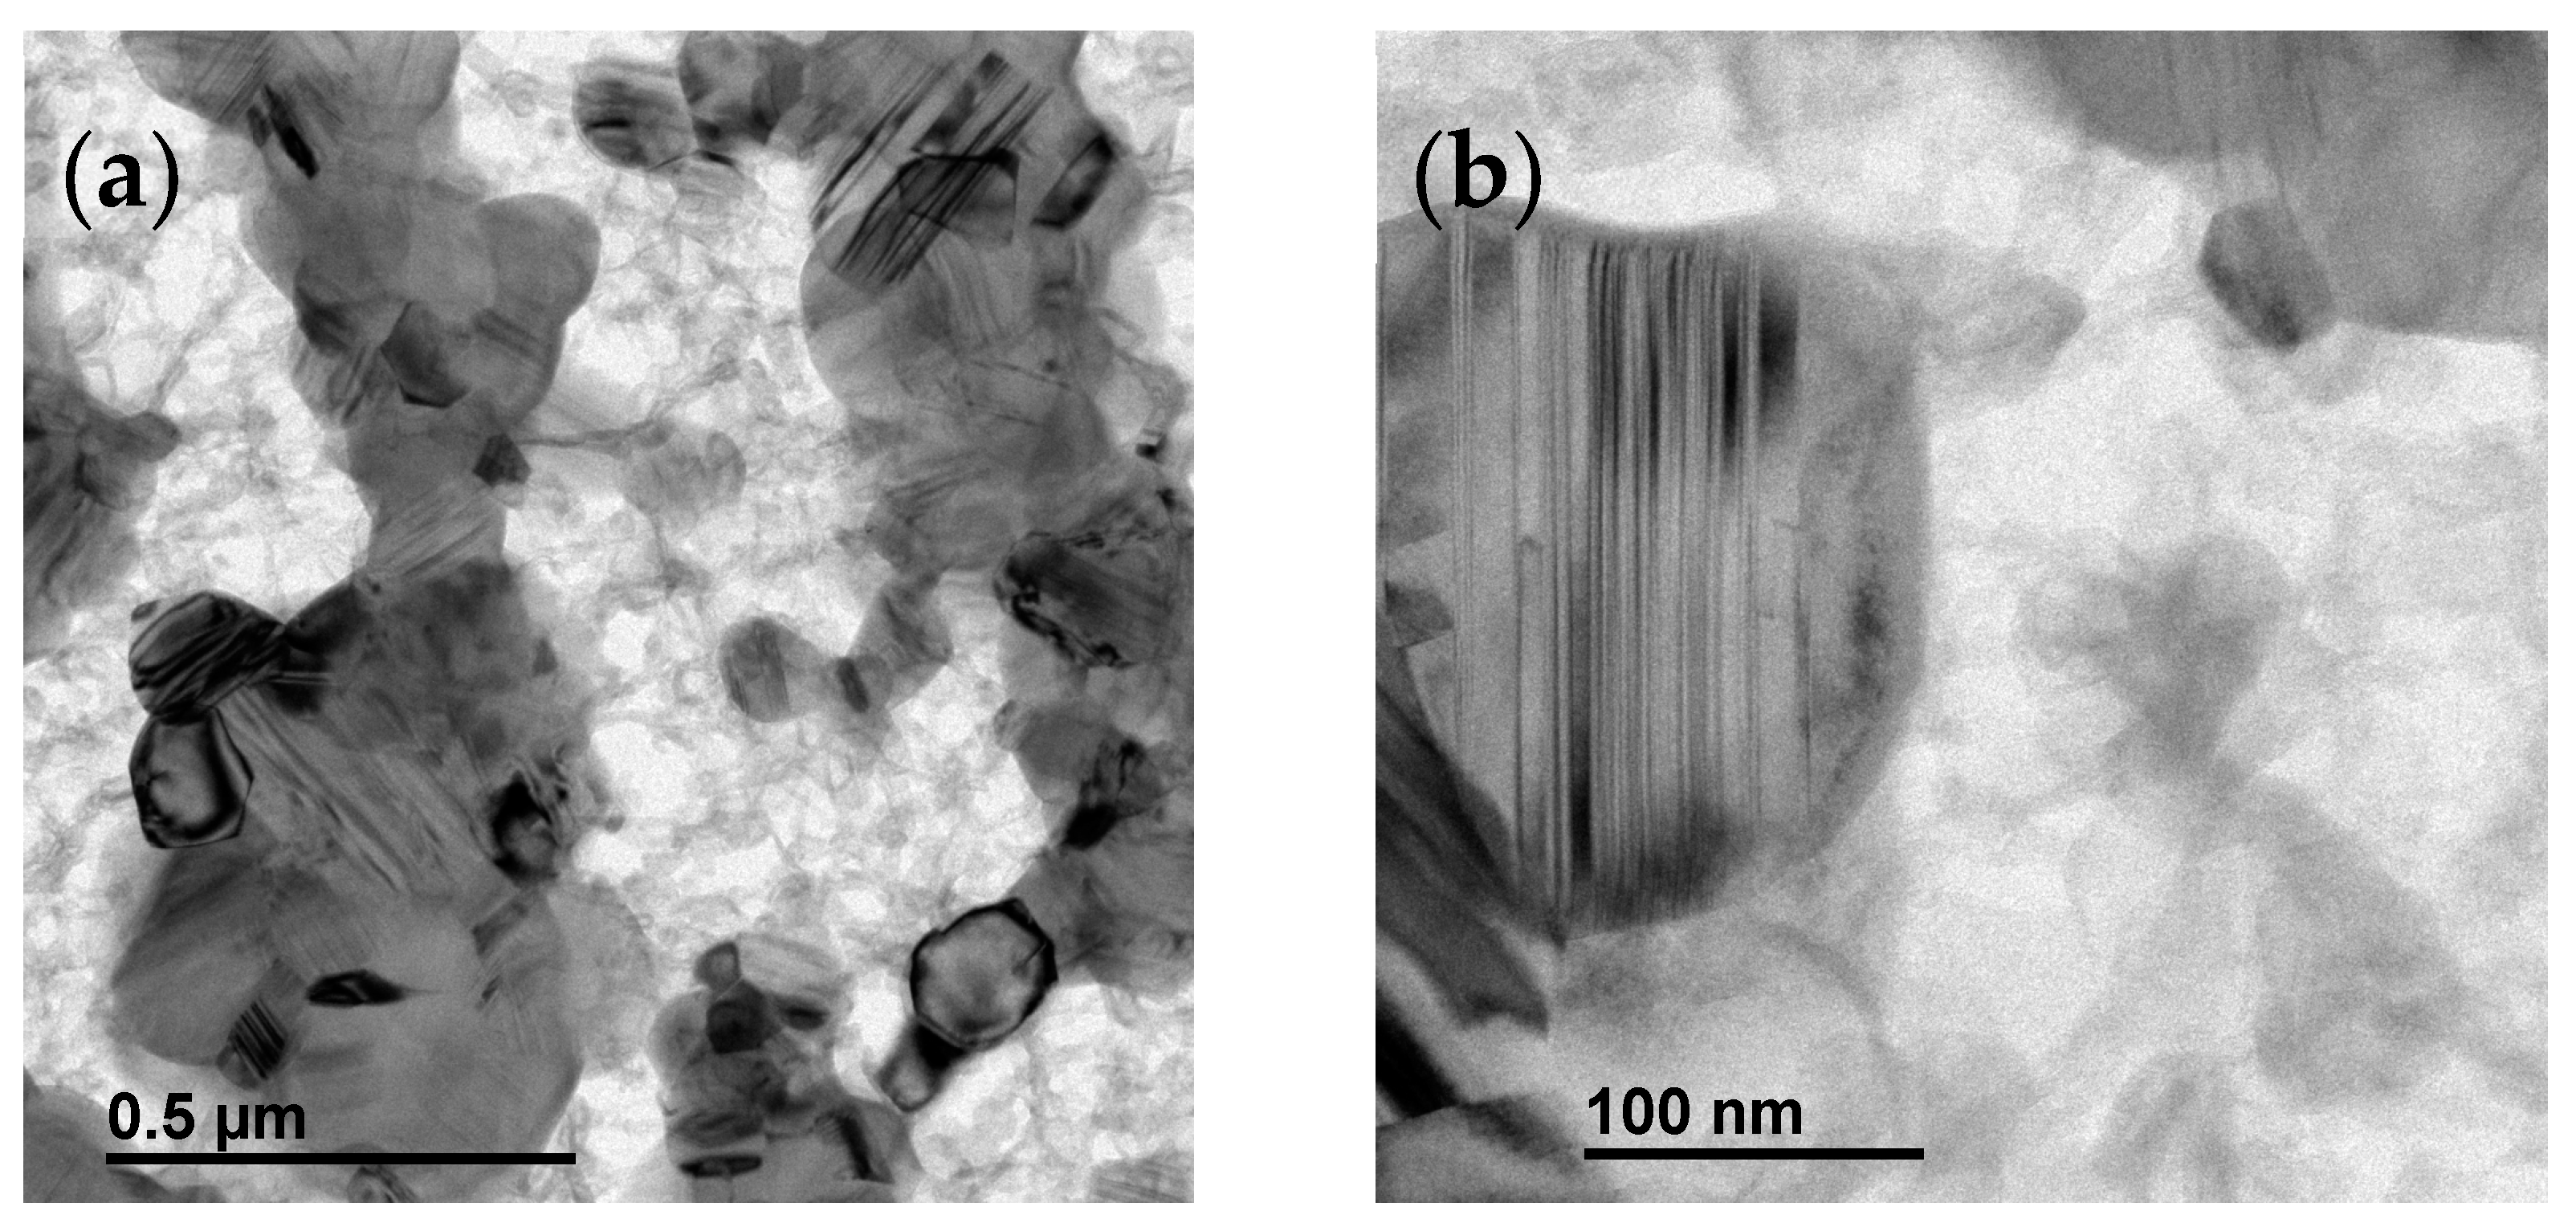
3.3. Conversion Process: From the Polymer Precursor to Ceramic
4. Conclusions
Author Contributions
Funding
Institutional Review Board Statement
Data Availability Statement
Conflicts of Interest
References
- Hexoloy (R) SA Silicon Carbide. Available online: https://www.ceramicsrefractories.saint-gobain.com/sites/imdf.hpr.com/files/hexoloy-sa-sic-en-1013-tds.pdf (accessed on 7 January 2020).
- Mersen Boostec®. Available online: https://www.mersen.com/fr/produits/specialites-graphite/ssic-sic-fritte (accessed on 16 November 2022).
- Schunk Carbon Technology. Available online: https://www.schunk-carbontechnology.com/en/products/technical-ceramics/ (accessed on 16 November 2022).
- Gomez, E.; Echeberria, J.; Iturriza, I.; Castro, F. Liquid phase sintering of SiC with additions of Y2O3, Al2O3 and SiO2. J. Eur. Ceram. Soc. 2004, 24, 2895–2903. [Google Scholar] [CrossRef]
- Bai, X.; Ding, G.; Zhang, K.; Wang, W.; Zhou, N.; Fang, D.; He, R. Stereolithography additive manufacturing and sintering approaches of SiC ceramics. Open Ceram. 2021, 5, 100046. [Google Scholar] [CrossRef]
- Hu, C.; Chen, Y.; Yang, T.; Liu, H.; Huang, X.; Huo, Y.; Jia, Z.; Wang, H.; Hu, L.; Sun, H.; et al. Effect of SiC powder on the properties of SiC slurry for stereolithography. Ceram. Int. 2021, 47, 12442–12449. [Google Scholar] [CrossRef]
- He, R.; Ding, G.; Zhang, K.; Li, Y.; Fang, D. Fabrication of SiC ceramic architectures using stereolithography combined with precursor infiltration and pyrolysis. Ceram. Int. 2019, 45, 14006–14014. [Google Scholar] [CrossRef]
- Sreeja, R.; Swaminathan, B.; Painuly, A.; Sebastian, T.V.; Packirisamy, S. Allylhydridopolycarbosilane (AHPCS) as matrix resin for C/SiC ceramic matrix composites. Mater. Sci. Eng. B 2010, 168, 204–207. [Google Scholar] [CrossRef]
- Wang, S.-J.; Fan, X.-D.; Kong, J.; Liu, Y.-Y. Synthesis, characterization, and UV curing kinetics of hyperbranched polycarbosilane. J. Appl. Polym. Sci. 2008, 107, 3812–3822. [Google Scholar] [CrossRef]
- Bouzat, F.; Graff, A.-R.; Lucas, R.; Foucaud, S. Preparation of C/SiC ceramics using a preceramic polycarbosilane synthesized via hydrosilylation. J. Eur. Ceram. Soc. 2016, 36, 2913–2921. [Google Scholar] [CrossRef]
- Zhong, X.; Pei, X.; Miao, Y.; He, L.; Huang, Q. Accelerating the crosslinking process of hyperbranched polycarbosilane by UV irradiation. J. Eur. Ceram. Soc. 2017, 37, 3263–3270. [Google Scholar] [CrossRef]
- Organometallics. Synthesis and Structure of a Highly Branched Polycarbosilane Derived from (Chloromethyl)trichlorosilane. Available online: https://pubs.acs.org/doi/10.1021/om00051a025 (accessed on 10 May 2021).
- Katoh, Y.; Snead, L.L.; Henager, C.H.; Nozawa, T.; Hinoki, T.; Iveković, A.; Novak, S.; Gonzalez de Vicente, S.M. Current status and recent research achievements in SiC/SiC composites. J. Nucl. Mater. 2014, 455, 387–397. [Google Scholar] [CrossRef]
- Chen, J.; Wang, Y.; Pei, X.; Bao, C.; Huang, Z.; He, L.; Huang, Q. Preparation and stereolithography of SiC ceramic precursor with high photosensitivity and ceramic yield. Ceram. Int. 2020, 46, 13066–13072. [Google Scholar] [CrossRef]
- de Hazan, Y.; Penner, D. SiC and SiOC ceramic articles produced by stereolithography of acrylate modified polycarbosilane systems. J. Eur. Ceram. Soc. 2017, 37, 5205–5212. [Google Scholar] [CrossRef]
- Martínez-Crespiera, S.; Ionescu, E.; Kleebe, H.-J.; Riedel, R. Pressureless synthesis of fully dense and crack-free SiOC bulk ceramics via photo-crosslinking and pyrolysis of a polysiloxane. J. Eur. Ceram. Soc. 2011, 31, 913–919. [Google Scholar] [CrossRef]
- Schmidt, J.; Altun, A.A.; Schwentenwein, M.; Colombo, P. Complex mullite structures fabricated via digital light processing of a preceramic polysiloxane with active alumina fillers. J. Eur. Ceram. Soc. 2019, 39, 1336–1343. [Google Scholar] [CrossRef]
- Schmidt, J.; Colombo, P. Digital light processing of ceramic components from polysiloxanes. J. Eur. Ceram. Soc. 2018, 38, 57–66. [Google Scholar] [CrossRef]
- Yang, J.; Yu, R.; Li, X.; He, Y.; Wang, L.; Huang, W.; Jiao, J. Silicon carbide whiskers reinforced SiOC ceramics through digital light processing 3D printing technology. Ceram. Int. 2021, 43, 18314–18322. [Google Scholar] [CrossRef]
- Zanchetta, E.; Cattaldo, M.; Franchin, G.; Schwentenwein, M.; Homa, J.; Brusatin, G.; Colombo, P. Stereolithography of SiOC Ceramic Microcomponents. Adv. Mater. 2016, 28, 370–376. [Google Scholar] [CrossRef]
- Vry, S.; Roumanie, M.; Laucournet, R.; Bernard-Granger, G. Transmission Electron Microscopy Investigations on a Polysiloxane Preceramic Polymer Pyrolyzed at High Temperature in Argon. Ceramics 2020, 3, 421–427. [Google Scholar] [CrossRef]
- Colombo, P.; Bernardo, E.; Parcianello, G. Multifunctional advanced ceramics from preceramic polymers and nano-sized active fillers. J. Eur. Ceram. Soc. 2013, 33, 453–469. [Google Scholar] [CrossRef]
- Hotza, D.; Nishihora, R.K.; Machado, R.A.F.; Geffroy, P.-M.; Chartier, T.; Bernard, S. Tape casting of preceramic polymers toward advanced ceramics: A review. Int. J. Ceram. Eng. Sci. 2019, 1, 21–41. [Google Scholar] [CrossRef]
- Uhlig, F.; Marsmann, H.C. 29Si NMR Some Practical Aspects. Silicon Compd. Silanes Silicones 2013, 167, 15. [Google Scholar]
- Schelm, K.; Abreu Morales, E.; Scheffler, M. Mechanical and Surface-Chemical Properties of Polymer Derived Ceramic Replica Foams. Materials 2019, 12, 1870. [Google Scholar] [CrossRef] [PubMed]
- Benson, J.J.; Wackett, L.P.; Aksan, A. Production of monodisperse silica gel microspheres for bioencapsulation by extrusion into an oil cross-flow. J. Microencapsul. 2016, 33, 412–420. [Google Scholar] [CrossRef] [PubMed]
- Davletbaev, R.S.; Zaripov, I.I.; Faizulina, Z.Z.; Davletbaeva, I.M.; Domrachova, D.S.; Gumerov, A.M. Synthesis and characterization of amphiphilic branched silica derivatives associated with oligomeric medium. RSC Adv. 2019, 9, 21233–21242. [Google Scholar] [CrossRef] [PubMed]
- Beganskienė, A.; Sirutkaitis, V.; Kurtinaitienė, M.; Juškėnas, R.; Kareiva, A. FTIR, TEM and NMR investigations of stöber silica nanoparticles. Mater. Sci. 2004, 10, 287–290. [Google Scholar]
- Steinbrück, N.; Pohl, S.; Kickelbick, G. Platinum free thermally curable siloxanes for optoelectronic application—Synthesis and properties. RSC Adv. 2019, 9, 2205–2216. [Google Scholar] [CrossRef]
- Launer, P.; Arkles, B. Infrared Analysis of Organosilicon Compounds. In Silicone Compounds Register and Review; Gelest Inc.: Morrisville, PA, USA, 2013; pp. 175–178. ISBN 978-0-578-12235-9. [Google Scholar]
- Lukin, R.Y.; Kuchkaev, A.M.; Sukhov, A.V.; Bekmukhamedov, G.E.; Yakhvarov, D.G. Platinum-Catalyzed Hydrosilylation in Polymer Chemistry. Polymers 2020, 12, 2174. [Google Scholar] [CrossRef]
- Bahloul-Hourlier, D.; Latournerie, J.; Dempsey, P. Reaction pathways during the thermal conversion of polysiloxane precursors into oxycarbide ceramics. J. Eur. Ceram. Soc. 2005, 25, 979–985. [Google Scholar] [CrossRef]
- Trimmel, G.; Badheka, R.; Babonneau, F.; Latournerie, J.; Dempsey, P.; Bahloul-Houlier, D.; Parmentier, J.; Soraru, G.D. Solid State NMR and TG/MS Study on the Transformation of Methyl Groups During Pyrolysis of Preceramic Precursors to SiOC Glasses. J. Sol-Gel Sci. Technol. 2003, 26, 279–283. [Google Scholar] [CrossRef]
- Campostrini, R.; D’Andrea, G.; Carturan, G.; Ceccato, R.; Sorarù, G.D. Pyrolysis study of methyl-substituted Si—H containing gels as precursors for oxycarbide glasses, by combined thermogravimetry, gas chromatographic and mass spectrometric analysis. J. Mater. Chem. 1996, 6, 585–594. [Google Scholar] [CrossRef]
- Tajima, S.; Sekiguchi, O.; Watanabe, Y.; Nakajima, S.; Takahashi, Y. Metastable ion study of organosilicon compounds. Part XIII: Dimethoxydimethylsilane, (CH3)2Si(OCH3)2, and dimethoxymethylsilane, CH3SiH(OCH3)2. J. Mass Spectrom. 2001, 36, 816–824. [Google Scholar] [CrossRef]
- Belot, V.; Corriu, R.J.P.; Leclercq, D.; Mutin, P.H.; Vioux, A. Redistribution reactions in silsesquioxane gels. J. Mater. Sci. Lett. 1990, 9, 1052–1054. [Google Scholar] [CrossRef]
- Gualandris, V.; Hourlier-Bahloul, D.; Babonneau, F. Structural Investigation of the First Stages of Pyrolysis of Si-C-O Preceramic Polymers Containing Si–H Bonds. J. Sol-Gel Sci. Technol. 1999, 14, 39–48. [Google Scholar] [CrossRef]
- Pujar, V.V.; Cawley, J.D. Effect of Stacking Faults on the X-ray Diffraction Profiles of β-SiC Powders. J. Am. Ceram. Soc. 1995, 78, 774–782. [Google Scholar] [CrossRef]


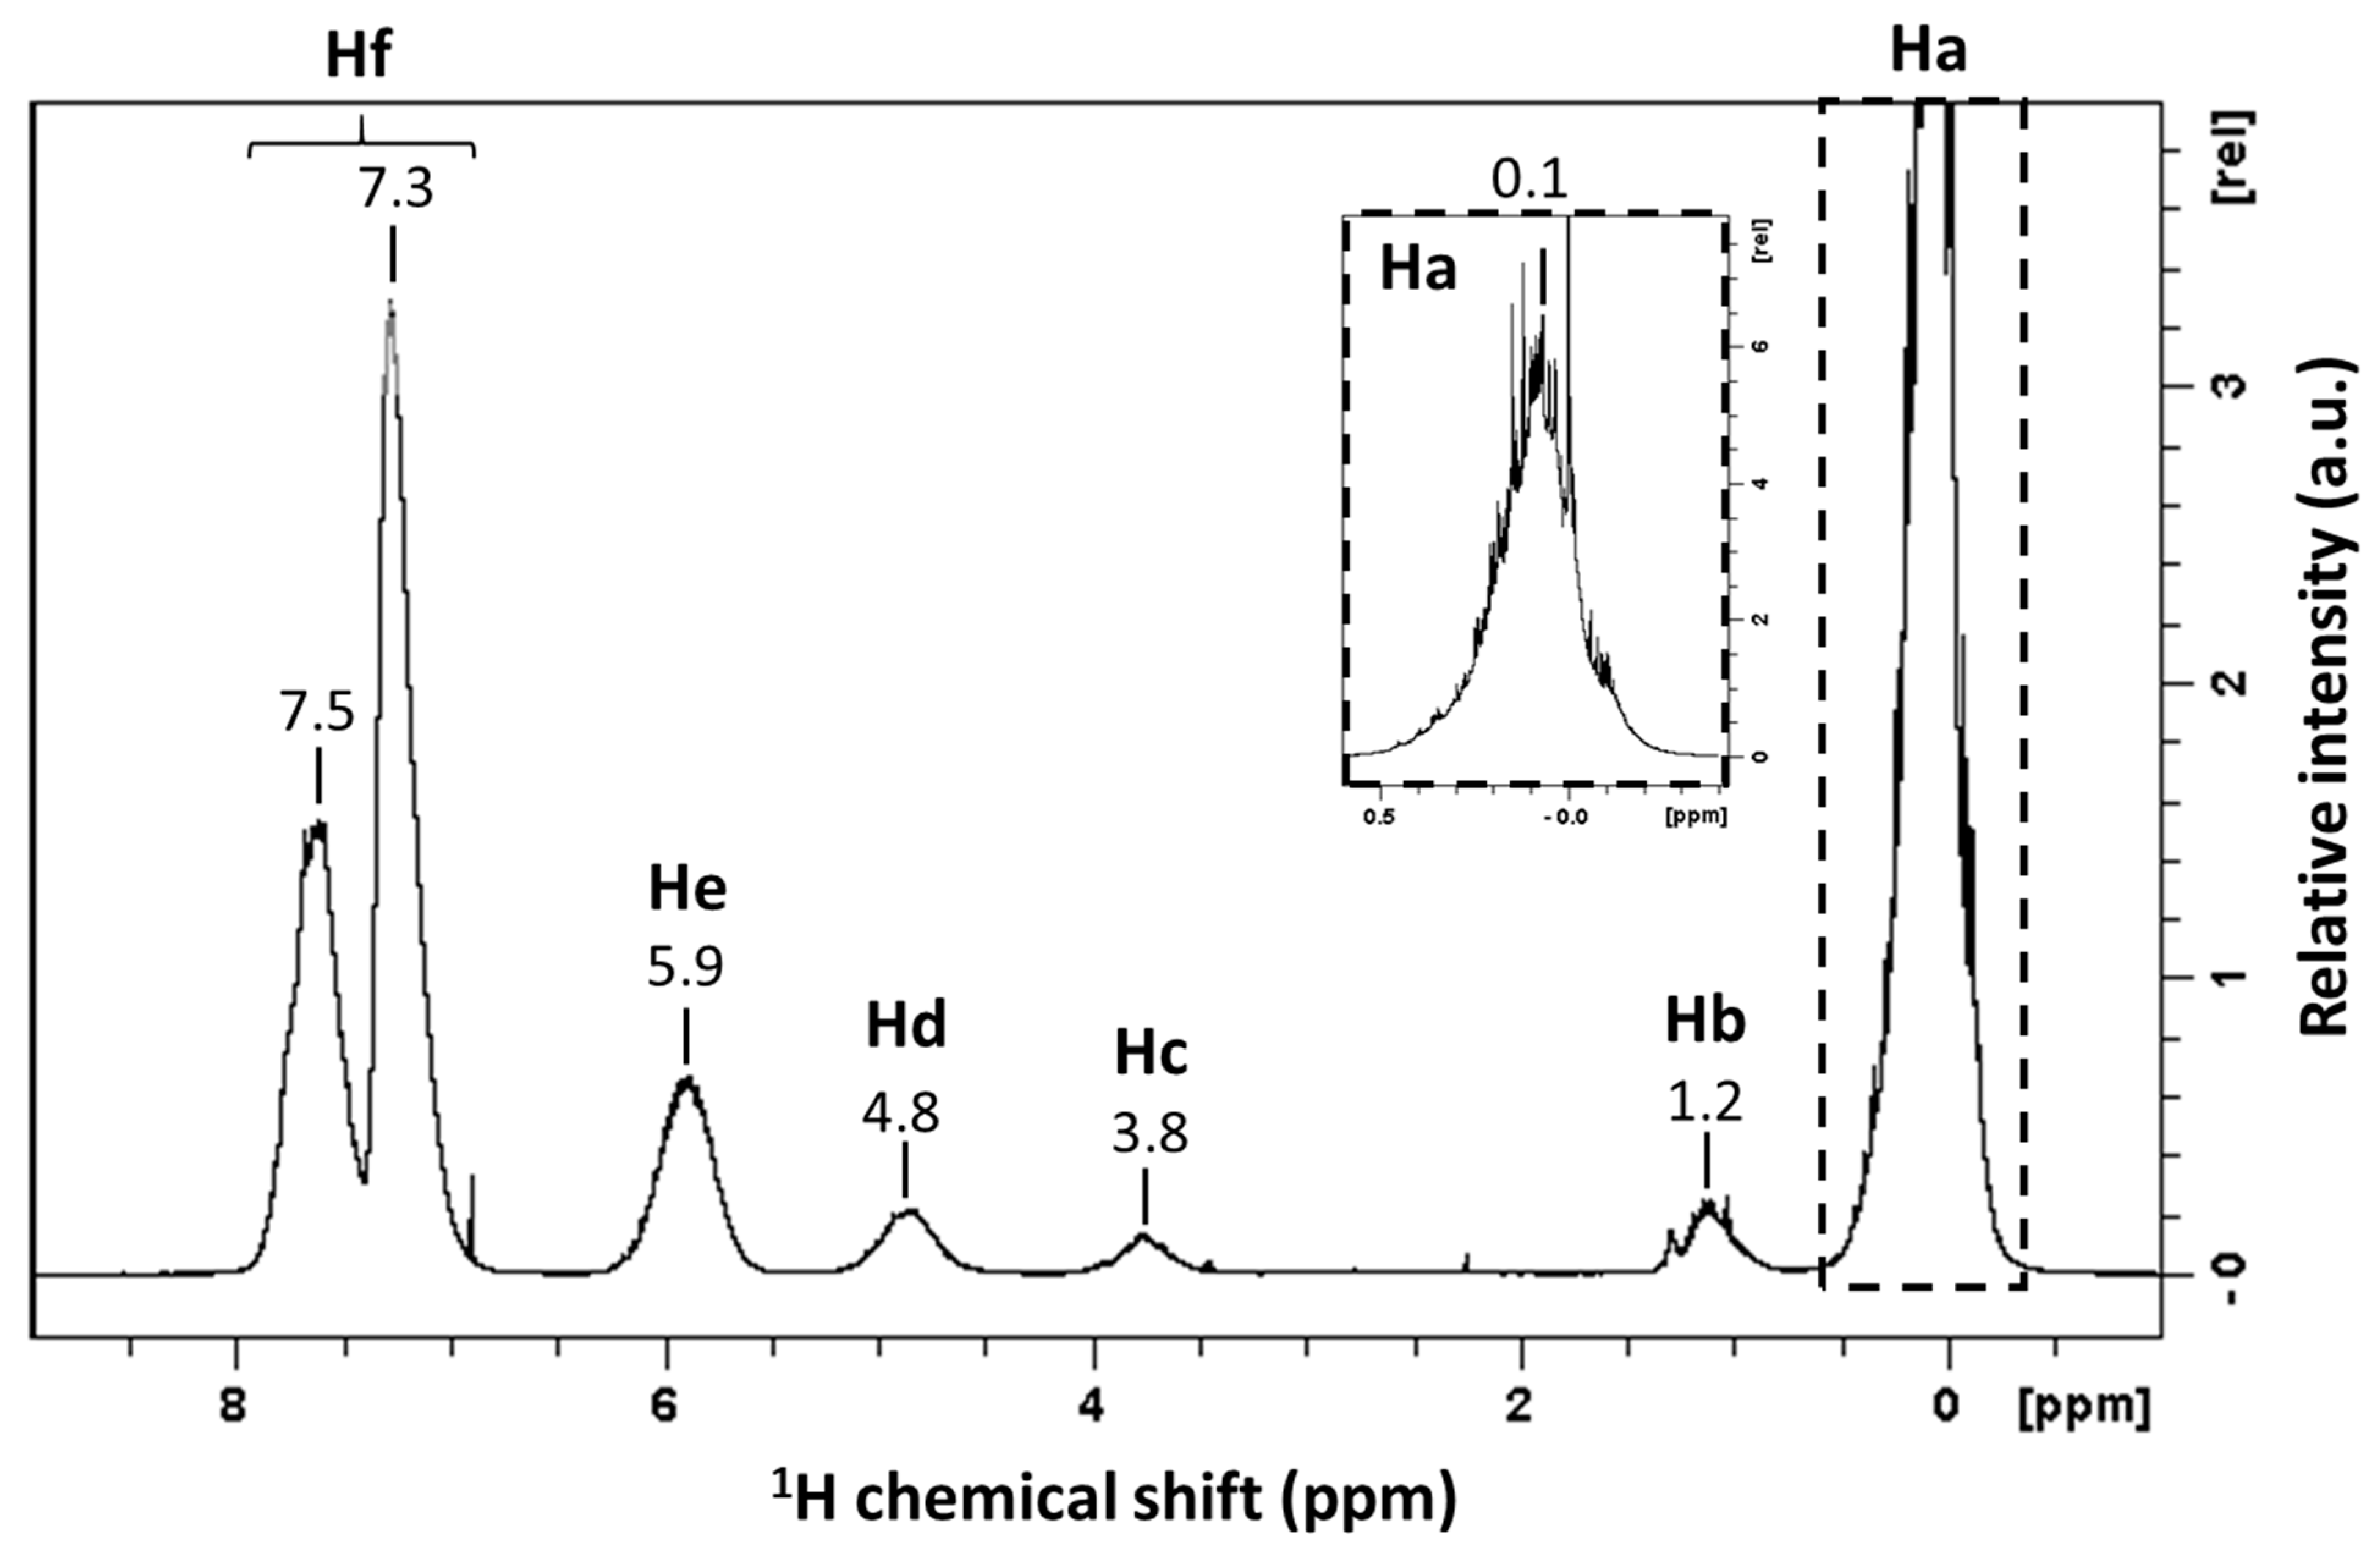
| Signals | Chemical Shift (ppm) | Attribution | Proportion of Protons (%) | Protons per Functional Groups | Proportion of Functional Groups (%) |
|---|---|---|---|---|---|
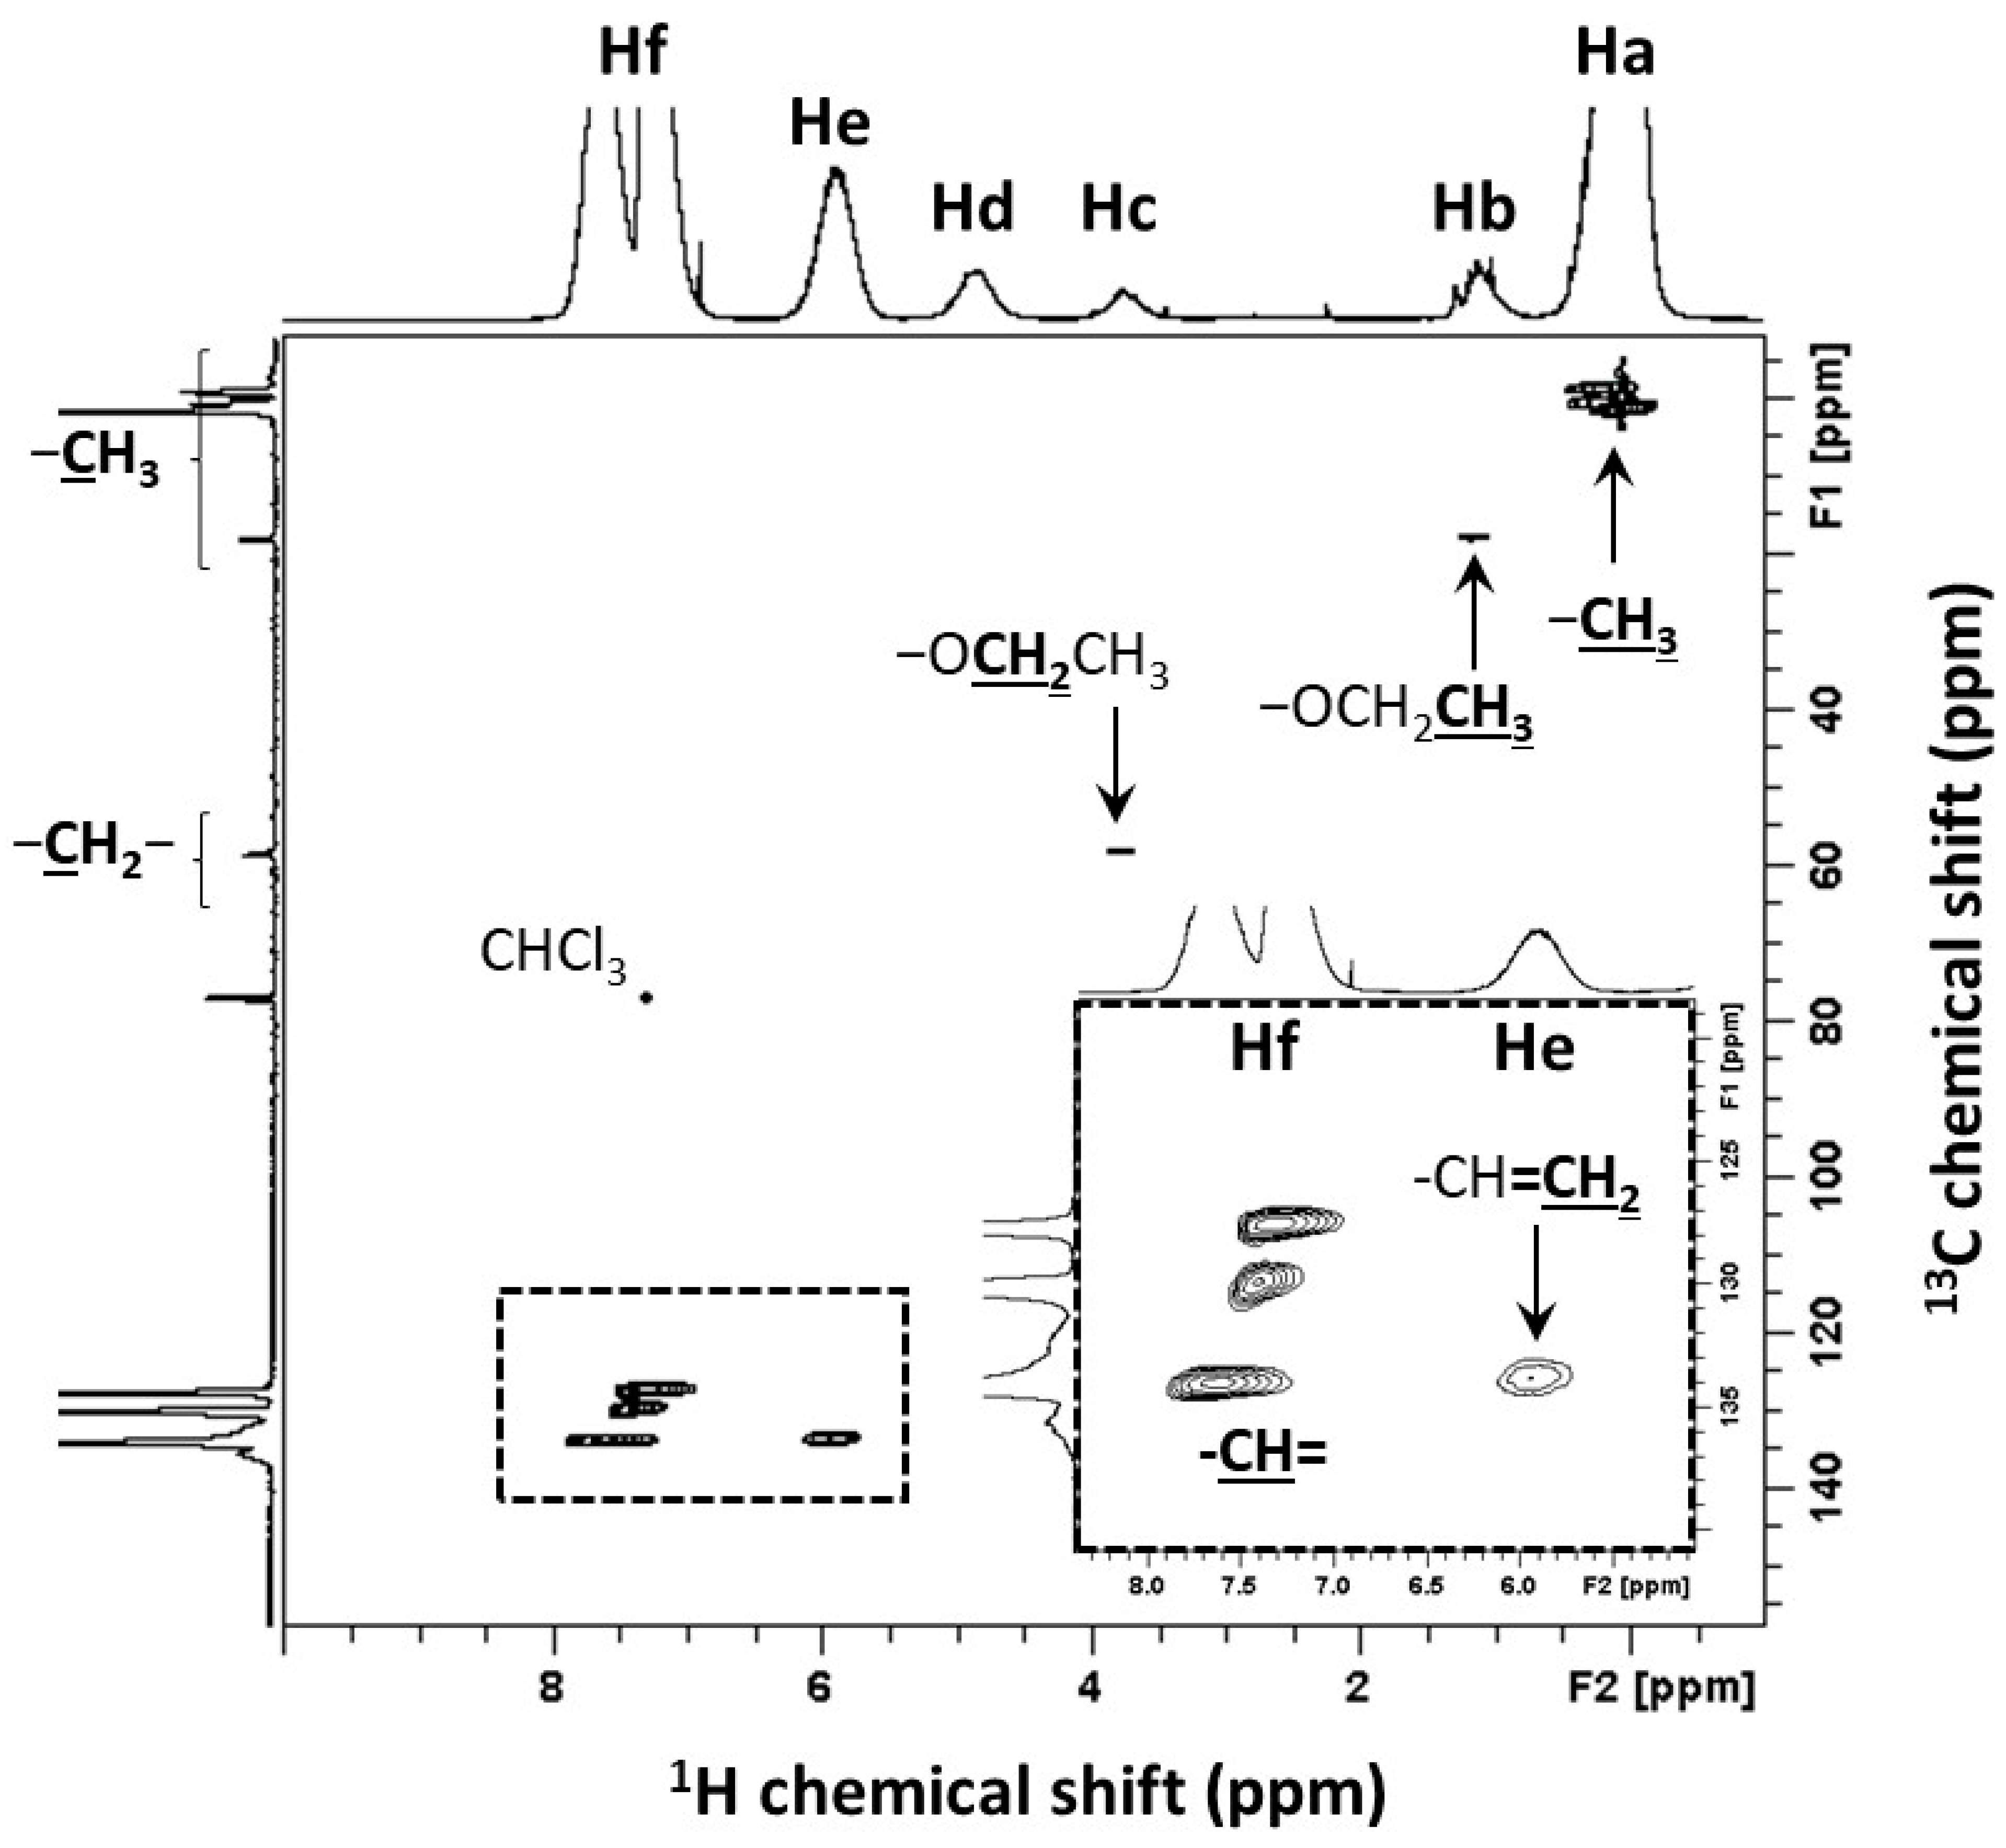
| Ha | 0.1 | Si-CH3 | 49.4 | 3 | 54.8 |
| Hb | 1.2 | Si-O-CH2-CH3 | 2.3 |  | |
| Hc | 3.8 | Si-O-CH2-CH3 | 1.4 | ||
| Hd | 4.8 | Si-H | 2.5 | 1 | 8.4 |
| He | 5.9 | Si-CH=CH2 | 7.2 |  | |
| Hf1 | 7.3 | Si-CH=CH2 | 3.6 | ||
| Hf2 | [7.3; 7.5] | Si-Ph | 33.6 | 5 | 22.4 |
| Hf | [7.3; 7.5] | ∑(-CH)= (Hf1 + Hf2) | 37.2 | - | - |
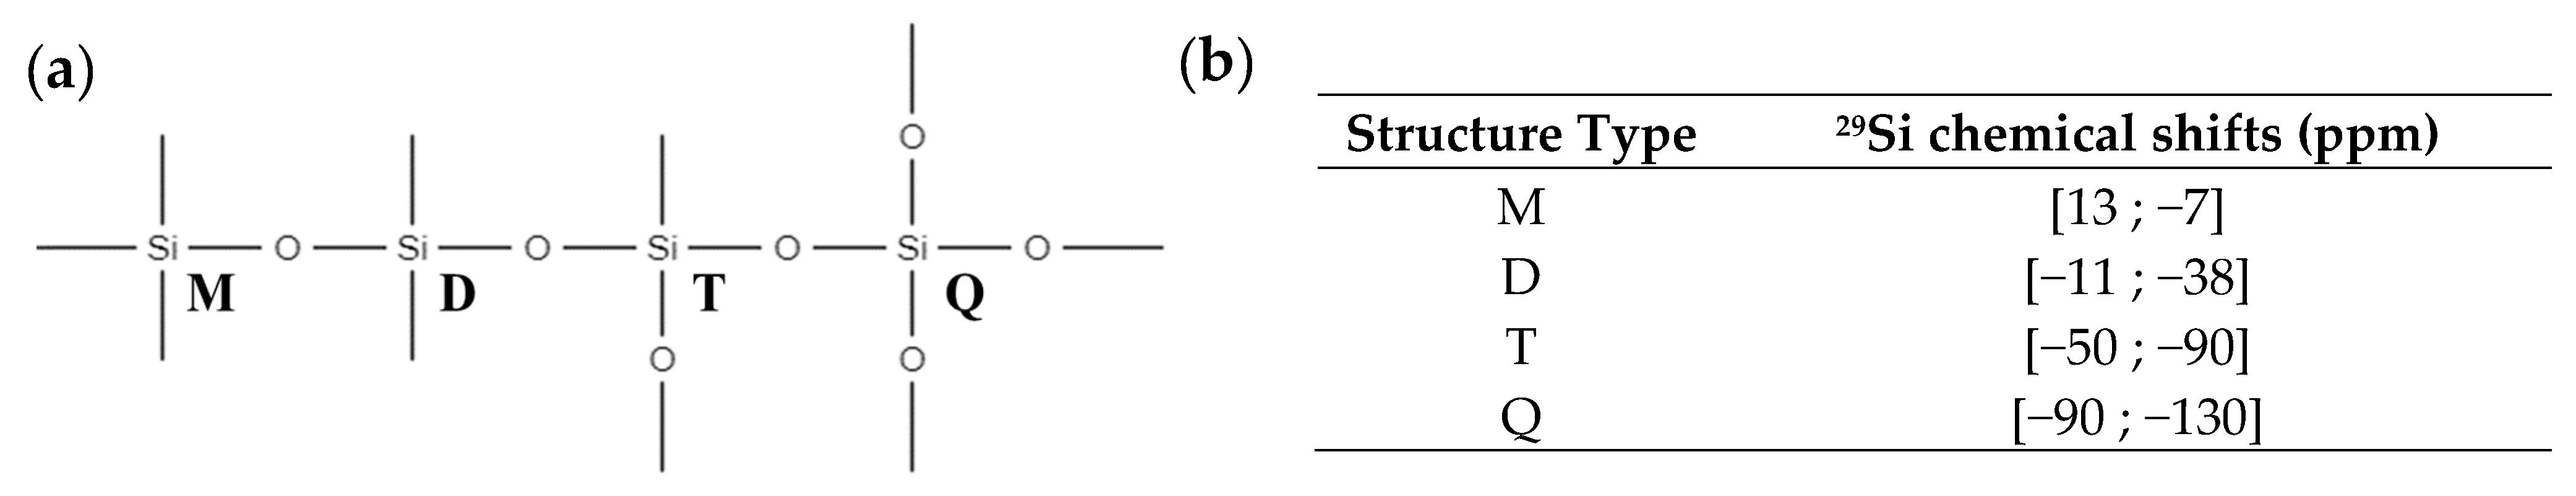
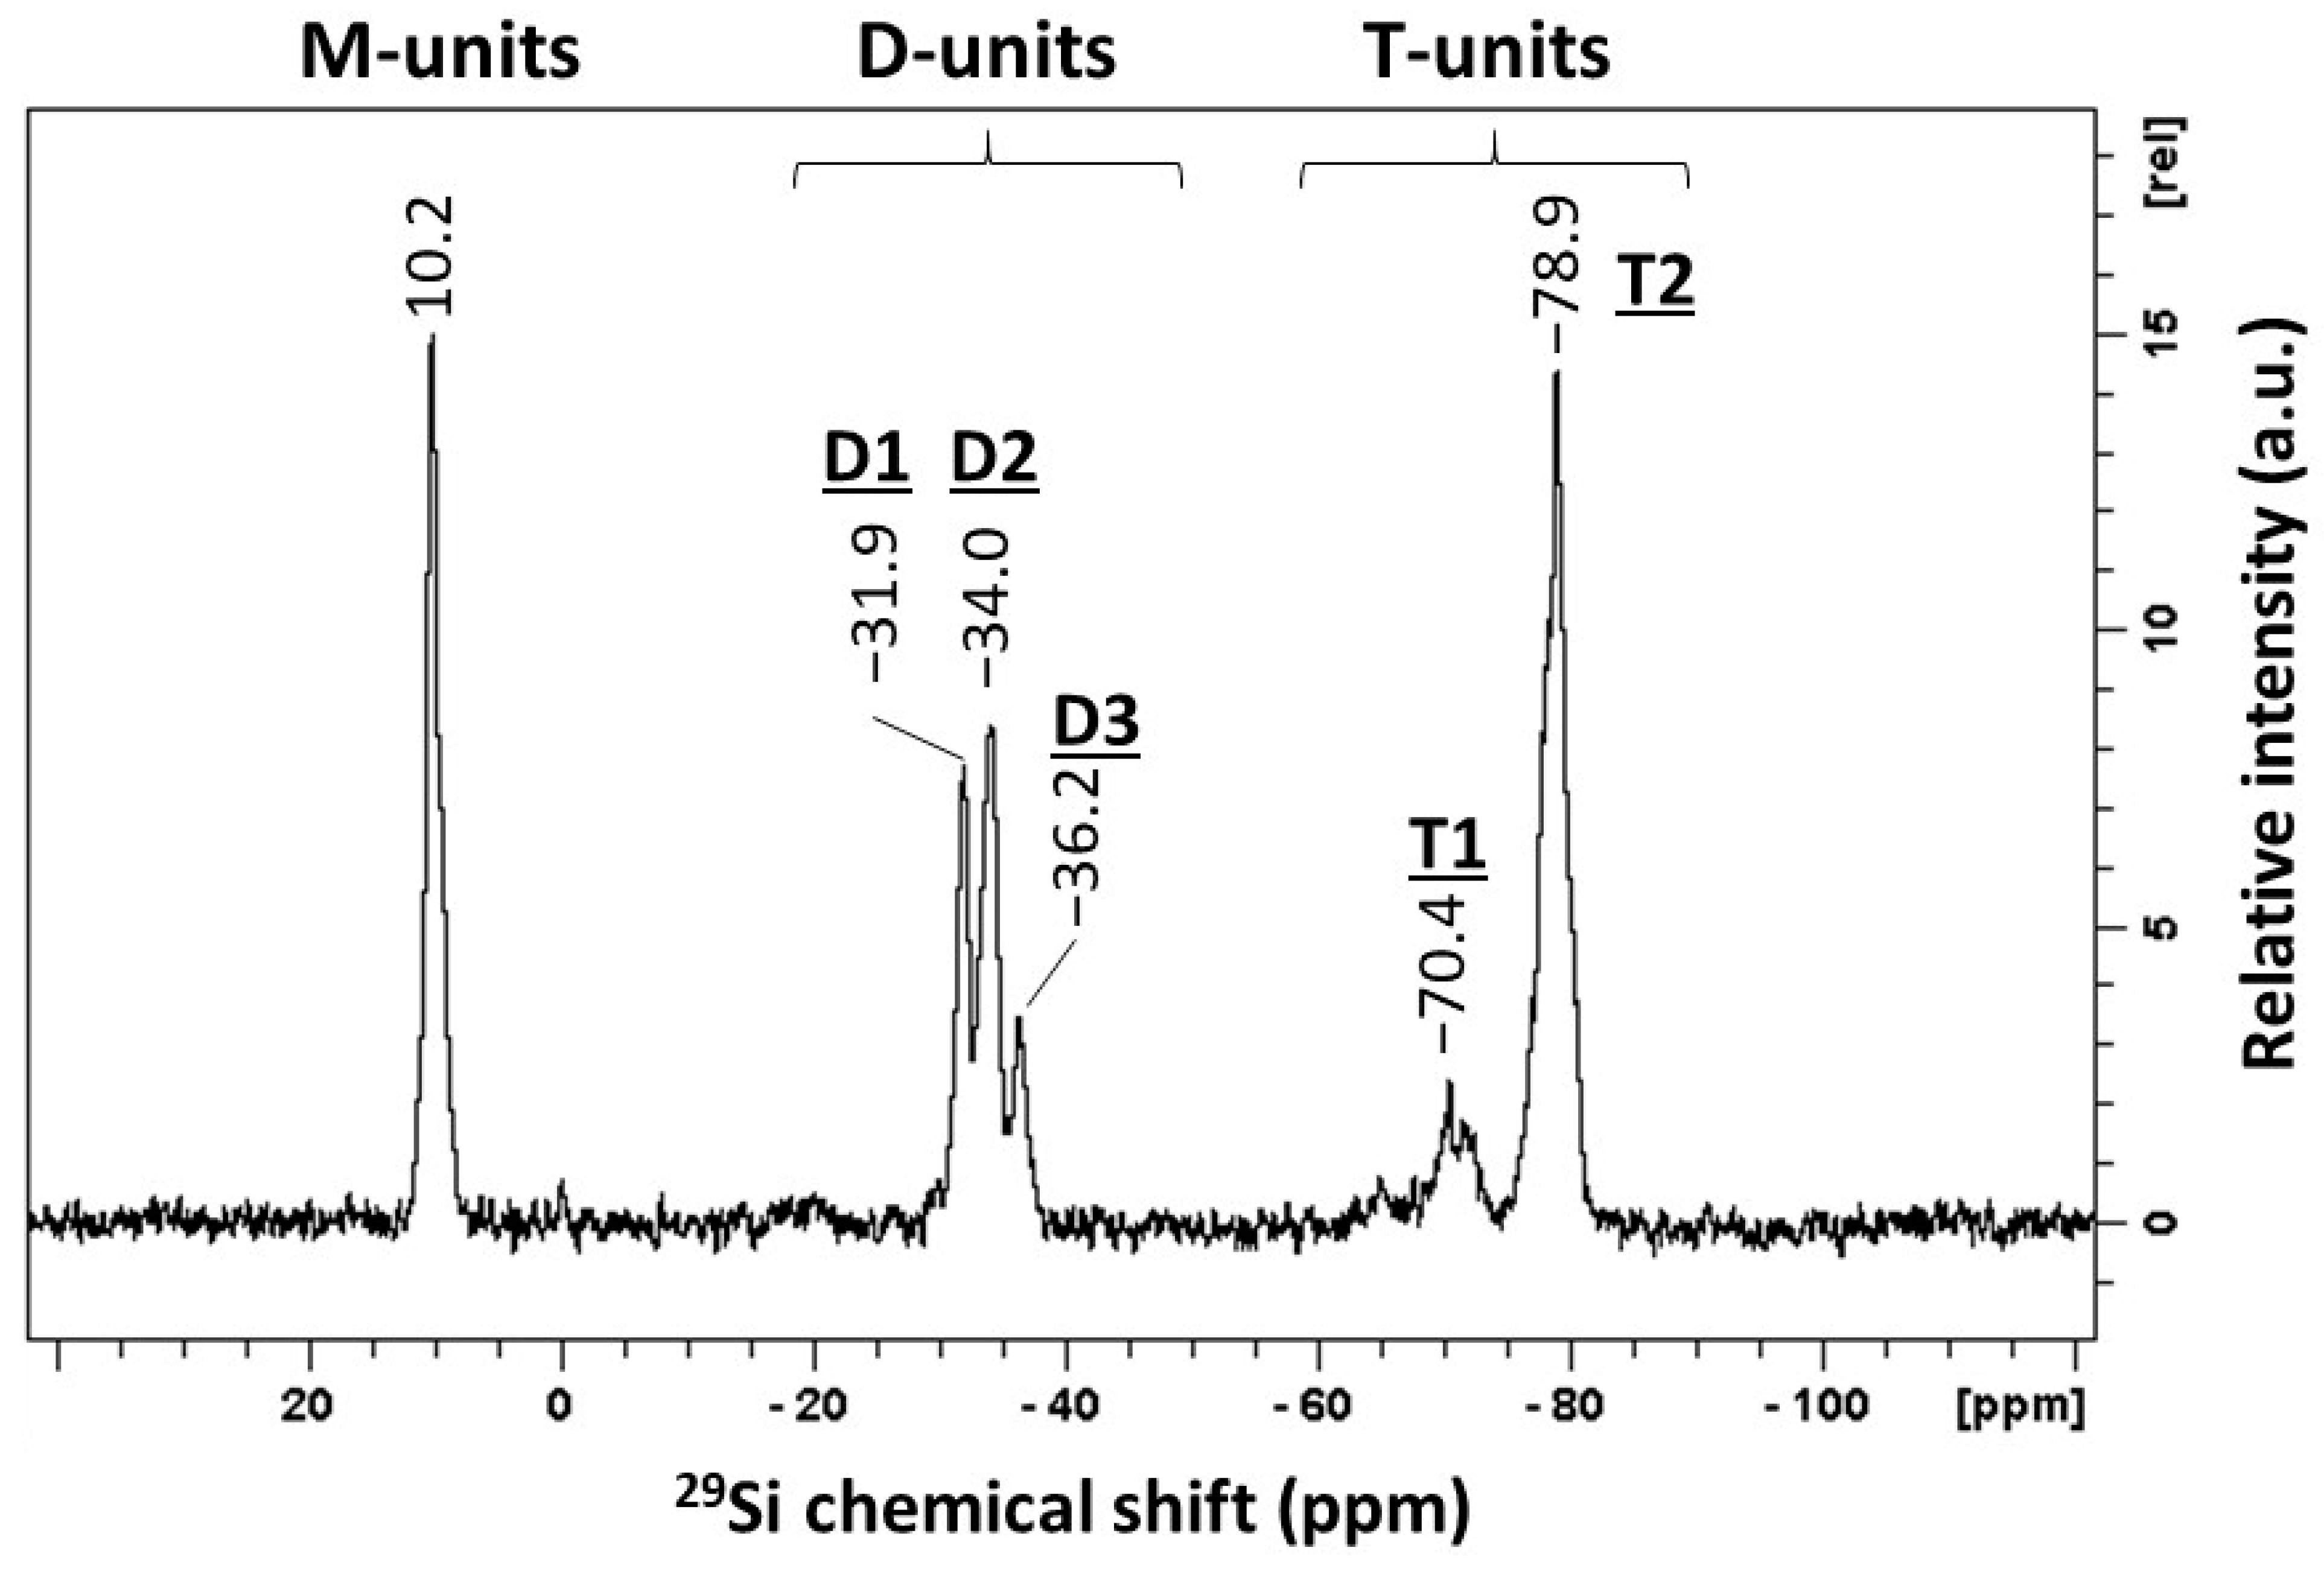
| Signals | Chemical Shift (ppm) | Attribution | Proportion of Si Atoms (%) | Functional Groups per Si Atoms | Proportion of Functional Groups (%) |
|---|---|---|---|---|---|
| M | 10.2 | Mono-functional Si atoms | 21.9 | 3 | 37.5 |
| D | [−36.2; −31.9] | Di-functional Si atoms | 31.4 | 2 | 35.9 |
| T | [−78.9; −70.4] | Tri-functional Si atoms | 46.7 | 1 | 26.6 |
| Si Atoms | |||||
|---|---|---|---|---|---|
| M Units | D Units | T Units | |||
| Proportion of Functional Groups (%) | 37.5 | 35.9 | 26.6 | ||
| Functional groups | Si-CH3 | 54.8 | 37.5 | 17.3 | - |
| Si-O-CH2-CH3 | 2.4 | - | 2.4 | - | |
| Si-H | 8.4 | - | 8.4 | - | |
| Si-CH=CH2 | 12.0 | - | 7.8 | 4.2 | |
| Si-Ph | 22.4 | - | - | 22.4 | |
| Wavenumber (cm−1) | Normalized Absorbance | Mode |
|---|---|---|
| 3648 | 0.2 | ν(O-H) |
| 3053 | 0.5 | ν(=C-H) |
| 2960 | 1 | ν(CH3) |
| 2171 | 0.6 | ν(Si-H) |
| 1959/1888/1822 | 0.1 | Harmonics of δ(=C-H) |
| 1594 | 0.3 | ν(C=C) |
| 1430 | 0.6 | δ(CH3) |
| 1407 | 0.3 | δ(=C-H) in plane |
| 1260 | 1.67 | D unit polysiloxane (CH2)2SiO |
| 1134 | 4.8 | T unit polysiloxane (CH2)SiO3/2 |
| 1053 | 6.7 | ν(Si-O) |
| 962/906/896 | 0.3/1.9/1.9 | δ(=C-H) out of plane |
| 862 | 1.8 | D unit polysiloxane (CH2)2SiO |
| 842 | 2.6 | M unit polysiloxane (CH3)3SiO1/2 |
| 809 | 1.0 | D unit polysiloxane (CH2)2SiO |
| 767/757/740/717/698 | 1.5/1.5/1.1/1.2/2.0 | D unit (Ph)(CH3)SiO |
| Products | Temperature (°C) | m/z |
|---|---|---|
| CH3SiH | 300–700 | 44 |
| Water H2O Ethoxy C2H5O− | 350–650 | 18 |
| 350–700 | 31, 45 | |
| Ethane C2H6 : [C2H4]+ | 350–700 | 28 |
| Benzene C6H6 | 375–650 | 78 |
| Vinyl CH2=CH | 400–650 | 27 |
| Methane CH4 | 400–800 | 16 |
| Dihydrogen H2 | 500–1000 | 2 |
Publisher’s Note: MDPI stays neutral with regard to jurisdictional claims in published maps and institutional affiliations. |
© 2022 by the authors. Licensee MDPI, Basel, Switzerland. This article is an open access article distributed under the terms and conditions of the Creative Commons Attribution (CC BY) license (https://creativecommons.org/licenses/by/4.0/).
Share and Cite
Vry, S.; Roumanie, M.; Bayle, P.-A.; Rolère, S.; Bernard-Granger, G. Silicon Carbide Precursor: Structure Analysis and Thermal Behavior from Polymer Cross-Linking to Pyrolyzed Ceramics. Ceramics 2022, 5, 1066-1083. https://doi.org/10.3390/ceramics5040076
Vry S, Roumanie M, Bayle P-A, Rolère S, Bernard-Granger G. Silicon Carbide Precursor: Structure Analysis and Thermal Behavior from Polymer Cross-Linking to Pyrolyzed Ceramics. Ceramics. 2022; 5(4):1066-1083. https://doi.org/10.3390/ceramics5040076
Chicago/Turabian StyleVry, Sébastien, Marilyne Roumanie, Pierre-Alain Bayle, Sébastien Rolère, and Guillaume Bernard-Granger. 2022. "Silicon Carbide Precursor: Structure Analysis and Thermal Behavior from Polymer Cross-Linking to Pyrolyzed Ceramics" Ceramics 5, no. 4: 1066-1083. https://doi.org/10.3390/ceramics5040076
APA StyleVry, S., Roumanie, M., Bayle, P.-A., Rolère, S., & Bernard-Granger, G. (2022). Silicon Carbide Precursor: Structure Analysis and Thermal Behavior from Polymer Cross-Linking to Pyrolyzed Ceramics. Ceramics, 5(4), 1066-1083. https://doi.org/10.3390/ceramics5040076