Article

Analysis of the Formed Protective Layer Inhibiting Alkali Corrosion in Aluminosilicate Refractory Castables

by
Valentin Antonovič
,
Rimvydas Stonys
,
Povilas Zdanevičius
,
Romualdas Mačiulaitis
,
Renata Boris
* and
Jurgita Malaiškienė
Laboratory of Composite Materials, Institute of Building Materials, Faculty of Civil Engineering, Vilnius Gediminas Technical University, Linkmenu St. 28, 08217 Vilnius, Lithuania
*
Author to whom correspondence should be addressed.
Ceramics 2022, 5(4), 1051-1065; https://doi.org/10.3390/ceramics5040075
Submission received: 25 October 2022 / Revised: 13 November 2022 / Accepted: 16 November 2022 / Published: 19 November 2022
(This article belongs to the Special Issue Advances in Ceramics)

Abstract

:
This article analyzes the mechanism of the protective layer formation under the action of alkali in a refractory castable when ground quartz sand (GQS) is used as an admixture to produce refractory conventional castables (CC) and medium cement castables (MCC). It was found that, independently of the castable composition, the addition of GQS (2.5%) reduces the degree of K2CO3 dissolution at high temperature, and the released potassium reacts with the silica and forms a viscous potassium silicate glass, which reduces the mobility of alkali. The liquid phase formed filled some of the open pores and hindered the penetration of potassium into the deeper layers of the refractory castable. The thickness of the formed protective layer, after three cycles of the alkaline corrosion test, varies from 700 µm up to 1300 µm, depending on the castable composition.

1. Introduction

Various aggressive alkaline compounds, such as potassium and sodium carbonates, chlorides, and sulphates are formed in the biomass combustion process [1], produce ash of low melting temperature, and pose a serious challenge for the application of biomass in energetic plants instead of fossil fuels. This leads to a more intensive fouling of the boilers, deposition of fly ash on the heating surfaces, and alkali corrosion of materials used in the equipment [2,3]. Corrosion of refractory materials significantly reduces the durability of the lining [4,5] of the boilers and also causes failure [6].
In order to prevent premature degradation of the material due to ash’s influence, boilers’ operating parameters and requirements for biofuel usually are quite strict. Therefore, it is expected that there are no conditions for significant alkali attack. Unfortunately, various violations (poorly controlled local temperatures, the use of low-quality fuel with an increased content of alkalis and other aggressive impurities, the use of alkaline salts to prevent freezing of biofuels, etc.) often lead to emergency situations associated with the rapid destruction of the internal structures of the biomass boilers (Figure 1).
The reaction of aluminosilicates, which are present in refractory materials used for biomass boilers (fireclay, mullite, corundum), with potassium compounds produces different corrosion products, such as kaliophilite (K2O∙Al2O3∙2SiO2), leucite (K2O∙Al2O3∙4SiO2), and other compounds with the volume exceeding the initial volume of the material [7,8,9,10].
The volume of reaction products in fireclay can increase by 19% and by 22% in mullite with approx. 32% of K2O penetrated [8]. The 20–25% expansion of mullite and corundum leads to the degradation of the material [9].
Alkali metal ions penetrate most easily into the matrix of material [11], accumulate in the matrix, and only then react with the aggregates [12]. This process takes place due to the higher porosity of the matrix compared to the aggregate and usually a higher content of various impurities (Na2O, TiO2, and other compounds) [13]. After the penetration into the aluminosilicate material, the alkali metals react first with the glass phase of the material or cristobalite and only later with the mullite [14]. The authors note that the reaction between K2O and SiO2 produces potassium silicate, which reacts with mullite to form kaliophilite over a short time period, followed by a longer reaction of the latter with the free SiO2 to form leucite.
The penetration of alkali vapor or alkaline liquid phase into the structure of a material depends on its open porosity and other porosity parameters [15]. Corrosion is less likely to develop in materials with lower porosity and gas permeability [13,16,17].
The potential of crystalline SiO2 should be considered to reduce alkali penetration into the aluminosilicate structure by adjusting the chemical composition of the refractory material. Silica-enriched melt from the K2CO3-CaCO3-SiO2 mixture (synthetic ash) was found [12] to significantly hinder the penetration of K into mullite (63% Al2O3) and corundum (83% Al2O3)-based material, compared to the pure K2CO3 or K2CO3-CaCO3 mixture used in the tests described in the paper. Another paper reports [18] that the refractory containing 35% of Al2O3 had higher resistance to alkali due to the higher content of free silica in its matrix, compared to the refractory containing 50% of Al2O3. The alkali and silica reaction produces a viscous glass phase that prevents the alkali from penetrating deeper into the refractory material [19]. Our previous research into the alkali resistance of concrete [20,21] showed that the addition of finely ground quartz sand to fireclay castable promotes the formation of a protective glassy layer on the surface of the castable exposed to K2CO3 at 1100°C. The resistance of fireclay castables to alkali attack determined by the static crucible method increased by more than five times (from 4 to more than 20 cycles).
However, the mechanism of the formation of a protective layer in aluminosilicate castables (subject to the chemical composition and porosity parameters of the material) modified with finely ground quartz sand is not sufficiently clear.
The aim of this work is to investigate the formation of a protective layer that inhibits alkaline corrosion in different types of refractory castables with fireclay aggregate and modified with quartz sand at 1100 °C temperature.

2. Materials and Methods

Conventional (cement content 25%, CC) and medium cement (12%, MCC) refractory castables with different types of fireclay aggregate (BOS135 and BOS145, particle size less than 4 mm), produced by Tabex-Ozmo (Poland) with Al2O3 content in BOS135 ~35%, Al2O3/SiO2 (A/S) ratio 0.68, and Al2O3 content in BOS145~45%, with A/S ratio 0.89 were tested. The castables were labelled as CC-1, CC-2, MCC-1, and MCC-2, respectively. Calcium aluminate cement Istra 40 (CAC40) produced by Calucem GmbH (Mannheim, Germany) was used for CC mixes, and Gorkal 70 (CAC70) cement produced by Gorka Cement Company (Trzebinia, Poland) was used for MCC. The castable also contained ultra-dispersive admixtures such as microsilica (MS) RW-Fuller produced by RW Silicon GmbH (Pocking, Germany), reactive alumina (RA) CTC 20 and calcined alumina (CA) CT 19 produced by Almatis (Ludwigshafen, Germany), and deflocculants (Castament FS20, Castament FS30, and sodium tripolyphosphate (NT)) produced by BASF Construction Solutions GmbH (Trostberg, Germany). Ground quartz sand (GQS) containing 99.20 % SiO2 (average particle size about 10 µm) produced by AB Anykščių kvarcas (Anykščiai, Lithuania) was used to induce the development of the protective layer. The compositions and the main properties of the castables are given in Table 1. The 2.5% of GQS was chosen, because this amount significantly increases the alkali resistance of different types of castables, and thermal shock resistance decreases insignificantly. A larger amount of GQS (up to 7.5%) decreases thermal shock resistance of castables depending on the castable type by up to 70% [22].
The results (Table 1) on the compressive strength for the CC and MCC series castables with GQS after firing at 1100 °C and on the thermal shock resistance (TSR) determined at 950 °C show that different classes of castables were used in the alkaline corrosion tests. Castables with different properties were chosen for analysis to determine how different mechanisms of protective layer formation could occur during the impact of potassium at 1100 °C temperature.
The specimens of refractory castable were prepared, dried, and fired according to the requirements set out in LST EN ISO 1927-5:2013. The physical mechanical characteristics were established according to LST EN ISO 1927-6:2013, deformation temperatures were measured according to EN ISO 1893:2009, and thermal shock resistance was determined according to DIN 51068. The open porosity of castable was determined according to LST EN ISO 10545–3:2000.
The chemical composition of the refractory castable was analyzed by means of wavelength dispersive X-ray fluorescence spectroscopy (XRF-WD). The analysis was performed on ZSX Primus IV spectrometer (Rigaku Corp., Tokyo, Japan) 4 kW, Rh anode.
The crucible method (ASTM C 454-83:2007) was chosen to assess the influence of alkali attack on the structure of the castable [23]. For the tests, 70 × 70 × 70 mm castable specimens with a cylinder-shaped cavity of a diameter of 20 mm and a height of 30 mm (4 specimens for a series of castable) were made. The specimens were dried at the temperature of 110°C and fired at the temperature of 1100 °C. After adding 9 g K2CO3 into the cylinder-shaped cavity, the specimens were fired at the temperature of 1100 °C for 5 h. The cavity was covered with another specimen (70 × 70 × 20 mm). After multiple tests (upon adding 9 g K2CO3 for each test), the specimens were inspected visually and an appearance of microcracks in them was registered. For SEM/EDS analysis of the affected zones of the castable, a specimen of a composition identical to the specimen used for covering the cavity of the specimen was used (Figure 2, point 2). After three cycles of the test, a specimen was cut out from the said specimen; the surface of the latter was strengthened by resin and then smoothed and polished. For X-ray and mercury intrusion porosity after 3 alkali resistance cycle tests, the samples were cut from the same point 2 area (Figure 2).
A scanning electron microscopy device (SEM JEOL JSM-7600F) was used (Tokyo, Japan) for the tests. The parameters of the scanning electron microscope were as follows: voltage 10 kV, the distance to the surface of the specimen 7 to 10 mm. X-ray microanalysis was performed by the energy dispersion spectrometer (EDS) Inca Energy 350 (Oxford Instruments, Oxford, United Kingdom), using Silicon Drift type detector X-Max20. The INCA Energy software package (Oxford Instruments, Oxford, United Kingdom) was used.
For X-ray tests, the sample of the castable was crushed and sieved (sieve opening size 0.063 µm). X-ray diffraction (XRD) analysis of powder was conducted with diffractometer DRON-7 (St. Peterburg, Russia) with Cu-Kα (λ = 0.1541837 nm) radiation. The following settings were used: 30 kV voltage; 12 mA current; 2θ diffraction angle range from 4° to 60° with increment of 0.02° measured each 2 s. The phases were identified comparing the XRD images with standard diffraction patterns provided by the International Centre for Diffraction Data (ICDD).
Mercury intrusion porosimetry (MIP) method was applied to analyze the parameters of castable pore structure by means of Quantachrome Poremaster 33/60 (Quantachrome Instruments, Boynton Beach, Florida, USA) with a maximum pressure of 33,000 psi for pore diameter ranging from 1100 μm to 0.0035 μm and with two low-pressure stations plus one high-pressure station.
The interaction between the K2CO3 salt and the castable was tested by performing a thermal analysis curve of the mix K2O/castable = 1/9. Additionally, samples without GQS (CC-1′, CC-2′, MCC-1′, MCC-2′) were prepared to compare differences in mass loss at temperature up to 1000 °C. The amount of GQS was then replaced by milled chamotte BOS135 and BOS145 according to the mix (the specific surface area of milled BOS135 is 409 m2/kg and for BOS145 395 m2/kg.). Thermal analysis (DTG) was performed with a Perkin Elmer TGA 4000 (Waltham, Massachusetts, USA) thermal analyzer. The samples of the mixture with a mass of 40–50 mg were placed in a platinum crucible and heated to 1000 °C at 10 °C/min in a nitrogen environment.

3. Results

3.1. Chemical and Mineral Composition of Castables

Chemical and mineral compositions of the tested castables was determined for further evaluation of the interaction between potassium and aluminosilicate material (Table 2 and Figure 3).
Table 2 illustrates that Al2O3 content in the tested castables increases from ~34% to ~51%, and A/S increases from 0.77 to 1.26. CaO content in the MCC series castables is about 2.5 times lower than in the CC series castables due to the lower cement content in MCC compositions. The total content of CaO, Fe2O3, MgO, TiO2, P2O5, and alkali oxides reaches ~20% in the CC series castables and ~9.5% in the MCC series castables. It should be noted that these impurities act as a flux for the main components Al2O3 and SiO2 and can promote the formation of the liquid phase at high temperatures [24]; the impurities also affect the maximum temperature of using the aluminosilicate material. The 5% strain point (T5) was found to be 1290 °C for the CC-1 castable and 1300 °C for the CC-2 castable. The T5 for the MCC series castables was considerably higher: 1400 °C for MCC-1 and 1480 °C for MCC-2.
Minerals typical of aluminosilicate materials [25], such as mullite, tridymite, quartz, anorthite, gehlenite, and corundum, were identified in all castable samples after thermal treatment at a temperature of 1100 °C (Figure 3). Grossite was identified in the castables of the MCC series because this mineral is present in CAC70 cement, which was used to produce MCC (Table 1).

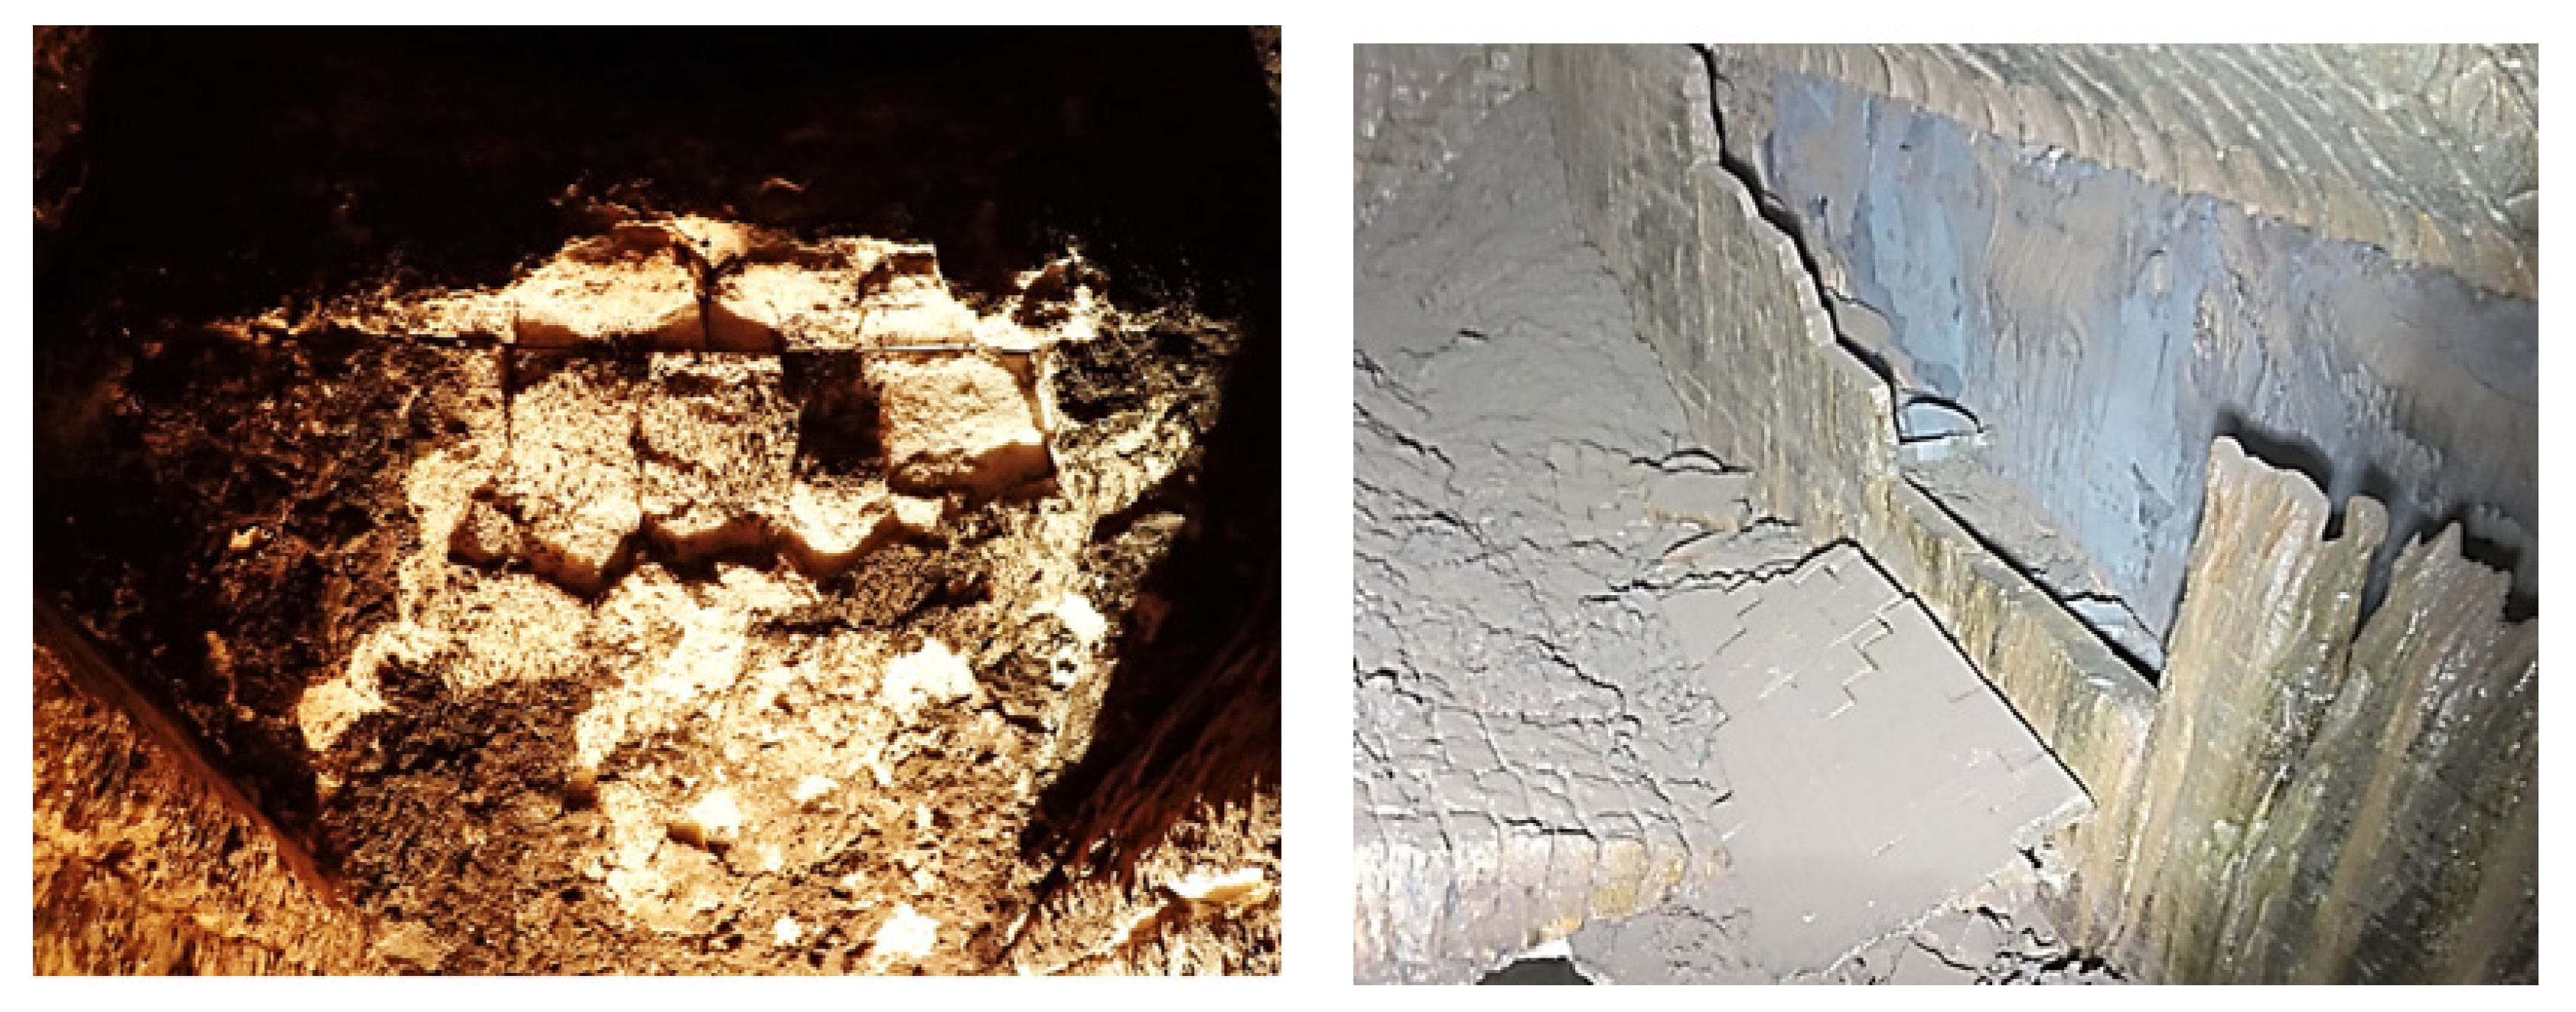
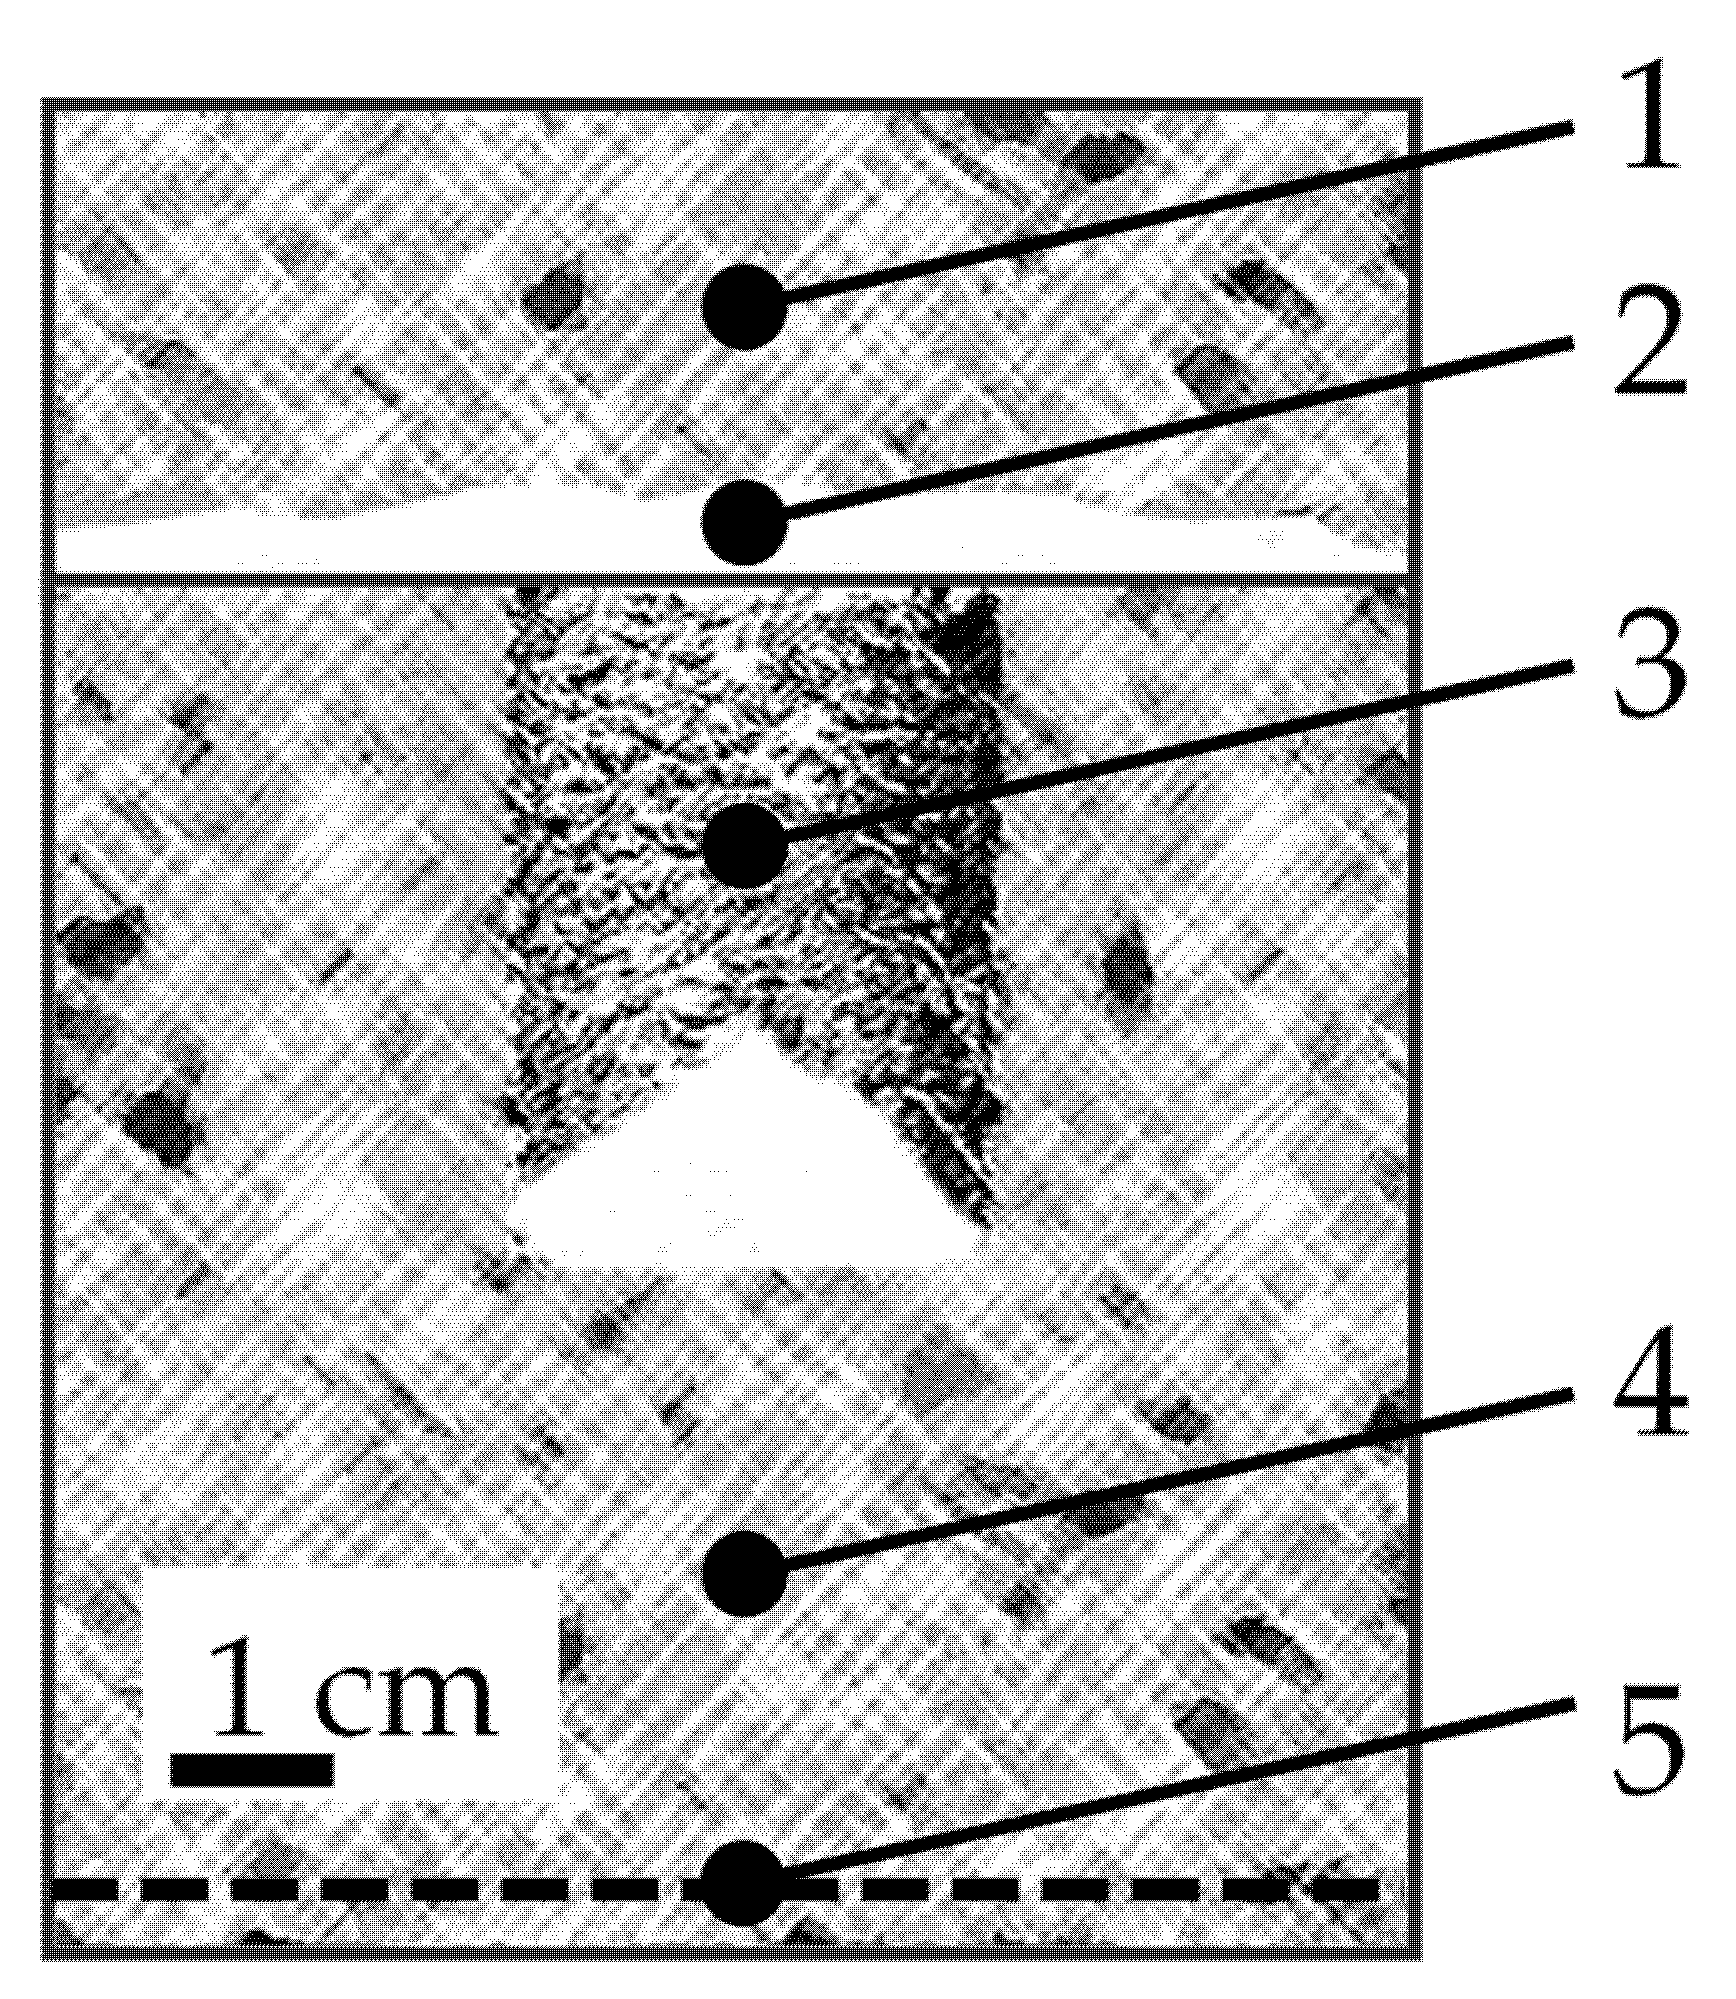
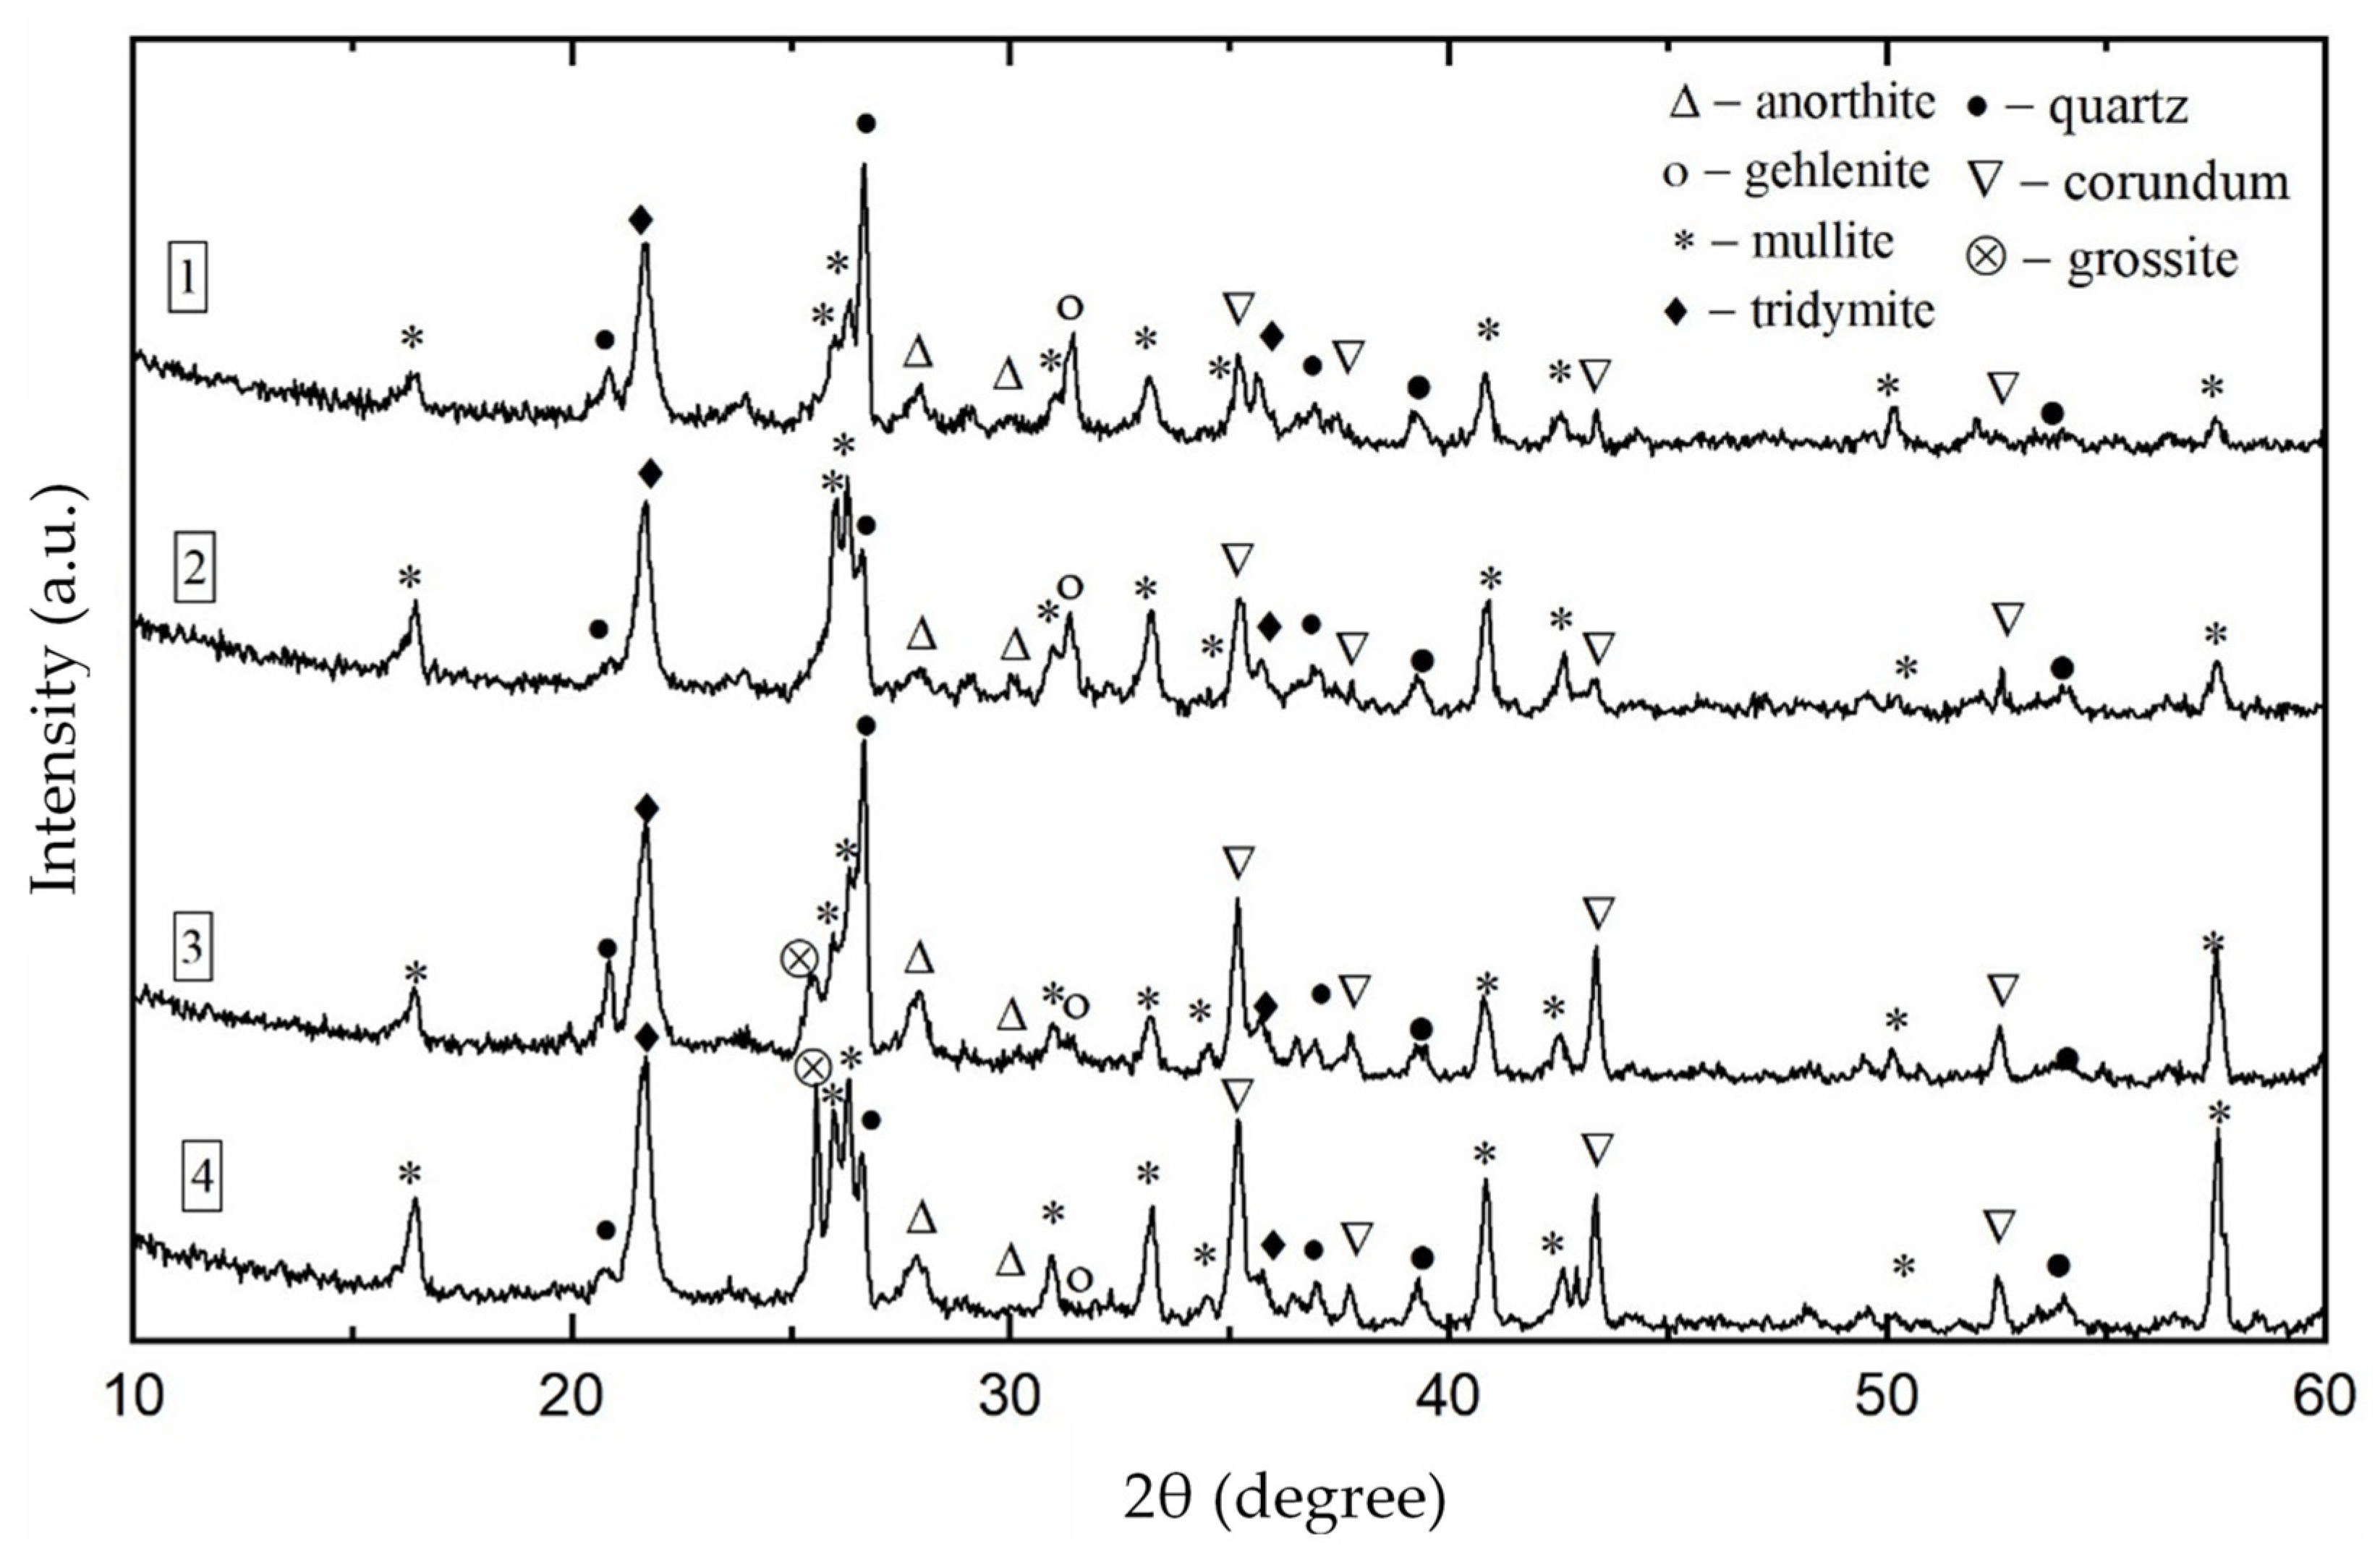
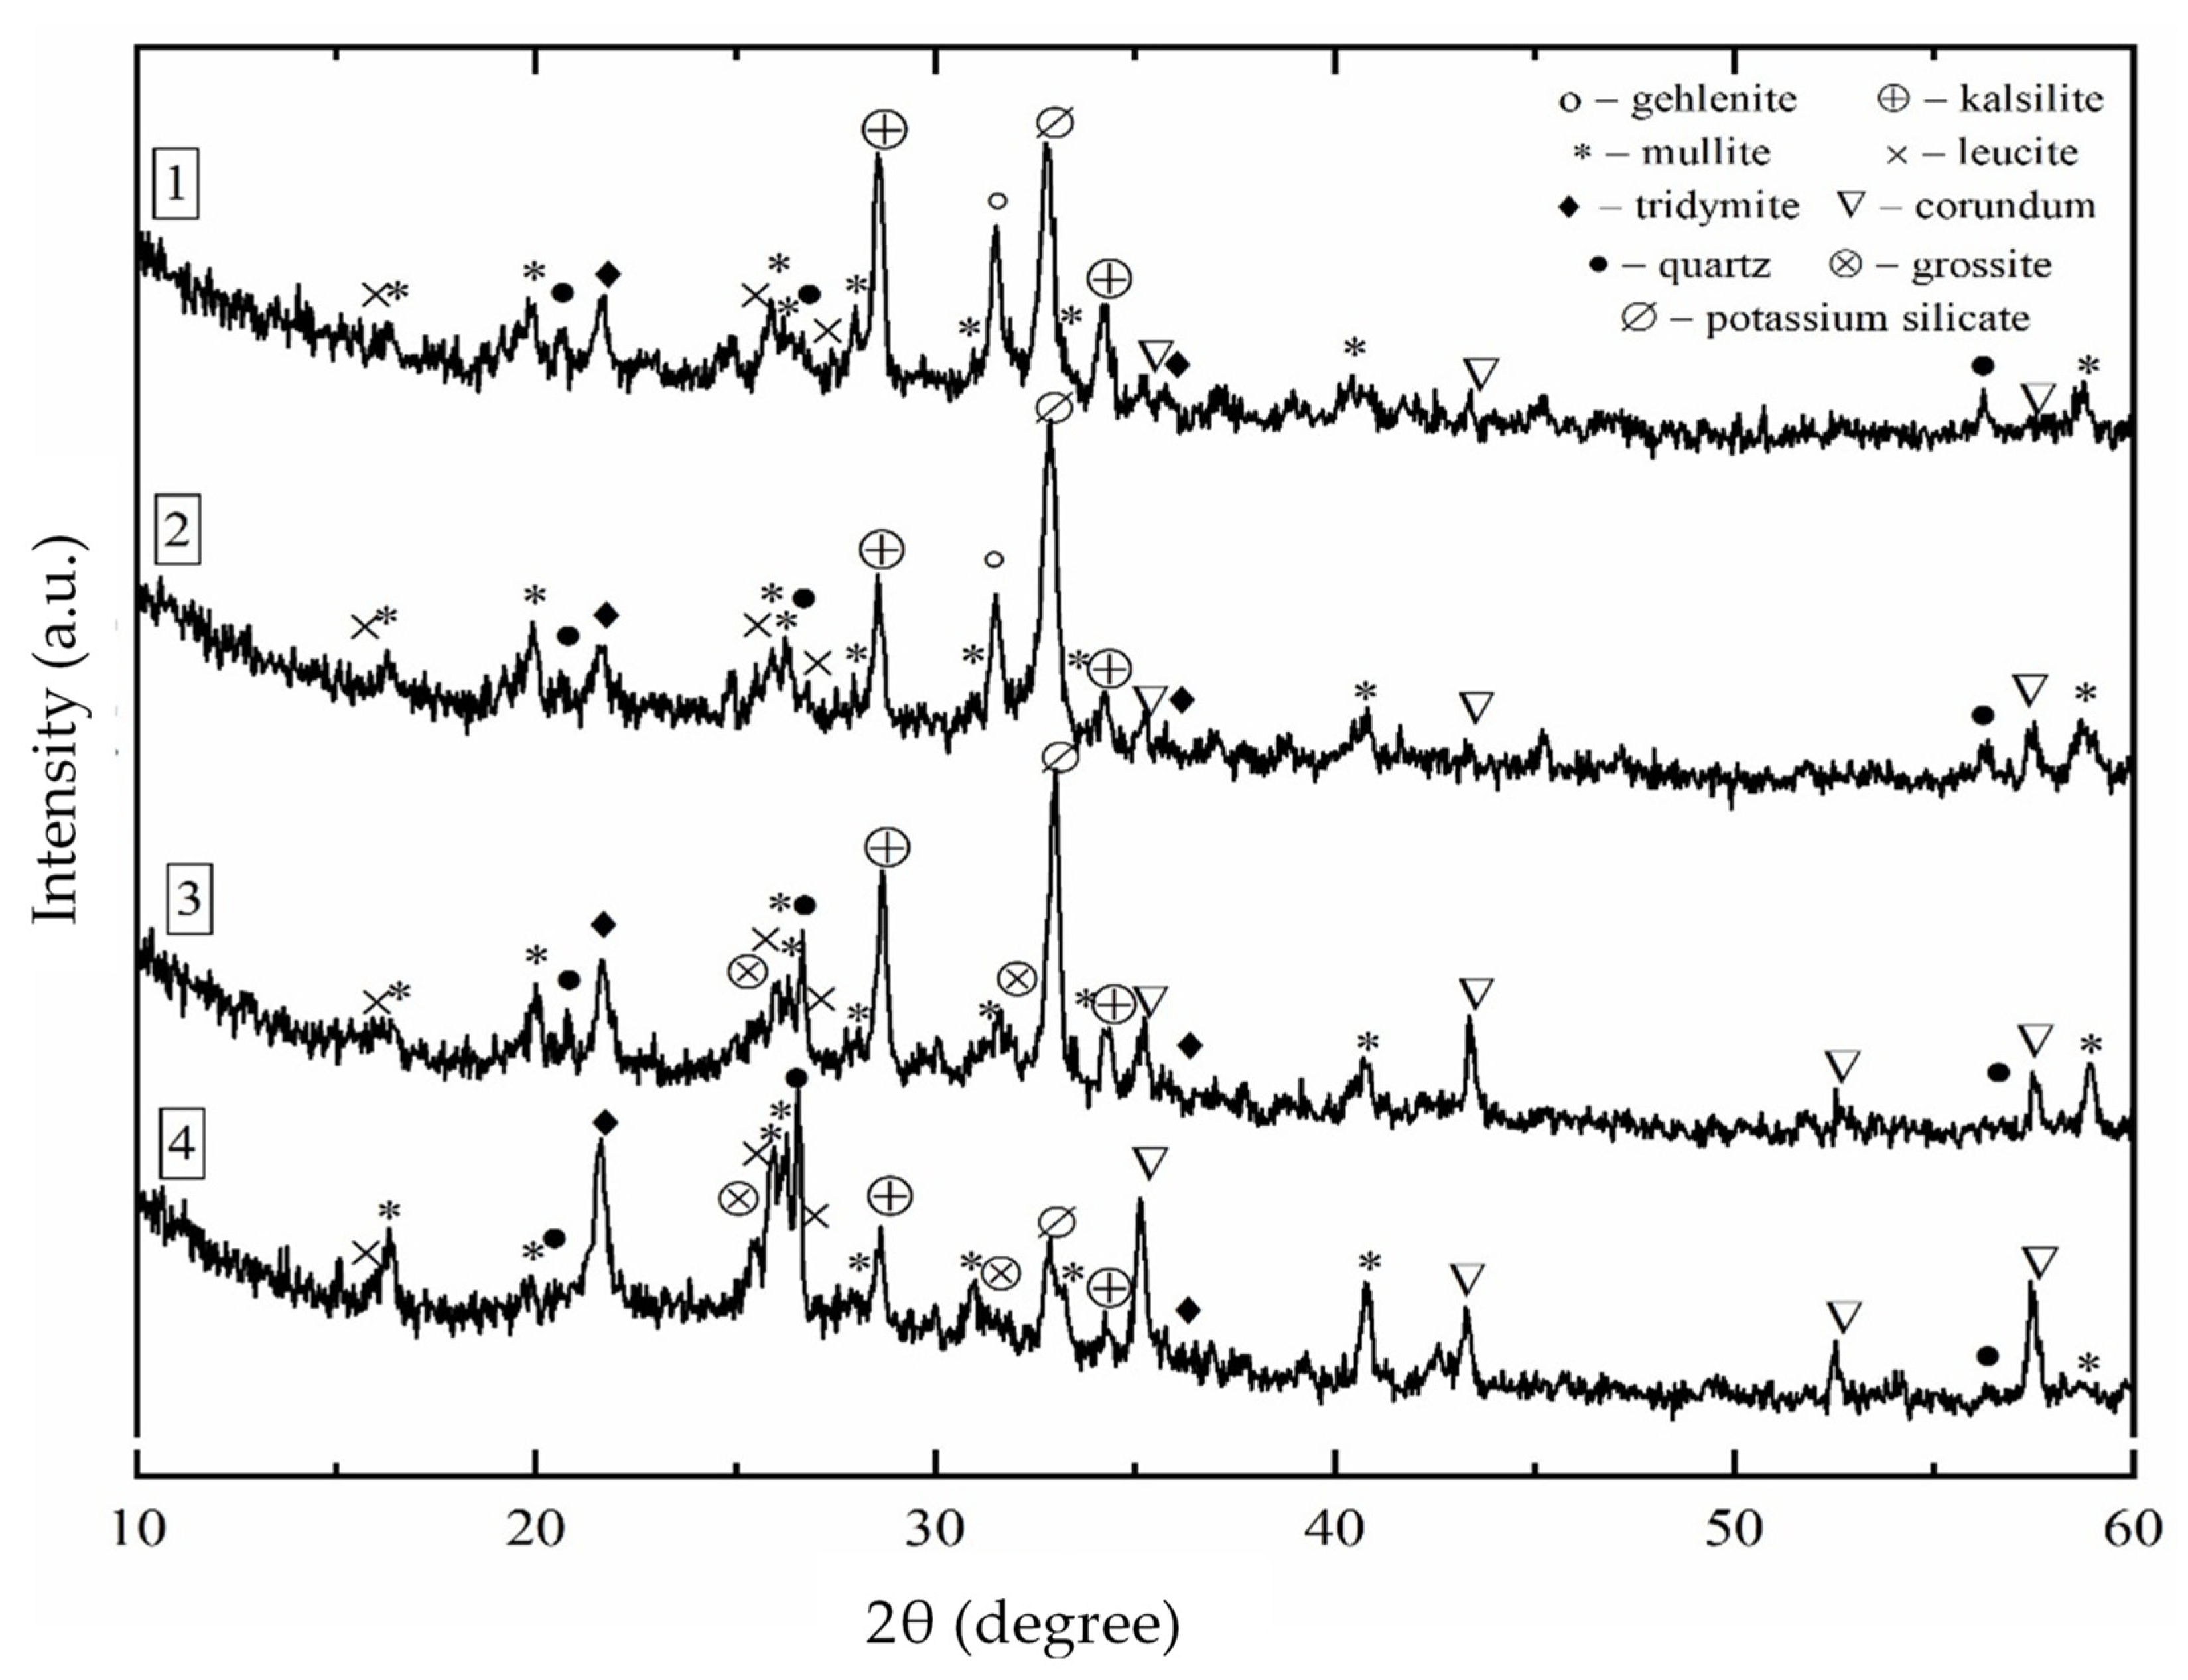
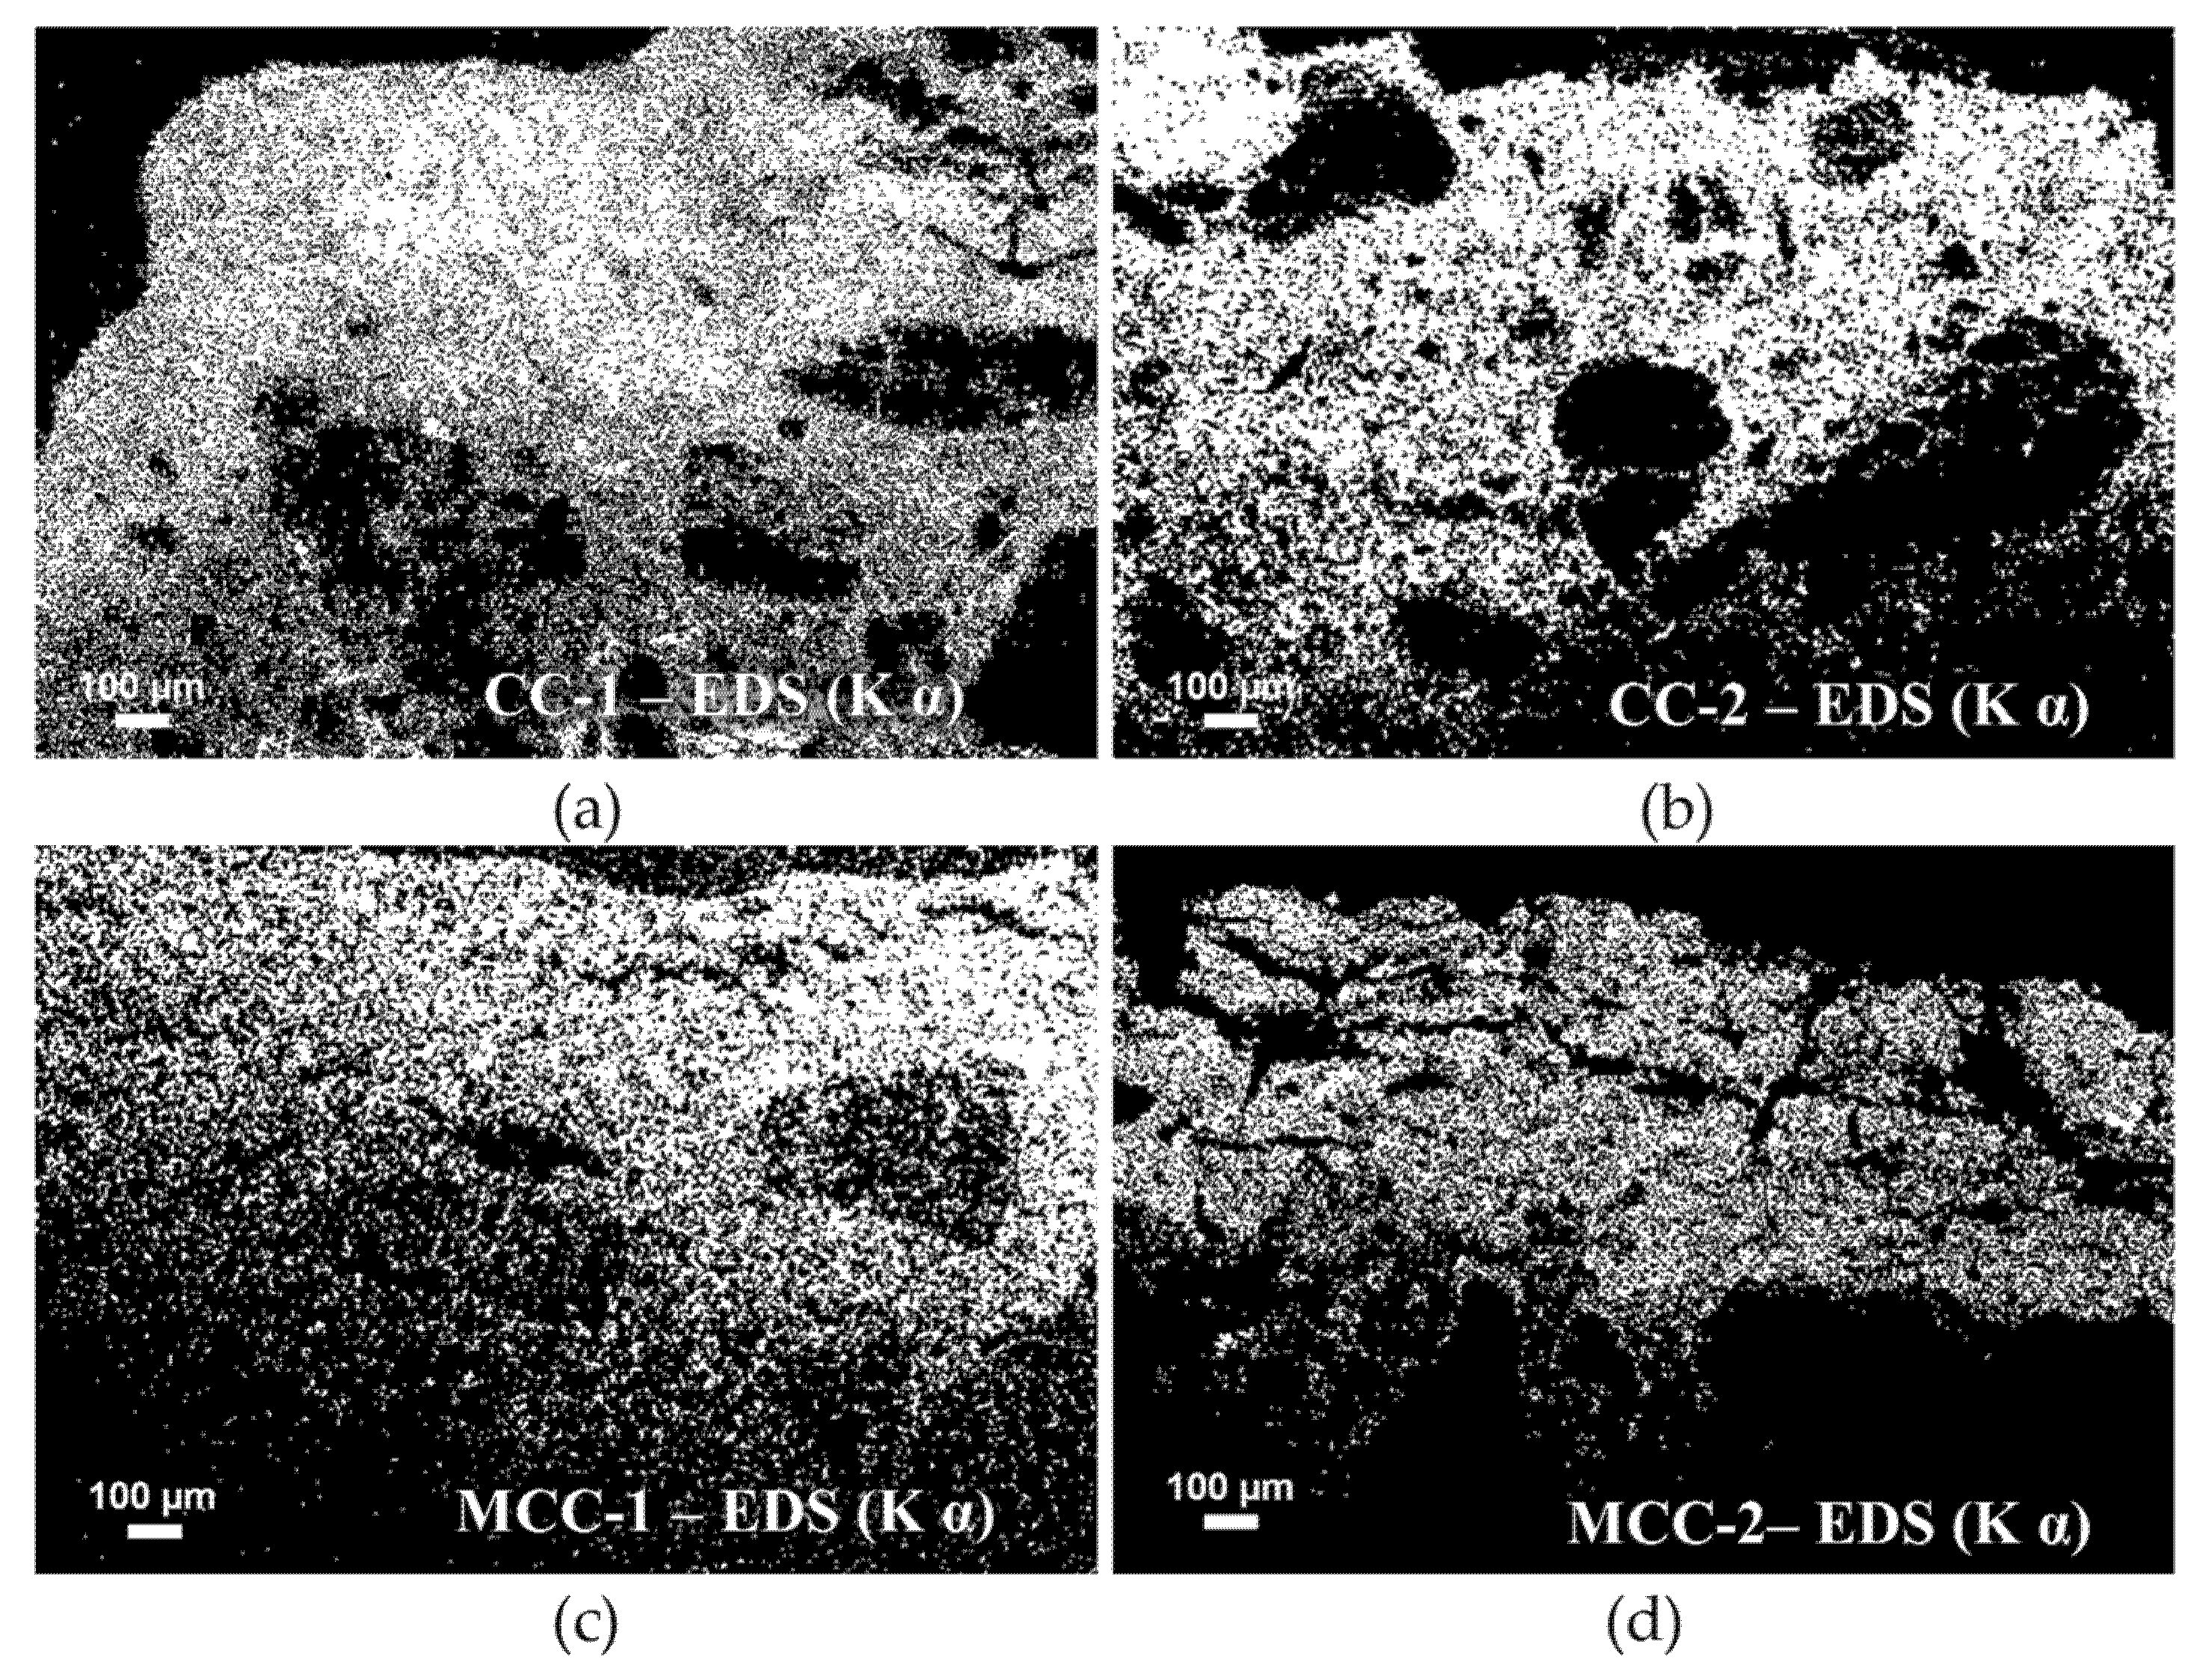
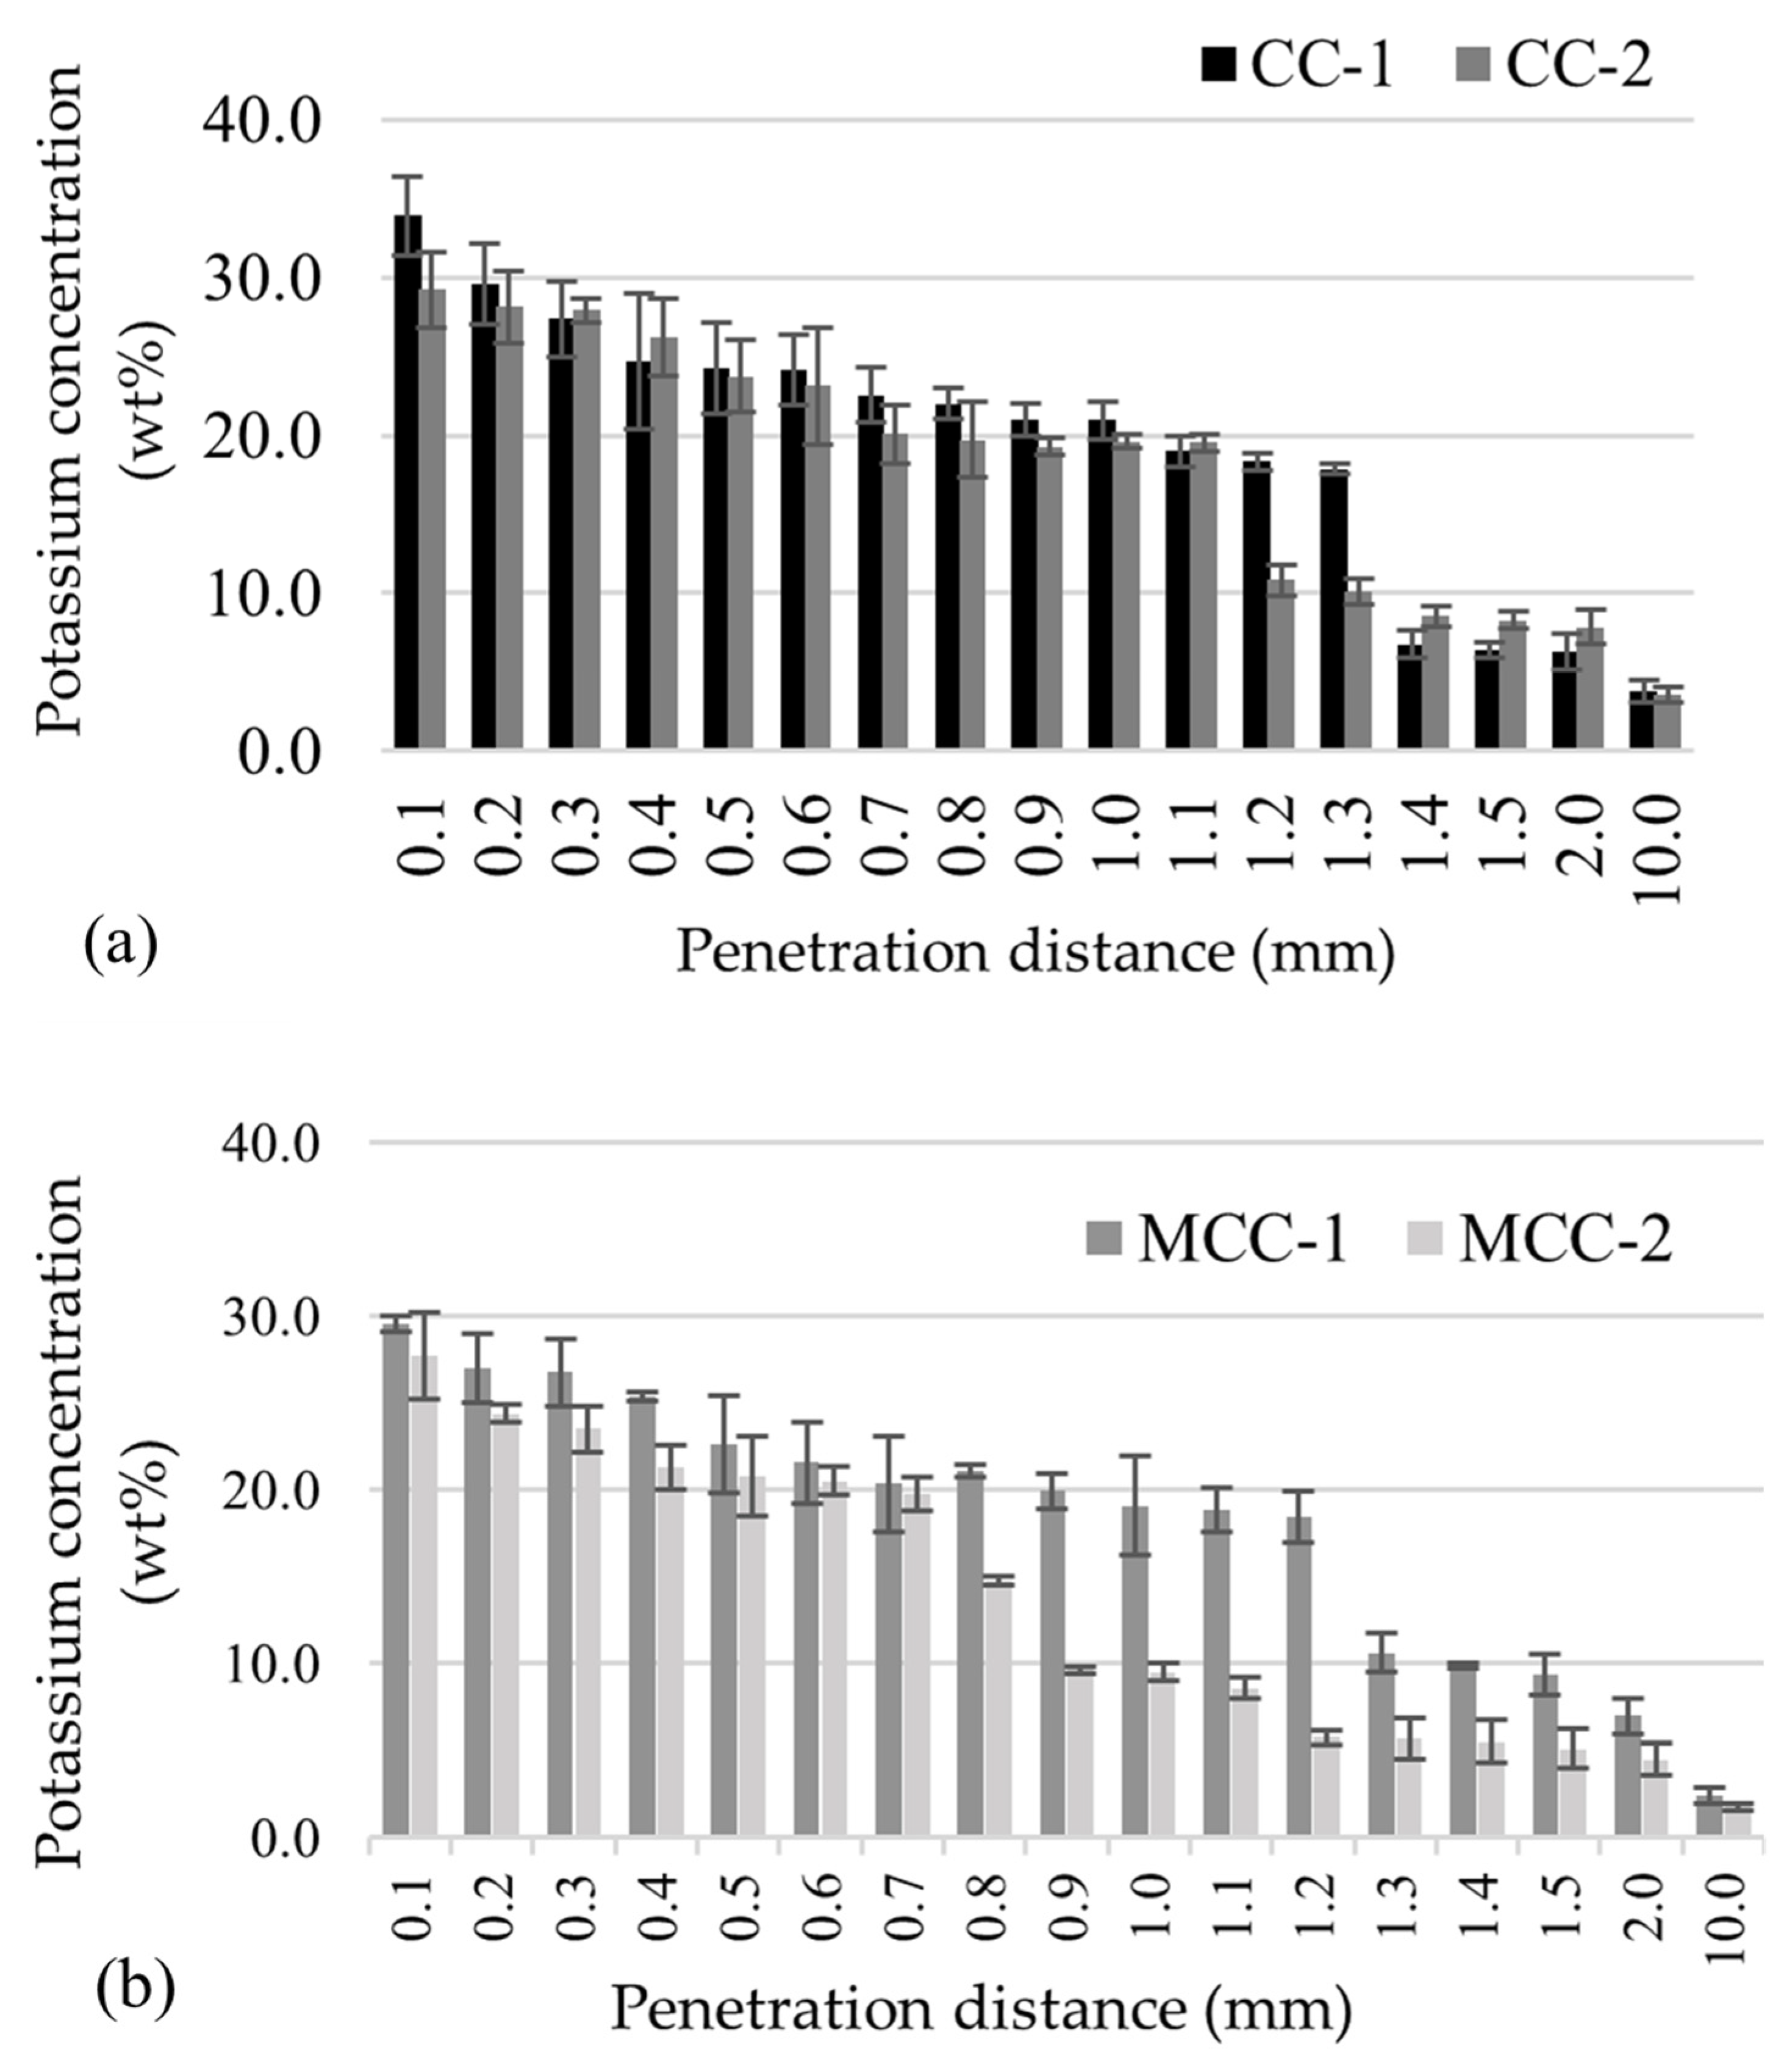
3.2. XRD, SEM, and EDS Analyses of the Surface Layer of a Castable Specimen after Three Cycles of Alkali Attack

XRD analysis of the powder from the surface layer of the castable CC and MCC series (Figure 4) revealed the presence of corrosion products in the crystalline state, i.e., potassium silicate with a low melting point (approx. 765 °C) K2Si4O9 (d = 0.271; 0.277; 0.274; 0.211; 0.312 nm), kalsilite KAlSiO4 (d = 0.312; 0.258; 0.397; 0.218; 0.435 nm), and leucite KAlSi2O6 (d = 0.327; 0.345; 0.541; 0.284; 0.292 nm). It should also be noted that the intensity of quartz peaks was significantly reduced, and anorthite peaks disappeared in the surface layer of a castable specimen after three cycles of alkali attack. Less amount of corrosion products is formed in the MCC-2 castable. The amorphous hump between about 20° and 35° 2θ (particularly pronounced in the curves for MCC-type castables (curves three and four in Figure 4) is indicative of the formation of glass in the surface layer.
Figure 5 illustrates the distribution of potassium obtained by EDS in the analyzed ~1.5 mm thick layer of the castable samples tested after three cycles of alkali attack.
The concentration of potassium is high in the surface layer of the specimen, where the protective layer has formed, with a clear decrease in the zone below (this is particularly evident in the case of the MCC-2 in Figure 5d). The formation of microcracks and low penetration of K into the aggregate particles can be observed in the protective layer of the MCC.
The detailed distribution of K (100 µm step) obtained by SEM-EDS analysis (the points recorded in the castable matrix) shows (Figure 6) that K is distributed in the protective layer of the tested castables as follows: K concentration in 300–600 µm-thick layer closest to the surface is around 25–35%, whereas the concentration in deeper layers of 1300 µm thickness in CC-1, 1100 µm thickness in CC-2, 1200 µm thickness in MCC-1, and 700 µm thickness in MCC-2 is almost the same, about 21–25%.
Table 3 provides information on the average values of the chemical elements after three cycles of alkaline resistance in the thickness of the protective layer recorded from the EDS analysis (last measurement before the significant decrease in potassium).
According to the results, the average elemental concentration reaches 21.5–24.5% for K, 0.9–4.1% for Ca, and 0.4%–0.7% for Na, depending on the composition of the castable. Average concentrations of these elements characterize to a certain extent the glass composition formed in the protective layer and can help determine the viscosity of the melt, which is important in assessing the stability of the layer at high temperatures.

3.3. Porosity Tests

Porosity of the material and its parameters can also influence the parameters of the protective layer in addition to the chemical composition of the material. The determined average open porosity of castables varied depending on the type of castable and the aggregate used: 24.0% and 22.2% for CC-1 and CC-2, respectively, and 20.3% and 19.1% for MCC-1 and MCC-2.
The pore size distribution of all castable compositions was found to follow the Gaussian curve (Figure 7). The maximum pore size goes up to 1 mm. The average pore size of CC-1, CC-2, MCC-1, and MCC-2 not affected by K2CO3 was 1.22 µm, 1.38 µm, 0.83 µm, and 0.77 µm, respectively. Figure 7 illustrates that the MCC series not only has a lower open porosity but also has the smallest pore size.
Porosity reduced when the refractory castable was exposed to K2CO3 (Figure 7, CC-1*, CC-2*, MCC-1*, MCC-2*) as the resulting liquid phase filled in some of the open pores. The maximum log differential intrusion reduced 67%, 53%, 59%, and 35%, respectively. The maximum change in the pore volume was recorded in 1µm pores. The volume of pores smaller than 1 µm in MCC remained unchanged due to the high viscosity of the resulting liquid phase [26].
Higher amounts of Al2O3 + SiO2 (about 27% for CC and 33% for MCC) were found in the cooled glass layer of MCC, leading to increased viscosity of the liquid phase [27] and preventing the filling of the finest pores. The increase in viscosity is strongly influenced by the addition of crystalline SiO2, which slows down the reaction with K2CO3 [28]. The presence of larger pores (>10 µm) or capillaries in the affected castable can increase due to the cycles of alkaline attack, whereby the penetration of potassium can dissolve the surface layer of the castable by forming a structure of interlocking pores and capillaries. The increase in the number of larger pores could also be explained by the devitrification [29] of the corrosion products formed, in particular K2Si4O9, by cyclic heating and cooling of the material.

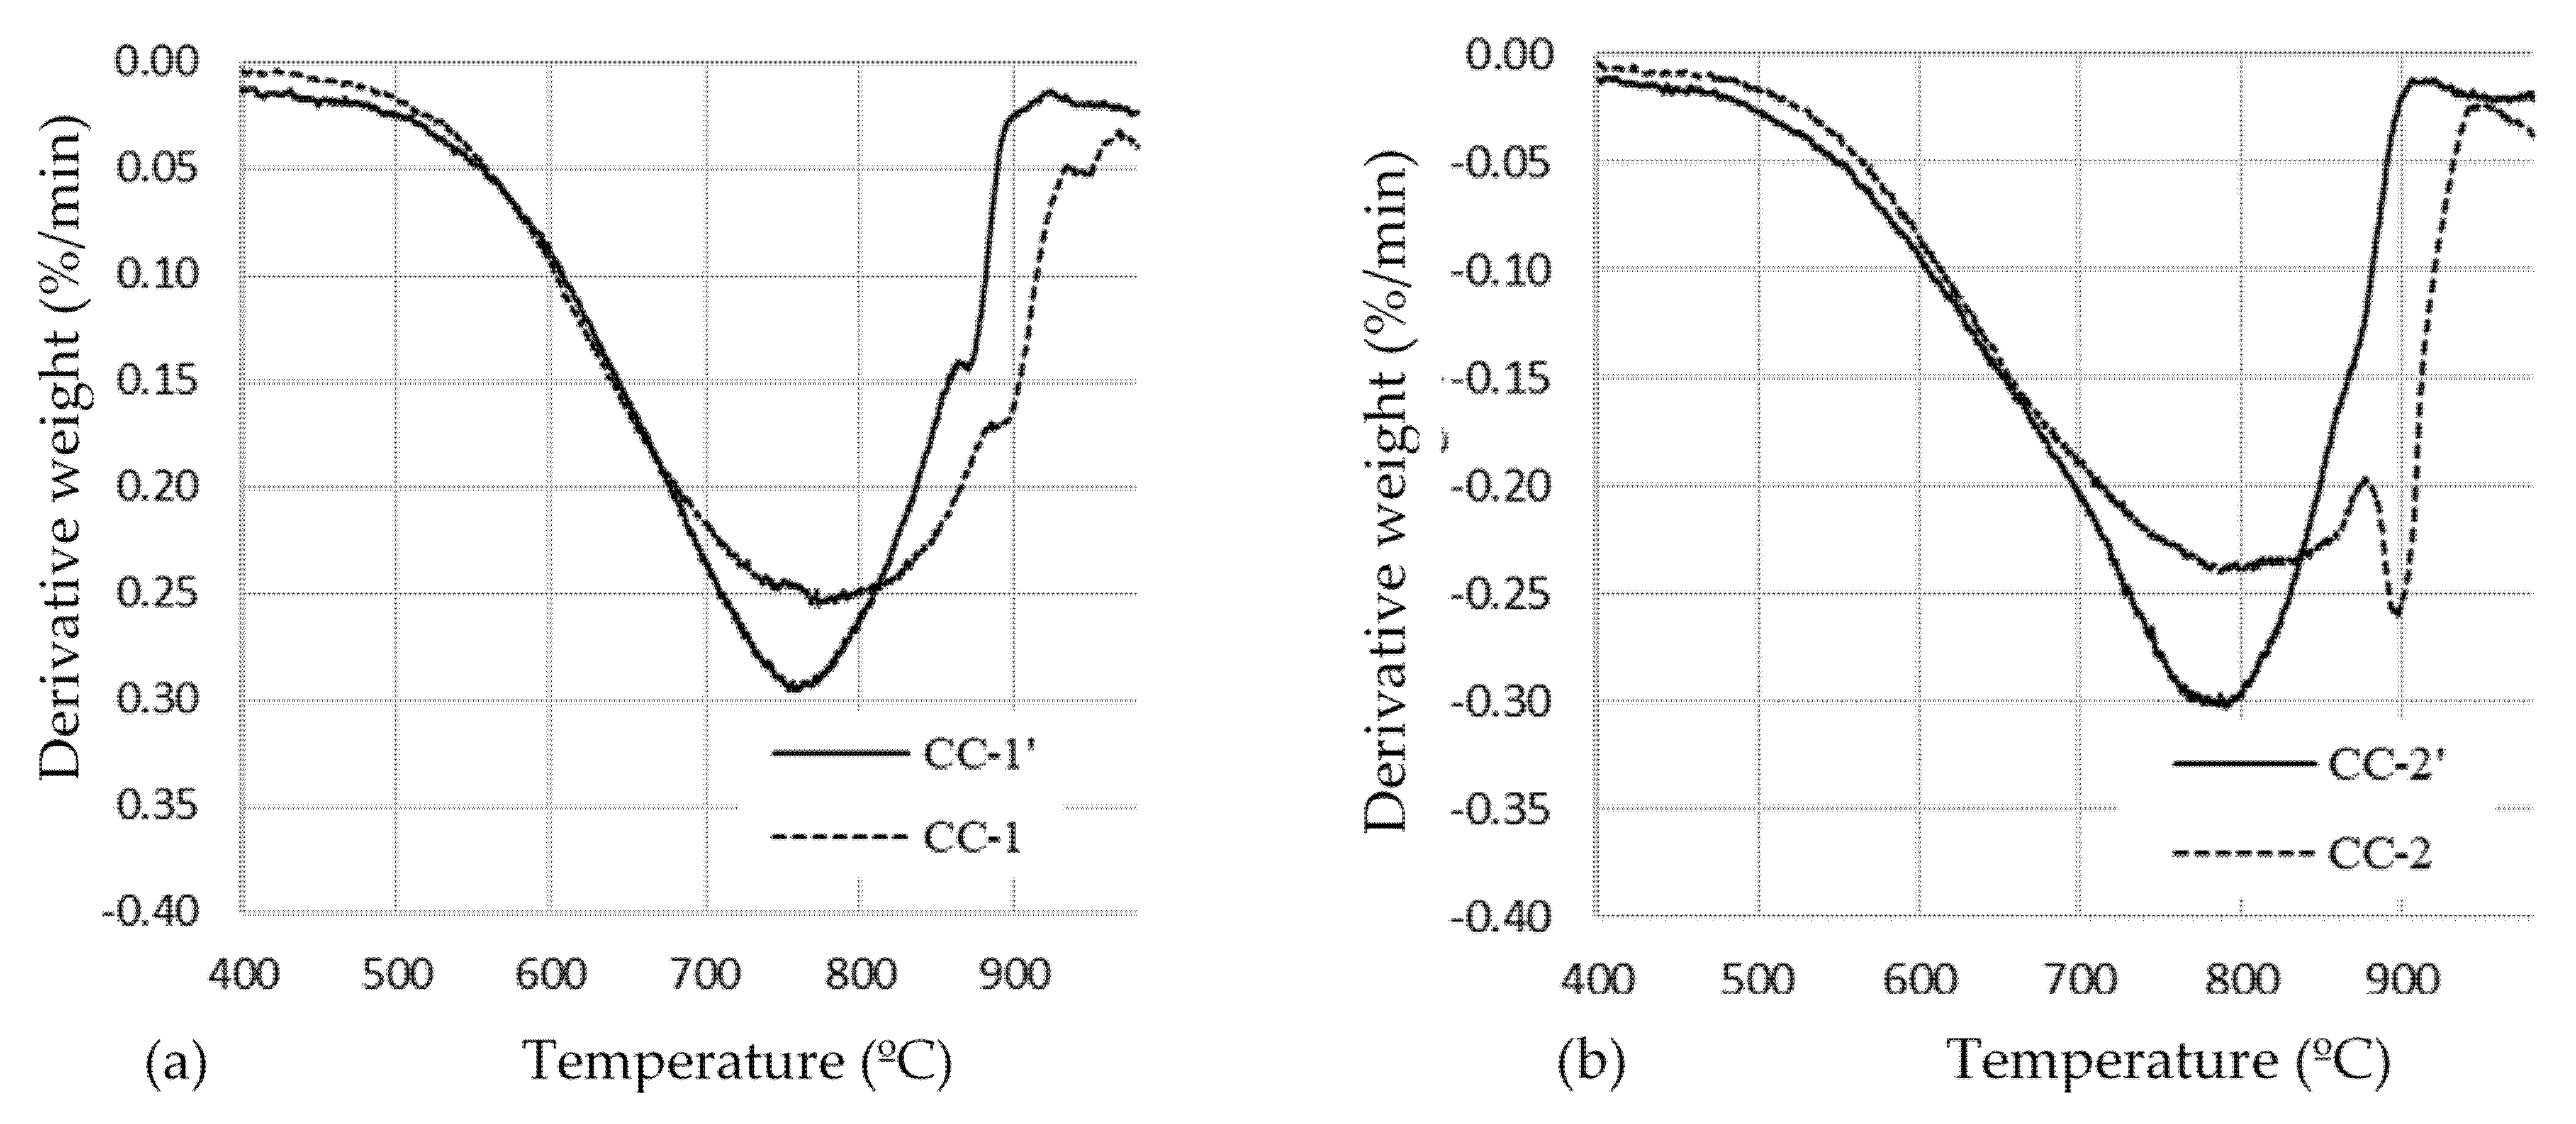
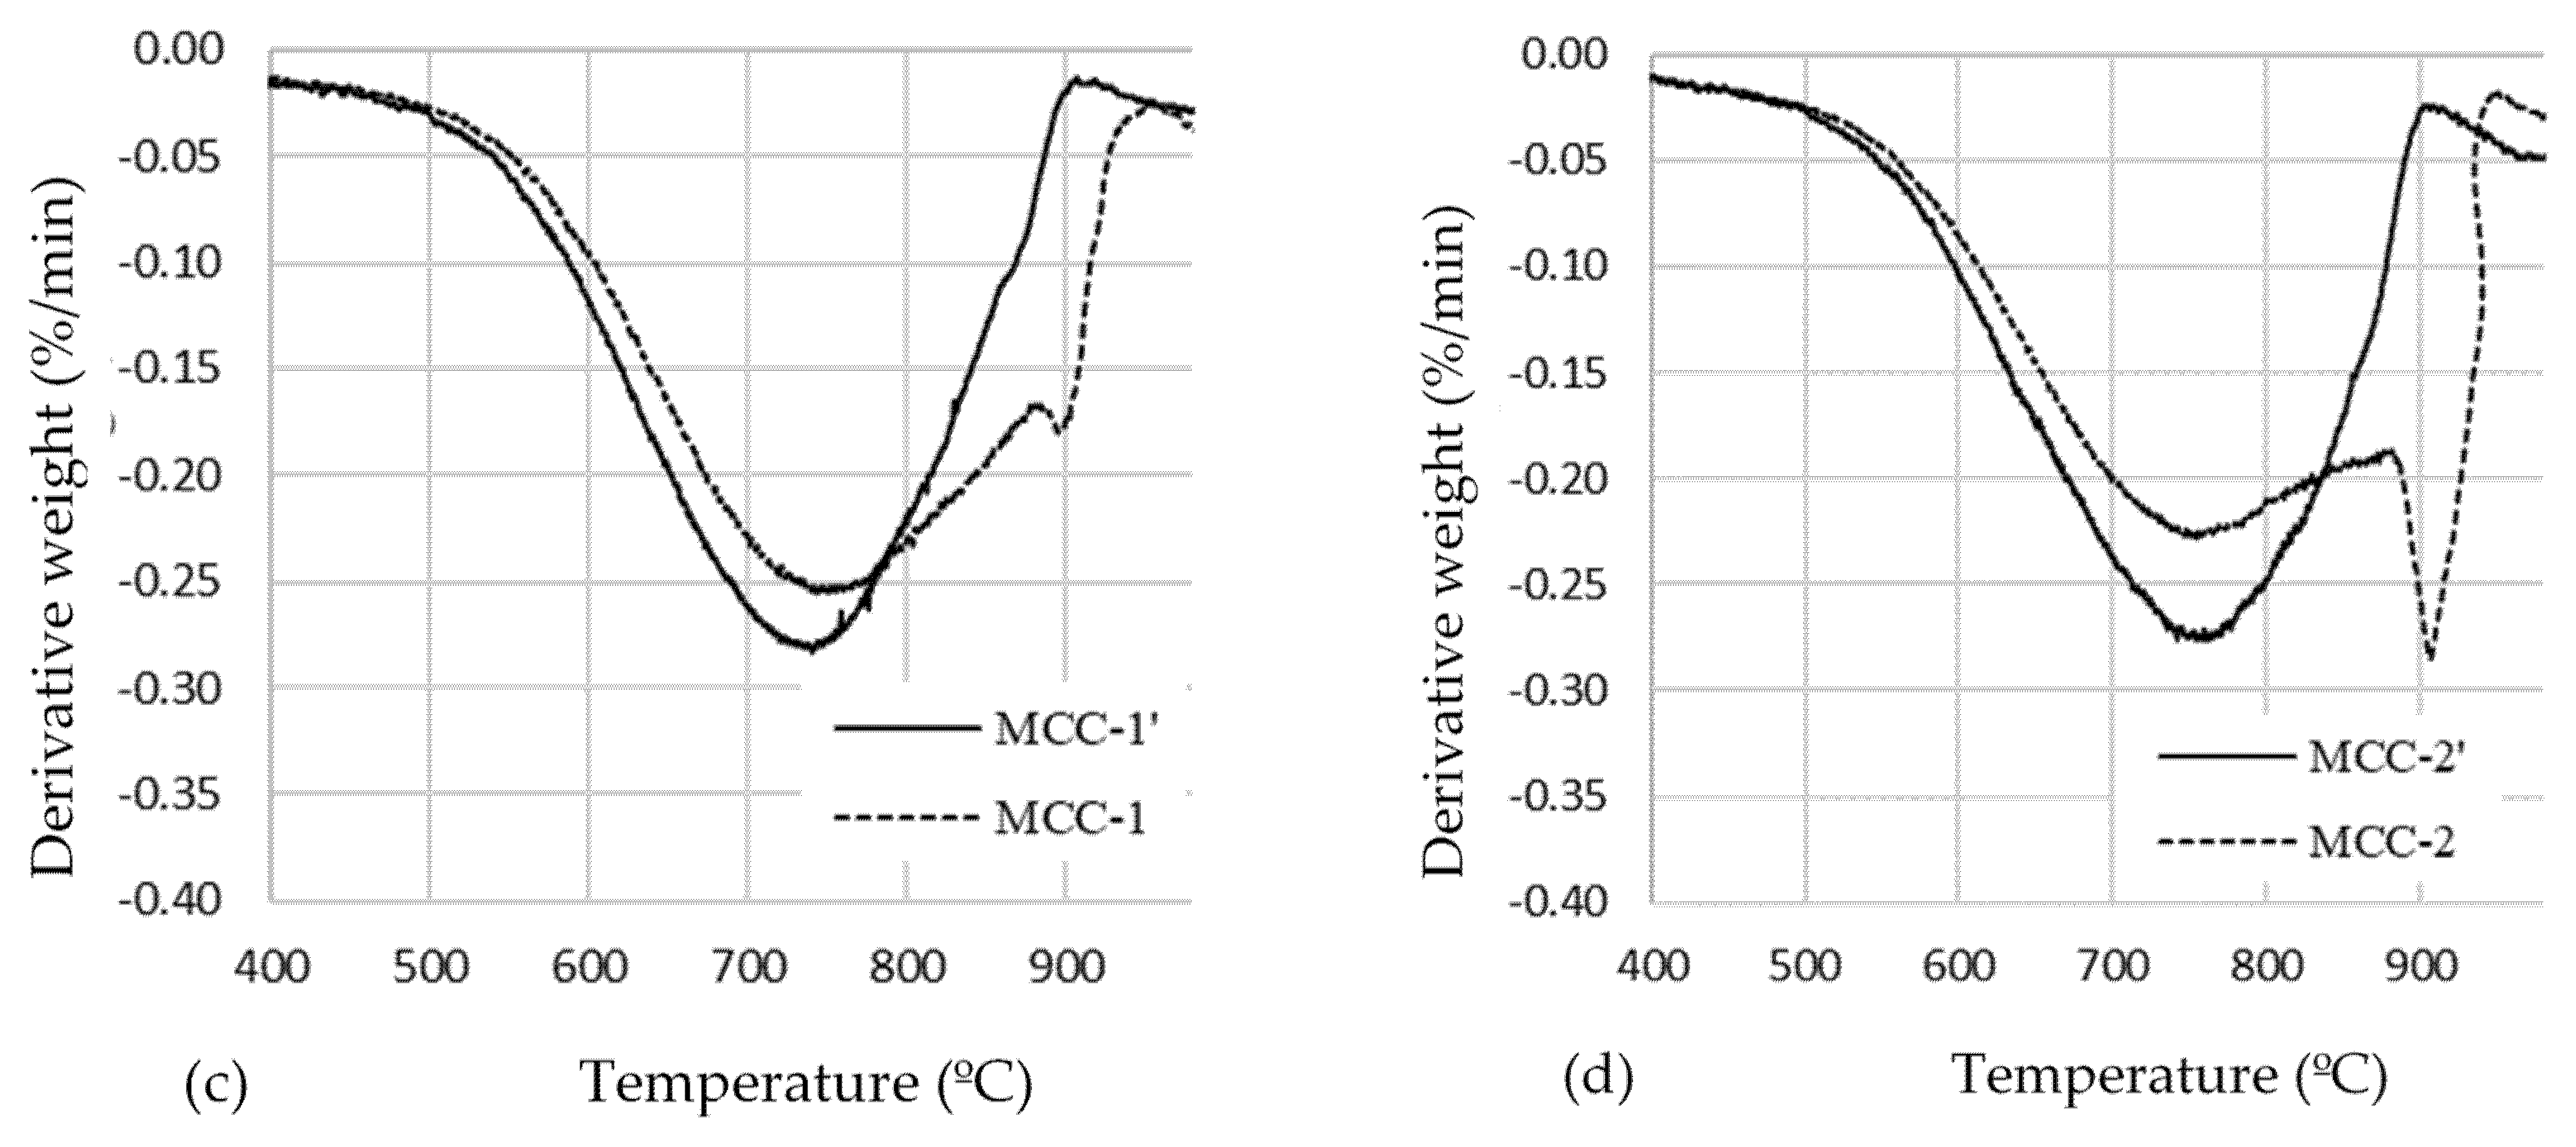
3.4. DTG Test Results of Mix of K2CO3 and Castable Powder

DTG analysis was carried out for comparison of the processes that are taking place at high temperatures in the castables with and without GQS. It was determined [20,21] that in samples without GQS, the protective layer does not form.
A broad stage of the mass loss in the temperature range 500–880 °C was observed in the DTG curves of all castable mixtures (Figure 8). It is related to the decomposition of K2CO3 and the release of CO2. Free potassium reacts in the same temperature range with free SiO2 present in the castables tested to form potassium silicate. Other authors [30,31,32] report and describe a similar process in different mixtures of materials containing K2CO3 and SiO2 (ash, sludge, pyrophyllite).
Lower mass loss was recorded in castables with GQS (CC and MCC) in the 500–880 °C temperature range, when the reaction between potassium carbonate and SiO2 takes place (Table 4, Figure 8) compared to the specimens without GQS (CC’ and MCC’). Moreover, a second stage of the mass loss was observed in the castables with GQS with the peak at 890 °C. This stage is related to the release of CO2 when the melting point of K2CO3 is reached [33]. The mass loss recorded in castable mixtures with a formed protective layer recorded in the temperature range 880–950 °C is 4–5 times higher (Table 4) compared to the mixtures without it (CC’ and MCC’). This stage is particularly pronounced in the CC-2 and MCC-2, which have a lower SiO2 content (Table 2).

4. Discussion

The liquid phase is formed in the tested aluminosilicate castables without ground quartz sand by the decomposition of the reactant (potassium carbonate) on the surface of the castable specimens and by the reaction of the potassium released with the glass phases in the material [14,34], which are enriched in SiO2 and Al2O3. Such phases form at a temperature below 850 °C [4]. It was established [35] that the viscosity of the molten alkali silicates decreases at 1100–1400 °C when the K concentration increases. In our case, when K concentration during alkali tests increases due to repeated addition of K2CO3, the formed liquid phase penetrates easily into the structure of the material, regardless of the open porosity of the castables tested, and mixes with new portions of the glass phases of the material, in a manner similar to the corrosion mechanism described in the paper of [36]. The zones of altered structure develop in the specimens that cause disintegration due to the stresses between the zones of the original and the altered structure [37].
The addition of a relatively small amount (2.5%) of ground quartz sand influences the formation of a protective layer on the surface of the castable and thus makes it difficult for potassium to penetrate, regardless of the castable type, its chemical composition, and porosity. As shown, the characteristics of the tested castables vary over a wide range (Table 1), as well as the open porosity varies from ~19% to ~24% and the chemical composition was also different, taking into account the different A/S and the amounts of various impurities in them (Table 2). It appears that the GQS admixture can be a versatile tool for increasing the alkali resistance of a wide range of aluminosilicate castables.
The additional quartz content in the castable reduces the degree of K2CO3 dissolution in the 500–880 °C temperature range, as shown by the reduced mass loss obtained for the dry mixture of CC or MCC powder and K2CO3 mixtures (Figure 8). In this case, the released K at the surface of the castable reacts with the silica added to the castable to form a viscous potassium silicate glass [18,35], which effectively reduces the chemical mobility of K. The viscous glass is not able to penetrate the structure of the aluminosilicate material, and the castable specimens withstand alkali attack. Similarly, the authors of paper [36] explain the formation of viscous glass by the arrested penetration of liquid slag Al2O3-CaO into the andalusite-based refractory.
The protective layer resulting from the reaction during three cycles of alkaline attack and impeding the penetration of K into the castable structure had a thickness between 700µm and 1300µm, depending on the castable type. The formation of crystalline potassium silicates and potassium alumina silicates was observed in the cooled specimens of all castables with a decrease in the intensity of the quartz peaks and an almost complete disappearance of anorthite.
The distribution of K, Si, and Al in the protective layer indicates that the equilibrium in local scale is achieved in this layer at high temperatures, where the solid phases are in the local equilibrium with the surrounding fluid, similar to the results of the work [36]. Average concentrations of these elements (Table 3) characterize to some extent the glass formed in the protective layer, depending on the type of castable. Al2O3, which is set in the protective layer, can influence the viscous glass melting temperature and its viscosity and then, according to the authors [38], the melting temperature and viscosity values tend to increase. Differences in chemical and phase composition in the protective layer affect its stability. Therefore, when operating under constant or cyclic chemical loading, the durability of different castables will be different.
Castable porosity tests after three cycles of alkali attack showed that the liquid phase formed in the protective layer filled some of the open pores. The number of pores smaller than 1µm in the MCC series remained almost unchanged. In the CC series, the pores were filled with the liquid phase, presumably as a result of the dissolution of the pore walls by the liquid at high temperature. This was influenced by the high content of impurities in these castables (Table 2, ~20%).
The formation of microcracks was observed by SEM and MIP in the protective layer followed by high volumetric expansion due to the formation of kalsilite and leucite [15]. This expansion can have an impact on the stability of the protective layer under thermal cycling, and deeper penetration of K is possible as well.

5. Conclusions

The mechanism of the protective layer formation under the action of an alkali in refractory castable when ground quartz sand is used as an admixture to produce refractory conventional and medium cement castables was analyzed.
The characteristics of these castables (A/S, open porosity, etc.) that may influence the penetration of alkalis vary over a fairly wide range. It was found that the addition of ground quartz sand (2.5%) forms a protective layer on the surface of the castable, regardless of the castable type. The thickness of the protective layer after three cycles of the alkaline corrosion test reaches ~700–~1300 µm depending on the type of castable
The amorphous phase in the protective layer increased compared to the castable not exposed to alkali attack, and the following alkali corrosion products were identified in the crystalline state: kalsilite, leucite, and potassium silicate. Potassium silicate and the additional amorphous phase are formed due to the reaction between potassium and quartz sand. The resulting viscous glass fills the pores and capillaries of the material, forming a protective layer which makes it difficult for potassium to penetrate into the deeper layers of the material.
The addition of ground quartz sand reduces the degree of K2CO3 dissolution in the 500–880 °C temperature range, and the released potassium at the surface of the castable reacts with the silica and forms a viscous potassium silicate glass, which reduces the mobility of potassium.
Porosity tests after three cycles of the alkaline corrosion test showed that the liquid phase formed in the protective layer filled some of the open pores. The number of pores smaller than 1µm did not change in the MCC, whereas in the CC the pores were filled with the liquid phase.
On the basis of research results, it can be assumed that quartz admixture can be a versatile tool for increasing the alkali resistance of a wide range of aluminosilicate castables.

Author Contributions

Conceptualization, V.A.; methodology, R.B. and J.M.; software, P.Z.; validation, V.A., R.B. and J.M.; formal analysis, V.A.; investigation, R.B. and J.M.; resources, V.A. and J.M.; data curation, J.M. and R.B.; writing—original draft preparation, V.A., J.M. and R.B.; writing—review and editing, V.A.; R.S. and R.M.; visualization, V.A., J.M. and R.B.; supervision, V.A.; project administration, V.A.; funding acquisition, V.A. All authors have read and agreed to the published version of the manuscript.

Funding

This research received funding from the Research Council of Lithuania (LMTLT), agreement no. S-MIP-19-41.

Institutional Review Board Statement

Not applicable.

Informed Consent Statement

Not applicable.

Data Availability Statement

Not applicable.

Conflicts of Interest

The authors declare no conflict of interest.

References

  1. Baxter, L.L.; Miles, T.R.; Miles, T.R., Jr.; Jenkins, B.M.; Milne, T.; Dayton, D.; Bryers, R.W.; Oden, L.L. The behavior of inorganic material in biomass-fired power boilers: Field and laboratory experiencies. Fuel Proc. Techn. 1998, 54, 47–78. [Google Scholar] [CrossRef]
  2. Jenkins, B.M.; Baxter, L.L.; Miles, T.R., Jr.; Miles, T.R. Combustion properties of biomass. Fuel Proc. Techn. 1998, 54, 17–46. [Google Scholar] [CrossRef]
  3. Zevenhoven–Onderwater, M.; Backman, R.; Skrifvars, B.J.; Hupa, M. The ash chemistry in fluidised bed gasification of biomass fuels. Part I: Predicting the chemistry of melting ashes and ash–bed material interaction. Fuel First 2001, 80, 1489–1502. Available online: http://users.abo.fi/mzevenho/portfolj/publikationer/refereed%20papers/Fuel%202001b.pdf (accessed on 15 January 2022). [CrossRef]
  4. Klinger, W.; Weber, W.; Zimmermann, H. Application concepts of shaped and unshaped refractories for combustion plants. In Proceedings of the Unified International Technical Conference on Refractories (UNITECR), Dresden, Germany, 18–21 September 2007; pp. 440–443. [Google Scholar]
  5. Antonovič, V.; Szczerba, J.; Kerienė, J.; Stonys, R.; Boris, R. Refractory materials for biofuel boilers. In Frontiers in Bioenergy and Biofuels; Jacob-Lopes, E., Zepka, L.Q., Eds.; InTech: Rijeka, Croatia, 2017; pp. 443–464. [Google Scholar]
  6. Mahapatra, M.K. Review of corrosion of refractory in gaseous environment. Int. J. Appl. Ceram. Technol. 2020, 17, 606–615. [Google Scholar] [CrossRef]
  7. Tassot, P.; Webb-Janich, M.; Hawecker, M. New refractory solutions for the cement industry. In Proceedings of the Unified International Technical Conference on Refractories (UNITECR), Osaka, Japan, 19–22 October 2003; pp. 35–38. [Google Scholar]
  8. Schlegel, E. Evaluation of phase diagrams with regard to the alkali corrosion of refractories. In Proceedings of the XVIth International Conference on Refractories, Prague, Czech Republic, 14–15 May 2008; pp. 23–30. [Google Scholar]
  9. Stjernberg, J.; Olivas-Ogaz, M.A.; Antti, M.L.; Ion, J.C.; Lindblom, B. Laboratory scale study of the degradation of mullite/corundum refractories by reaction with alkali–doped deposit materials. Ceram. Int. 2013, 39, 791–800. [Google Scholar] [CrossRef]
  10. Madej, D.; Szczerba, J. Fundamental investigations on the high temperature corrosion of ZrSiO4–containing andalusite refractories in cement kiln preheater. J. Eur. Ceram. Soc. 2016, 36, 875–883. [Google Scholar] [CrossRef]
  11. Li, N.; Vainio, E.; Hupa, L.; Hupa, M.; Zabetta, E.C. Interaction of high Al2O3 refractories with alkaline salts containing potassium and sodium in biomass and waste combustion. Energy Fuels 2018, 32, 12971–12980. [Google Scholar] [CrossRef]
  12. Carlborg, M.; Boström, D.; Öhman, M.; Backman, R. Reactions between ash and ceramic lining in entrained flow gasification of wood–exposure studies and thermodynamic considerations. In Proceedings of the 21 European Biomass Conference and Exhibition, Copenhagen, Denmark, 3–7 June 2013; pp. 446–449. [Google Scholar]
  13. Brosnan, D.A. Corrosion of refractories: Chapter 3. In Refractories Handbook; USA CRC Press, Taylor and Francis Group: Boca Raton, FL, USA, 2004; pp. 79–108. [Google Scholar]
  14. Scudeller, L.A.M.; Longo, E.; Varela, J.A. Potassium Vapor Attack in Refractories of the Alumina–Silica System. J. Am. Ceram. Soc. 1990, 73, 1413–1416. [Google Scholar] [CrossRef]
  15. Poirier, J.; Rigaud, M. Corrosion of Refractories: The Fundamentals; FIRE Compendium Series 2A; Goller Verlag GmbH: Baden-Baden, Germany, 2017; 454p. [Google Scholar]
  16. Ren, B.; Sang, S.; Li, Y.; Jin, S. Correlation of pore structure and alkali vapour attack resistance of bauxite-SiC composite refractories. Ceram. Int. 2015, 41, 14674–14683. [Google Scholar] [CrossRef]
  17. Ceylantekin, R.; Aksel, C. Improvment on corrosion behaviour of MgO-spinel composite refractories by addition of ZrSiO4. J. Eur. Ceram. Soc. 2012, 32, 727–736. [Google Scholar] [CrossRef]
  18. Alibasic, E.; Oldin, J.; Kannabiran, S. Design of castables and their relevance to alkali resistance applications. In Proceedings of the 57th International Colloquium on Refractories Eurogress, Aachen, Germany, 24–25 September 2014; pp. 67–69. [Google Scholar]
  19. Goski, D.G.; Green, T.M.; Loiacona, D.J. Refractory ceramic lining selection and troubleshooting in thermal biomass operations. In Materials Challenges in Alternative and Renewable Energy II; Wicks, G., Simon, J., Zidan, R., Brigmon, R., Fischman, G., Arepalli, S., Norris, A., McCluer, M., Eds.; Wiley: Hoboken, NJ, USA, 2012. [Google Scholar] [CrossRef]
  20. Zdanevičius, P.; Antonovič, V.; Boris, R.; Stonys, R.; Šukys, R.; Witek, J. Study of modified heat–resistant concrete in relation to type of chamotte filler. Refract. Ind. Ceram. 2019, 59, 628–632. [Google Scholar] [CrossRef]
  21. Antonovič, V.; Zdanevičius, P.; Boris, R.; Stonys, R.; Witek, J. Investigation of alkali resistance of fireclay castable with silica sand additive. In Proceedings of the ICR International Colloquium on Refractories Supplier Industries Enabling Refractories Eurogress, Aachen, Germany, 25–26 September 2019; pp. 126–129. [Google Scholar]
  22. Antonovič, V.; Stonys, R.; Boris, R.; Malaiskiene, V. Effect of quartz sand on the properties and alkali resistance of refractory aluminosilicate castables. Constr. Build. Mater. 2022, 351, 128978. [Google Scholar] [CrossRef]
  23. Malaiškienė, J.; Antonovič, V.; Boris, R.; Stonys, R. Improving the physical and mechanical properties and alkali resistance of fireclay-based castables by modifying their structure with SiO2 sol. Ceram. Int. 2022, 48, 22534–22544. [Google Scholar] [CrossRef]
  24. Serry, M.A.; El-Maghraby, M.S.; Salama, S.Z. Shaped aluminosilicate refractories from Egyptian raw materials. Am. Ceram. Soc. Bull. 2006, 85, 201–206. [Google Scholar]
  25. Soltan, A.M.; Pollmann, H.; Kaden, R.; Konig, A.; El-Raoof, F.A.; Eltaher, M.; Serry, M.A. Degradation of aluminasilicate refractories: An integrated approach. J. Eur. Ceram. Soc. 2015, 35, 573–592. [Google Scholar] [CrossRef]
  26. Ouirmbach, P.; Sax, A.; Piluso, P.; Rebillat, F.; Camus, G.; Caty, O.; Poirier, J.; Bilbao, E.; Hennet, L.; Ammar, M.R.; et al. Corrosion of Refractories: Testing and Characterization Methods; Goller Verlag GmbH: Baden-Baden, Germany, 2018; 282p. [Google Scholar]
  27. Chimanski, A.; Cesar, P.F.; Fredericci, C.; Yoshimura, H.N. Evaluation of glass viscosity of dental bioceramics by the SciGlass information system. Ceram. Int. 2015, 41, 10000–10009. [Google Scholar] [CrossRef]
  28. Verweij, H.; Boom, H.; Breemer, E. Raman spectroscopic study of the reactions in a potassium carbonate-silica glass-forming batch. J. Am. Ceram. Soc. 1978, 61, 118–121. [Google Scholar] [CrossRef]
  29. Kazantseva, L.K.; Seretkin, Y.V.; Rashchenko, S.V.; Nikitin, A.I. Influence of the devitrification of the glass in porous aggregates on the resistance to alkali in cement. Glass Ceram. 2019, 76, 49–55. [Google Scholar] [CrossRef]
  30. Lehman, R.L.; Gentry, J.S.; Glumaca, N.G. Thermal stability of potassium carbonate near its melting point. Thermochim. Acta 1998, 316, 1–9. [Google Scholar] [CrossRef]
  31. Arvelakis, S.; Jensen, P.A.; Dam-Johansen, K. Simultaneous thermal analysis (STA) on ash from high-alkali biomass. Energy Fuels 2004, 18, 1066–1076. [Google Scholar] [CrossRef]
  32. Zhao, H.; Xu, W.; Song, Q.; Zhuo, J.; Yao, Q. Effect of steam and SiO2 on the release and transformation of K2CO3 and KCl during biomass thermal conversion. Energy Fuels 2018, 32, 9633–9639. [Google Scholar] [CrossRef]
  33. Muljani, S.; Wahyudi, B.; Sumada, K. Potassium silicate foliar fertilizer grade from geothermal sludge and pyrophyllite. MATEC Web Conf. 2016, 58, 01021. [Google Scholar] [CrossRef] [Green Version]
  34. Hilger, J.P.; Babel, D.; Prioul, N.; Fissolo, A. Corrosion of AZS (alumina, zirconia, silica) and fireclay refractories in contact with lead glass. J. Am. Ceram. Soc. 1984, 64, 213–220. [Google Scholar] [CrossRef]
  35. Shartsis, L.; Spinner, S.; Capps, W. Density, expansivity, and viscosity of molten alkali silicates. J. Am. Ceram. Soc. 1952, 35, 155–160. [Google Scholar] [CrossRef]
  36. Poirier, J.; Qafssaoui, F.; Ildefonse, J.P.; Bouchetou, M.L. Analysis and interpretation of refractory microstructures in studies of corrosion mechanisms by liquid oxides. J. Eur. Ceram. Soc. 2008, 28, 1557–1568. [Google Scholar] [CrossRef]
  37. Nishikawa, A. Technology of Monolithic Refractories; Japan by Toppan Printing Company: Tokyo, Japan, 1984; 598p. [Google Scholar]
  38. Niu, Y.; Wang, Z.; Zhu, Y.; Zhang, X.; Tan, H.; Hui, S. Experimental evaluation of additives an K2O-SiO2-Al2O3 diagrams on high temperature silicate melt-induced slagging during biomass combustion. Fuel 2016, 179, 52–59. [Google Scholar] [CrossRef]
Figure 1. Decomposition of corroded biomass boiler lining.
Ceramics 05 00075 g001
Figure 2. The position of test specimens: 1—plate is used for SEM and EDS; 2—a protective layer had formed on the surface of the plate; 3—cavity with K2CO3 salt; 4—the crucible method test sample; 5—unreacted castable layer was used for XRD analysis.
Ceramics 05 00075 g002
Figure 3. X-ray diffraction patterns of castables after thermal treatment at the temperature of 1100 °C: 1—CC-1; 2—CC-2; 3—MCC-1; 4—MCC-2.
Ceramics 05 00075 g003
Figure 4. X-ray diffraction patterns: 1—CC-1; 2—CC-2; 3—MCC-1; 4—MCC-2.
Ceramics 05 00075 g004
Figure 5. K distribution in the surface layer of castables after 3 cycles of alkali attack at a temperature of 1100 °C seen in EDS maps: (a)—CC-1; (b)—CC-2; (c)—MCC-1; (d)—MCC-2.
Ceramics 05 00075 g005
Figure 6. Potassium distribution in the surface layer of castable: (a)—CC; (b)—MCC.
Ceramics 05 00075 g006
Figure 7. Result of castable porosity before and after 3 cycles of alkaline attack (*): (a)—CC-1; (b)—CC-2; (c)—MCC-1; (d)—MCC-2.
Ceramics 05 00075 g007
Figure 8. DTG curves of K2CO3 and castable powder mixtures: (a) a mix without GQS CC-1′ and with GQS CC-1; (b) a mix without GQS CC-2′ and with GQS CC-2; (c) a mix without GQS MCC-1′ and with GQS MCC-1; (d) a mix without GQS MCC-2′ and with GQS MCC-2.
Ceramics 05 00075 g008aCeramics 05 00075 g008b
Table 1. Compositions of castables (mass %) and their characteristics [23].
Mark of CompositionContent of the ComponentsCharacteristics
CAC70CAC40MSRA + CABOS135BOS145GQSFS20 *NT *FS30 *Water *Compressive Strength, MPaTSR, Cycles
CC-1 252.5-70.0-2.5--0.1105110
CC-2-252.5--70.02.5--0.18.56717
MCC-112-5.01268.5-2.50.10.1-9.07624
MCC-212-5.012-68.52.50.10.1-8.012629
*—over 100 % of the key dry substances.
Table 2. Chemical composition of the tested castables, mass %.
No.Chemical Composition, Mass %The Mark of Composition
CC-1CC-2MCC-1MCC-2
1Al2O334.4741.4944.0851.10
2SiO244.5538.5946.0540.52
3CaO11.3011.424.644.46
4Fe2O35.715.401.971.58
5K2O0.920.640.810.54
6Na2O0.130.140.210.25
7MgO0.510.400.410.30
8ZrO20.040.040.030.02
9TiO21.381.380.940.77
10P2O50.070.070.110.11
Table 3. Percentage averages of major chemical elements in the protective layer after 3 cycles of potassium attack.
The Mark of CompositionThickness of the Layer with High K ConcentrationAverage Elemental Concentration, %Total, %
KAlSiCaNaO
CC-11300 μm24.5 ± 0.414.4 ± 2.211.8 ± 1.84.1 ± 0.20.5 ± 0.0444.7 ± 2.0100.0
CC-21100 μm21.5 ± 0.916.6 ± 1.811.1 ± 2.03.8 ± 0.30.4 ± 0.0546.6 ± 1.5100.0
MCC-11200 μm24.3 ± 0.618.9 ± 0.914.1 ± 0.31.4 ± 0.10.7 ± 0.140.6 ± 2.1100.0
MCC-2700 μm22.8 ± 0.719.5 ± 0.513.8 ± 0.50.9 ± 0.050.6 ± 0.142.4 ± 2.0100.0
Table 4. The mass loss (%) at different temperature ranges.
Composition500–880 °C880–950 °C
CC-16.20.8
CC-1′6.30.2
CC-25.71.0
CC-2′6.30.2
MCC-15.90.8
MCC-1′6.30.2
MCC-25.51.3
MCC-2′6.20.3
Publisher’s Note: MDPI stays neutral with regard to jurisdictional claims in published maps and institutional affiliations.

