1. Introduction
Environmental, Social, and Governance (ESG) criteria have evolved beyond discretionary disclosure frameworks to become fundamental determinants of corporate resilience and strategic viability [
1,
2]. This shift is particularly pronounced in Taiwan, where the Financial Supervisory Commission (FSC) has implemented a phased mandate for sustainability reporting. By 2025, the FSC would require all listed and over-the-counter (OTC) firms to disclose ESG metrics, with mandatory reporting already commencing in 2024 for firms with paid-in capital below NT
$2 billion. These regulatory tailwinds have effectively internalized ESG factors into the core of corporate governance, repositioning sustainability as a critical pillar of capital market competitiveness.
However, the transition toward ESG integration is constrained by two primary structural impediments. First, ESG initiatives necessitate substantial, irreversible capital expenditures, intensifying the debate over whether such outlays represent value-enhancing investments or agency-related discretionary spending. Second, the prevailing reliance on third-party ESG ratings is problematic due to inherent opacity and significant “rater divergence” [
3,
4]. This lack of cross-provider comparability introduces systematic uncertainty for both management and institutional investors, obscuring the specific financial and operational drivers of ESG performance.
The systemic importance of ESG is further amplified by the escalating materiality of climate-related financial risks. Environmental shocks pose significant threats to supply chain integrity and credit quality, potentially triggering asset revaluations and systemic financial instability [
3]. In this context, ESG performance serves as a sophisticated risk-mitigation mechanism rather than a mere signaling tool for corporate reputation. This shifting landscape necessitates firm-specific diagnostic tools that transcend the limitations of aggregate third-party scores. Despite this need, empirical literature in the Taiwanese context has only recently begun to leverage Machine Learning (ML) to capture the complex, non-linear interactions inherent in high-dimensional ESG and financial data.
Taiwan provides an ideal laboratory for this study. As an open economy deeply embedded in global value chains, Taiwan maintains several ESG-sensitive sectors, including semiconductors, electronics, steel, and cement. International investors closely monitor the environmental and governance practices of these industries. Moreover, Taiwan’s transition toward mandatory disclosure offers a unique window to observe how firms adapt under tightening institutional constraints.
The Slack Resources Hypothesis provides the theoretical lens for our analysis. This hypothesis posits that financial slack-not just managerial intent-drives ESG performance. Firms with ample resources (high profitability, scale, and liquidity) could better absorb the risks and long implementation cycles of sustainability projects. Conversely, financial constraints often force firms to deprioritize ESG.
To bridge the existing research gap, this study integrates firm-level financial indicators with ESG ratings from Taiwan’s listed and OTC firms. We utilize the Decision Tree, Random Forest, and Extreme Gradient Boosting (XGBoost) models to address three specific research questions (RQ):
- RQ1:
How effectively could supervised ML predict a firm’s ESG performance using financial data?
- RQ2:
Which financial drivers exert the most influence, and how do these drivers vary across the semiconductor, financial, cement, and steel sectors?
- RQ3:
Could we derive interpretable decision rules to build early-warning models for ESG risk?
Our study makes three key contributions. First, it develops an ESG early-warning framework that links firm-level financial fundamentals to ESG performance, offering actionable insights within the context of a small open economy. Second, it demonstrates that ESG predictability is industry-specific: variables such as ROA, Tobin’s Q, firm size, capital structure, and growth dynamics exert distinct influences across sectors. Third, it introduces transparent, threshold-based decision logic that managers, investors, and regulators can readily apply for screening, resource allocation, and compliance planning.
The remainder of this study is organized as follows:
Section 2 synthesizes the literature on the ESG-financial performance nexus and ML applications in finance.
Section 3 details the methodology, variable selection, and model architecture.
Section 4 presents the empirical findings.
Section 5 discusses the managerial and policy implications, while
Section 6 concludes with a summary of contributions and avenues for future research.
2. Literature Review
2.1. Conceptual and System-Level Foundations
The growing significance of ESG considerations has fundamentally restructured both sustainability studies and financial decision-making. Early ESG research adopts a conceptual and system-level perspective, positioning ESG not as a peripheral ethical concern, but as an integral component of modern financial systems. Jámbor and Zanócz (2023) [
5] offered an extensive systematic review that emphasizes the substantial conceptual heterogeneity and methodological fragmentation characterizing the ESG literature. Despite the increasing reliance on ESG ratings in investment decisions and regulatory frameworks, their findings underscore persistent challenges related to measurement subjectivity, cross-provider inconsistency, and limited transparency. These shortcomings heighten concerns regarding greenwashing and undermine the comparability and credibility of ESG-based assessments, thereby motivating calls for greater standardization, clearer regulatory guidance, and enhanced methodological rigor.
Consistent with this systemic view, Ziolo et al. (2019) [
1] expanded a framework in which ESG factors are embedded within the core framework of financial decision-making, influencing capital allocation, governance structures, and long-term economic resilience. Reinforcing this argument, the Bank for International Settlements (BIS, 2020) [
3] characterized climate- and ESG-linked risks as intrinsically non-linear and potentially irreversible, thus outperforming the explanatory capacity of traditional linear risk models. These contributions above provide a theoretical foundation for adopting more flexible and forward-looking analytical approaches in ESG research.
2.2. Linear Econometric Evidence on Firm-Level ESG Performance
Building on these conceptual foundations, numerous empirical studies adopt linear regression and panel-data models to examine whether ESG performance enhances firm outcomes. Research by Yoon et al. (2018) [
6] and De Lucia et al. (2020) [
7] generally found a positive relationship between ESG performance and firm value or financial performance, with governance-related factors often proving to be the most influential. Extending this literature, Segura et al. (2024) [
8] showed that ESG pillars have heterogeneous effects on performance and market valuation, suggesting that composite ESG scores may mask dimension-specific impacts. Despite the ‘predominantly positive’ relationship found in Friede et al.’s (2015) [
9] meta-analysis of over 2000 studies, the high degree of variance in results points toward the non-linear dynamics and threshold effects that traditional linear models struggle to capture. This inconsistency in the broader economics literature provides the mandate for the ensemble ML approach used in this study, which could identify the specific ‘tipping points’ where financial slack translates into ESG excellence.”
Sector-specific analyses further refine these findings. Candio (2024) [
2], concentrating on the European healthcare sector, and Momtaz and Parra (2024) [
10], investigating sustainable entrepreneurship, showed that the financial relevance of ESG is context-dependent and may be amplified in industries subject to heightened regulatory scrutiny or social expectations. Despite their contributions, linear econometric approaches remain limited in capturing complex interactions, threshold effects, and non-linear dynamics inherent in ESG processes.
2.3. Portfolio-Level Analysis and Risk-Oriented Approaches
At the portfolio level, ESG research remains grounded in classical financial econometrics. Jin (2022) [
11] showed that ESG screening materially affects factor-adjusted portfolio performance, with screening concentration playing a pivotal role: while it mitigates sustainability-related risks, excessive concentration can impair diversification and distort systematic exposures. Similarly, Cesarone et al. (2022) [
12] found that ESG-integrated portfolios primarily enhance downside protection and resilience rather than deliver persistent abnormal returns. Synthesizing this evidence, Nian and Said (2025) [
13] concluded that ESG engagement is more consistently linked to risk reduction-lower volatility and better performance during market stress-than to short-term outperformance, with effects varying across ESG dimensions, industries, and institutional contexts.
At the firm level, Lins et al. (2017) [
14] illustrated that corporate social responsibility (CSR) strengthens social capital and trust, enhancing stock returns, profitability, and growth during the 2008–2009 financial crisis. Effects are strongest in low-trust countries, suggesting CSR substitutes for weak institutional trust and creates value during systemic crises.
2.4. ESG Measurement Challenges and Data Limitations
A growing body of literature underlines the fundamental limitations of ESG data quality and comparability. Jámbor and Zanócz (2023) [
5] highlighted that ESG ratings are affected by divergent definitions, inconsistent weighting schemes, and reliance on qualitative or self-reported disclosures. Kotsantonis and Serafeim (2019) [
4] similarly documented pronounced discrepancies across ESG rating providers, which weaken statistical inference and complicate cross-study comparability. These persistent measurement challenges reinforce the need for methodological innovation capable of accommodating noisy, heterogeneous, and incomplete ESG data.
2.5. Emergence of Machine Learning in ESG and Financial Analytics
Advances in ML represent a clear methodological turning point in ESG research. Although sophisticated ML techniques often achieve superior predictive Accuracy, the association between financial slack and sustainability outcomes remains statistically significant but limited in magnitude. In particular, resource availability only seems to exert a partial influence on a firm’s ability to undertake long-term ESG initiatives, rather than functioning as a decisive determinant of ESG success (Krauss et al., 2017) [
15].
Applying these insights on ESG frameworks, Lanza et al. (2020) [
16] demonstrated that ML-based approaches can enhance portfolio construction and risk assessment using ESG information, provided that challenges related to data quality, comparability, and temporal instability are adequately addressed.
2.6. ESG Score Prediction Using Advanced and Ensemble Machine Learning Models
Recent studies shift the analytical focus from evaluating ESG-related performance outcomes to predicting ESG scores themselves. Lee et al. (2022) [
17] proposed hybrid frameworks combining traditional ML algorithms with deep learning architectures, while Jiang (2024) [
18] provided comparative evidence that ensemble methods systematically outperform simpler models in ESG score prediction. Addressing ESG measurement limitations more directly, Aue et al. (2025) [
19] incorporated unstructured news data and multivariate time-series models to generate dynamic ESG predictions, illustrating how alternative data sources can partially substitute for conventional ESG ratings.
2.7. Explainable and Interpretable Machine Learning for ESG Analytics
Beyond predictive Accuracy, the latest methodological frontier emphasizes interpretability and transparency. Del Vitto et al. (2023) [
20] showed that explainable ML techniques can significantly enhance the transparency of ESG predictions without materially compromising predictive performance. Complementing these developments, Zou et al. (2025) [
21] introduced an LLM-based framework, ESG Reveal, which extracts structured ESG information from unstructured corporate disclosures. Their findings demonstrate that large language models can substantially improve the Accuracy, consistency, and scalability of ESG data extraction, directly addressing long-standing data quality concerns in the ESG literature. Collectively, these advances highlight the growing role of artificial intelligence in improving ESG measurement, interpretability, and decision relevance for investors, regulators, and policymakers.
2.8. Competitive Perspectives on ESG and Corporate Performance
Despite a growing body of empirical research on the relationship between ESG performance and corporate financial performance (CFP), the direction of economic causality remains theoretically ambiguous. Existing studies offer competing explanations as to whether ESG engagement enhances a firm’s value or instead reflects the firm’s pre-existing financial strength. This study is grounded in two dominant theoretical perspectives that frame this debate.
The Slack Resources Hypothesis posits that superior ESG performance is primarily an outcome of strong financial performance (Waddock and Graves, 1997 [
22]; McGuire et al., 1988 [
23]). ESG initiatives typically involve substantial upfront investment, extended implementation horizons, and uncertain short-term returns. Consequently, firms with greater financial slack-manifested in higher profitability, larger scale, or stronger liquidity-are better positioned to absorb the costs and risks associated with sustainability initiatives. Under this view, ESG engagement represents a discretionary allocation of excess resources, implying that the observed ESG–CFP relationship may be driven by reverse causality.
In contrast, the Good Management Hypothesis conceptualizes ESG performance as an indicator of superior managerial quality and organizational efficiency (Porter and van der Linde, 1995 [
24]; Edmans, 2011 [
25]). Firms that effectively address environmental constraints, social responsibilities, and shareholder demands are also likely to exhibit stronger internal controls, more efficient operations, and enhanced risk management. ESG engagement is therefore viewed not as a luxury afforded by financially successful firms, but as a strategic capability that mitigates agency conflicts and contributes directly to improved financial performance.
Reconciling these perspectives, recent studies propose a virtuous circle framework in which financial slack facilitates ESG investment while successful ESG engagement enhances reputation, reduces risk exposure, and strengthens long-term financial outcomes (Eccles et al., 2014 [
26]; Albuquerque et al., 2019 [
27]). This dynamic view suggests that the ESG-CFP relationship is characterized by feedback effects rather than a unidirectional causal mechanism.
Importantly, the strength of this virtuous cycle is shaped by institutional and governance conditions. ESG relevance was amplified in industries subject to heightened regulatory scrutiny or social expectations (Ioannou and Serafeim, 2012) [
28], while governance quality provides the foundational mechanisms through which ESG initiatives translate into economic value (Gompers et al., 2003) [
29]. Moreover, because ESG-related risks tend to be non-linear and potentially irreversible, firms with stronger ESG profiles may exhibit greater resilience during periods of market stress (Lins et al., 2017) [
14].
2.9. Positioning and Contribution of Our Study
Against this methodological backdrop, this study contributes to the ESG literature by extending the recent stream of ensemble and interpretable ML research. Specifically, it moves beyond traditional linear econometric models by employing supervised ML techniques to capture the non-linear relationships between firms’ financial characteristics and ESG performance. Compatible with recent advances, this study not only emphasizes predictive Accuracy, but also interpretability, enabling the extraction of transparent decision rules suitable for early warning and ESG risk-monitoring applications. By combining industry-specific analysis with explainable ensemble models, this research directly addresses calls for context-sensitive, data-driven, and practically usable ESG analytics, thereby bridging the gap between methodological sophistication and real-world applicability.
2.10. Hypothesis Development
Grounded in the three research questions mentioned above and the theoretical foun-dation offered by the Slack Resources Hypothesis, our study proposes that a firm’s ESG performance largely depends on its financial capacity to bear the costs, risks, and delayed returns associated with its sustainable development investments. ESG initia-tives typically involve a significant initial investment, long implementation cycles, and uncertain short-term financial benefits. Firms with stronger financial positions exhibit better ESG performance. Four hypotheses could be built as follows:
H1 (The Predictive Limits of Financial Data): ESG performance of firms could be predicted using observable financial characteristics using supervised ML models.
H2 (Slack Resources and the Strategic Necessity of Scale): Firms with greater slack re-sources-reflected in higher profitability, larger firm scale, and stronger liquidity-exhibit higher ESG performance.
H3 (Sectoral Heterogeneity and Financial Constraints): The financial indicators that most strongly influence ESG performance differ across industries, including the semiconductor, financial, cement, and steel sectors.
H4 (Interpretability and Early-Warning Capability): Interpretable supervised ML models could extract economically meaningful decision rules that identify firms with elevated ESG risk, thereby supporting early warning systems at both the firm and industry levels.
The hypotheses presented above integrate predictive Accuracy, economic drivers, and industry heterogeneity into a unified framework. H1 (predictability) and H4 (interpretability) reflect recent methodological trends towards advanced machine learning and interpretability. However, Hypothesis H2 (slack resources) provides a theoretical foundation by positioning ESG outcomes as financial autonomy. Finally, hypothesis H3 (heterogeneity) explains the nuances and industry-specificity of the relationship between ESG and financial performance. These hypotheses combine modern computational techniques with established resource-based theory to address the questions posed in RQ1–RQ3.
3. Research Methodology
3.1. Variable Selection and Rationale
To investigate the financial determinants of ESG performance within Taiwan’s semiconductor, financial, cement, and steel sectors, this study utilizes a suite of firm-level predictors. Rather than a purely exploratory approach, our variable selection was theoretically grounded in the corporate finance literature and the specific operational realities of these four industries.
Profitability and Slack: Return on Assets (ROA) served as our primary metric for accounting-based profitability. In line with the Slack Resources Hypothesis, we treat ROA as a proxy for the discretionary capital necessary to fund the “non-immediate” returns of environmental and social programs (Waddock & Graves, 1997 [
22]).
Scale and Visibility: Firm Size (SIZE), calculated as the natural logarithm of total assets, accounted for the “political cost” hypothesis. Larger firms in Taiwan’s industrial landscape face intensified regulatory oversight and public scrutiny, often compelling them to utilize ESG performance as a tool for maintaining organizational legitimacy.
Financial Constraint: Capital Structure (CS) was included to capture the influence of leverage and debt overhang. As noted by Goss and Roberts (2011) [
30], high levels of indebtedness may stifle long-term sustainability investments in favor of immediate debt servicing.
Growth Dynamics: We incorporated the Revenue Growth Rate (RGR) to distinguish between firm life-cycle stages. This allows for the model to differentiate between “growth-at-all-costs” strategies and those where sustainability is used as a competitive differentiator in maturing markets.
Market Sentiment: Finally, Tobin’s Q was employed to capture the market-based valuation and growth expectations. This reflects the “valuation premium” that a forward-looking investor may assign to firms with robust risk-mitigation profiles (Fatemi et al., 2018 [
31]).
The specific measurements and units for these variables are summarized in
Table 1.
3.2. Pearson Correlation Analysis
Ahead of ML model construction, a Pearson correlation analysis was conducted to examine the relationships between financial variables and ESG scores. This step was vital for two reasons: first, to ensure the internal consistency of our feature set, and second, to identify potential multicollinearity that could obscure the feature importance rankings in our subsequent ensemble models. By assessing the relationships among financial indicators, the degree of correlation was evaluated, where a correlation coefficient of r = 1 indicated perfect positive correlation, r = −1 indicated perfect negative correlation, and r = 0 signified an absence of a linear association.
3.3. Supervised Machine Learning Models
Using ESG scores as the dependent variable, this study develops both regression and classification models to investigate the predictive power of corporate financial and non-financial variables on sustainability performance. For classification, this industry-relative approach emphasizes a firm’s sustainability performance within its competitive context rather than relying on absolute ESG levels. Firms with high ESG performance demonstrate more proactive practices across ESG dimensions and may benefit from stronger reputational capital and investor appeal. Conversely, low-performing firms indicate potential sustainability gaps and face greater external pressure. By accounting for cross-industry heterogeneity in ESG score distributions, this classification strategy reduces bias and enhances the fairness and interpretability of model benchmarks.
To ensure robust results across high-dimensional and non-linear data, we use supervised ML algorithms: Decision Tree, Random Forest, and XGBoost. Detailed configurations for the machine learning model architectures, including the specific hyperparameter tuning and cross-validation protocols used to ensure model stability, are provided in
Appendix A. To address class imbalance between high-and low-ESG performers, the ROSE technique is applied to generate synthetic minority-class samples and improve predictive robustness. The dataset is partitioned into a training-testing 70:30 split to ensure generalizability and reduce overfitting. In addition, with respect to model evaluation, regression models are assessed using mean squared error (MSE), mean absolute error (MAE), root mean squared error (RMSE), and the coefficient of determination (R
2) to quantify predictive errors. Classification models are evaluated using a confusion matrix to compute the Accuracy, Precision, Recall, and F1 score, thereby scrutinizing the models’ predictive performance across different classes. Based on these evaluation metrics, the model with the strongest overall performance is selected as an auxiliary tool for future corporate sustainability assessment. The ML model is described in detail in the following subsection.
3.3.1. Decision Tree
Decision Tree is a supervised ML method widely applied to both classification and regression tasks. Common algorithms include ID3, C4.5, and CART. ID3 selects the splitting attributes based on Information Gain, but tends to favor variables with many distinct values and cannot directly handle continuous data. To address these limitations, Quinlan (1993) [
32] proposed C4.5, which uses Gain Ratio to reduce bias toward multi-valued attributes, accommodates continuous variables and missing values, and incorporates pruning to mitigate overfitting.
CART (Classification and Regression Trees) is suitable for both classification and regression, using the Gini index for classification and MSE for regression. CART generates a binary tree structure, offering simpler architecture and higher computational efficiency than ID3 and C4.5.
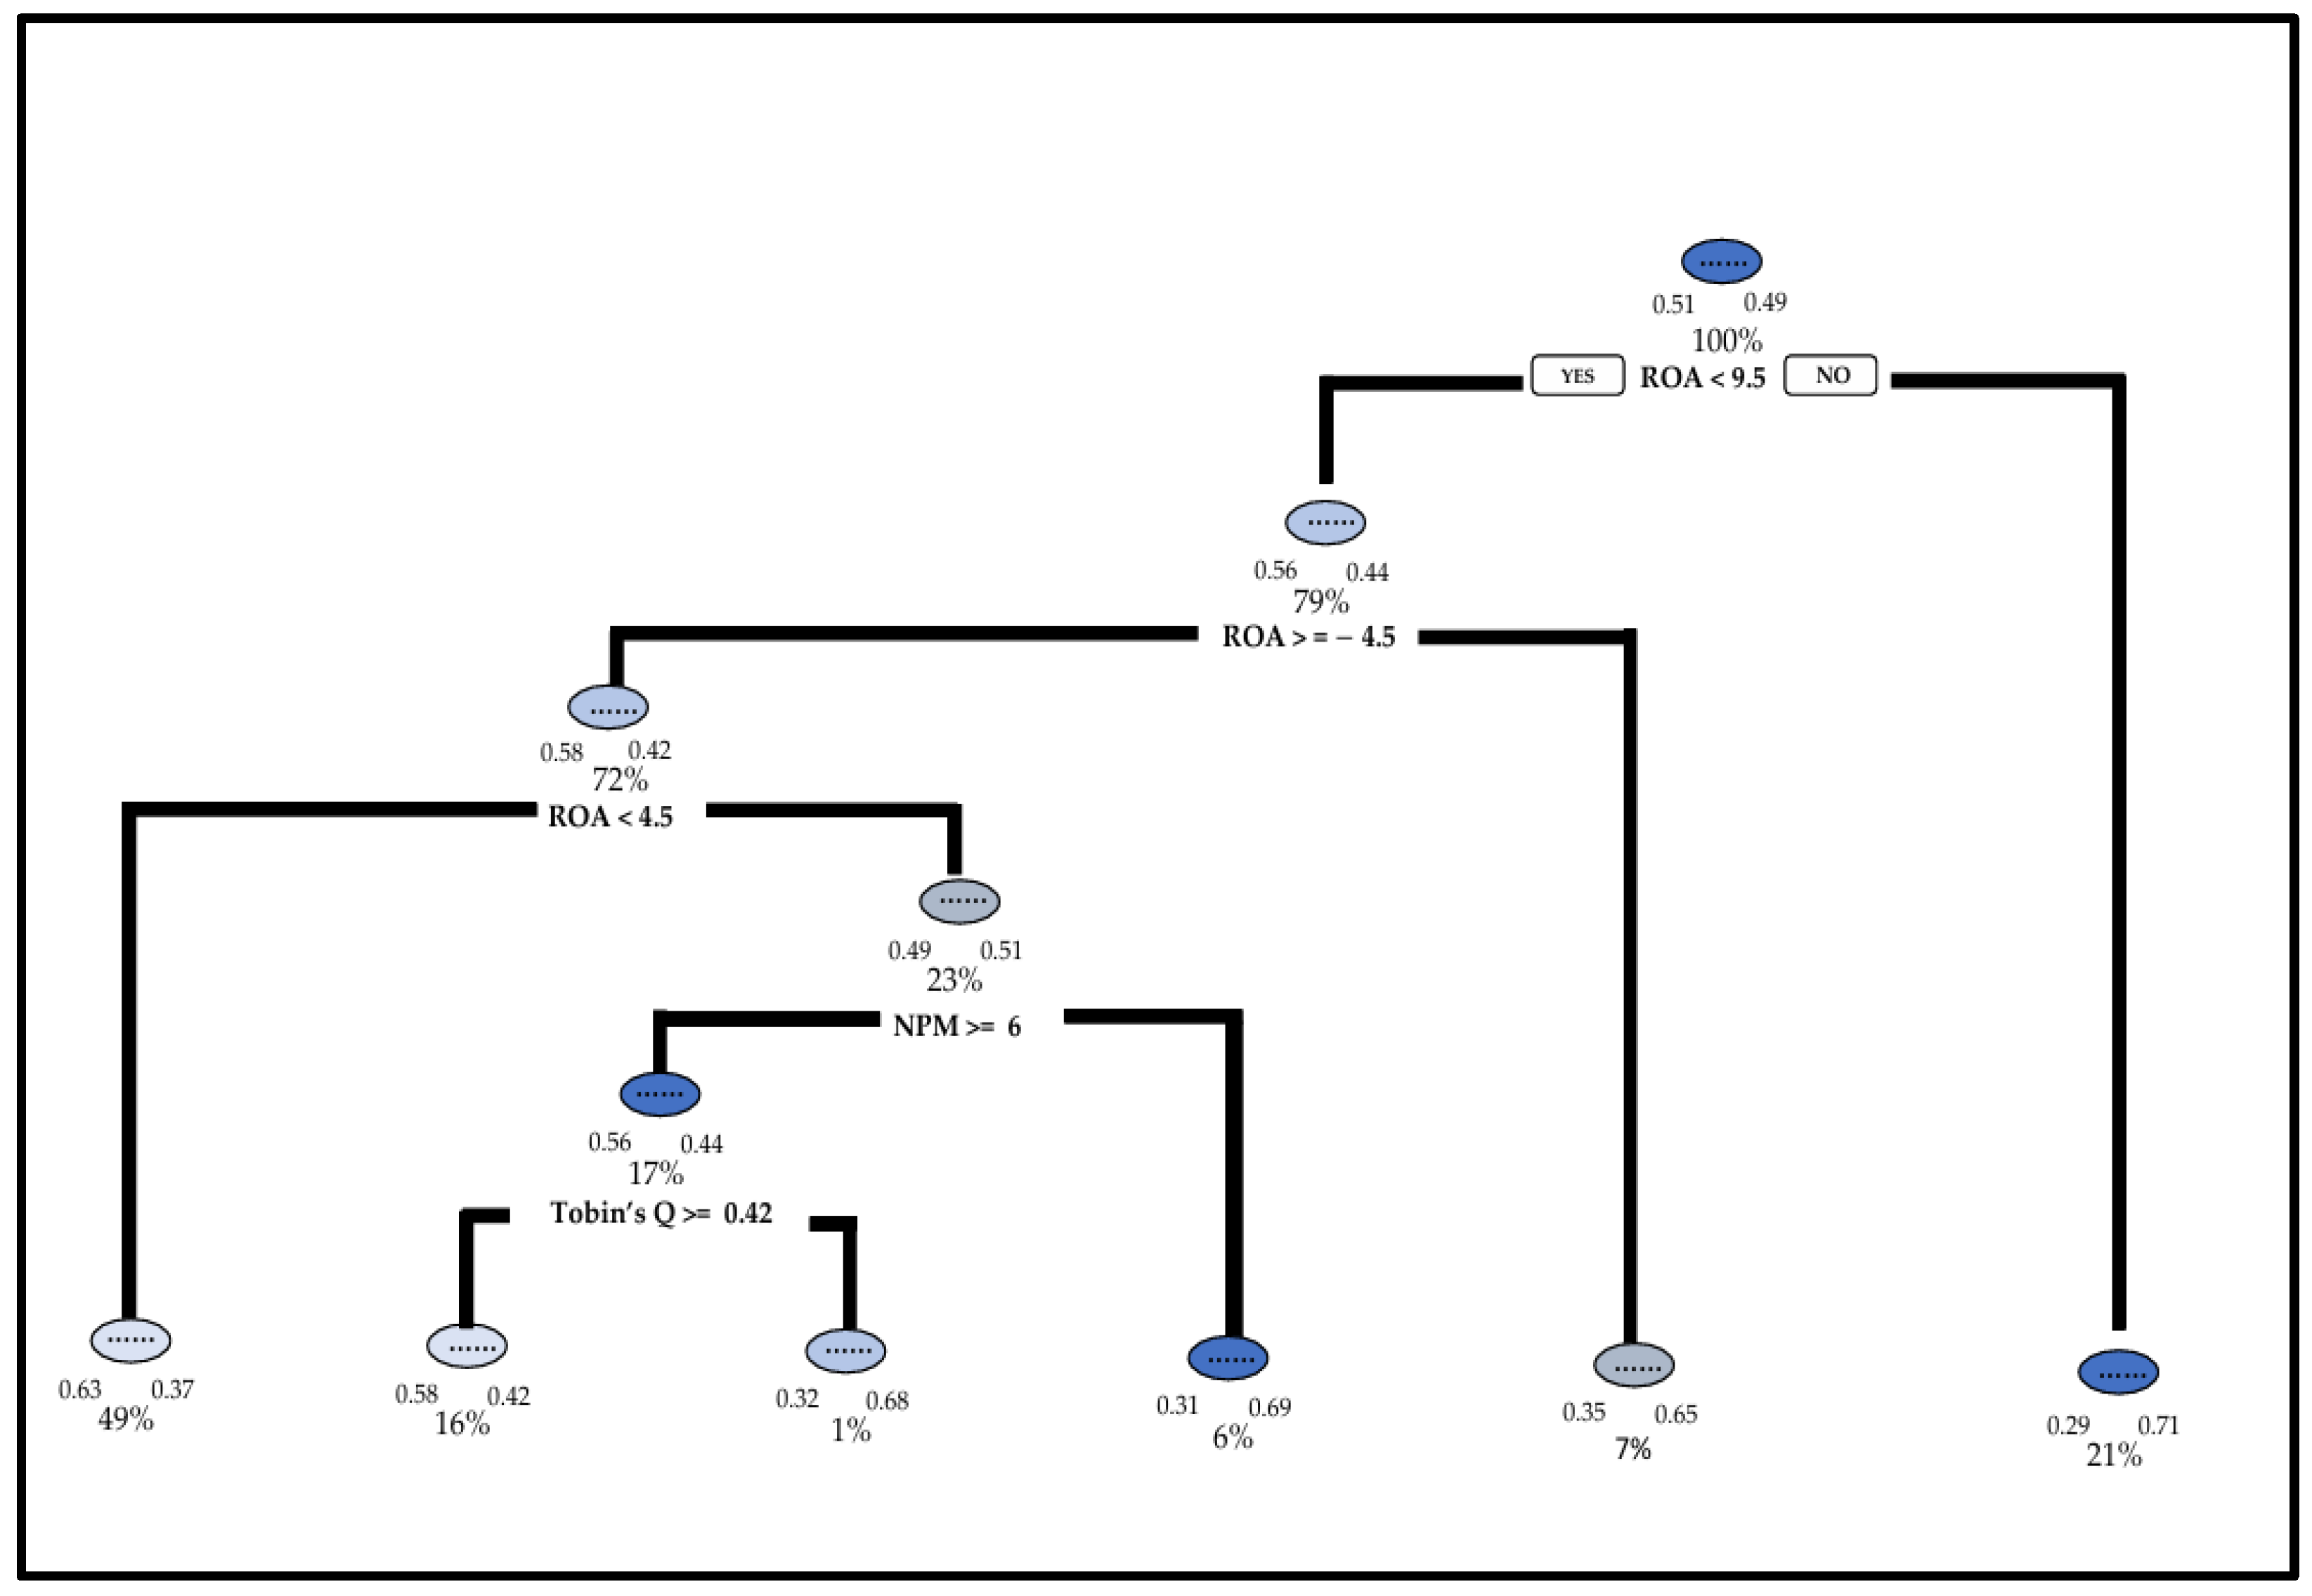
Figure 1 illustrates the Decision Tree splitting process for the full sample.
3.3.2. Random Forest
Random Forest is an ML model that aggregates multiple CART Decision Trees through Bagging (Bootstrap Aggregation) to enhance robustness and reduce overfitting. Proposed by Breiman (1996) [
33], Bagging trains each tree on a bootstrap sample drawn from the original dataset. Final predictions are obtained via majority voting for classification or averaging for regression.
In classification tasks, the Gini Index measures node impurity, and splits are selected to maximize impurity reduction. Variable importance is evaluated using Gini importance, defined as the cumulative reduction in the Gini Index attributable to each variable across all trees. Higher Gini importance indicates a greater contribution to classification Accuracy and overall predictive performance.
The Gini Index is calculated as:
where
denotes the proportion of class i samples in dataset D, and k is the number of categories. Gini contribution (feature importance) is computed as:
For a given variable, its Gini contribution refers to the cumulative reduction in the Gini index (i.e., impurity decrease) attributable to that variable across the entire model, summed over all node splits in which the variable is used. Here, t denotes the current node, with its Gini index prior to splitting; tL and tR represent the left and right child nodes after the split; and pL and pR denote the proportions of samples assigned to the left and right child nodes, respectively.
3.3.3. XGBoost
Boosting is an ensemble learning technique that sequentially combines weak learners into a strong learner by emphasizing previously misclassified samples (Freund & Schapire, 1997) [
34]. Unlike Random Forest, which relies on bagging to promote model diversity, Gradient Boosting focuses on sequential error correction. Hastie et al. (2009) [
35] show that each new learner minimizes residual errors from prior iterations using gradient descent, progressively improving predictive performance.
Among gradient-boosting variants, XGBoost, LightGBM, and CatBoost differ in their design focus. XGBoost incorporates regularization and parallel computation, providing stability and strong performance on structured data. Given its balance of predictive Accuracy and interpretability, our study adopts XGBoost as the primary model.
The objective function we minimize includes a loss term and a complexity penalty. The loss function is defined as:
where n is the sample size, g
i are the first- and second-order gradients of the loss function for sample iii, f
t(x
i) is the Prediction of the 7th Decision Tree, and Ω(f
t) is a regularization term controlling model complexity.
The Split Gain is calculated as:
where G
L and G
R denote the sums of first-order gradients of all samples in the left and right child nodes after the split, respectively, while H
L and H
R represent the corresponding sums of second-order gradients within the left and right child nodes. The parameter λ serves as a regularization term that controls model complexity, thus mitigating the risk of overfitting.
3.4. Econometric Baseline: Multiple Linear Regression
We estimate a multiple linear regression model to provide a comparative baseline for the ML models; this allows for the assessment of individual variable significance and directionality in a controlled environment. The linear model is specified as follows:
In this specification, ESGi,t denotes the ESG score of firm i at time t. The coefficients (β) represent the estimated impact of our financial predictors (ROA, SIZE, NPM, RGR, and Tobin’s Q); εi,t is the error term.
To ensure the validity of the OLS estimates, we conduct Variance Inflation Factor (VIF) tests to monitor multicollinearity, ensuring that all values remained below the conservative threshold of 5.
3.5. Data Balancing Techniques
A common challenge in ESG classification is the presence of class imbalance, where “high-performance” or “high-risk” firms may be underrepresented, leading to biased model boundaries. While techniques such as SMOTE (Synthetic Minority Over-sampling Technique) are widely used, they can occasionally introduce noise by generating samples along rigid lines between nearest neighbors. In contrast, we utilize the ROSE (Random Over-Sampling Examples) technique to enhance the robustness of our classifiers. ROSE generates synthetic observations using a smoothed bootstrap approach, effectively “perturbing” the data within the feature space. This method is particularly advantageous for our study, as it preserves the underlying probability distribution of the Taiwanese market data while mitigating the risk of overfitting. By balancing the dataset through ROSE, we ensure that our classification benchmarks-especially for identifying firms at risk of non-compliance-remain stable and generalizable across different industry cycles.
4. Empirical Findings
4.1. Data and Sample
This study uses firm-level ESG ratings and financial data for Taiwanese listed and OTC firms from 2014 to 2023 obtained from the Taiwan Economic Journal (TEJ). ESG measures are drawn from the TESG system, which follows the Sustainability Accounting Standards Board (SASB) framework and includes both composite ESG scores and the Event Radar Score (ERS), which adjusts for adverse ESG events. The final dataset consists of 8023 firm-year observations, concentrated in four industries: semiconductors (5485), steel (1702), financials (563), and cement (273). We selected these sectors not only for data availability, but also for their structural importance to the Taiwanese economy. By late 2024, semiconductors represented nearly half of the total market capitalization (47%), while financials held roughly 11%. Including traditional industries like steel and cement (together under 2%) provides a necessary contrast between capital-intensive high-emission traditional industries and the high-growth technology-driven electronics sector. The descriptive statistics reveal a market defined by extremes. While ESG scores are relatively stable-averaging 56.08 with a small gap between the mean and median-financial performance is far more volatile. The wide range in ROA (from−112.52 to 58.46) and the extreme outliers in Net Profit Margin (NPM) underscore a significant performance gap between industry leaders and laggards. Similarly, the average Tobin’s Q of 1.62 suggests that, while some firms enjoy high market premiums, the majority are valued close to their replacement costs. Revenue growth is heavily right-skewed; a mean of 10.27% against a median of 4.06% indicates that a handful of high-flyers are driving the market’s expansion. Interestingly, most firms maintain conservative leverage (median debt-to-equity of 0.58), although the presence of highly leveraged outliers (max 37.77) warrants attention. AGE extends from 4 to 73 years, with an average of 31.49 years, while SIZE spans from 7.15 to 21.54, with mean and median values (14.75 and 14.69) indicating concentration around a moderate scale.
To ensure that these extreme outliers-particularly in growth and profitability-do not distort our findings, we standardized all variables before beginning the estimation process. This allows us to more accurately isolate how financial health truly drives ESG outcomes across such a diverse cross-section.
4.2. Correlation Coefficients of ESG Scores and Financial Indicators
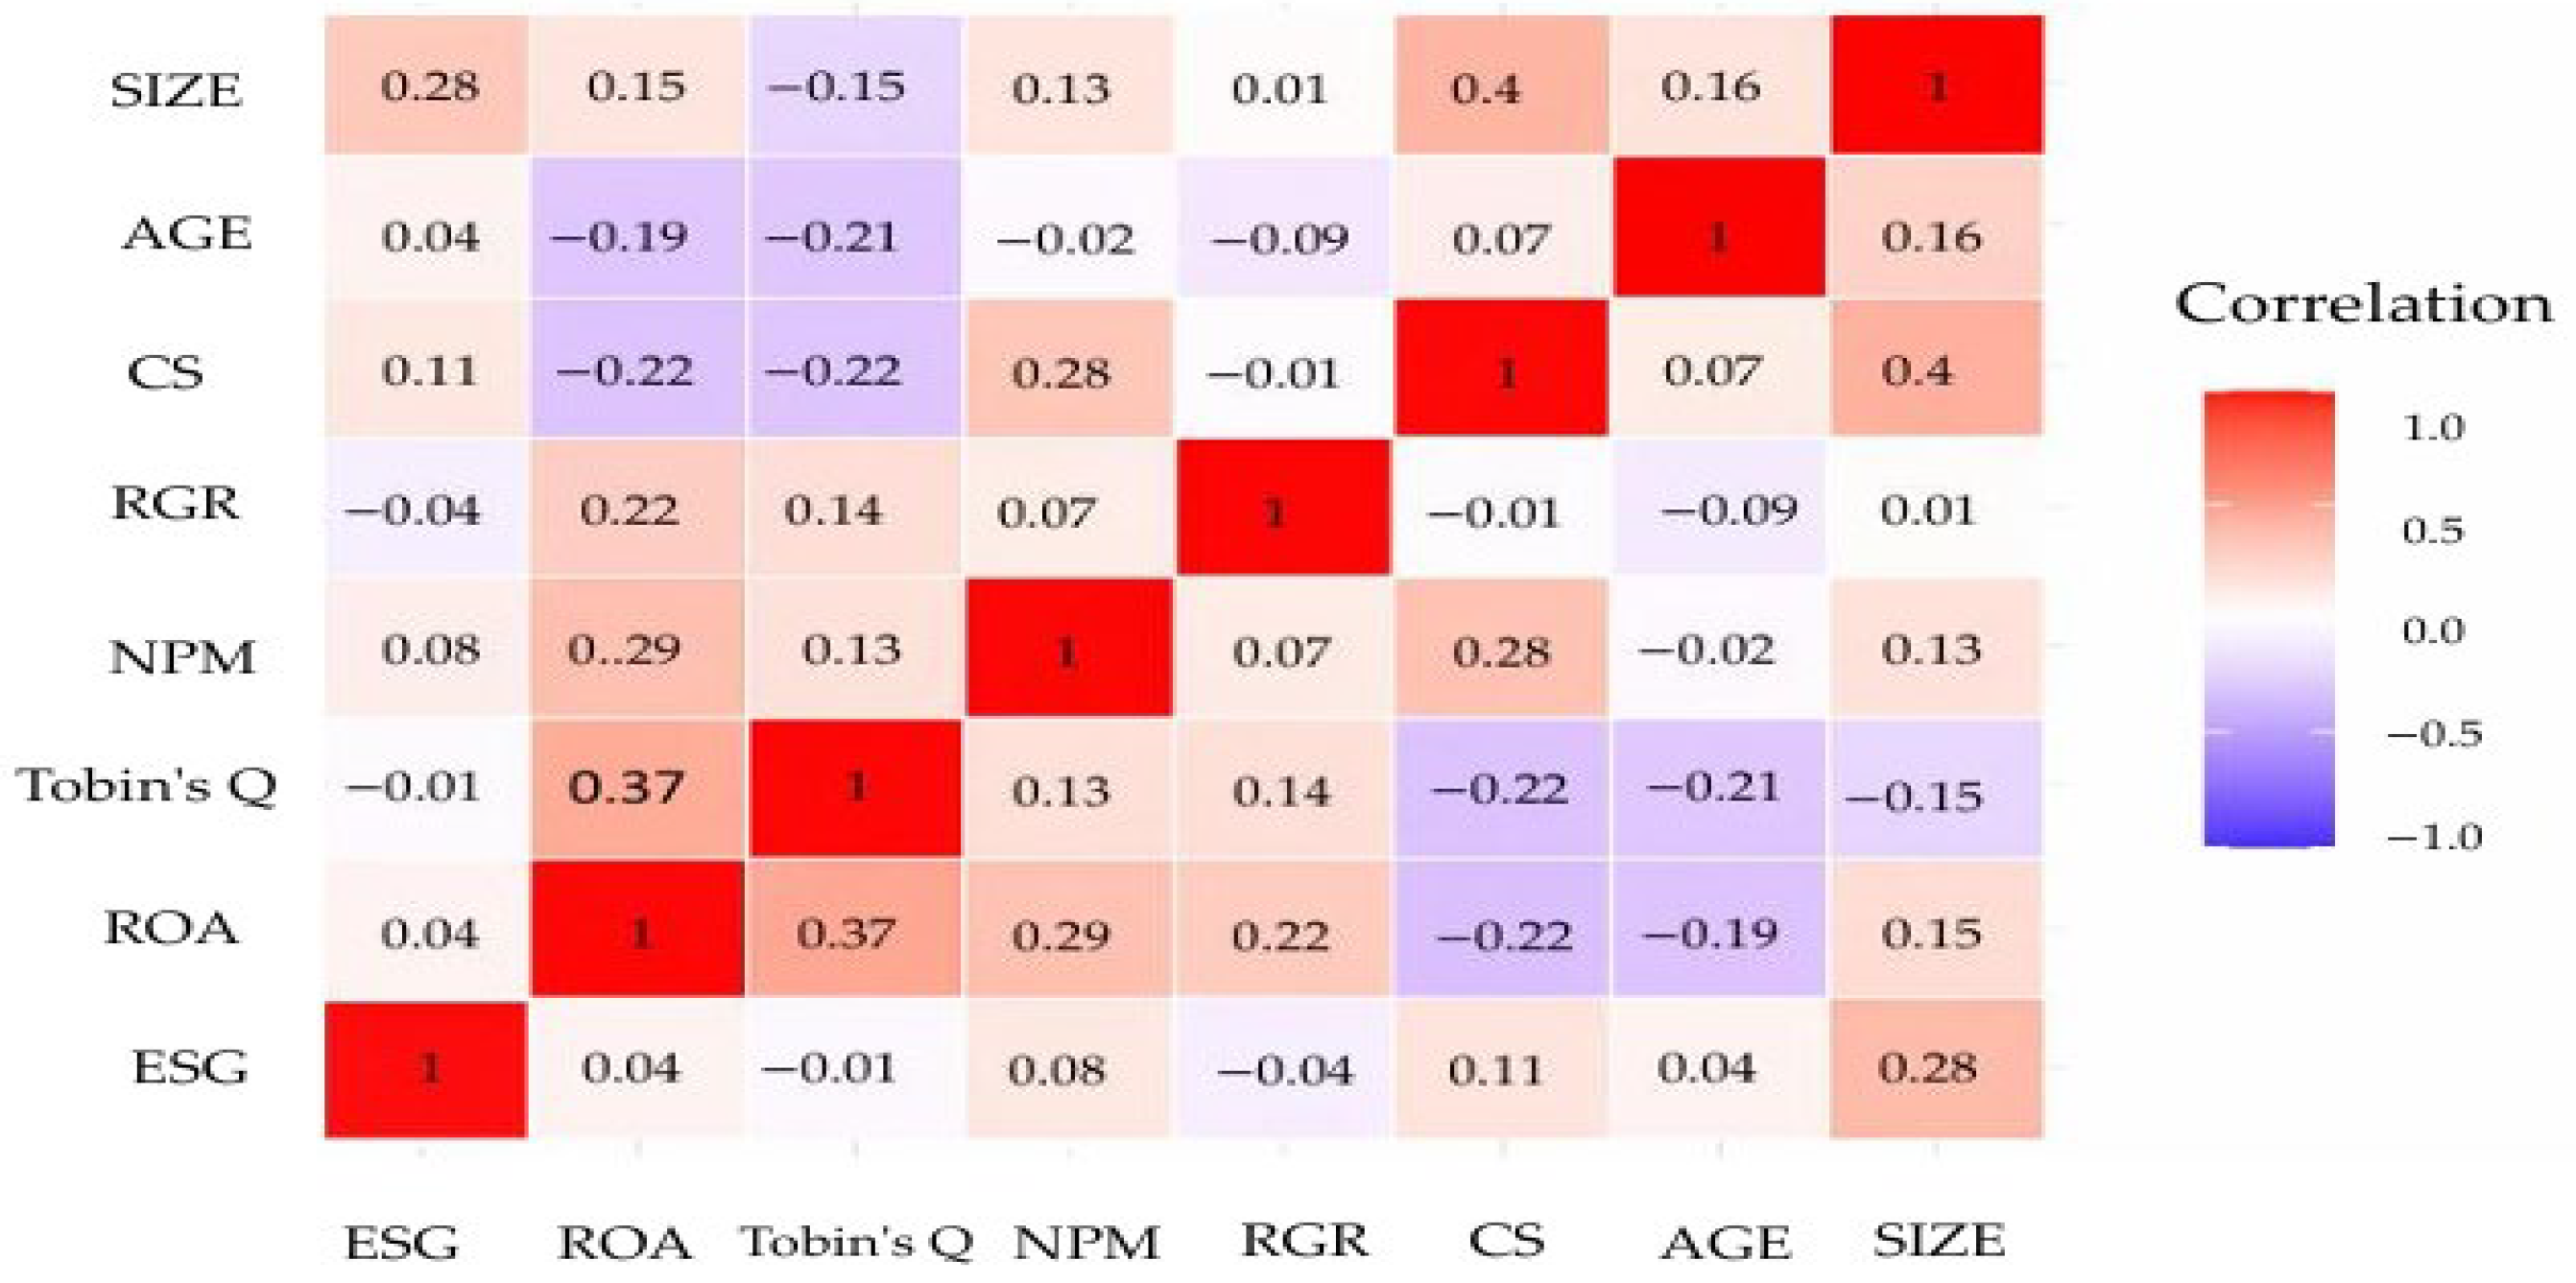
To explore the preliminary relationship between our financial indicators and ESG performance, we performed a Pearson correlation analysis (summarized in
Figure 2). We adopted the standard thresholds for interpretation: coefficients (r) below 0.3 depict weak associations, from 0.3 to 0.7 stand for moderate relationships, and values exceeding 0.7 indicate strong correlation. The results reveal a moderate positive correlation between ROA and Tobin’s Q (r = 0.37,
p < 0.01), as well as between SIZE and CS (r = 0.40,
p < 0.01). These findings suggest economically meaningful-though not strong-associations among a firm’s profitability, market valuation, and financial structure. Conversely, ESG scores exhibit negative correlations with Tobin’s Q and revenue growth rate (r = −0.1,
p = 0.22), implying short-term trade-offs between sustainability investments and market or revenue performance. This finding implies that firms allocating significant resources toward ESG initiatives may experience higher costs or margin compression, which can temporarily dampen revenue growth or market valuation. These initial correlations serve as a baseline, suggesting that the drivers of ESG performance are likely non-linear and require the more sophisticated regression and ML models that follow.
4.3. Results from Regression and Classification
The OLS regression results (
Table 2) display that ESG performance in the Taiwanese context is primarily a function of visibility and market positioning rather than internal accounting efficiency. Firm Size (SIZE) and Tobin’s Q emerge as the most potent predictors, suggesting that larger firms with favorable market sentiment are under the greatest pressure-or possess the most significant incentive-to maintain high ESG scores. Conversely, the negative impact of Revenue Growth (RGR) implies that rapid operational expansion may temporarily “crowd out” sustainability initiatives due to the immediate adjustment costs of scaling.
4.3.1. Linear Baseline vs. Non-Linear ML Performance
To evaluate the predictive power of various computational approaches, ESG scores were first modeled using linear regression. The baseline model yielded error metrics of MSE = 47.84, RMSE = 6.92, and MAE = 5.41. These results suggest that linear assumptions significantly underfit the data, failing to capture the “complex interactions and threshold effects” characteristic of ESG processes. To account for potential non-linearities-a key requirement given the “non-linear and potentially irreversible” nature of ESG risks-three ML algorithms were deployed. The comparative performance is summarized in
Table 3. The Random Forest model exhibits the strongest predictive performance among the estimated specifications, achieving the lowest error metrics (MSE = 7.27, RMSE = 2.69, and MAE = 1.44). This superior Accuracy reflects the model’s capacity to capture heterogeneous effects and non-linear relationships between financial indicators and ESG outcomes that are inherently obscured in traditional linear frameworks. Nevertheless, from a theoretical perspective, it is important to note that although ML substantially improves predictive Precision relative to linear regression, the overall explanatory power remains modest, with R2 values spanning from 0.04 to 0.11. This result carries meaningful implications for the ESG-performance nexus. First, the statistical significance of key financial variables provides partial support for the Slack Resources Hypothesis, indicating that financial latitude-such as profitability and liquidity-facilitates ESG engagement. At the same time, the limited explanatory power suggests that financial resources alone account for only a small fraction of the observed variation in ESG performance, lending support to the Good Management Hypothesis. The substantial unexplained variance is likely attributable to unobserved factors such as managerial quality, institutional trust, and governance structures that are not fully captured by standard financial metrics. More broadly, these findings are consistent with the prior literature that emphasizes the multidimensional and context-dependent nature of ESG outcomes, as well as the methodological fragmentation and measurement subjectivity inherent in ESG research. Overall, the transition from linear regression to ensemble learning underscores that, while financial slack constitutes an important enabling condition for ESG investment, it is not a sufficient determinant. Rather, the results point toward a virtuous circle in which financial capacity and managerial competence jointly shape corporate sustainability performance.
4.3.2. Classification and Industry-Specific Dynamics
- 1.
Whole Sample
Firms are categorized as either high-ESG or low-ESG performers in the classification. As detailed in
Table 4, the Decision Tree algorithm achieved the most balanced performance across the evaluated models, yielding an Accuracy of 75.85%, Recall of 79.88%, Precision of 92.15%, and an F1 score of 85.54%. This model proves particularly effective at distinguishing firms with robust ESG characteristics. While XGBoost demonstrated comparable Accuracy and high Precision, it exhibited a slightly lower Recall, suggesting that it is reliable for identifying top-tier performers, but may occasionally overlook weaker ones. Conversely, Random Forest prioritized Precision over Recall, resulting in the highest Precision among all models, but lower overall Accuracy. Ultimately, the Decision Tree model offered the superior combination of Accuracy, interpretability, and generalizability for the overall sample.
- 2.
Industry Heterogeneity
Performance indicators are disaggregated by industry across the three frameworks to further evaluate model efficacy. As shown in
Table 5, the Decision Tree model exhibits significant performance variance across sectors. Among the examined sectors, the financial sector exhibited the strongest overall performance, achieving the highest Accuracy (68.29%), Precision (71.43%), and F1 score (68.32%), with the elevated Precision indicating highly reliable positive predictions and a low incidence of false positives. In contrast, the semiconductor industry displayed a relatively liberal classification tendency; although it recorded the lowest Accuracy (58.52%), its high Recall (69.88%) suggests strong sensitivity in identifying positive cases at the expense of Precision. The steel industry followed a more conservative classification pattern, maintaining relatively high Accuracy, but reporting the lowest Recall (56.00%), thereby failing to capture a substantial proportion of true positive cases. Finally, the cement industry demonstrated the most balanced performance, reflecting a more even trade-off among Accuracy, Precision, and Recall across classification outcomes.
Under the Random Forest framework (
Table 6), the financial industry maintained its lead with improved metrics across all categories (Accuracy: 71.34%; F1: 69.67%). The close alignment between its Precision and Recall suggests a highly stable model with minimal bias. The steel industry also showed strong internal consistency, with metrics clustered near 68%, resulting in a robust F1 score of 68.60%. In contrast, the cement industry suffered from a marked imbalance; despite a respectable Accuracy (67.90%), its low Recall (60.42%) led to the lowest F1 score (61.70%) in this group. The semiconductor industry remained the most challenging for this model, showing the lowest Accuracy and Precision, likely due to the inherent technical complexity and “noise” within the sector.
As illustrated in
Table 7, XGBoost provided the most robust results overall. The financial industry continued to dominate all metrics, achieving a peak Accuracy of 73.17% and an F1 score of 72.60%, suggesting the model is exceptionally well-calibrated for financial data. The cement industry presented a unique case: while it ranked second in Accuracy (70.37%), it ranked last in Recall (62.50%) and F1 score (63.83%), indicating a persistent struggle to identify true positive cases. The steel and semiconductor industries demonstrated comparable, balanced profiles with F1 scores of 64.90% and 65.48%, respectively, avoiding the severe Recall deficiencies observed in the cement sector.
Overall, several concise conclusions can be drawn regarding model performance and industry characteristics. The financial industry is consistently the most predictable sector across all models, achieving superior Accuracy, Precision, and Recall, which suggests the presence of high-quality features well-suited to both tree-based and gradient boosting methods. A clear performance hierarchy is observed, with XGBoost generally outperforming Random Forest and Decision Trees, particularly in terms of Accuracy and F1 scores for the financial and cement sectors. Nonetheless, persistent challenges remain: the cement industry exhibits a consistent Recall deficiency across all models, indicating difficulty in identifying true positive cases despite relatively high Accuracy, while the semiconductor industry remains the noisiest, often showing lower Precision and Accuracy due to frequent false positives. Overall, model behavior evolves from a more liberal, Recall-oriented bias in Decision Trees toward a more balanced and stable classification profile in Random Forest and XGBoost.
4.4. Feature Importance and Economic Drivers
To unlock the “black box” of our ensemble architecture, we analyzed feature importance across the three models using Gini-based contributions (Decision Tree and Random Forest) and Split Gain (XGBoost). This analysis allows us to identify which financial characteristics serve as the strongest catalysts for ESG performance within the Taiwanese market.
4.4.1. Decision Tree-Based on Feature Importance
Variable importance is evaluated using Gini-based contributions across all decision nodes.
Table 8 reports that ROA consistently emerged as the most influential determinant of ESG performance across sectors, with SIZE also playing a significant role, except in the financial sector. Within finance, Tobin’s Q was the most critical predictor, highlighting the impact of market valuation and investor perception on ESG outcomes. Overall, ROA demonstrated the greatest stability and dominance as a predictor across all sectors, underscoring its crucial role in explaining variations in ESG performance.
4.4.2. Random Forest-Based on Feature Importance
Random Forest results (
Table 9) reinforce the prominence of ROA as a primary predictor of ESG performance across industries. SIZE significantly influenced ESG outcomes in the semiconductor, cement, and steel sectors, whereas Tobin’s Q exhibited greater predictive power in the financial and steel industries. In the cement sector, revenue growth rate also emerged as an important determinant, indicating that firms with reinvestment capacity and ongoing expansion are more likely to demonstrate stronger ESG performance.
4.4.3. XGBoost-Based on Feature Importance
As shown in
Table 10, the XGBoost identified distinct determinants of ESG performance across industries. ROA consistently ranked as the most influential predictor, reaffirming profitability as a central driver of sustainability outcomes. SIZE and NPM also frequently emerged as key factors, suggesting that larger and more profitable firms tend to achieve higher ESG scores. In the financial sector, Tobin’s Q remained a key determinant, highlighting the complementary role of market valuation and investor expectations alongside internal profitability in shaping ESG performance.
4.5. Decision Logic and Rule Extraction: Translating Data into Early-Warning
A primary objective of this study is to move beyond “black-box” predictions by extracting transparent, “if-then” decision rules. These rules provide actionable thresholds that allow for shareholders and regulators to categorize firms based on observable financial boundaries. By identifying the specific cutoff points where ESG performance tends to deteriorate, we can develop an operational framework for ESG risk monitoring.
4.5.1. Sectoral Decision Intervals and Threshold Dynamics
The consolidation of decision rules (
Table 11) reveals that “favorable” ESG status is not merely a matter of high profitability, but rather the result of remaining within specific “operational corridors.” These cutoff values serve as benchmarks for identifying firms at risk of non-compliance or greenwashing.
4.5.2. Industry-Specific Rule Analysis
The decision logic across Taiwan’s key industries reveals that ESG sustainability is not driven by uniform financial strength, but by industry-specific “break points” where financial slack, scale, and governance capacity intersect. Rather than a linear relationship between profitability and ESG performance, the ML rules uncover threshold effects-minimum conditions that must be satisfied before sustainability efforts can be credibly maintained. This cross-industry heterogeneity is best illustrated by the sector-specific rule extractions below, which quantify the precise financial boundaries and operational mandates required to sustain ESG legitimacy.
Semiconductor Industry
The XGBoost extraction (
Table 12) identifies a critical “floor” for sustainability. Firms falling below a size threshold of 18.31 or an ROA of −6.64% are almost universally categorized as “unfavorable.” This suggests that in the high-intensity semiconductor sector, a minimum operational scale and the avoidance of deep losses are prerequisite conditions for sustaining ESG investments. Conversely, maintaining a capital structure (CS) below 0.52-indicative of moderate leverage-appears to provide the financial stability necessary for long-term ESG commitments.
Financial Industry
Rules for the financial sector (
Table 13) emphasize market perception alongside internal efficiency. The model identifies “danger zones” when ROA falls below 0.27% and Tobin’s Q drops below 0.19. Interestingly, the classification of “unfavorable” status for firms with CS below 11.79 (in the context of banking leverage) points to a threshold where under-capitalization or insufficient scale limits a firm’s capacity to meet modern governance standards.
Cement Industry
The rules for the cement sector (
Table 14) reflect its inherent cyclicality. A firm with a robust ROA exceeding 5.55% can maintain a “favorable” classification even during revenue contractions (RGR < −5.52%). This underscores that, for heavy industry, historical profitability (slack) acts as a buffer that protects ESG programs from temporary market downturns. However, smaller firms (SIZE < 14.09) consistently struggle to maintain this resilience.
Steel Industry
The Random Forest results (
Table 15) suggest that “ESG excellence” in the steel sector requires a sophisticated balance of resources. The model identifies an optimal “favorable” corridor: ROA between 8.31% and 9.85% and a firm age exceeding 24 years.
This suggests that in heavy manufacturing, “Good Management” is a product of corporate longevity and disciplined leverage (CS ≤ 2.18), where established firms use their maturity to institutionalize sustainability practices.
5. Discussion
This research set out to determine whether corporate ESG performance could be systematically anticipated using financial data and whether those relationships are stable enough to form an interpretable early warning system. Our findings confirm that, while ESG is a complex, multidimensional construct, its foundations are deeply rooted in a firm’s financial architecture.
5.1. H1: The Predictive Limits of Financial Data
The validation of H1 confirms that financial characteristics do indeed hold significant predictive power over ESG outcomes. However, the “modest” out-of-sample Accuracy we observed provides a critical theoretical insight: financial metrics are an antecedent to ESG performance, but they do not tell the whole story.
By extending the work of Krauss et al. (2017) [
15] and Jiang (2024) [
18], our results suggest that, while machine learning can capture the non-linear “signals” in financial data better than OLS models, there remains a substantial portion of ESG performance that is likely driven by internal corporate culture or unobserved governance quality. Methodologically, this underscores that while AI is an excellent “screening” tool for emerging markets like Taiwan-where data quality is still maturing-it should be viewed as a supplement to, rather than a replacement for, qualitative ESG due diligence.
5.2. H2: Slack Resources and the Strategic Necessity of Scale
Hypothesis H2 claims that firms endowed with greater slack resources-operationally defined by robust profitability, organizational scale, and liquidity-demonstrate superior ESG performance. Our empirical evidence provides broad validation for this hypothesis, with ROA emerging as the most consistent predictor of ESG outcomes across all four analyzed sectors. This underscores a fundamental tenet of the Slack Resource Hypothesis: firms with efficient asset utilization possess the financial latitude necessary to fund capital-intensive sustainability initiatives, such as green technology adoption and enhanced governance frameworks, which might otherwise be sidelined by short-term liquidity constraints.
The influence of Firm Size is particularly significant in the semiconductor and cement industries. In these capital-intensive sectors, the high fixed costs of regulatory compliance and ESG integration necessitate the economies of scale typically reserved for larger enterprises. Furthermore, the heightened visibility of larger firms subjects them to more rigorous stakeholder scrutiny, transforming ESG performance into a strategic necessity for maintaining social license. These findings align with the linear econometric precedents established by De Lucia et al. (2020) [
7] and Friede et al. (2015) [
9], reaffirming that, while financial slack is not a sufficient condition for ESG excellence, it remains a critical structural prerequisite.
While these findings primarily support the Slack Resource Hypothesis, Tobin’s Q, as a major predictor-specifically within the financial sector-introduces a layered theoretical dialog. This suggests that, in information-dense industries, ESG performance may act as a proxy for Good Management Hypothesis, where better ESG metrics signal underlying management quality and long-term strategic foresight to the market. Thus, our results suggest that the relationship between financial health and ESG is not merely linear, but is mediated by managerial bandwidth and industry-specific signaling requirements.
5.3. H3: Sectoral Heterogeneity and Financial Constraints
The verification of H3 confirms that the “financial engine” of sustainability is not uniform; rather, it is calibrated to the specific economic pressures of each industry. Our findings reveal that the determinants of ESG classification shift significantly as one moves from capital-intensive manufacturing to service-oriented finance. This supports the recent arguments by Candio (2024) [
2] and Momtaz and Parra (2024) [
10] that sector-blind ESG assessments are inherently flawed.
In the financial sector, the dominance of market-based metrics suggests that sustainability is driven by an “outside-in” pressure, where investor expectations and market signaling (Tobin’s Q) dictate corporate action. Conversely, the semiconductor industry operates on an “inside-out” logic; here, the data highlights a vital link between operational scale (SIZE) and the fiscal capacity to absorb the significant R&D and compliance costs associated with modern environmental standards. Perhaps most telling is the steel industry, where “ESG excellence” is synonymous with organizational maturity. Our results indicate that long-term sustainability in steel is less about “growth” and more about financial resilience-defined by conservative leverage and historical profitability. This aligns with Lins et al. (2017) [
14], suggesting that, in highly regulated “brown” industries, a firm’s longevity and debt discipline act as the foundational pillars for credible, long-term ESG commitments rather than reactive, superficial disclosures.
5.4. H4: Interpretability and Early-Warning Capability
The strong support for H4 marks a significant departure from the “black-box” tradition of machine learning in finance. By extracting auditable “if-then” rules, we have translated complex algorithmic patterns into a transparent diagnostic tool. These derived thresholds-such as specific ROA cutoffs or size benchmarks-serve as “smoke detectors” for ESG risk.
Unlike proprietary ESG ratings, which are often criticized for their opacity and “ratings divergence,” the rule-based framework proposed here offers an auditable trail. This is particularly critical for the Taiwanese market as it transitions toward mandatory disclosure. For a corporate manager, these rules provide a quantitative self-assessment tool; for a regulator, they offer a systematic, replicable method to identify firms whose financial fundamentals may be “at odds” with their sustainability claims-effectively flagging potential greenwashing.
Ultimately, these results suggest that interpretable ML does not merely predict the future-it explains the present. By integrating financial indicators with transparent decision boundaries, we move from a purely ex-post evaluation of ESG scores toward a proactive risk-management framework that is both explainable to stakeholders and actionable for policymakers (Del Vitto et al., 2023 [
20]).
5.5. Synthesis and Broader Implications: Navigating Complexity
With R
2 values ranging from 0.04 to 0.11, the relatively low explanatory power of the three ML algorithms is consistent with prior research (e.g., Lanza et al., 2020 [
14]), which characterizes ESG performance as an inherently multidimensional construct. ESG outcomes are shaped by a wide array of non-financial factors, including governance quality, organizational culture, stakeholder engagement, and regulatory environments, many of which are difficult to quantify using conventional financial indicators.
The limited explanatory power observed in linear specifications carries two important implications. First, it suggests that the relationship between financial slack and ESG performance is unlikely to be purely linear, and instead may involve non-linear, interactional, or threshold effects. This provides strong justification for the application of non-parametric ML techniques, such as Decision Trees and Random Forests, which are better suited to capturing such complex relationships. Second, the low R2 values point to the presence of omitted variable bias. Although financial resources serve as necessary enablers of ESG investment under the Slack Resource Hypothesis, they explain only a portion of ESG variation. Unobserved qualitative characteristics-such as board structure, executive incentive alignment, and firm-specific governance practices-are likely to account for a substantial share of the remaining variance.
Importantly, the ML results not only refine, but also, in some cases, challenge the assumptions embedded in traditional linear models. The finding that Tobin’s Q and revenue growth might exhibit negative associations with ESG performance suggests the existence of short-term trade-offs or margin-compression effects that linear specifications may fail to capture. This evidence aligns with the BIS (2020) [
3] characterization of ESG risks as essentially non-linear, dynamic, and context-dependent.
Our findings above underscore the complex and interdependent relationship among financial management, ESG performance, and corporate strategy. Financial characteristics provide informative but inherently incomplete signals of ESG outcomes and may themselves be shaped by broader strategic choices, including capital structure decisions and market timing behavior. By jointly emphasizing predictive Accuracy and interpretability, this study offers a practical analytical framework for integrating ESG considerations into financial analysis, regulatory oversight, and early-warning systems, while highlighting the critical importance of industry-specific perspectives in ESG research.
6. Conclusions
This research confirms that corporate ESG performance in a small open economy can be systematically anticipated using financial architecture. By transitioning from traditional linear models to ensemble machine learning, we have captured the complex, non-linear “signals” that connect a firm’s financial health to its sustainability outcomes.
Our Findings Offer Three Primary Insights
(1) Validation of Financial Slack: The consistent dominance of ROA and Firm Size as predictors validates the Slack Resources Hypothesis, suggesting that efficient asset utilization and operational scale are foundational prerequisites for absorbing the high fixed costs of ESG integration.
(2) Sectoral Specificity: We demonstrate that the “financial engine” of sustainability is not uniform. Sustainability in the financial sector is driven by “outside-in” market pressures (Tobin’s Q), whereas the semiconductor and heavy industries rely on “inside-out” operational capacity and organizational maturity.
(3) Predictive Limits: The modest explanatory power (R2 of 0.04 to 0.11) across all ML models indicates that financial resources are an antecedent rather than a sole determinant. This underscores the likely influence of unobserved factors such as internal corporate culture, executive incentive alignment, and firm-specific governance structures.
Policy and Practical Implications
The extraction of auditable “if-then” decision rules moves this research beyond “black-box” prediction into the realm of practical diagnostics. These derived thresholds-such as specific ROA floors and size benchmarks-provide a quantitative “smoke detector” for ESG risk. For regulators, this framework offers a replicable method to flag potential “greenwashing” by identifying firms whose financial fundamentals are at odds with their sustainability claims. For investors, it provides a screening tool that supplements qualitative due diligence with hard financial evidence.
Limitations and Future Research
While this study provides a robust early-warning framework for the Taiwanese market, future research should integrate unstructured alternative data-such as real-time news sentiment or LLM-derived disclosure metrics-to improve predictive Accuracy. Furthermore, longitudinal studies could further investigate the “virtuous circle” framework to determine the precise lead-lag relationship between ESG investments and long-term financial resilience.
Author Contributions
Resources, Software, Data Curation, Methodology, writing—Original Draft: H.-J.X.; Supervision, Software, Validation, Methodology, Conceptualization: T.-N.C.; Formal Analysis, Methodology, Supervision, writing—Review & Editing: J.-F.L.; Conceptualization, writing—Review & Editing: K.-K.L. All authors have read and agreed to the published version of the manuscript.
Funding
This research received no specific grant from any funding agency in the public, commercial, or not-for-profit sectors.
Institutional Review Board Statement
Not applicable. This study is based on secondary bibliometric data and does not involve human participants or animals.
Data Availability Statement
The data supporting the findings of this study are available from the corresponding author upon reasonable request.
Conflicts of Interest
The authors declare that they have no known competing financial interests or personal relationships that could have appeared to influence the work reported in this paper.
Appendix A
To optimize model’s performance, hyperparameter tuning was conducted using an exhaustive grid search integrated with 5-fold cross-validation. This approach ensured that the selected parameters generalize well to unseen data. The optimal configurations are listed in the table below:
Table A1.
Hyperparameter of the exhaustive grid search integrated with 5-fold cross-validation.
Table A1.
Hyperparameter of the exhaustive grid search integrated with 5-fold cross-validation.
| Model | Hyperparameter | Optimized Value |
|---|
| XGBoost | Learning Rate (eta) | 0.1 |
| | Max Depth | 6 |
| | L2 Regularization (lambda) | 1 |
| | Gamma | 0 |
| Random Forest | Node size | 25 |
| | mtry | 3 |
| | ntree | 300 |
References
- Ziolo, M.; Filipiak, B.Z.; Bąk, I.; Cheba, K. How to design more sustainable financial systems: The roles of environmental, social, and governance factors in decision-making. Sustainability 2019, 11, 5604. [Google Scholar] [CrossRef]
- Candio, P. The influence of ESG score on financial performance: Evidence from the European health care industry. Strateg. Change 2024, 33, 417–427. [Google Scholar] [CrossRef]
- Bank for International Settlements. The Green Swan: Central Banking and Financial Stability in the Age of Climate Change; Bank for International Settlements: Basel, Switzerland, January 2020; Available online: https://EconPapers.repec.org/RePEc:bis:bisbks:31 (accessed on 15 February 2026).
- Kotsantonis, S.; Serafeim, G. Four things no one will tell you about ESG data. J. Appl. Corp. Financ. 2019, 31, 50–58. [Google Scholar] [CrossRef]
- Jámbor, A.; Zanócz, A. The diversity of environmental, social, and governance aspects in sustainability: A systematic literature review. Sustainability 2023, 15, 13958. [Google Scholar] [CrossRef]
- Yoon, B.; Lee, J.H.; Byun, R. Does ESG performance enhance firm value? Evidence from Korea. Sustainability 2018, 10, 3635. [Google Scholar] [CrossRef]
- De Lucia, C.; Pazienza, P.; Bartlett, M. Does good ESG lead to better financial performances by firms? Sustainability 2020, 12, 5317. [Google Scholar] [CrossRef]
- Segura, L.C.; Naser, A.; Abreu, R.; Perez-Lopez, J.A. ESG dimensions and corporate value: Insights for sustainable investments. Sustainability 2024, 16, 7376. [Google Scholar] [CrossRef]
- Friede, G.; Busch, T.; Bassen, A. ESG and financial performance: Aggregated evidence from more than 2000 empirical studies. J. Sustain. Financ. Invest. 2015, 5, 210–233. [Google Scholar] [CrossRef]
- Momtaz, P.P.; Parra, I.M. Is sustainable entrepreneurship profitable? Small Bus. Econ. 2024, 63, 1535–1564. [Google Scholar] [CrossRef]
- Jin, I. ESG-screening and factor-risk-adjusted performance: The concentration level of screening does matter. J. Sustain. Financ. Invest. 2022, 12, 1125–1145. [Google Scholar] [CrossRef]
- Cesarone, F.; Martino, M.L.; Carleo, A. Does ESG impact really enhance portfolio profitability? Sustainability 2022, 14, 2050. [Google Scholar] [CrossRef]
- Nian, H.; Said, F.F. The impact of ESG on firm risk and financial performance: A systematic literature review. J. Scientometr. Res. 2025, 13, s144–s155. [Google Scholar] [CrossRef]
- Lins, K.V.; Servaes, H.; Tamayo, A. Social capital, trust, and firm performance: The value of corporate social responsibility during the financial crisis. J. Financ. 2017, 72, 1785–1824. [Google Scholar] [CrossRef]
- Krauss, C.; Do, X.A.; Huck, N. Deep neural networks, gradient-boosted trees, random forests: Statistical arbitrage on the S&P 500. Eur. J. Oper. Res. 2017, 259, 689–702. [Google Scholar] [CrossRef]
- Lanza, A.A.G.; Bernardini, E.; Faiella, I. Mind the Gap! Machine Learning, ESG Metrics and Sustainable Investment; Bank of Italy Occasional Papers No. 561 2020; Bank of Italy: Rome, Italy, 2020. [Google Scholar] [CrossRef]
- Lee, O.; Joo, H.; Choi, H.; Cheon, M. An integrated approach to analyzing ESG data via machine learning and deep learning algorithms. Sustainability 2022, 14, 8745. [Google Scholar] [CrossRef]
- Jiang, X. Predicting corporate ESG scores using machine learning: A comparative study. Adv. Econ. Manag. Political Sci. 2024, 118, 141–147. [Google Scholar] [CrossRef]
- Aue, T.; Jatowt, A.; Färber, M. Predicting company ESG ratings from news articles using multivariate time series analysis. In Proceedings of the Companion Proceedings of the ACM Web Conference; ACM: New York, NY, USA, 2025; pp. 1774–1780. [Google Scholar] [CrossRef]
- Del Vitto, A.; Marazzina, D.; Stocco, D. ESG ratings explainability through machine learning techniques. Ann. Oper. Res. 2023. [Google Scholar] [CrossRef]
- Zou, Y.; Shi, M.; Chen, Z.; Deng, Z.; Lei, Z.; Zeng, Z.; Yang, S.; Tong, H.; Xiao, L.; Zhou, W. ESG Reveal: An LLM-based approach for extracting structured data from ESG reports. J. Clean. Prod. 2025, 489, 144572. [Google Scholar] [CrossRef]
- Waddock, S.A.; Graves, S.B. The corporate social performance financial performance link. Strateg. Manag. J. 1997, 18, 303–319. [Google Scholar] [CrossRef]
- McGuire, J.B.; Sundgren, A.; Schneeweis, T. Corporate social responsibility and firm financial performance. Acad. Manag. J. 1988, 31, 854–872. [Google Scholar] [CrossRef]
- Porter, M.E.; van der Linde, C. Toward a new conception of the environment-competitiveness relationship. J. Econ. Perspect. 1995, 9, 97–118. [Google Scholar] [CrossRef]
- Edmans, A. Does the stock market fully value intangibles? Employee satisfaction and equity prices. J. Financ. Econ. 2011, 101, 621–640. [Google Scholar] [CrossRef]
- Eccles, R.G.; Ioannou, I.; Serafeim, G. The impact of corporate sustainability on organizational processes and performance. Manag. Sci. 2014, 60, 2835–2857. [Google Scholar] [CrossRef]
- Albuquerque, R.; Koskinen, Y.; Yang, S.; Zhang, C. Corporate social responsibility and firm risk: Theory and empirical evidence. Manag. Sci. 2019, 65, 4451–4469. [Google Scholar] [CrossRef]
- Ioannou, I.; Serafeim, G. What drives corporate social performance? The role of nation-level institutions. J. Int. Bus. Stud. 2012, 43, 834–864. [Google Scholar] [CrossRef]
- Gompers, P.A.; Ishii, J.L.; Metrick, A. Corporate governance and equity prices. Q. J. Econ. 2003, 118, 107–156. [Google Scholar] [CrossRef]
- Goss, A.; Roberts, G.S. The impact of corporate social responsibility on the cost of bank loans. J. Bank. Financ. 2011, 35, 1794–1810. [Google Scholar] [CrossRef]
- Fatemi, A.; Glaum, M.; Kaiser, S. ESG performance and firm value: The moderating role of disclosure. Glob. Financ. J. 2018, 38, 45–64. [Google Scholar] [CrossRef]
- Salzberg, S.L. C4.5: Programs for Machine Learning by J. Ross Quinlan; Morgan Kaufmann Publishers, Inc.: Burlington, MA, USA, 1993; Volume 16, pp. 235–240. [Google Scholar] [CrossRef]
- Breiman, L. Bagging predictors. Mach. Learn. 1996, 24, 123–140. [Google Scholar] [CrossRef]
- Freund, Y.; Schapire, R.E. A decision-theoretic generalization of on-line learning and an application to boosting. J. Comput. Syst. Sci. 1997, 55, 119139. [Google Scholar] [CrossRef]
- Hastie, T.; Tibshirani, R.; Friedman, J. The Elements of Statistical Learning, 2nd ed.; Springer: Berlin/Heidelberg, Germany, 2009. [Google Scholar]
| Disclaimer/Publisher’s Note: The statements, opinions and data contained in all publications are solely those of the individual author(s) and contributor(s) and not of MDPI and/or the editor(s). MDPI and/or the editor(s) disclaim responsibility for any injury to people or property resulting from any ideas, methods, instructions or products referred to in the content. |
© 2026 by the authors. Published by MDPI on behalf of the International Institute of Knowledge Innovation and Invention. Licensee MDPI, Basel, Switzerland. This article is an open access article distributed under the terms and conditions of the Creative Commons Attribution (CC BY) license.