


Abstract
Coordinating operating room schedules with downstream inpatient bed availability remains a critical challenge for hospitals, particularly under emergency-driven uncertainty. Emergency arrivals introduce variability that propagates congestion across surgical and inpatient systems, reducing elective surgery throughput and resource utilization. Existing approaches often treat operating rooms and inpatient beds as isolated planning problems, limiting the ability to anticipate system-wide congestion effects. This study proposes a system-level decision-support framework that integrates elective operating room scheduling, emergency arrivals, and inpatient bed capacity within a unified stochastic optimization model. Uncertainty in surgical duration and patient length of stay is represented through scenario-based stochastic modeling. Computational experiments examine system performance under varying levels of emergency demand and bed availability. The results identify critical congestion thresholds beyond which elective throughput deteriorates rapidly, highlighting the role of downstream bed constraints in governing system capacity under uncertainty. The proposed framework provides hospital managers with practical insights for coordinated surgical and inpatient capacity planning, bridging operations research optimization with operations management principles at the system level.
1. Introduction
Adequate operating room (OR) planning and scheduling are crucial for the overall functioning of any hospital, as they significantly impact patient outcomes, hospital revenue, and resource utilization. The OR is the most resource-intensive part of a hospital, and it can cost up to 40% of the institution’s overall expenses [1]. At the same time, it generates a substantial share of hospital revenue [2].
It is often said that the OR is the hospital’s economic engine because it generates significant revenue but also incurs substantial costs due to the need for highly trained personnel, expensive equipment, and essential support systems. This makes it a high priority for both administrators and physicians to manage it well. It is more challenging to schedule ORs because they must handle both elective and emergency cases, ensuring that recovery beds and surgical wards are available.
There are several major taxonomies for operating room scheduling problems, each with distinct objectives and constraints. These classifications include, for example, case-mix scheduling problems, which focus on allocating the mixing and sequencing of surgical cases in available operating rooms. The goal is to maximize resource utilization and balance patient needs, like the model by Yahia et al. (2016) [3]. Their model determines the number of procedures to perform, the time to spend in the operating room, and the number of beds to allocate to each specialization. It does this while considering random restrictions and maximizing service levels.
Additionally, the classification could depend on decision level, scheduling policy, and uncertainty treatment, as will be discussed in the review of the related literature.
Poorly planned OR schedules can lead to resources being underutilized or overutilized, longer wait times for patients, unhappy staff, and ultimately, lower patient safety and quality of treatment. Efficient administration of ORs not only increases the hospital’s profits, but it also improves the care that patients receive. This is why it is a significant area of concentration for hospital operations research [4]. Additionally, the growing demand for surgical services, combined with limited resources and rising patient expectations, necessitates the implementation of robust scheduling systems that can adapt to changing and unpredictable situations [5]. In practice, to respond to emergencies, hospital managers block one or two operating rooms to receive emergency cases, effectively achieving this objective but simultaneously reducing the utilization of the rooms.
“OR” scheduling is a complex problem, as different stakeholders have varying objectives that often conflict with one another. From the hospital’s point of view, important goals are to maximize the OR’s efficiency, minimize operational expenses, and maintain consistent occupancy levels in downstream units like recovery rooms and wards. Hospitals also aim to reduce overtime, balance their staff’s workloads, and maximize the utilization of their limited resources, such as anesthesiologists and nurses. From the patient’s perspective, the primary goals are to reduce wait times for surgery, ensure timely access to care, minimize the likelihood of cancellations or delays of elective surgeries, and promptly handle emergency cases. These factors are crucial for patient satisfaction because extended wait times and last-minute schedule changes can cause anxiety, discomfort, and a decrease in recovery rates [6]. To be effective, OR scheduling needs to strike a balance between operational efficiency and patient-centered care. This typically involves utilizing multi-objective optimization frameworks that can accommodate a range of objectives, some of which may conflict with one another [7].
One of the main aspects that makes the OR scheduling challenge so tricky is that numerous factors can go wrong, potentially ruining even the best-laid plans. The most significant factor contributing to uncertainty is that operating times may vary due to factors such as the patient’s condition, the complexity of the procedure, and unexpected events that occur during the surgery [1,7]. Other factors that can cause uncertainty include emergency cases arriving at unpredictable times, fluctuations in patient demand, staff unavailability, equipment breakdowns, and the lack of available recovery beds and critical care units [8].
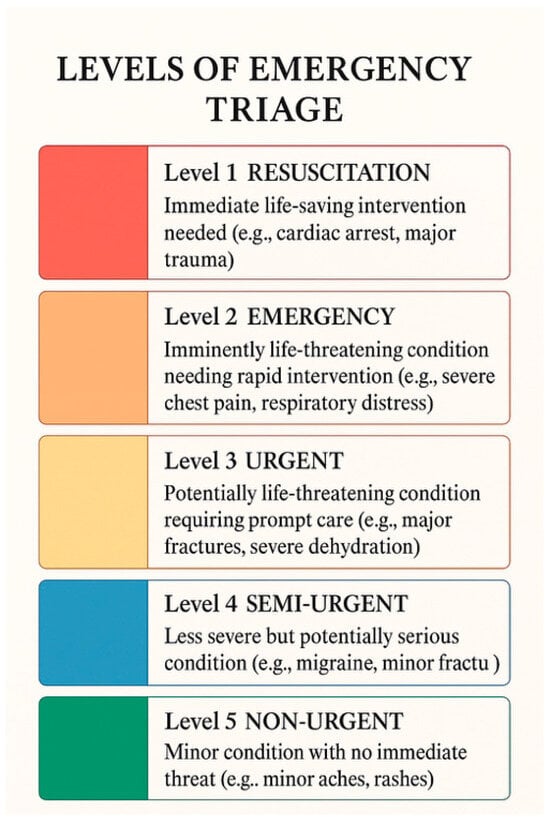
Managing emergency cases is a unique challenge in OR scheduling, as these cases often require immediate or high-priority access to surgical resources, which may necessitate rescheduling elective procedures. Standardized triage methods, such as the Emergency Severity Index (ESI), are typically used to categorize emergency cases into five levels, as illustrated in Figure 1, based on the severity of their condition. Level 1 is the most urgent, and Level 5 is the least urgent.
Figure 1.
Emergency Severity Index (ESI) triage levels (adapted from standard clinical guidelines).
This system ensures that the most seriously ill patients receive priority access to the operating room while also facilitating the allocation of resources to less urgent situations when space is available. Scheduling surgeries in the OR does not happen in a vacuum; it depends on the availability and capacity of other hospital units, both upstream and downstream. Preoperative evaluation clinics and surgical wards are examples of upstream units. These are places where patients prepare for surgery and may require preoperative optimization. Post-Anesthesia Care Units (PACUs), Intensive Care Units (ICUs), and general wards are the main types of downstream units. These are where patients recover after surgery [8].
The fact that these units depend on each other creates a complex web of restrictions that must be considered when making plans. For instance, if there are not enough recuperation beds, surgery may have to be put off or even cancelled. At the same time, problems in the ICU can keep high-acuity surgical patients from being admitted. To maximize resource utilization and ensure patients move smoothly, integrated scheduling models that consider OR capacity, staff availability, and bed occupancy across the entire care continuum are needed. Patients who require elective surgery are typically assigned a priority level based on the urgency of their condition, the potential benefits of the surgery, and the likelihood that their condition will worsen if treatment is delayed. Countries around the world prioritize elective cases in various ways, including the length of time people have to wait, scoring systems, and clinical recommendations [6,9].
The goal of these prioritization methods is to ensure that patients who need surgery the most receive it as soon as possible. They also help make the management of surgical waiting lists more open, fair, and efficient. In places with high demand and limited space, where tough choices must be made between competing instances, it is essential to incorporate these types of systems into OR scheduling models.
From a system perspective, ORs cannot be planned in isolation. Emergency arrivals and downstream bed congestion create feedback loops that directly affect elective throughput, overtime, and patient access. Decision-makers, therefore, require planning tools that explicitly capture these interactions rather than optimizing OR schedules independently. The primary objective of this study was to develop an integrated stochastic decision-support framework for operating room scheduling that jointly considers elective and emergency surgeries under uncertainty in procedure duration and inpatient bed availability.
This study contributes to healthcare operations management by developing an integrated decision-support framework for coordinating operating room schedules with inpatient bed availability under emergency arrivals. The framework explicitly captures how emergency-induced congestion propagates across surgical and inpatient resources, allowing hospital managers to evaluate trade-offs between elective throughput, utilization, and robustness.
Unlike prior studies that address OR scheduling or bed management in isolation, this work provides a system-level perspective by jointly modeling elective scheduling decisions, emergency disruptions, and downstream capacity constraints. The proposed approach enables planners to identify congestion thresholds and capacity stress points that critically affect system performance.
Through computational experiments, the study generates practical insights into how emergency pressure and bed scarcity interact, supporting more informed and robust hospital planning decisions.
This study contributes to the literature from two complementary perspectives. From an operations research standpoint, it proposes a stochastic optimization framework that integrates elective surgery scheduling with uncertainty arising from emergency arrivals. From an operations management perspective, the study provides system-level insights into capacity coordination between operating rooms and inpatient beds, highlighting congestion propagation effects and planning thresholds. By explicitly bridging these two perspectives, the proposed framework addresses an important gap in the literature, where operations research scheduling models and operations management capacity planning studies are often developed in isolation.
The structure of this article is as follows. Section 2 gives an overview of the relevant literature. Section 3 delves into the problem in great depth. Section 4 discusses the proposed mathematical model that could be used to address this type of problem. Section 5 presents the solution to the problem, and Section 6 outlines the numerical experiments, including an analysis and discussion of the results. Ultimately, Section 7 concludes the work and provides suggestions for future actions.
2. Review of Related Literature
OR planning and scheduling are a key part of running a hospital. It has a direct effect on patient outcomes, hospital efficiency, and expenses. The difficulty of OR scheduling comes from having to divide up limited resources—surgical rooms, staff, and postoperative beds—among a diverse group of elective and emergency patients, all while dealing with uncertainties like how long surgeries will take, when emergencies will happen, and how long patients will stay in recovery units. Recent advancements in stochastic optimization and simulation have enabled the development of scheduling models that are more realistic, flexible, and more accurately reflect real-life scenarios. This review synthesizes the most recent research on stochastic OR planning and scheduling, with a focus on integrating elective and emergency surgeries, as well as the significant constraints that bed availability imposes on these plans. The review is structured to provide an overview of the OR scheduling problem, examine its main features and uncertainties, discuss approaches to handling emergency cases, and finally highlight the gaps in current research that led to this study.
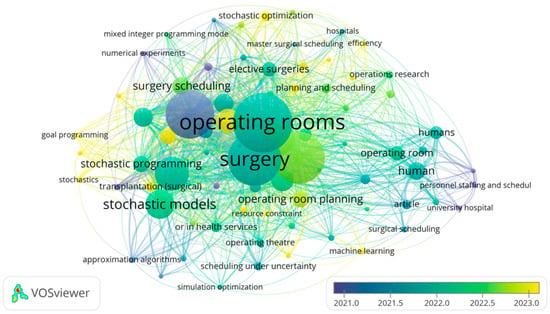
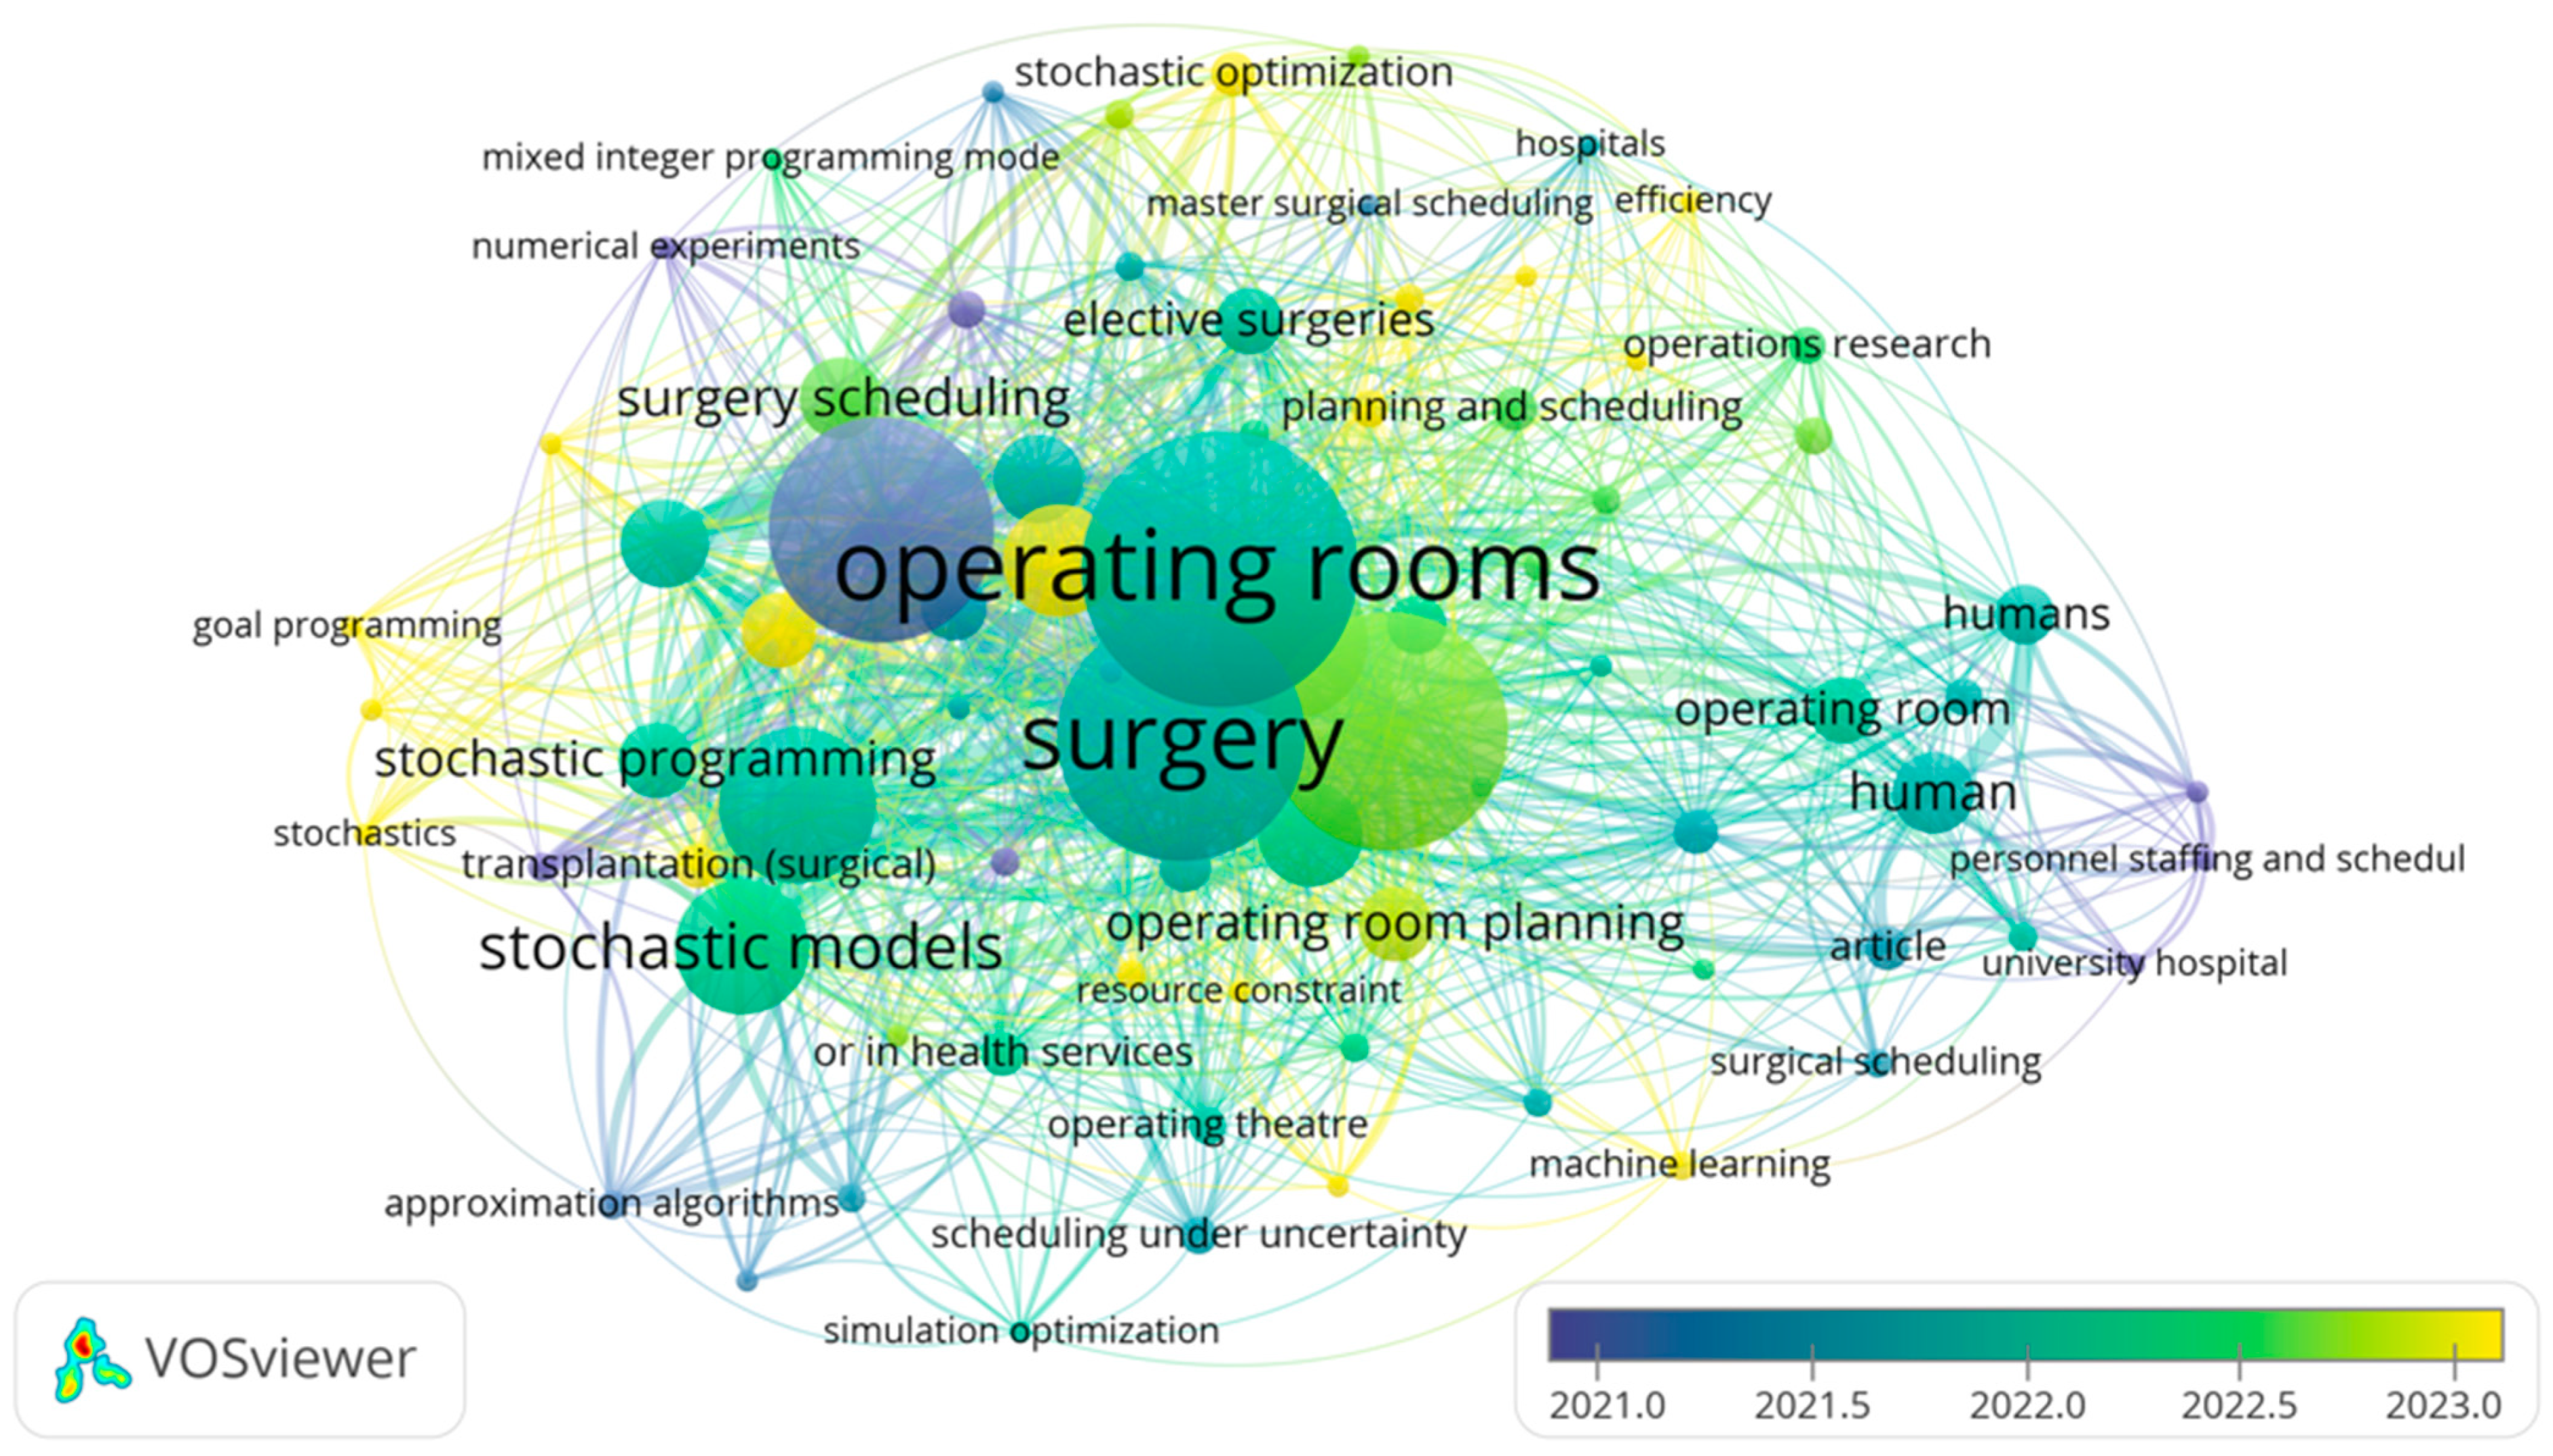
A bibliometric analysis of keyword co-occurrence in the domain of operating room research was conducted using VOS viewer version 1.6.20, as shown in Figure 2, revealing several prominent clusters that reflect key research themes.
Figure 2.
VOS viewer co-occurrence map of keywords.
The visualization reveals that “surgery” and “operating rooms” are the dominant terms, both in terms of frequency and network centrality, indicating their pivotal roles in recent studies. Surrounding these terms are several major clusters representing distinct yet interconnected research themes. One significant cluster centers on stochastic modelling and optimization, including keywords such as “stochastic programming”, “stochastic models”, and “scheduling under uncertainty”, reflecting the emphasis on incorporating uncertainty into operating room planning. Another cluster relates to planning and scheduling strategies, with terms like “surgery scheduling”, “operating room planning”, “elective surgeries”, and “resource constraint”, highlighting the ongoing efforts to improve efficiency in surgical resource allocation. Additionally, a third cluster captures human and institutional aspects, where terms such as “human”, “personnel staffing”, and “university hospital” suggest a growing interest in human-centered and organizational considerations in operating room management. Notably, the color gradient indicates that newer studies (yellow nodes) are increasingly focused on areas such as “stochastic optimization” and “master surgical scheduling”, revealing emerging research directions and technological adoption in the field.
2.1. OR Planning and Scheduling Problem
Cardeon et al. (2010) [10] provide a thorough review of operational research in OR planning and scheduling. They classify the literature by decision levels, uncertainty modeling, and solution techniques. Their work serves as a key reference for understanding the structure and challenges of OR scheduling and is often cited in both methodical and practical research in this area. A common framework for OR planning and scheduling breaks decision-making into three levels:
- Strategic (Long-Term) Level: This includes high-level decisions like determining the number and type of ORs, establishing opening hours, and allocating total OR time among surgical specialties. This level is often referred to as the case-mix planning problem.
- Tactical (Medium-Term) Level: Here, Master Surgery Schedules (MSS) are created, assigning OR time blocks to different specialties or teams over a planning period (weeks or months). The goal is to distribute workload and resources effectively while considering both upstream and downstream capacity limits.
- Operational (Short-Term) Level: This level focuses on the detailed sequencing and assignment of individual surgeries to specific ORs and time slots. It also involves making real-time adjustments to handle emergencies and delays. While these three levels are conceptually different, they are connected and often overlap in real-world applications. For instance, decisions made at the strategic level, such as allocating ORs to specialties, impact the tactical and operational scheduling processes. The literature also emphasizes the need to integrate these levels to create flexible and responsive schedules that can adjust to both predictable and unexpected changes in demand and resource availability.
According to Jung et al. (2019) [11], hospitals face a key trade-off between maximizing OR usage for elective surgeries and remaining responsive to emergencies. This challenge is particularly intense in trauma centers and large hospitals, where the unpredictable arrival of emergency cases can significantly disrupt planned schedules. They also worked on developing models that can produce both aggregate (weekly) and detailed (daily) schedules, including uncertain factors like fluctuating surgery times and random emergency arrivals. These models aim to reduce idle time, overtime, and the overall expected costs of surgery delays and rescheduling.
2.2. Characteristics of OR Scheduling Under Uncertainty
2.2.1. Uncertainty in Surgery Duration and Length of Stay (LOS)
The fact that operation times and patient recovery times are random is a key part of the OR scheduling dilemma. As Kamran et al. (2018) [12] discussed, the length of surgery can be affected by the complexity of the case, the type of procedure being performed, and the events that occur during the surgery. If you ignore this fluctuation, you may have to work more overtime, experience more idle time, and reschedule frequently. Strum et al. (2000) [13] used hospital data to fit log-normal distributions to the lengths of surgeries and Poisson distributions to the number of emergency room visits. This makes it possible to describe uncertainty more realistically.
Another significant source of uncertainty is the duration of time people spend in recovery units, such as the PACU and ICU. Longer LOS due to issues can cause problems later on, making it harder to stick to planned timetables and raising the chance that surgeries will be cancelled [14]. Stochastic models now often include LOS variability; these use past data to determine distributions and find the optimal balance between OR throughput and bed occupancy risk [5].
2.2.2. Patient Types in the OR Scheduling Problem
Operating room schedules must accommodate a diverse patient mix, as Wang et al. discussed in their review [15]:
- Elective inpatients: Scheduled in advance, often requiring postoperative beds and extended recovery.
- Elective outpatients: Less complex, typically discharged the same day, placing fewer demands on beds.
- Emergency patients: Arrive unpredictably and require immediate or high-priority intervention, frequently disrupting elective schedules.
2.2.3. Bed Availability Constraints
The availability of beds in the PACU and ICU is a crucial but often overlooked factor in scheduling surgeries. Lack of beds can lead to surgeries being postponed, longer waiting times, and suboptimal patient care. Integrated models that optimize OR and bed allocation simultaneously in the face of uncertainty are becoming increasingly common. Their goal is to decrease bottlenecks and increase patient flow. For instance, Tsang et al. (2025) [16] developed stochastic programming methods that explicitly considered downstream capacity restrictions. This demonstrates the importance of having easy-to-use, data-driven solutions that can be applied in real-world hospital settings.
2.3. Emergency Surgery Management Approaches
Emergency surgeries are a big problem for OR scheduling because they come at random times and are so important. Hence, hospitals often have to move or cancel elective cases. This makes things less efficient, which in turn makes both patients and staff unhappy.
Hospitals employ various methods to manage the unpredictable arrival of emergency surgical cases and maintain elective surgery schedules as consistently as possible. Setting up a separate OR for emergencies is a common way to ensure someone’s job is done. Having a dedicated OR makes it easier for emergency patients to receive the care they need quickly, reduces cancellations and overruns in elective rooms, and increases the percentage of emergency cases that are handled within the target timeframes. For instance, one hospital noticed a significant drop in elective case cancellations and overrun minutes after setting up a separate emergency OR. They also had faster wait times for priority emergency cases [17].
Some hospitals have implemented the strategy of closing a dedicated emergency operating room and instead spreading the reserved emergency capacity across all elective ORs. A large-scale empirical study at Erasmus MC, Netherlands, found that while this policy led to a slight increase in overall operating room utilization, it also resulted in a significant increase in staff overtime and the number of rooms running after scheduled exit times. The analysis concluded that real-world implementation of this approach may not deliver the overtime savings predicted by earlier simulation models and that efficiency outcomes vary between institutions [18].
Another way to run things is to use “break-in moments”. This means intentionally arranging brief elective surgeries early in the day, so that there are times when emergency cases can be handled with minimal disruption to the overall schedule [19]. This technique helps spread out elective surgery start times, reducing bottlenecks and allowing for more flexible integration of urgent cases.
According to Miao and Wang [20], break-in moments are not particularly suitable for emergencies because they can easily exceed the time limit for emergencies, which is why they employed buffer times. The preventive-reactive scheduling paradigm they developed represents a significant step forward in emergency management. Their concept allows emergency cases to “break into” the elective schedule at times chosen on the fly, thanks to time buffers spread throughout the day. Important features are:
- Waiting time limits: Ensuring emergency patients are assigned to an OR within a specific time window.
- Dynamic rescheduling: Real-time adjustment of elective schedules to accommodate emergencies.
- Distributed buffers: Small time buffers are scattered throughout the schedule, reducing elective cancellations and idle time compared to large, dedicated emergency blocks.
Despite extensive research on stochastic OR scheduling, existing studies often treat operating rooms and inpatient beds as separate planning problems. This separation limits the ability of decision-makers to anticipate how emergency-induced congestion propagates across hospital subsystems. Consequently, there remains a clear need for integrated decision-support frameworks that explicitly capture these interdependencies at the system level, motivating the approach proposed in this study.
2.4. Research Gaps and Article Contributions
The preventive–reactive scheduling framework proposed by Miao and Wang [20] provides an important foundation for this research. After reviewing the relevant literature, research gaps have been identified as follows:
- A scarcity of stochastic models that account for inpatient bed availability when scheduling elective surgeries.
- A lack of research that integrates all critical factors, including both elective and emergency patient types, bed capacity constraints, and elective patient prioritization.
Based on these gaps, the objectives of this study were as follows:
The integration of stochastic modeling to address uncertainty in surgery duration and patients’ LOS for cases requiring hospitalization, while also considering bed occupancy constraints for inpatients.
2.5. Theoretical Framework
To address the complexities of hospital capacity planning, this study adopted a dual-perspective framework that integrates operations research and operations management.
From an operations research perspective, the study focused on the development of a novel stochastic mixed-integer linear programming model. This involved the mathematical abstraction of surgical durations, emergency arrivals, and bed occupancy as stochastic variables, solved via Sample Average Approximation to achieve computational robustness.
From an operations management perspective, the framework treats the hospital as an integrated system rather than isolated units. It focuses on “Patient Flow Theory”, where the bottleneck is not just the operating room but the downstream bed availability. The goal is to provide managerial insights regarding system-level performance, such as identifying congestion thresholds and balancing the trade-offs between elective throughput and emergency responsiveness.
By bridging these two perspectives, the proposed decision-support framework moves beyond mere mathematical optimization to provide actionable strategies for hospital administrators.
The proposed framework operationalizes pull-based control principles described in Factory Physics [21]. Specifically, elective surgeries function as WIP (work-in-process) releases that are constrained by downstream capacity availability rather than upstream OR efficiency alone. This is implemented through constraint (14), which prevents elective scheduling when the projected bed occupancy exceeds the available capacity N. Similarly, Constraints (9) and (10) serve as protective buffers against emergency-induced variability—analogous to safety stock in manufacturing systems [22]. By embedding these operations management principles within a mathematical optimization framework, the model ensures that surgical releases are governed by system-wide flow balance rather than local resource maximization.
The detailed operational mechanisms through which this integration takes place are described in the following section.
2.6. System Perspective and Operations Management-Operations Research Integration
While operating room scheduling models traditionally focus on optimizing surgical resources in isolation, hospital performance is ultimately determined by the coordination of multiple interdependent subsystems. From an operations management perspective, the hospital functions as an integrated production system in which patient flow spans preoperative units, operating rooms, and downstream inpatient wards. Decisions made at one stage inevitably affect congestion, delays, and resource utilization in others.
In this study, integration is achieved by explicitly linking operating room scheduling decisions with inpatient bed availability through a system-level planning perspective. Rather than treating the operating room as the sole bottleneck, the framework adopts a patient flow view in which downstream bed capacity may become the dominant constraint under emergency pressure. This aligns with operations management theories emphasizing flow control, bottleneck management, and capacity coordination, as articulated in classical production system frameworks such as Factory Physics [21] and pull-based control systems [22].
From an organizational standpoint, the proposed framework supports coordination between key hospital decision-makers. Tactical planning decisions—typically overseen by surgical services management and bed management units—are aligned through shared information regarding expected emergency demand, surgery durations, and length-of-stay distributions. The model assumes that hospital planners jointly consider operating room allocations and inpatient bed capacity when constructing elective schedules, rather than addressing these decisions sequentially or independently.
Operationally, the planning process begins with surgical services estimating weekly elective demand based on waiting lists and patient prioritization (captured via the Medical Priority Index). Bed management provides projected baseline bed occupancy and historical emergency arrival distributions (μ and σ). The optimization model then jointly determines feasible elective schedules that satisfy both OR capacity and downstream bed availability, with weekly coordination meetings ensuring alignment between units.
Information integration plays a central role in enabling this coordination. Expected emergency workload parameters, historical surgery duration data, and LOS distributions serve as shared inputs that connect OR planning with inpatient capacity management. By embedding bed occupancy constraints (Equations (12)–(14)) directly into the scheduling model, the framework ensures that elective surgery decisions are feasible from both a surgical and inpatient perspective. As a result, downstream congestion is anticipated rather than reactively managed through cancellations or overtime.
Conceptually, this approach is consistent with pull-based operations management principles, where system release decisions are governed by downstream capacity availability rather than upstream resource efficiency alone. In the hospital context, elective surgeries are effectively “released” into the system only when sufficient downstream bed capacity exists to absorb postoperative demand under uncertainty. Emergency arrivals act as stochastic disturbances that reduce adequate system capacity, reinforcing the need for protective buffers (Equations (9) and (10)) and conservative release decisions.
Table 1 summarizes how key operations management principles from Factory Physics are implemented in the proposed model:
Table 1.
Mapping operations management principles to operations research model implementation.
By positioning the OR scheduling model within this broader OM system perspective, the proposed framework bridges operations research optimization with operations management theory. The mathematical model provides a quantitative mechanism for implementing OM principles such as flow balance, bottleneck protection, and congestion control. At the same time, the resulting solutions offer actionable insights for hospital administrators regarding coordination policies, capacity stress points, and robustness under emergency uncertainty.
3. The Proposed Stochastic Model
This study aims to address this gap by developing a stochastic optimization model using the Sample Average Approximation (SAA) method. The model integrates key uncertainties and operational constraints within a mixed-integer linear programming (MILP) framework. The primary objective is to minimize the total cost, which includes both overtime costs and penalties for not scheduling surgeries on time. By considering the joint impact of emergency arrivals, surgery uncertainty, and inpatient bed availability, the proposed model offers a more realistic and practical approach for OR scheduling in complex hospital environments.
The proposed stochastic model, which will be converted into SAA, was based on the preventive model of Miao et al. [20]. New considerations were added to integrate the following concepts and constraints:
- The bed availability constraints.
- The medical priority index is used to prioritize the scheduled elective surgeries.
- The model now considers both inpatient and outpatient elective surgeries by assigning beds depending on the LOS.
The model aims to reach the following optimum decisions:
- The surgery starting day, the period, and the operating room assigned;
- The surgery occupied periods in the selected OR;
- The overtime used in each OR on each day;
- The days when every inpatient surgery needs a bed through.
3.1. Model Assumptions
- All the operating rooms are considered homogeneous, with no differences in equipment or settings.
- The scheduling horizon is five days, and the model assigns beds to inpatient surgeries based on this assumption. If the LOS continues beyond the horizon, the stay is assumed to be ended and reassigned in the next horizon.
- The medical priority index of each elective patient is previously known on a scale of 1 to 10, where 1 is the least urgent elective surgery, and 10 is the most urgent.
- Overtime is calculated if the room is used after the end of the allowed period on each day.
- Elective surgeries are scheduled according to the model, considering the expected arrival of emergencies within the buffer time.
- The time required to clean and prepare the operating room between successive procedures is not considered in the model.
3.2. Model Terminology
The following indices, parameters, and variables in Table 2 were used:
Table 2.
Indices, parameters, and decision variables.
3.3. Mathematical Formulation
3.3.1. Objective Function
The objective function aims to minimize two types of costs. The first is the cost of not scheduling elective surgery, which depends on the penalty associated with it, pi. This part seeks to schedule the maximum number of elective surgeries during the available periods throughout the horizon. The second cost is the overtime cost when the operating room is used beyond the daily maximum allowed.
3.3.2. Constraints
Constraints (2) and (3) are used to determine the overtime of OR k in day h. The overtime must be equal to or greater than zero. Any time used for surgery after the maximum opening time, T, is considered overtime. Constraint (4) ensures that each surgery can be scheduled at most once across all ORs, times, and days. Constraints (5) and (6) prevent overlapping surgeries in the same operating room, on the same day, and at the same time.
Constraints (7) and (8) ensure that any scheduled surgery occupies consecutive periods equal to the duration of the surgery. Constraints (9) and (10) are the preventive measures for any emergency arrivals, where are the mean and standard deviation of the total OR time that emergency patients will occupy on surgery day. Constraint (10) ensures quick insertion for emergency cases using the slack every 1 + Δ. Constraint (11) prevents surgeries from starting too late to finish within the available time window.
Constraint (12) ensures that if surgery i is scheduled on day h, a bed is used for each day from h to h + Zi − 1. Constraint (13) limits the total bed usage for each patient to no more than their LOS. Constraint (14) limits the total bed usage by all patients on any day to not exceed the available number of beds. Constraint (15) defines the binary nature of decision variables and non-negativity for overtime.
4. Sample Average Approximation (SAA)
To solve the proposed MILP model, the Sample Average Approximation (SAA) is employed. While SAA is an established technique, its application in this study is uniquely tailored to integrate tripartite constraints: emergency-induced buffers, inpatient bed availability, and medical prioritization.
The SAA method is a technique that utilizes Monte Carlo simulation to solve stochastic optimization problems. In this method, a random sample is used to obtain an average sample estimate of the expected objective function of the stochastic issue. Deterministic optimization methods are then employed to address the challenge of determining the sample average. The same approach is applied to other samples to obtain candidate solutions and statistical estimates of how far they are from being optimal [23]. Standard optimization strategies can be used to address this sample average problem. The extent to which the answer changes can be estimated by repeating the same process with several independent samples. Confidence intervals can be generated for the best value and the optimality gap [23,24].
The expected objective function is approximated by the average realizations based on the sample of size S as follows:
The following mathematical model (16)–(30) shows the SAA problem:
Subject to
5. Implementation of the SAA
This section demonstrates how to utilize the SAA to solve the stochastic MILP model in Equations (16)–(30) using a synthesized dataset. GUROBI® 10.0.1 and Python 3.14 were used to implement the model. The workstation was equipped with a 2.10 GHz Intel(R) Xeon(R) Gold 6230R processor and 128 GB of RAM.
5.1. Model Verification and Dataset Description
A comprehensive code review was conducted, including established unit tests, to ensure the model operated as expected and was error-free, thereby verifying the robustness of the proposed MILP model and its implementation. No syntax mistakes were detected when the code was reviewed using syntax error detectors. To ensure the model accurately reflected the problem’s logic and mathematics and did not violate any constraints, small test cases were used for model verification. To further ensure the model’s dependability, consistency checks were run.
The data used as a test bed for the model were randomly synthesized, inspired by information in the literature, as discussed, and some of them were directly used from the original model generated by Miao and Wang [20].
The experimental setup assumes the presence of five operating rooms in the hospital and a sample of 50 patients to be scheduled over a planning horizon of five days (one working week). The available time slots per day, the cost of overtime, the penalty cost for not scheduling surgeries, and other relevant parameters were adopted directly from the study with slight modifications. These details are summarized in Table 3.
Table 3.
Parameters in testbed [20].
For uncertain parameters, such as surgery duration and LOS, they were modeled using the distributions in the literature. The log-normal distribution is most widely supported and recommended for modeling the duration of individual surgical procedures. Extensive retrospective studies, including over 40,000 surgical cases, have demonstrated that the log-normal distribution provides a significantly better fit for surgical procedure times than the normal distribution [13]. The log-normal distribution is used to generate data for surgery duration, with a logarithmic mean of 1 and a logarithmic standard deviation of 0.5. The durations of surgeries used ranged from 1 period (half an hour) to 6 periods (3 h), as this is the range generally used in general surgeries in hospitals worldwide [25]. A Beta-Geometric model has been proposed and shown to fit the LOS data well across multiple specialties, including surgery [26]. The beta-geometric is used to generate data for LOS with a = 2 and b = 5, which is a reasonable starting point for a right-skewed LOS distribution. The minimum LOS in the testbed is 1 for outpatients who stay for a few hours, representing an average of 65% of the total patients and requiring only a bed for one day [27]. The maximum LOS is 4 for general surgeries. Lastly, the medical priority index mentioned earlier is the scenario-based representation of standard hospital triage policies assigned to each patient on a scale of 1 to 10; however, as future work, it would be better to determine it based on multiple factors related to the patient’s age, health conditions, gender, and other relevant factors.
The generated data were designed to simulate a real hospital environment as closely as possible, ensuring that the obtained results reflect realistic scenarios to validate the model. The objective was to optimize the scheduling process by maximizing the number of surgeries performed, considering the patients’ medical conditions, while minimizing both overtime hours and their associated costs.
Table 4 presents the summary of the stochastic test instances used in this study. Each instance was characterized by a specific number of scenarios and replications, while the number of patients, operating rooms, and planning days was kept constant across all experiments.
Table 4.
Summary of test instances.
For each instance, five replications were conducted to account for the stochastic nature of the problem and to ensure the stability of the obtained results. The table also shows the mean and standard deviation of the objective values and solution times.
5.2. Sensitivity Analysis and Computational Results
A sensitivity analysis was conducted to test the SAA solution. The scheduling problem was solved using different sample sizes (S = 5, 10, 20, 30, 40, and 50), with five replications for each sample size, to determine the suitable sample size that yielded stable results.
The following results illustrate how increasing uncertainty exposure through additional scenarios affects system-level performance and planning robustness.
Table 5 shows the objective function value for each replication in each sample. This value, as previously mentioned, depends on the penalty for not scheduling surgery and the overtime cost.
Table 5.
Objective function values.
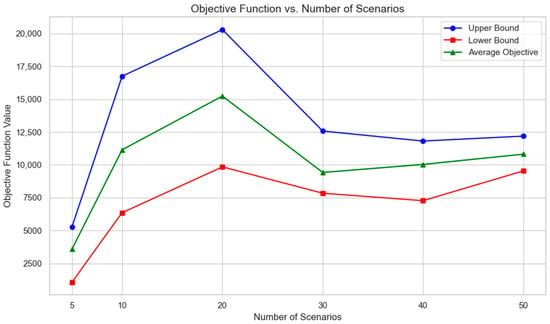
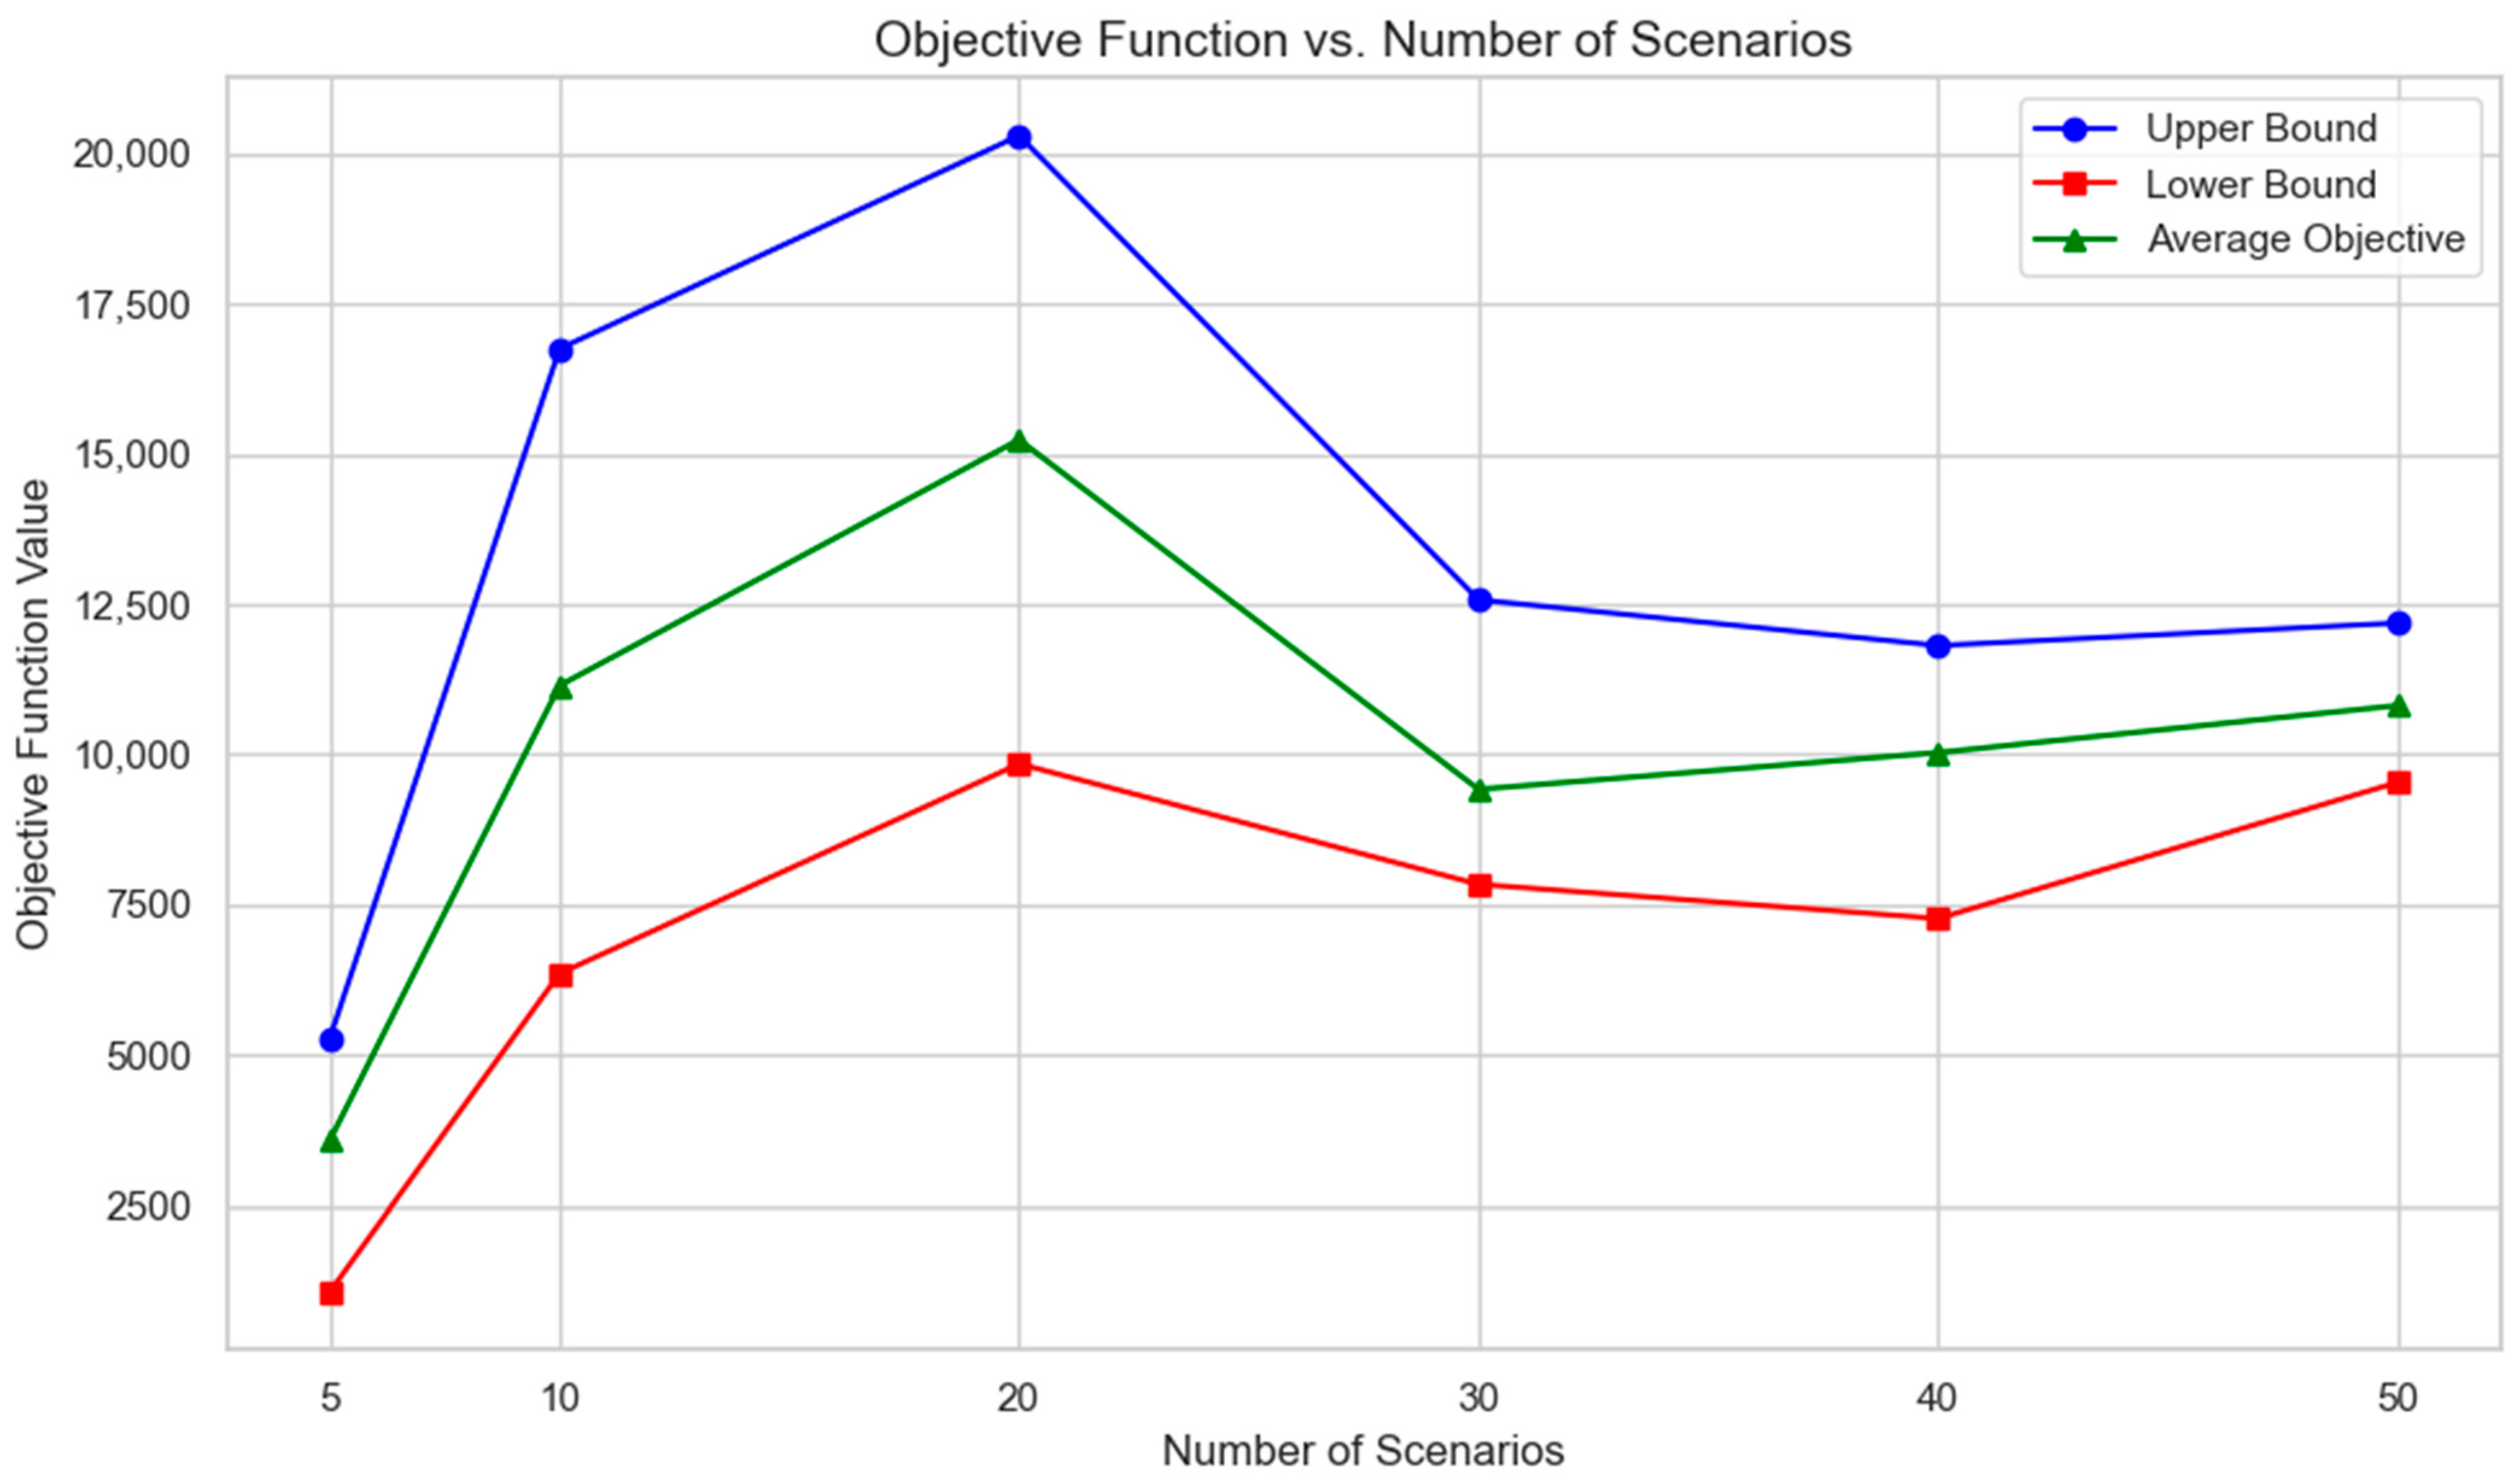
The objective function results indicate that with fewer scenarios, the model can schedule many surgeries without requiring significant overtime, which is reflected in a lower objective function value. However, as the number of scenarios increases, the model tends to become more conservative to accommodate the varying durations of surgeries and lengths of stay. This leads to a higher demand for overtime and consequently increases the objective function value. The upper and lower bounds of the objective function values are illustrated in Table 6 with statistical analysis of the values and Figure 3, which shows that the difference between the upper and lower bound decreased gradually from 10 scenarios to 50, and according to Azab et al. (2025) [28], a suitable sample size to achieve good solution quality within a reasonable computational time is 50 scenarios.
Table 6.
Statistical values of objective functions.
Figure 3.
Objective function limits for each sample size.
The results were analyzed from a system performance perspective, focusing on how emergency arrivals and bed constraints jointly influence elective throughput, overtime, and congestion propagation across hospital resources.
The reported results were averaged over 50 stochastic patient scenarios generated using the same parameter settings described in Table 4.
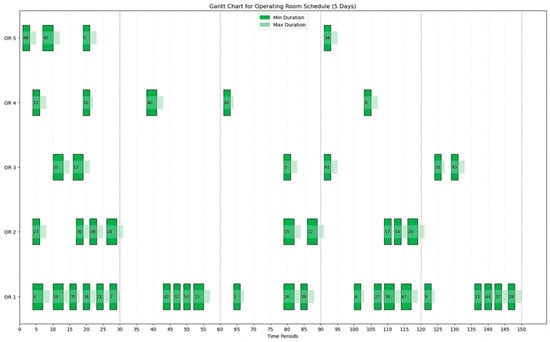
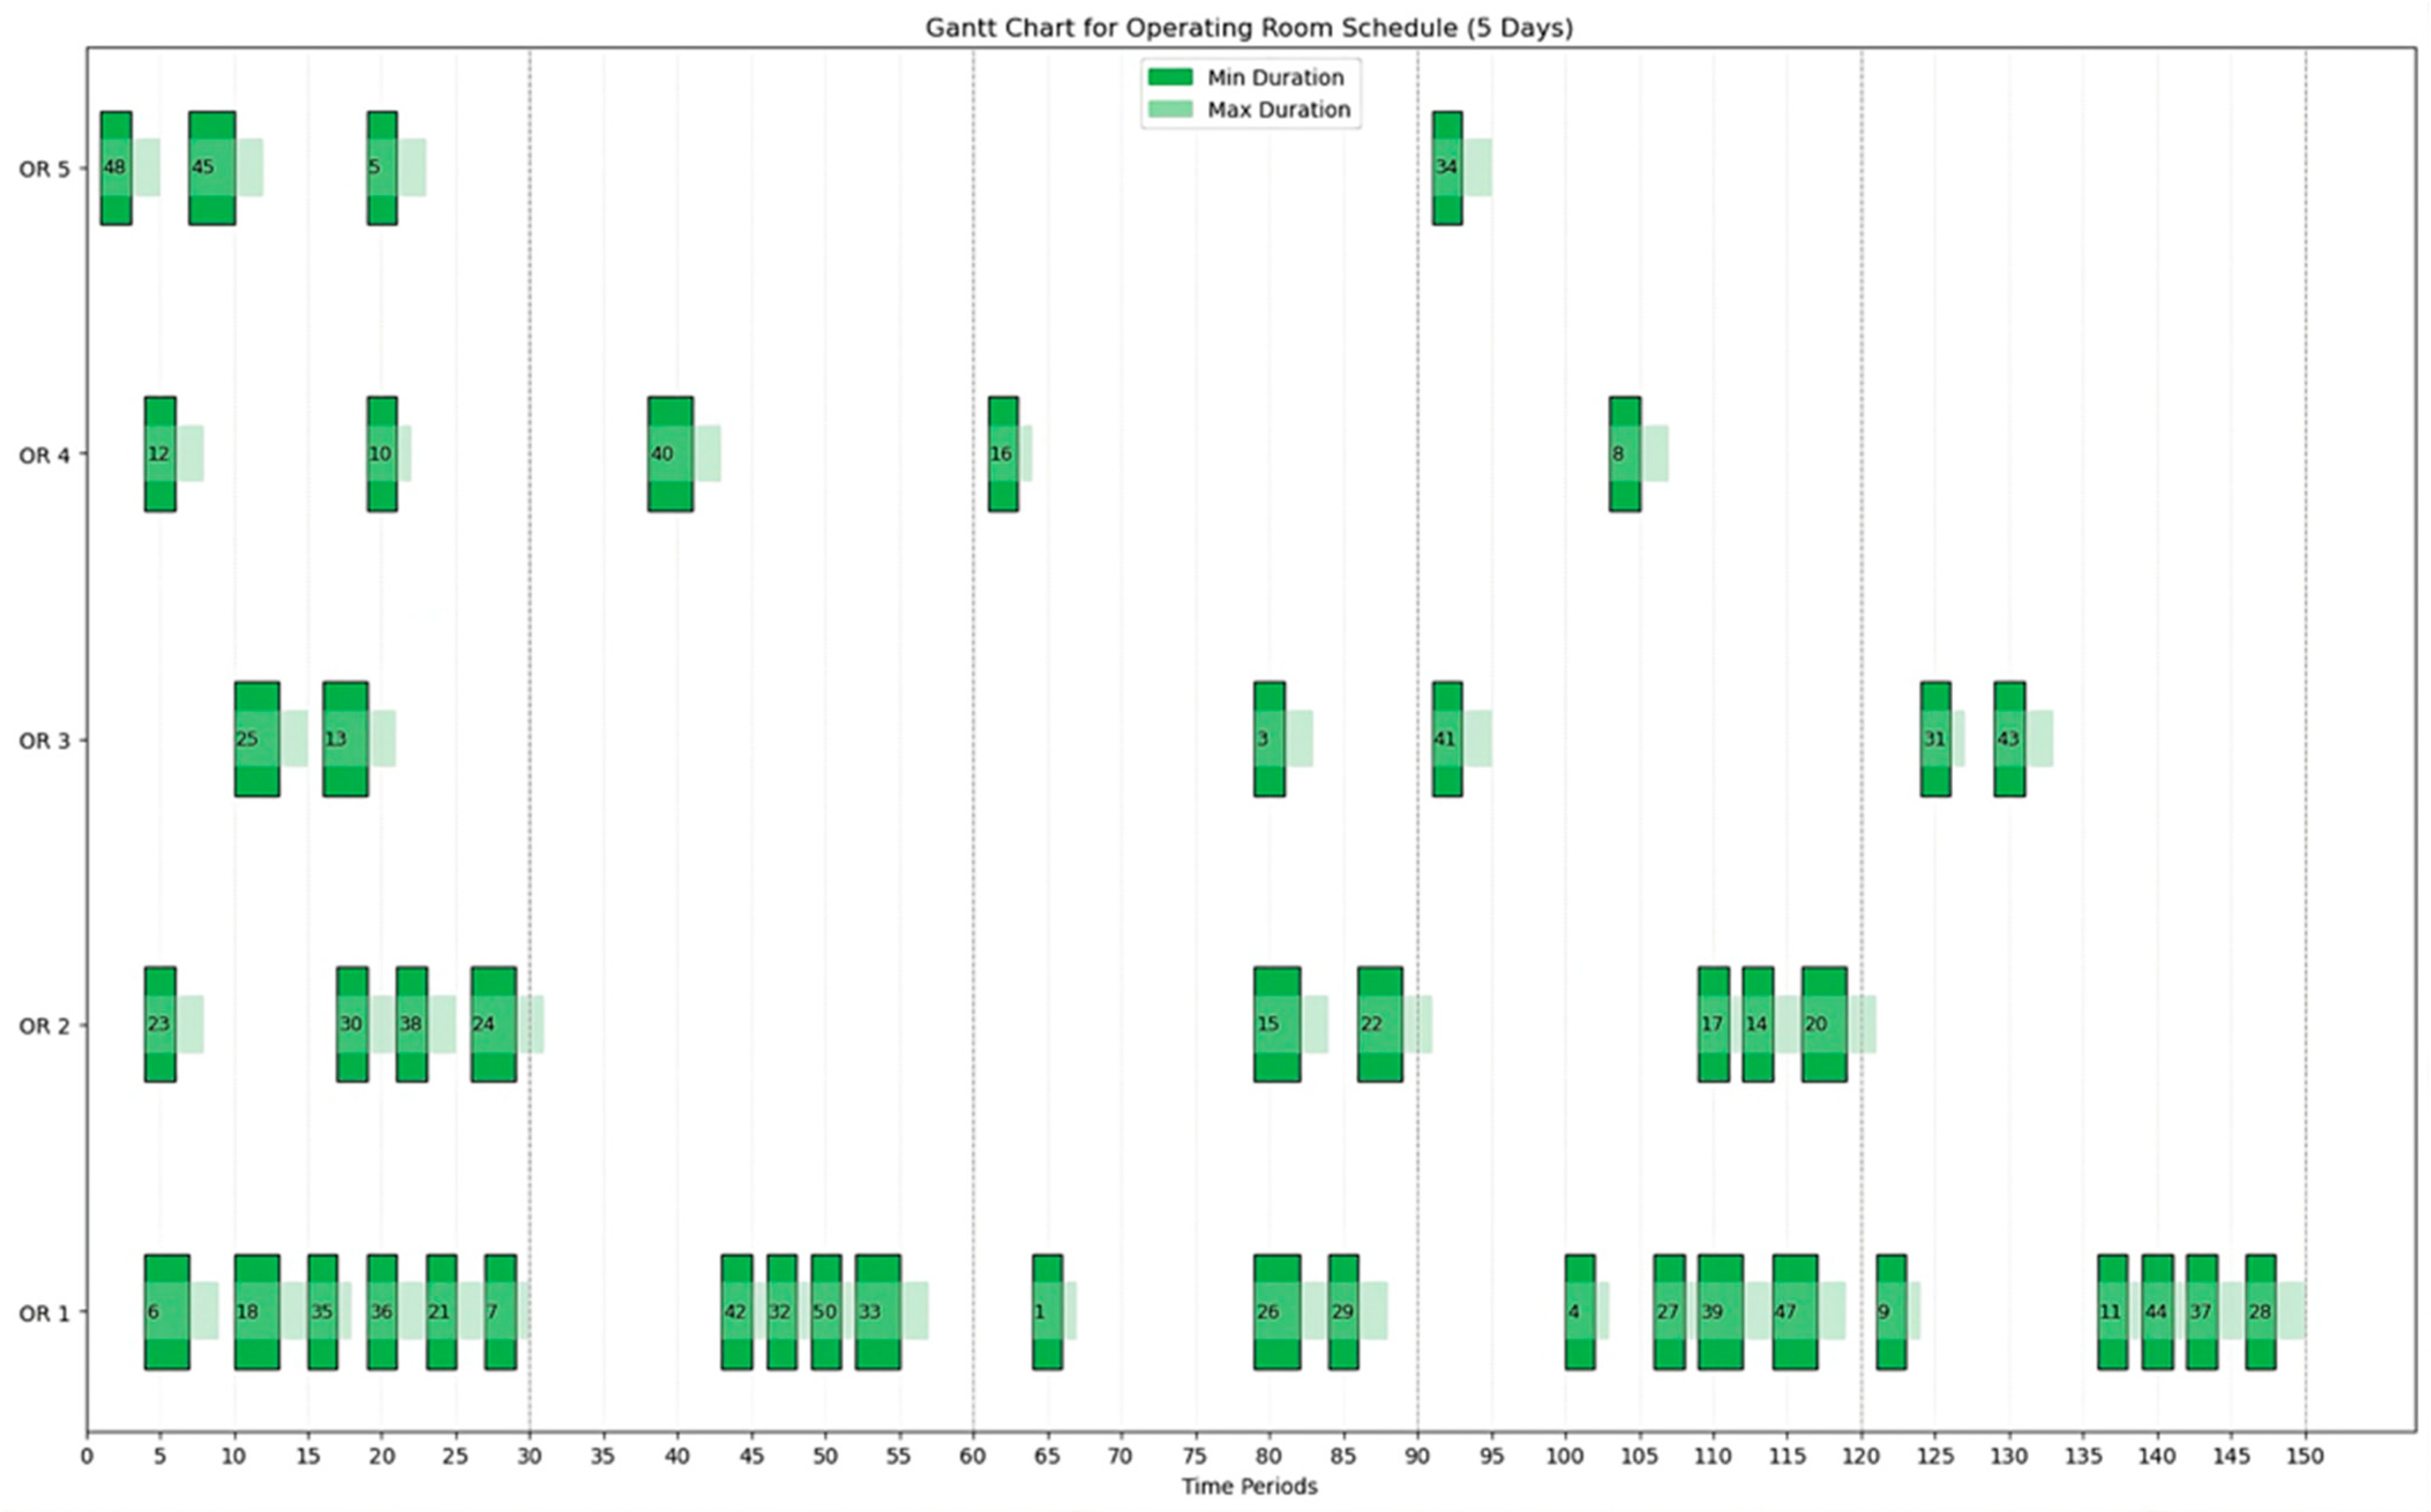
To illustrate scheduling using a Gantt chart, Figure 4 presents a comprehensive overview of the entire planning horizon for all operating rooms in one of the fifty scenario replications. It shows that 46 surgeries were scheduled across the different rooms, as previously mentioned. The model attempts to leave time slots available for emergency cases, in case they arrive, without completely closing any operating room. The chart displays the minimum and maximum duration for each surgery. The periods are continuous, totaling 150 periods, which represent 30 periods per day over five days.
Figure 4.
Gantt chart for the whole planning horizon.
Table 7 shows the number of surgeries successfully scheduled by the model within the specified run time of 3600 s (one hour), which is suitable for the practical operational window in the hospital. The 3600-s limit aligns with the typical ‘mid-day planning’ window in surgical departments, allowing managers to re-optimize schedules without disrupting daily clinical workflows.
Table 7.
The number of scheduled surgeries.
Naturally, allowing the model to run for a longer duration would lead to more optimal results with greater accuracy. However, to ensure the model remains practical and applicable in real hospital settings where time is limited, a one-hour runtime is considered reasonable for obtaining a near-optimal scheduling solution.
These results indicate that elective throughput remains relatively stable up to moderate emergency pressure but deteriorates sharply once bed capacity becomes binding.
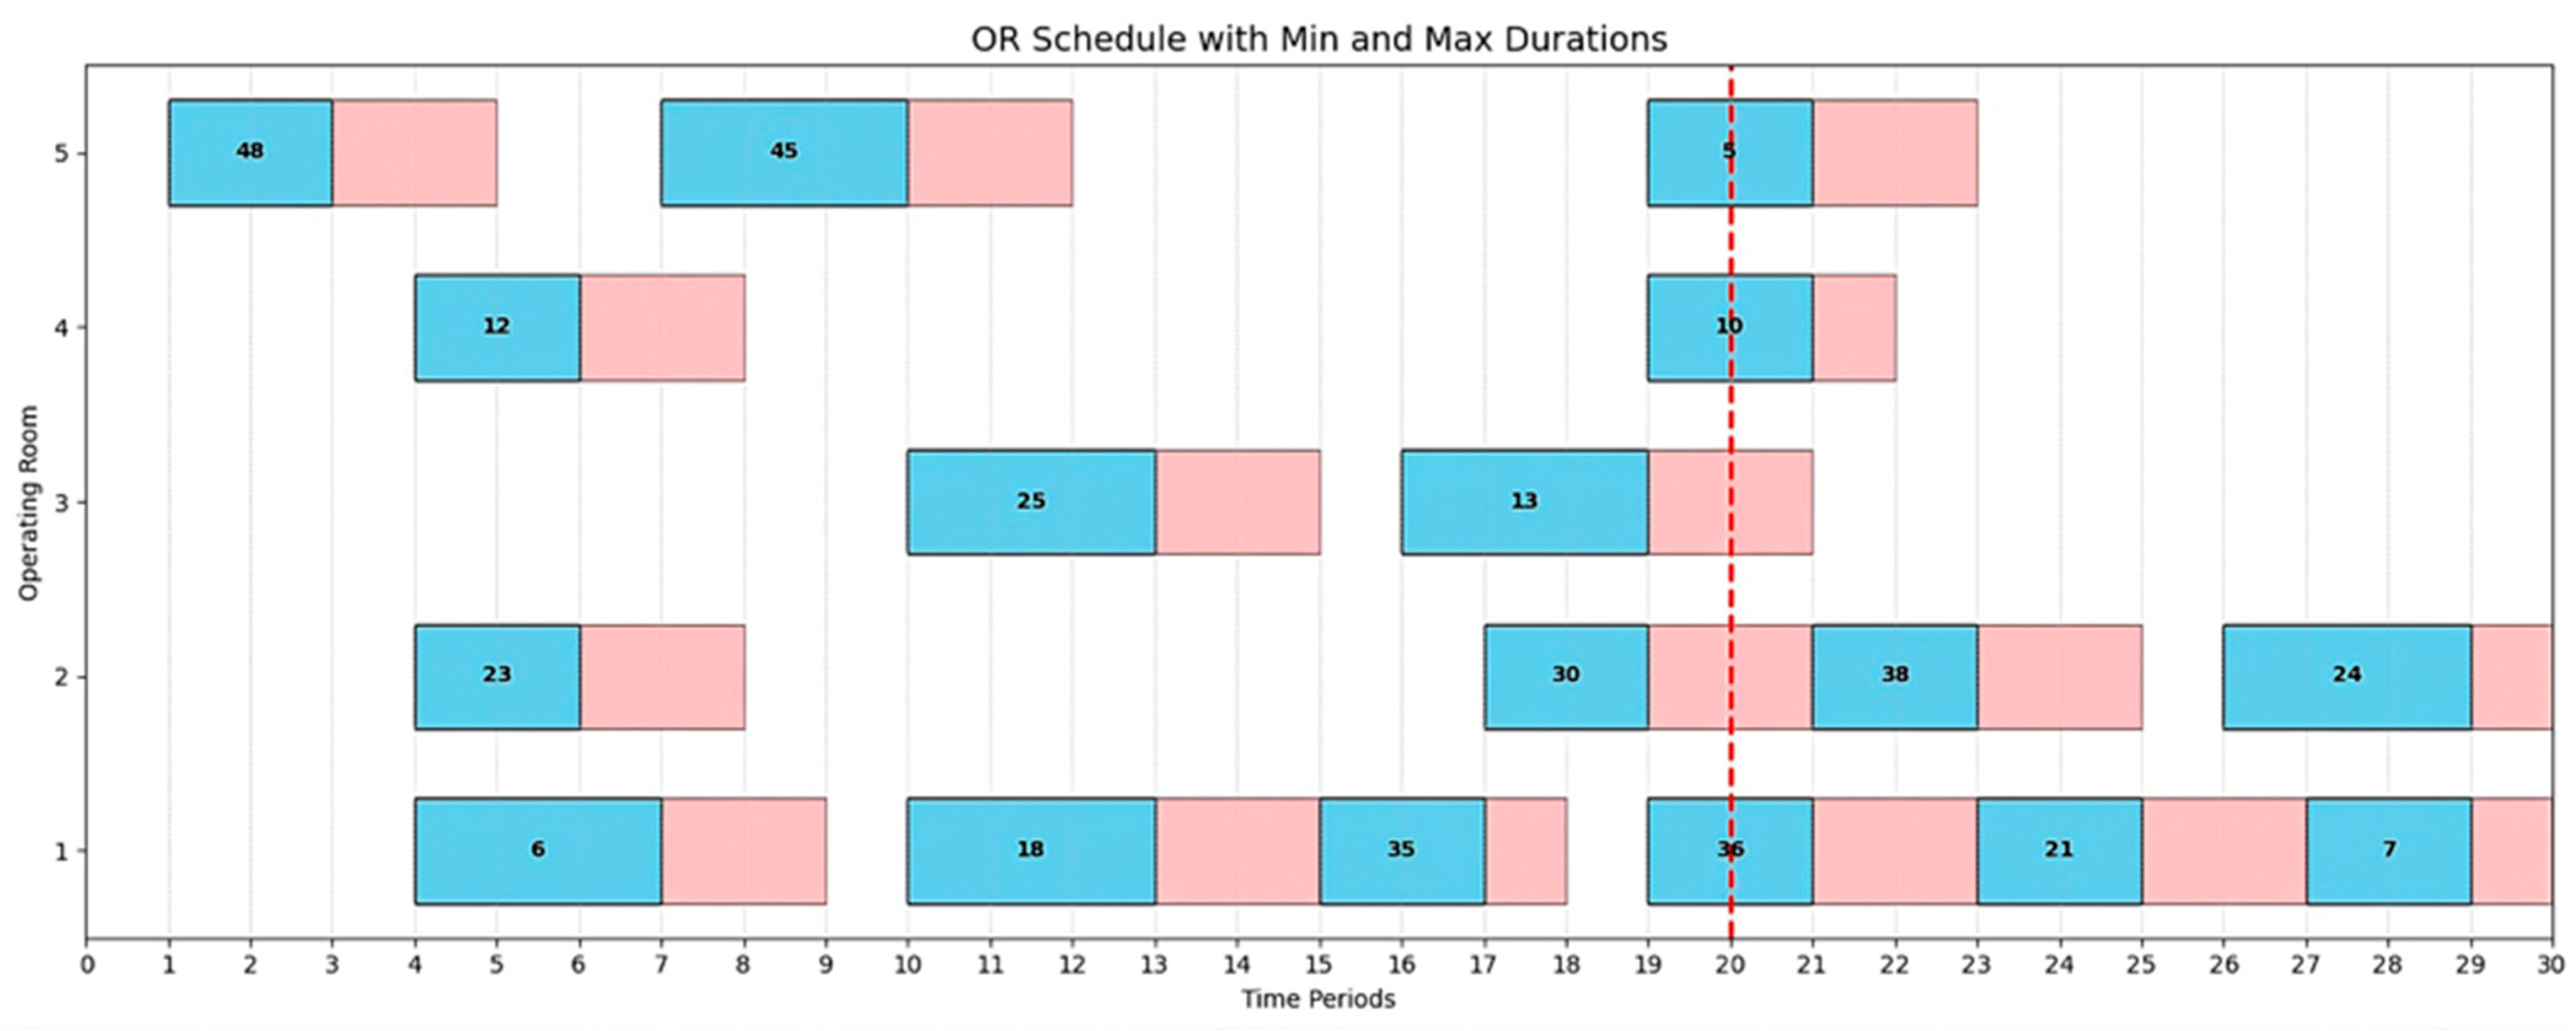
To provide a closer look at the scheduling, Figure 5 presents an example of a full-day surgery schedule for the first day of the first replication under the fifty-scenario setting. The schedule includes surgeries assigned across five different operating rooms and 30 time slots, as defined in the testbed.
Figure 5.
Full-day scheduling chart.
For each surgery, the minimum and maximum durations observed across the different scenarios are represented on the chart with blue and pink colors, and the red line separates the overtime from the regular time of operations
As shown, the model accounts for the uncertainty in surgery duration for each surgery and cannot schedule any surgery before the maximum time allowed for the previous surgery has elapsed. Also, the buffer time for emergencies is considered so that any emergency entering the hospital at most waits for the shortest limit for the most urgent, and then finds a place in an OR, even if the other four are loaded.
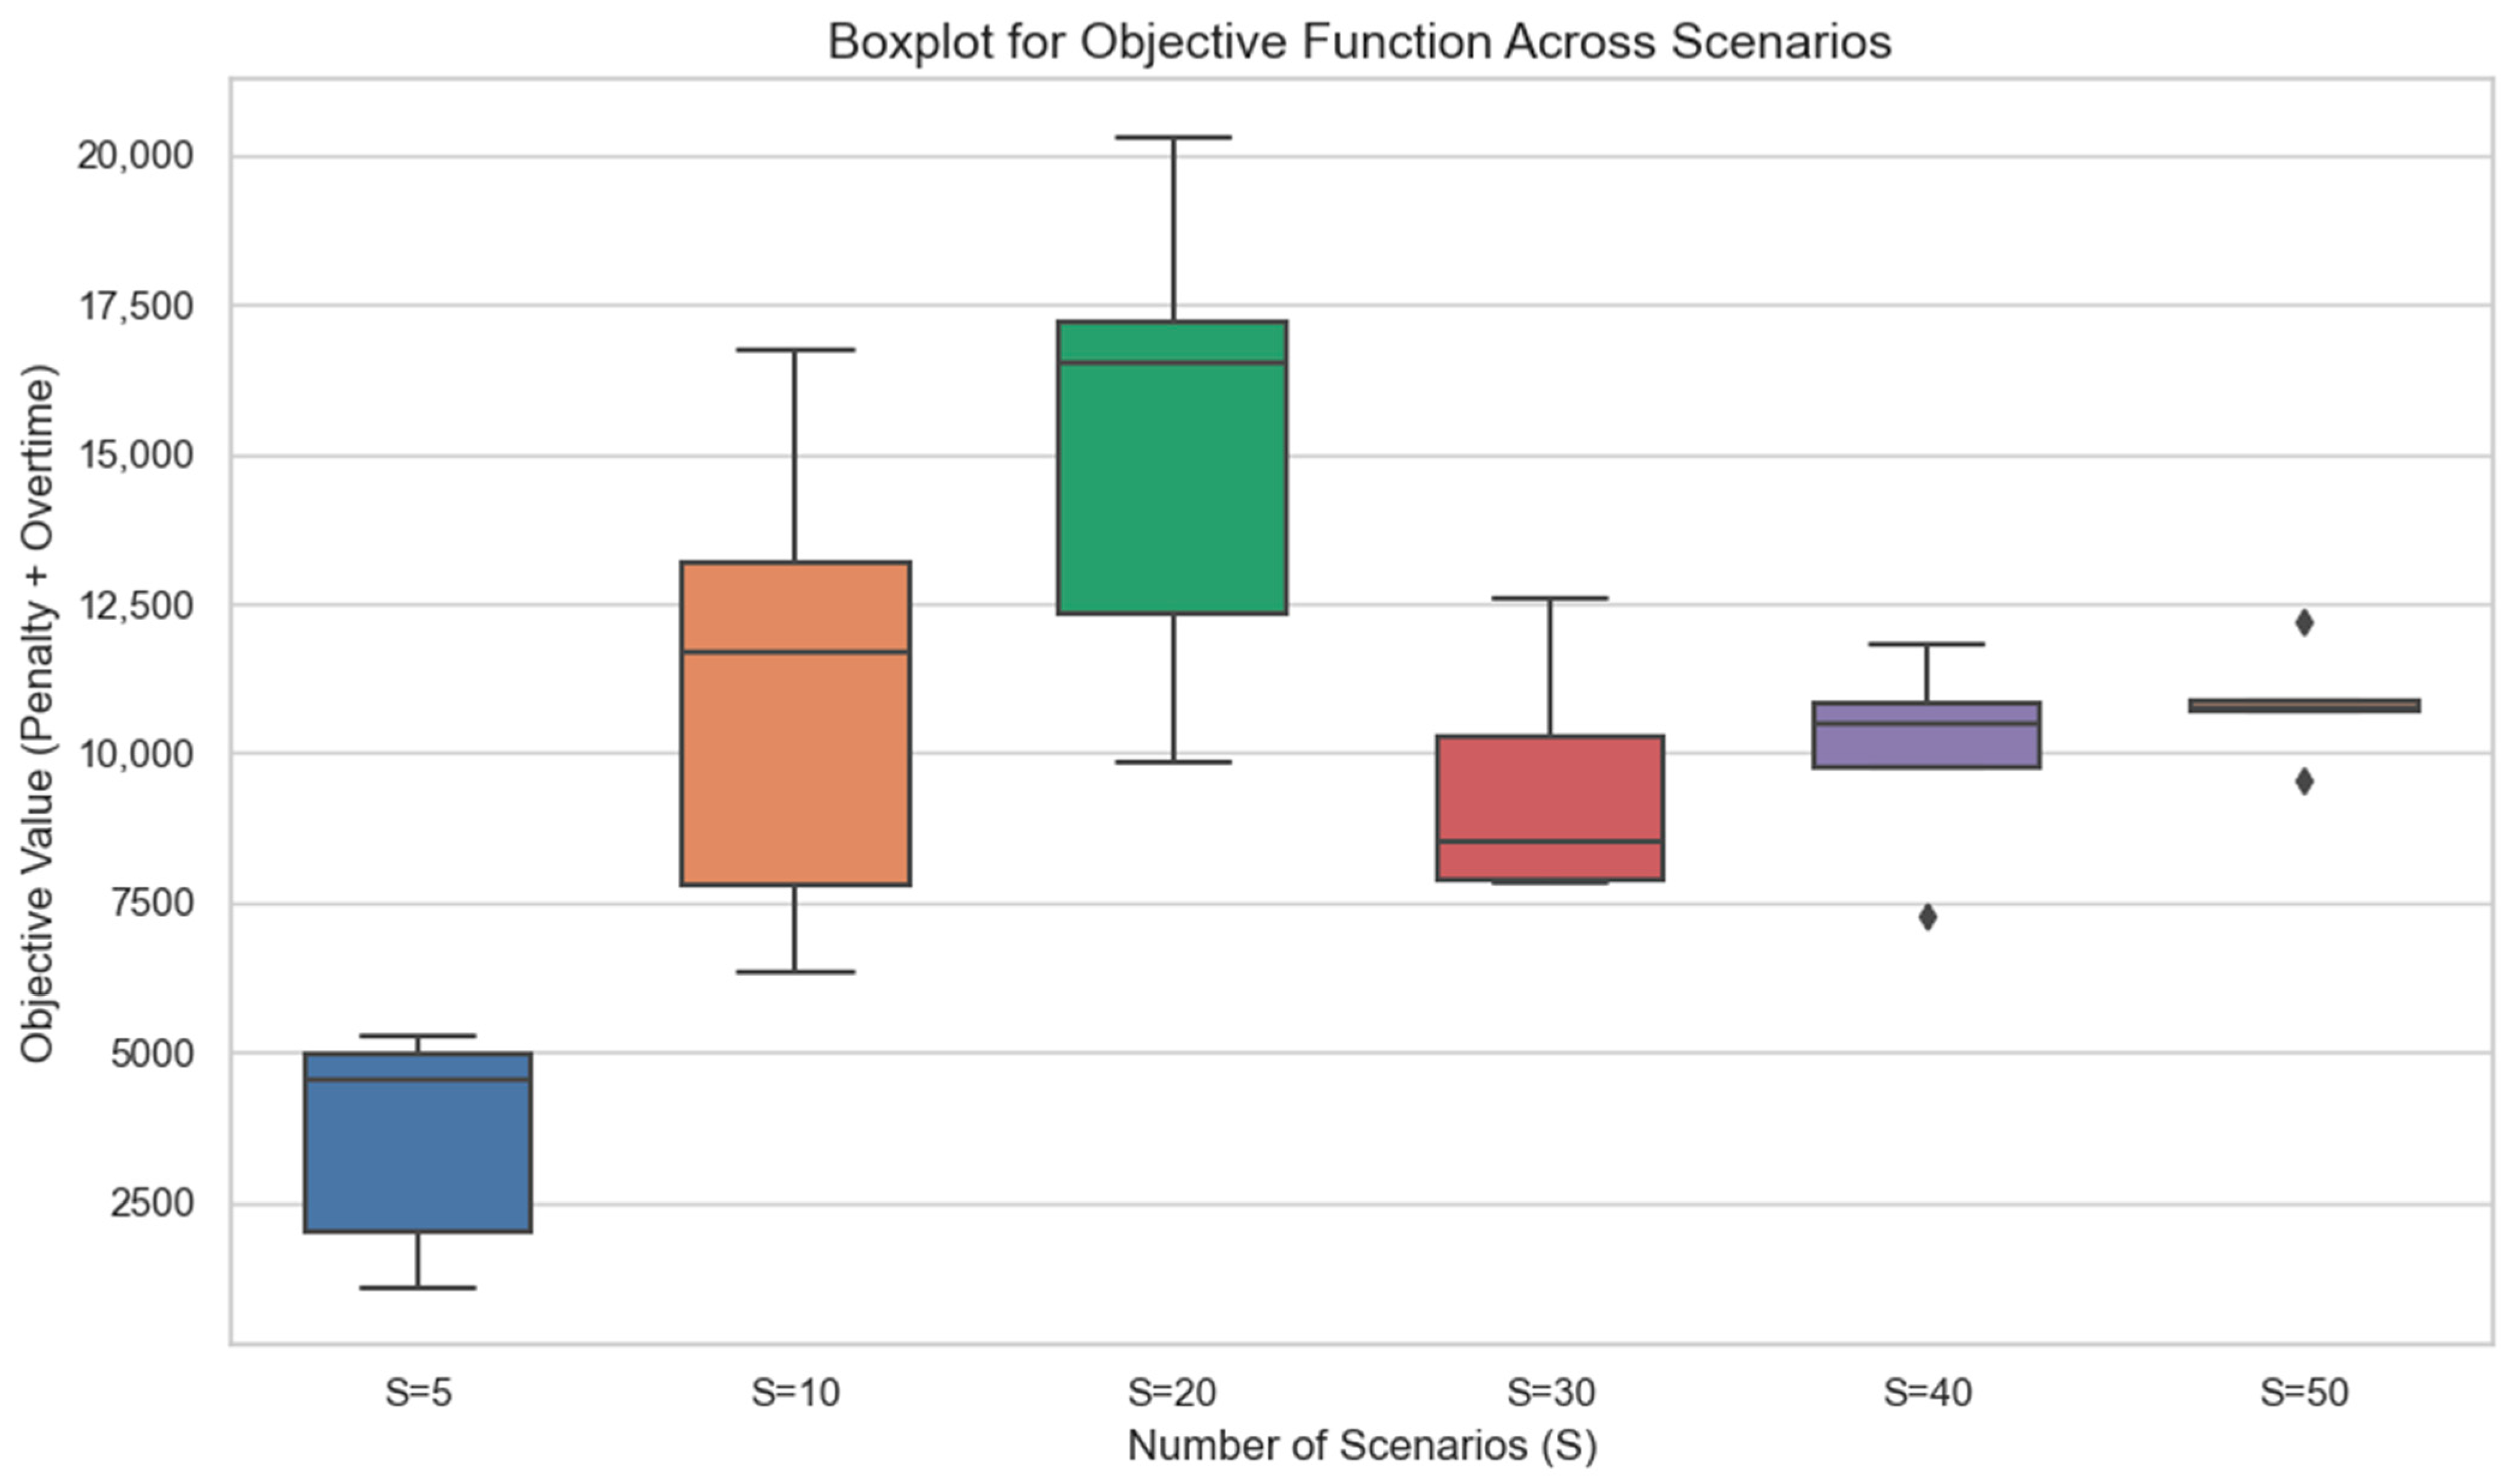
Figure 6 represents a box plot illustrating the distribution of the objective function values (sum of penalty and overtime costs) across different numbers of scenarios (S = 5, 10, 20, 30, 40, 50) over five replications. Each box represents the interquartile range (IQR) of the objective values, with the median shown as a horizontal line within the box. Whiskers extend to the minimum and maximum values within 1.5 × IQR from the lower and upper quartiles, respectively. Outliers are indicated by individual points that fall beyond this range. As the number of scenarios increases, the variability in the objective function initially rises, peaking at S = 20, before stabilizing and narrowing, particularly for S = 50, suggesting more consistent optimal outcomes with higher scenario counts.
Figure 6.
Boxplot for objective function values.
Variability peaks at intermediate S as uncertainty is better captured, then declines and stabilizes more than or equal to 40 samples. Therefore, 50 samples were adopted going forward to secure reproducible objectives without incurring unnecessary computation.
Considering the beds, the model assigns a bed to the patient for one day only if the patient is an outpatient (discharged on the same day). However, if the patient is an inpatient, they are allocated a bed from the day of surgery until the end of their stay, except in cases where the planning horizon ends before the stay is completed.
As an example of the results, patient number 25, scheduled on day 1 in the first replication of the 50 scenarios option, requires an LOS varying between 1 and 3 days. Therefore, B_used25,1 = 1, B_used25,2 = 1, and B_used25,3 = 1.
6. Discussion
This study integrated an operations research-based optimization framework with operations management-oriented capacity planning considerations to address OR scheduling under emergency uncertainty and downstream bed congestion. The discussion below interprets the results from both perspectives and positions the findings within the relevant literature.
From an operations research perspective, the results demonstrate that incorporating stochastic emergency arrivals through preventive buffer constraints enhances the robustness of elective surgery schedules. The proposed stochastic programming approach effectively balances elective throughput and overtime risk, particularly under increasing emergency variability. Compared to traditional deterministic scheduling approaches, the model exhibits more stable performance when system congestion intensifies, highlighting the value of explicitly modeling uncertainty at the planning level.
From an operations management perspective, the findings reveal important system-level insights regarding capacity interdependencies between operating rooms and inpatient beds. The numerical experiments indicate that ignoring downstream bed availability may lead to seemingly efficient operating room schedules that ultimately exacerbate congestion and prolong patient LOS. By explicitly linking surgical scheduling decisions to bed capacity constraints, the proposed framework captures congestion propagation effects across hospital units, which is a central concern in healthcare operations management.
Moreover, the sensitivity analysis illustrates the existence of congestion thresholds beyond which marginal increases in elective demand result in disproportionate increases in overtime and bed occupancy. These insights provide actionable guidance for hospital planners by identifying operating regimes in which capacity expansions or policy adjustments become necessary. Such system-level planning insights align closely with the OM literature on patient flow management and capacity coordination.
Several simplifying assumptions were adopted in this study. Emergency surgeries were modeled statistically rather than explicitly scheduled, reflecting a tactical-level planning focus rather than real-time operational control. Additionally, inpatient beds were assumed to be homogeneous, and patient LOS extending beyond the planning horizon was truncated. While these assumptions enhance model tractability, they do not affect the qualitative insights regarding congestion propagation and capacity interactions, which constitute the primary contribution of this work.
Extreme mass-casualty events were not explicitly modeled and represent an important direction for future research, where real-time adaptive scheduling and surge capacity policies may be required.
Overall, the proposed framework bridges OR optimization modeling and OM capacity planning by providing a unified system-level view of surgical scheduling and downstream resource utilization. This integration addresses an important gap in the literature, where operating room scheduling and bed management are often studied in isolation.
The computational results align with the operations management literature on system-level capacity management. The stabilization of objective function values at the S = 50 scenarios reflects the model’s ability to capture sufficient uncertainty exposure without excessive computational burden—a balance consistent with practical SAA implementation. More importantly, the Gantt charts demonstrate how the model operationalizes pull-based control: elective surgeries are distributed across rooms and time slots such that downstream bed capacity remains protected under stochastic LOS realizations. This protective behavior is achieved through constraint (14), which acts as a capacity governor preventing elective releases when the projected bed occupancy approaches the limit N = 25. The fact that 46–50 surgeries are consistently scheduled despite emergency uncertainty demonstrates the framework’s ability to balance throughput and robustness—a key operations management objective in stochastic service systems.
7. Conclusions and Future Work
This study presents a stochastic operating room scheduling model designed to enhance the efficiency of elective surgery planning in the face of uncertainty regarding emergency arrivals and hospital bed availability. The proposed model accommodates both inpatient and outpatient elective cases, prioritizing urgent elective surgeries through the integration of a Medical Priority Index. This index was incorporated into the objective function to guide the model towards scheduling higher-priority cases first, by increasing the penalty for not scheduling these critical patients.
The objective function was designed to maximize the number of scheduled elective surgeries while minimizing overtime costs, thereby balancing service quality and resource utilization effectively. Uncertainty in surgery durations and patient LOS was addressed using the Sample Average Approximation (SAA) method. The computational results demonstrated promising performance across a range of scenarios (from 5 to 50), showcasing the model’s robustness and its ability to allocate operating room and bed resources under stochastic conditions effectively. Sensitivity analysis identified 50 scenarios as the optimal trade-off between computational effort and solution stability.
Looking ahead, several extensions can be explored to enhance the model further and overcome its limitations:
- Incorporating multi-objective optimization to explicitly balance competing goals such as cost, access, and equity.
- Including additional resource constraints such as post-anesthesia care units (PACUs) and intensive care units (ICUs).
- Extending the model to consider continuity across multiple planning horizons, particularly for inpatients whose stay exceeds the current planning window, is necessary.
- Introducing sustainability constraints, such as energy usage and carbon emissions, to align with green hospital initiatives.
This work demonstrates how system-level coordination between ORs and inpatient beds can improve hospital robustness under emergency uncertainty.
Author Contributions
Conceptualization, B.B.; methodology, B.B.; software, B.B.; validation, B.B., M.G. and A.E.; formal analysis, B.B., M.G. and A.E.; investigation, B.B., M.G. and A.E.; resources, B.B., M.G. and A.E.; data curation B.B., M.G. and A.E.; writing—original draft preparation, B.B.; writing—review and editing, B.B., M.G. and A.E.; visualization, B.B., M.G. and A.E.; supervision, M.G. and A.E. All authors have read and agreed to the published version of the manuscript.
Funding
This research received no external funding.
Data Availability Statement
The data supporting the findings of this study are available in Zenodo Doi: https://doi.org/10.5281/zenodo.18005373.
Acknowledgments
This work was supported by the Egyptian Ministry of Higher Education Grant and the Japanese International Cooperation Agency (JICA) within the scope of the Egypt-Japan University of Science and Technology (EJUST).
Conflicts of Interest
The authors declare no conflicts of interest.
References
- Azar, M.; Carrasco, R.A.; Mondschein, S. Dealing with uncertain surgery times in operating room scheduling. Eur. J. Oper. Res. 2022, 299, 377–394. [Google Scholar] [CrossRef] [Scilit]
- Schouten, A.M.; Flipse, S.M.; Van Nieuwenhuizen, K.E.; Jansen, F.W.; Van Der Eijk, A.C.; Van Den Dobbelsteen, J.J. Operating room performance optimization metrics: A systematic review. J. Med. Syst. 2023, 47, 19. [Google Scholar] [CrossRef] [Scilit]
- Yahia, Z.; Eltawil, A.B.; Harraz, N.A. The operating room case-mix problem under uncertainty and nurses capacity constraints. Health Care Manag. Sci. 2016, 19, 383–394. [Google Scholar] [CrossRef] [Scilit]
- Park, J.; Kim, B.-I.; Eom, M.; Choi, B.K. Operating room scheduling considering surgeons’ preferences and cooperative operations. Comput. Ind. Eng. 2021, 157, 107306. [Google Scholar] [CrossRef] [Scilit]
- Shehadeh, K.S.; Padman, R. Stochastic optimization approaches for elective surgery scheduling with downstream capacity constraints: Models, challenges, and opportunities. Comput. Oper. Res. 2022, 137, 105523. [Google Scholar] [CrossRef] [Scilit]
- Rana, H.S.; Umer, M.; Hassan, U.; Asgher, U. A novel multi-criteria decision-making approach for prioritization of elective surgeries through formulation of “weighted MeNTS scoring system”. Heliyon 2022, 8, e10339. [Google Scholar] [CrossRef] [Scilit] [PubMed]
- Maleki, A.; Hosseininesaz, H.; Jasemi, M. A comparative analysis of the efficient operating room scheduling models using robust optimization and upper partial moment. Healthc. Anal. 2023, 3, 100144. [Google Scholar] [CrossRef] [Scilit]
- Latorre-Núñez, G.; Lüer-Villagra, A.; Marianov, V.; Obreque, C.; Ramis, F.; Neriz, L. Scheduling operating rooms with consideration of all resources, post anesthesia beds and emergency surgeries. Comput. Ind. Eng. 2016, 97, 248–257. [Google Scholar] [CrossRef] [Scilit]
- Min, D.; Yih, Y. An elective surgery scheduling problem considering patient priority. Comput. Oper. Res. 2010, 37, 1091–1099. [Google Scholar] [CrossRef] [Scilit]
- Cardoen, B.; Demeulemeester, E.; Beliën, J. Operating room planning and scheduling: A literature review. Eur. J. Oper. Res. 2010, 201, 921–932. [Google Scholar] [CrossRef] [Scilit]
- Jung, K.S.; Pinedo, M.; Sriskandarajah, C.; Tiwari, V. Scheduling Elective Surgeries with Emergency Patients at Shared Operating Rooms. Prod. Oper. Manag. 2019, 28, 1407–1430. [Google Scholar] [CrossRef] [Scilit]
- Kamran, M.A.; Karimi, B.; Dellaert, N. Uncertainty in advance scheduling problem in operating room planning. Comput. Ind. Eng. 2018, 126, 252–268. [Google Scholar] [CrossRef] [Scilit]
- Strum, D.P.; May, J.H.; Vargas, L.G. Modeling the uncertainty of surgical procedure times: Comparison of log-normal and normal models. Anesthesiology 2000, 92, 1160–1167. [Google Scholar] [CrossRef] [Scilit]
- Dai, Z.; Perera, S.C.; Wang, J.-J.; Mangla, S.K.; Li, G. Elective surgery scheduling under uncertainty in demand for intensive care unit and inpatient beds during epidemic outbreaks. Comput. Ind. Eng. 2023, 176, 108893. [Google Scholar] [CrossRef] [Scilit]
- Wang, L.; Demeulemeester, E.; Vansteenkiste, N.; Rademakers, F.E. Operating room planning and scheduling for outpatients and inpatients: A review and future research. Oper. Res. Health Care 2021, 31, 100323. [Google Scholar] [CrossRef] [Scilit]
- Tsang, M.Y.; Shehadeh, K.S.; Curtis, F.E.; Hochman, B.R.; Brentjens, T.E. Stochastic optimization approaches for an operating room and anesthesiologist scheduling problem. Oper. Res. 2025, 73, 1430–1458. [Google Scholar] [CrossRef] [Scilit]
- Heng, M.; Wright, J.G. Dedicated operating room for emergency surgery improves access and efficiency. Can. J. Surg. 2013, 56, 167. [Google Scholar] [CrossRef] [Scilit]
- van Veen-Berkx, E.; Elkhuizen, S.G.; Kuijper, B.; Kazemier, G. Dutch Operating Room Benchmarking Collaborative. Dedicated operating room for emergency surgery generates more utilization, less overtime, and less cancellations. Am. J. Surg. 2016, 211, 122–128. [Google Scholar] [CrossRef] [Scilit]
- Hans, E.; Vanberkel, P. Chapter 5 Operating Theatre Planning and Scheduling. In Handbook of Healthcare System Scheduling; Springer: New York, NY, USA, 2012. [Google Scholar] [CrossRef] [Scilit]
- Miao, H.; Wang, J.-J. Scheduling elective and emergency surgeries at shared operating rooms with emergency uncertainty and waiting time limit. Comput. Ind. Eng. 2021, 160, 107551. [Google Scholar] [CrossRef] [Scilit]
- Hopp, W.J.; Spearman, M.L. Factory Physics; Waveland Press: Long Grove, IL, USA, 2011. [Google Scholar]
- Spearman, M.L.; Woodruff, D.L.; Hopp, W.J. CONWIP: A pull alternative to kanban. Int. J. Prod. Res. 1990, 28, 879–894. [Google Scholar] [CrossRef] [Scilit]
- Verweij, B.; Ahmed, S.; Kleywegt, A.J.; Nemhauser, G.; Shapiro, A. The sample average approximation method applied to stochastic routing problems: A computational study. Comput. Optim. Appl. 2003, 24, 289–333. [Google Scholar] [CrossRef] [Scilit]
- Kim, S.; Pasupathy, R.; Henderson, S.G. A guide to sample average approximation. In Handbook of Simulation Optimization; Springer: New York, NY, USA, 2014; pp. 207–243. [Google Scholar] [CrossRef] [Scilit]
- Fu, K.; Walmsley, J.; Abdelrahman, M.; Chan, D.S. How much time do surgeons spend operating? Surgeon 2024, 22, 1–5. [Google Scholar] [CrossRef] [Scilit]
- Dehouche, N.; Viravan, S.; Santawat, U.; Torsuwan, N.; Intharakosum, A.; Sirivatanauksorn, Y. Hospital length of stay: A cross-specialty analysis and Beta-geometric model. PLoS ONE 2023, 18, e0288239. [Google Scholar] [CrossRef] [Scilit]
- Omling, E.; Jarnheimer, A.; Rose, J.; Björk, J.; Meara, J.; Hagander, L. Population-based incidence rate of inpatient and outpatient surgical procedures in a high-income country. J. Br. Surg. 2018, 105, 86–95. [Google Scholar] [CrossRef] [Scilit]
- Azab, R.; Eltawil, A.; Gheith, M. A bi-objective stochastic model for operating room scheduling considering surgeons’ preferences and collaborative surgeries. Decis. Anal. J. 2025, 14, 100544. [Google Scholar] [CrossRef] [Scilit]

Disclaimer/Publisher’s Note: The statements, opinions and data contained in all publications are solely those of the individual author(s) and contributor(s) and not of MDPI and/or the editor(s). MDPI and/or the editor(s) disclaim responsibility for any injury to people or property resulting from any ideas, methods, instructions or products referred to in the content. |
© 2026 by the authors. Published by MDPI on behalf of the International Institute of Knowledge Innovation and Invention. Licensee MDPI, Basel, Switzerland. This article is an open access article distributed under the terms and conditions of the Creative Commons Attribution (CC BY) license.