1. Introduction
Digital image technology is a widely applied, ever-developing field with numerous applications in the current era. The elementary requirement to produce a digital image is a latent image to form on the image sensor. This latent image requires electromagnetic waves from the source object to focus on the sensor using a lens system made out of carefully designed glass elements. Hence, having some source of light becomes the basic requirement and the utmost necessity for an image to form. This light source may be strong or weak depending on the nature of the reaction producing the photons. Ideally, a highly luminous body is taken to capture an image with its illuminance value [
1] ranging between 320–25,000 lux, the lowest value being office lighting and the highest value being full daylight. If above this range, the shutter speed of the camera will not be fast enough to stop the light source from flooding the image sensor. This issue can be tackled using various methods, such as using ND filters [
2] or higher f-stop values on the lens.
On the other hand, it is the lower end of the spectrum on which we focus for our paper. The lower the intensity of the light, the lesser the information the sensor has to produce an image. As a result, we may require using more complex methods to produce a usable image, one of which is proposed here. It is possible to increase the ISO, which stands for International Standards Organization, that is, the sensitivity to light as it pertains to either film or a digital sensor of the camera sensor [
3], i.e., the amplification of the information signal. Still, unfortunately, this procedure develops more and more noise in the image, resulting in a grainy image or increased exposure time. This method has some drawbacks and will be discussed later on in the paper; hence, we use a process called “stacking”. Both of these methods, i.e., long exposure and stacking, are tested, and the results are compared. The camera’s functioning and the image production are discussed, followed by a proposed design to obtain more efficient/better results. A technology called “Barn Door Star Tracker” has been implemented, which does not have any relation with the digital image technology but enormously helps to increase the reach of the work.
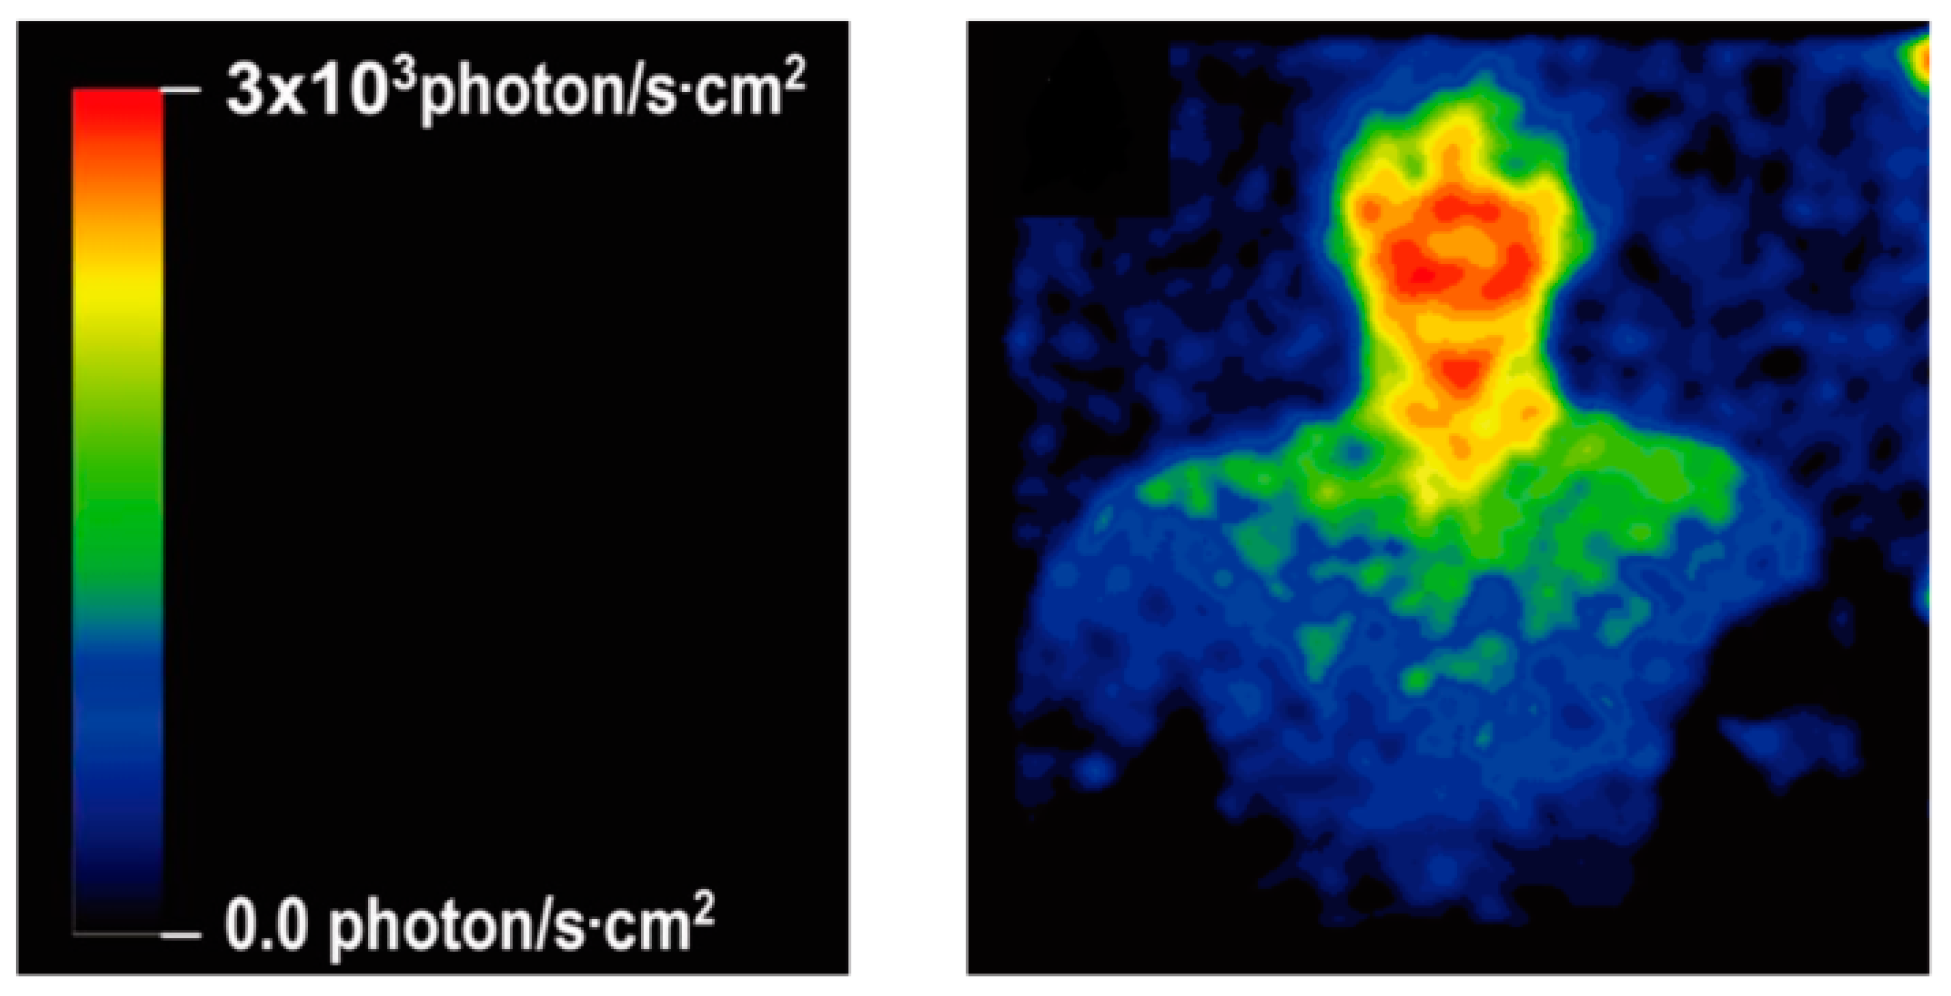
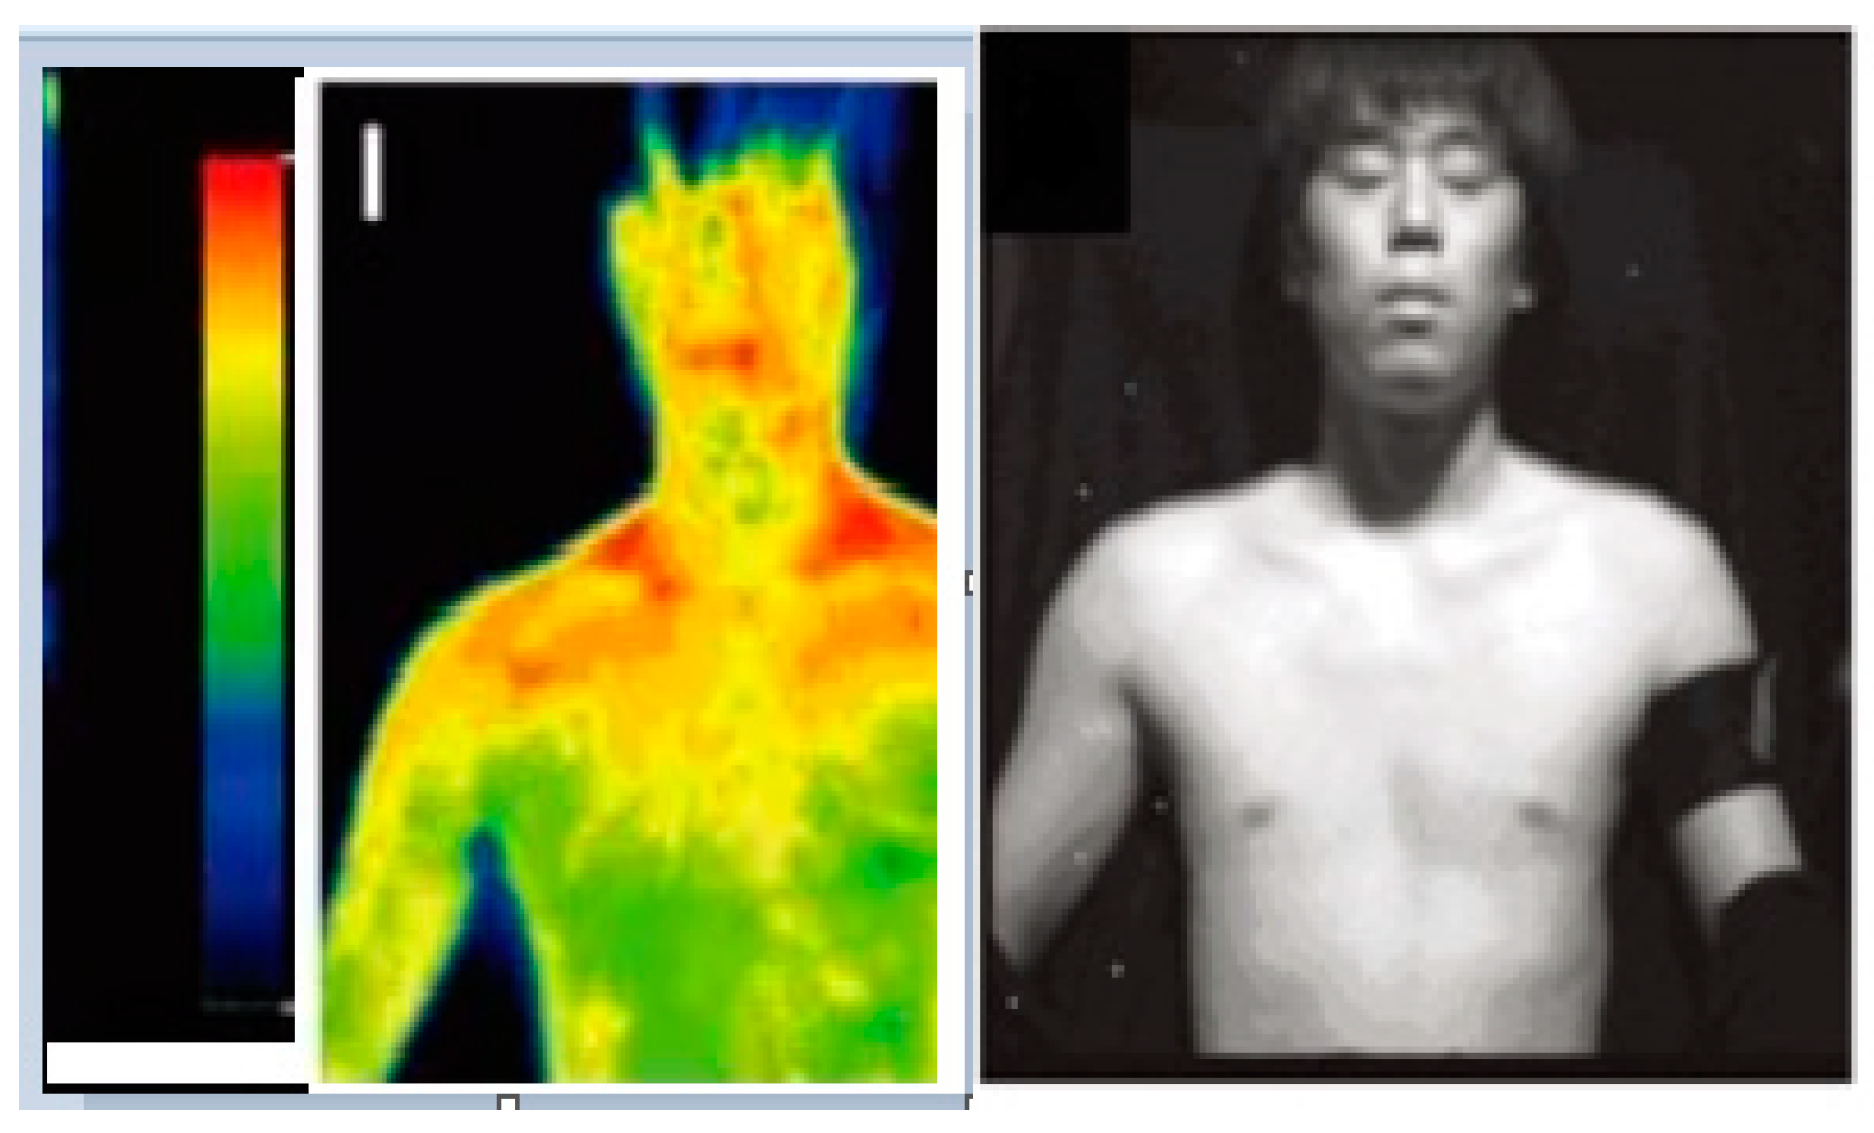
The existence of human bioluminescence [
4] was proved by capturing an image showing the glow of five volunteers in the visible light spectrum by a Japanese researcher Masaki Kobayashi in the year 2009. This light was bright in the neck and cheek region, emitting a green color. The intensity of the light was only one-thousandth of that which an unaided human eye can perceive; hence, it could not be seen. Due to the lack of technology to capture such a low number of photons, achieving results was extremely difficult, and there was a lag in research. However, over time, digital image technology has advanced rapidly. Now, many middle-class members of society can afford DSLR and mirrorless cameras that truly pack wonders in them in terms of technology and pricing. This has proved to be a motivation to carry out this work and study the possibility of capturing similar images with that which is available. Until now, science has not been able to explain the reason why many mammals possess bioluminescence properly. There have been speculations and suggestions behind this phenomenon, but no concrete correlation has ever been found due to the lack of available data. The proposed work could help in understanding this phenomenon better.
The goal of this research is to present a convenient setup with an accessible gear, which will allow a larger number of researchers to capture images and collect data on low light-emitting sources such as the human body and faint nebulae. The biggest reason for which we have not been able to unveil the mysteries of human bioluminescence and the science behind it is the lack of data caused by the complex and expensive nature of the experiment. The paper has proven that by merely using the readily available CMOS DSLR/Mirrorless cameras, with the process of stacking and using a Barn Door Tracker, impressive results can be achieved. This will open a window to more research on human bioluminescence (the last research was performed in 2009), and we shall have more data to study and understand the behavior of the human body, thus bringing advances not only to the field of biology, but to essentially make it easier to study any low light-emitting source.
2. Experimental Setup and Technical Specifications
2.1. Experiment Setup
For the experiment, we studied the workings of various camera setups paired with lenses and decided upon a particular pair. Now, all the researchers may not have the exact same set of gear. For the same reason, we have shared the process through which we selected a particular camera body and lens, and any other researcher can refer to the study and similarly obtain their own apparatus and perform the experiment.
Multiple images were produced using this experiment, with the total exposure time ranging from 40 to 90 min (500–700 frames). The images had close to zero noise, which was possible only due to stacking. This is in contrast to the last experiment performed in 2009 by Kobayashi, in which a single exposure was taken that lasted 30 min. However, a 30 min exposure would produce too much thermal noise in a CMOS camera at room temperature. Therefore, we concluded that instead of taking single exposures, we can take multiple frames of the same subject and stack them using the process mentioned in this paper. In theory, this will allow us to image any low light-emitting source just by adjusting the number of frames taken (to obtain the desired signal-to-noise ratio). The apparatus, making of a Barn Door Tracker, the process of stacking, and the ultimate production of clear images of extremely dim objects as a result are shared in the paper.
This work aims to design a setup that allows for the efficient capture of low light-emitting sources by understanding how the technology for digital imaging works, how it has been used in past research, and how it can be optimized as per our requirements with the latest digital cameras. Multiple images were produced using this experiment, with the total exposure time ranging from 40 to 90 min (500–700 frames). The images had close to zero noise, which was possible only due to stacking. A specific set of camera bodies paired with the appropriate lens were used to obtain prototype values to mimic the results of the actual experiment as accurately as possible. The details of this equipment and the process of selecting the particular specification of the model are discussed. To obtain even more detailed results of particular celestial objects, a star tracker was created to negate the earth’s rotation and obtain sharper images in longer exposures.
2.2. Technical Specifications
The SONY a6100 specifications are given in
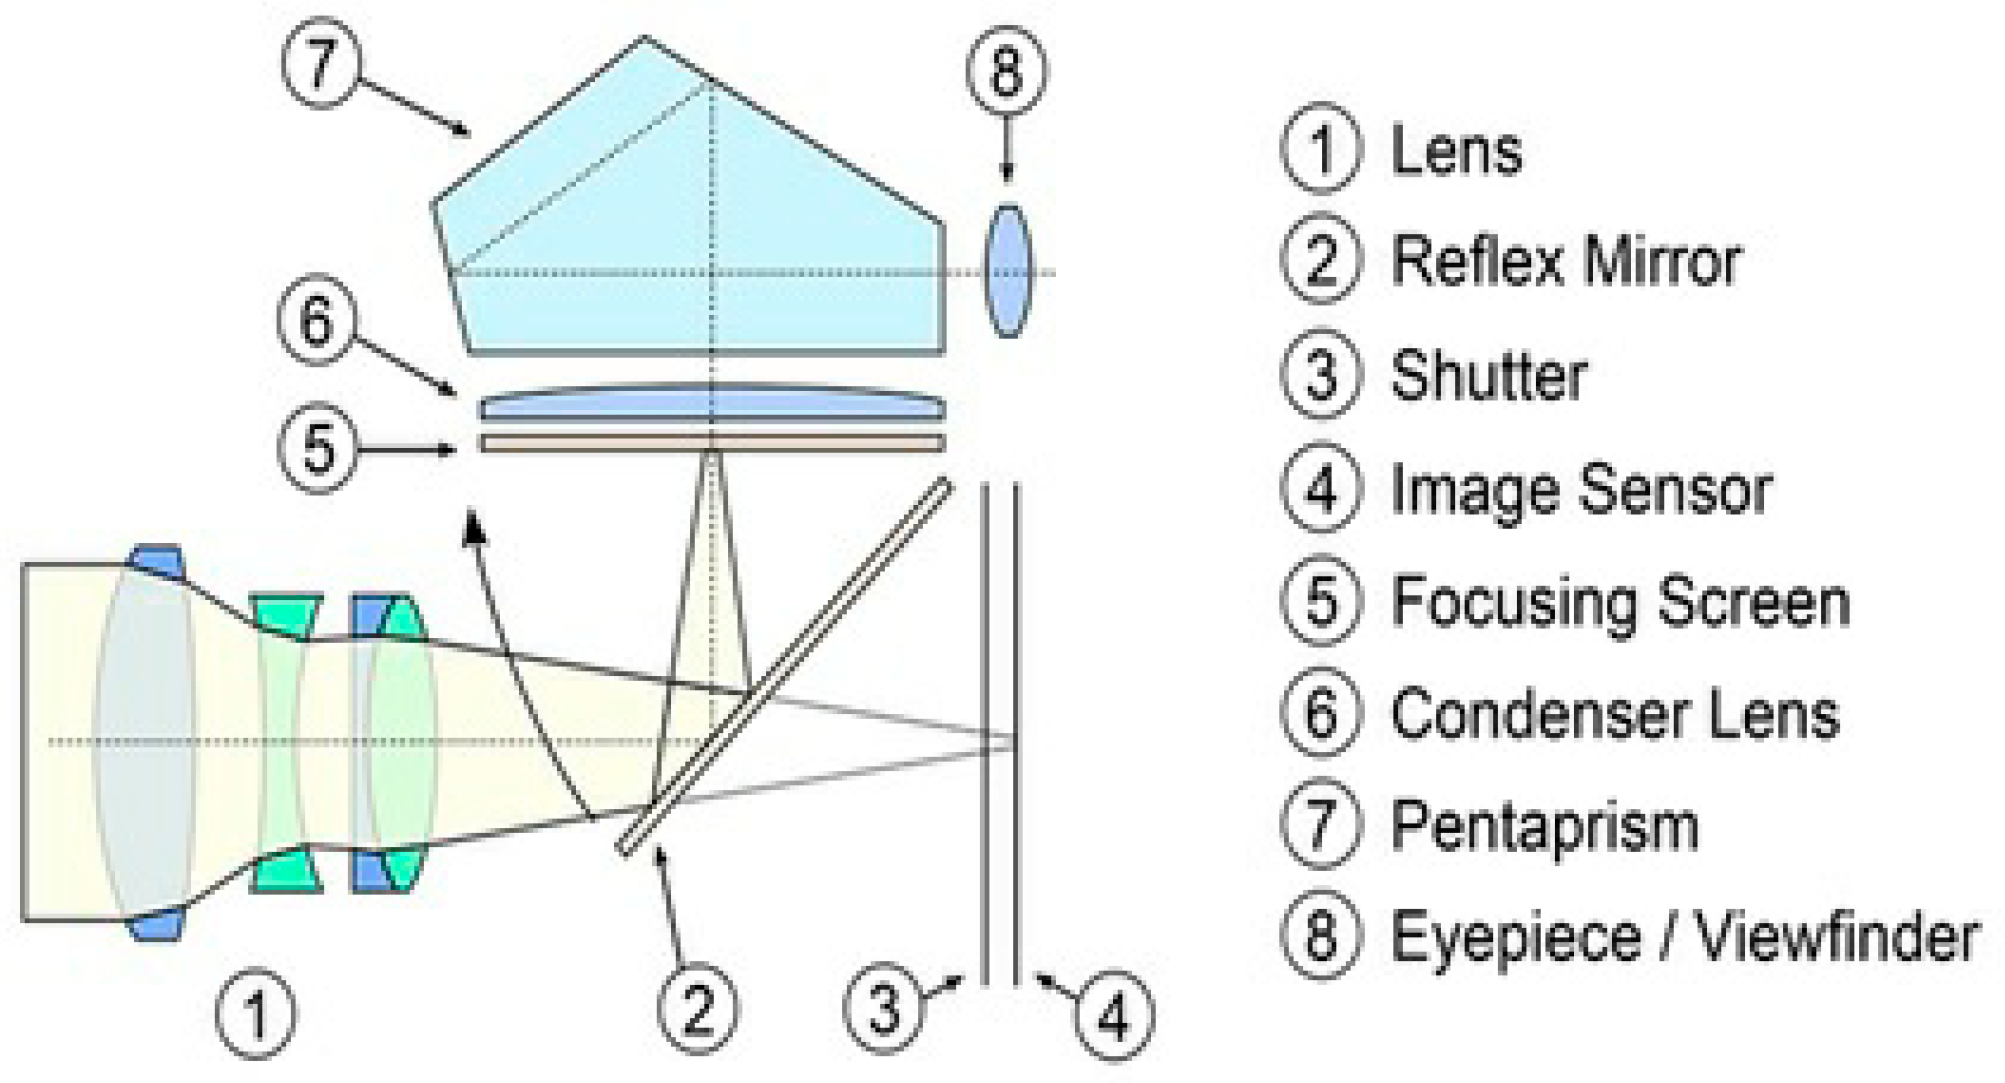
Table 1. The digital camera schematic is presented in
Figure 1, and the sigma lens specifications are provided in
Table 2.
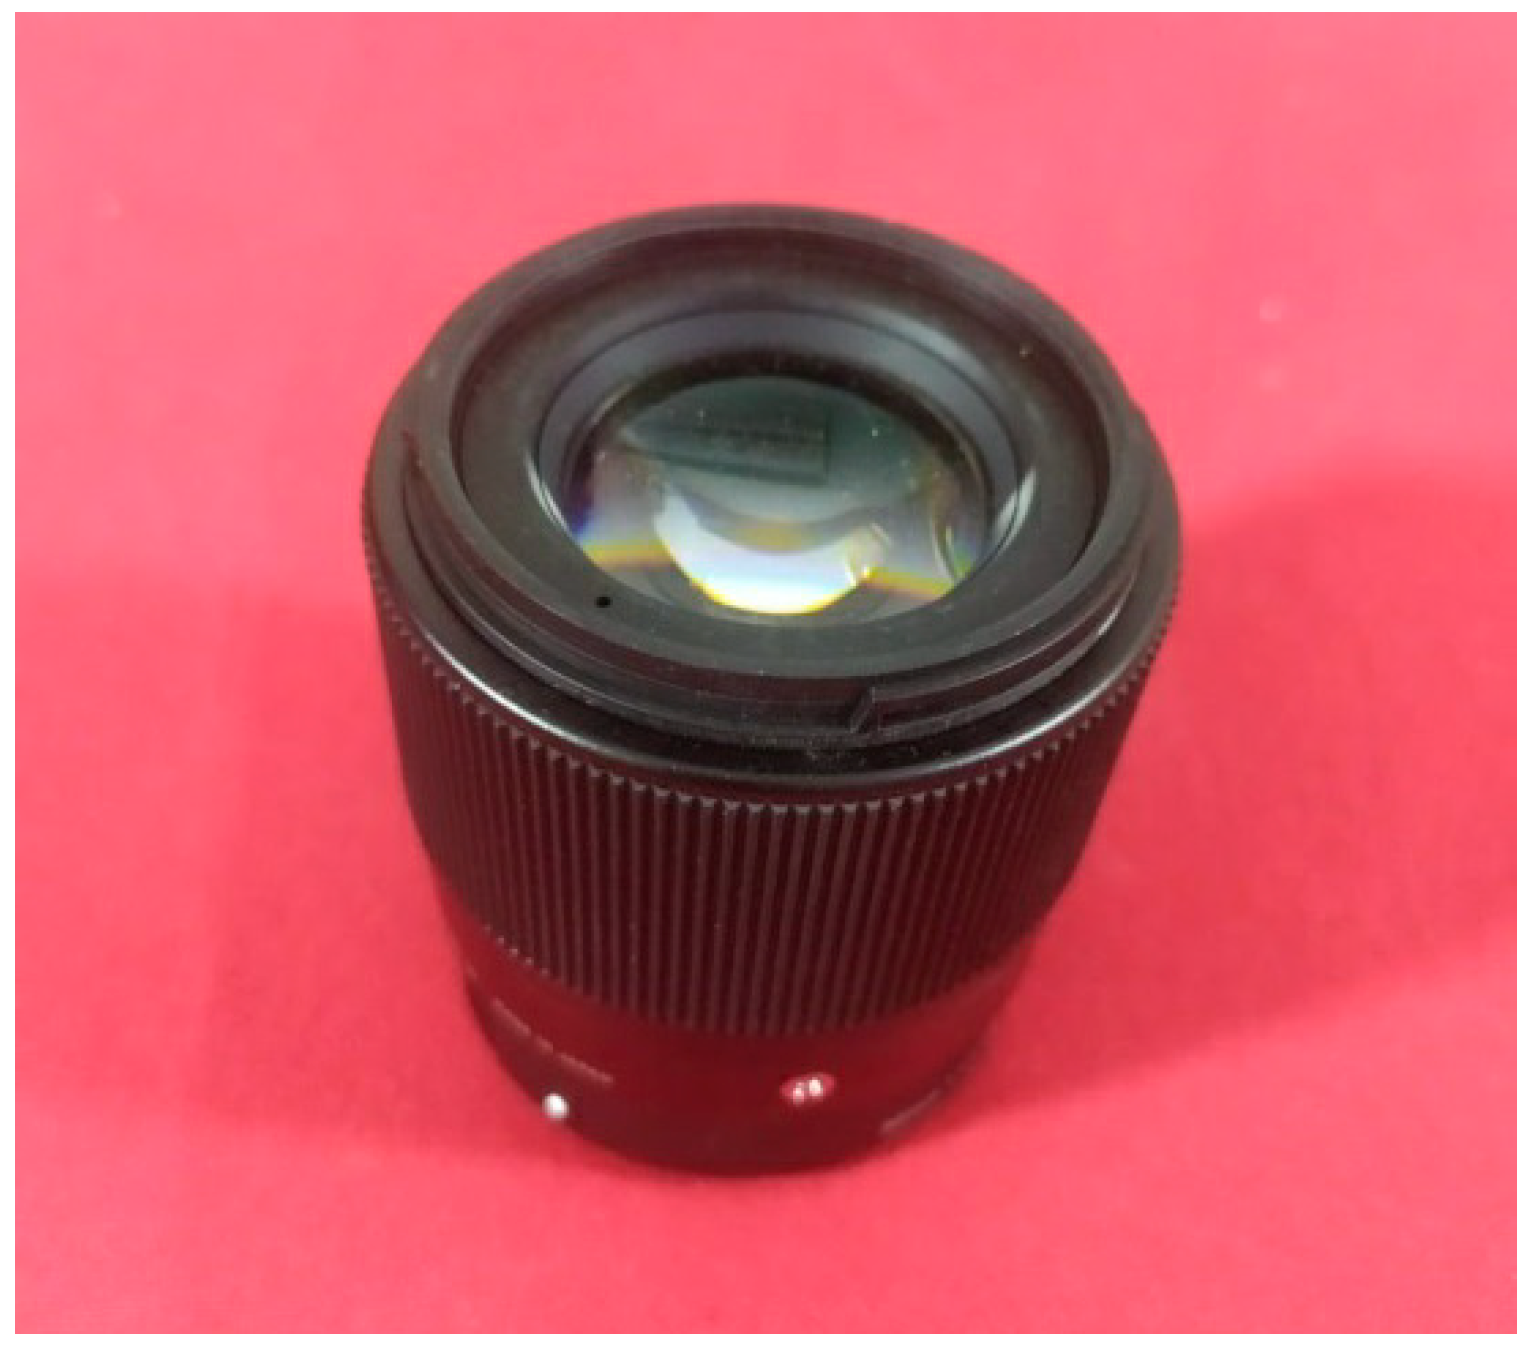
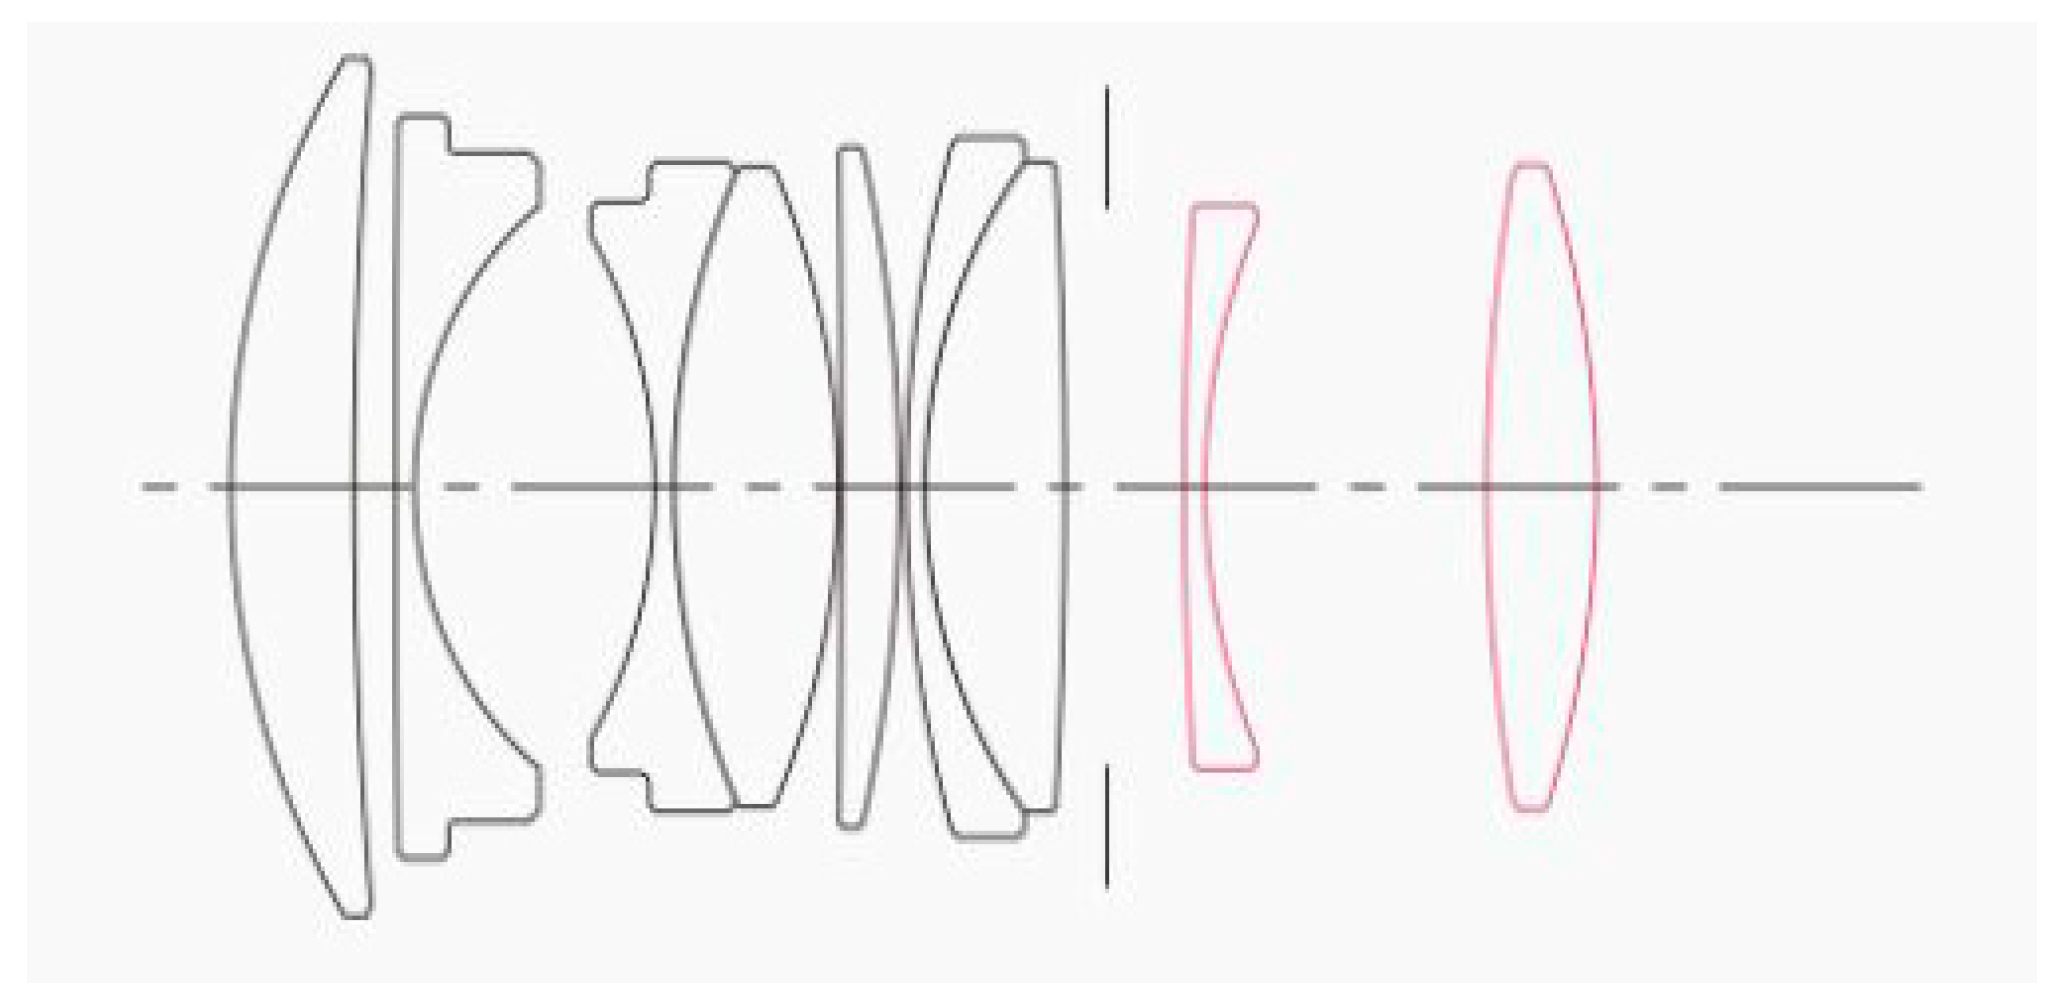
Figure 2 shows the schematic diagram of the lens used in work (Sigma 30 mm prime lens), and its specifications are listed in
Table 2. In the figure, the accurate representation of all the class elements present inside the lens is depicted in the same order to produce a focused image on the APS-C sensor.
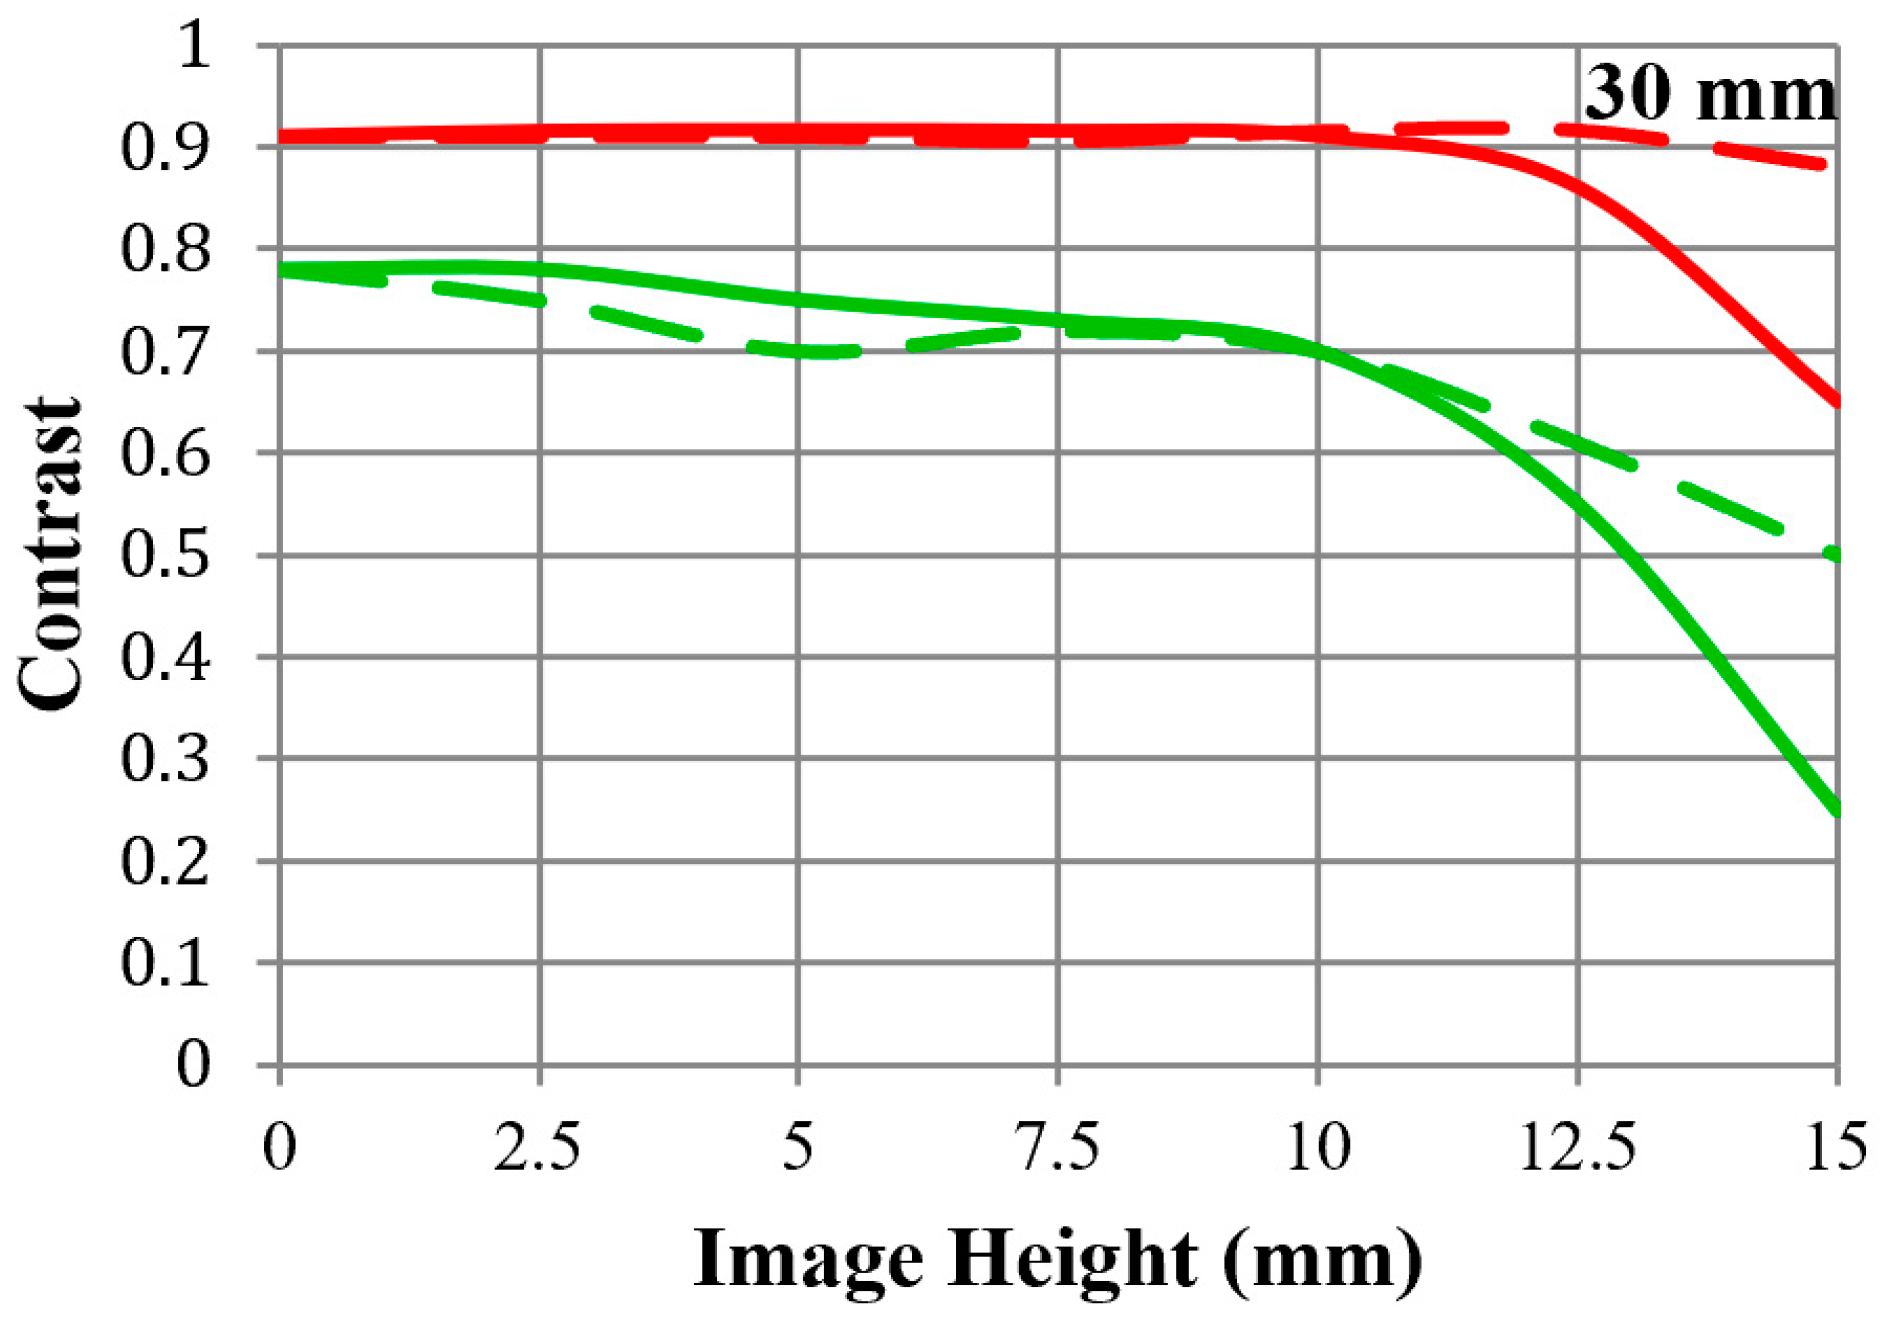
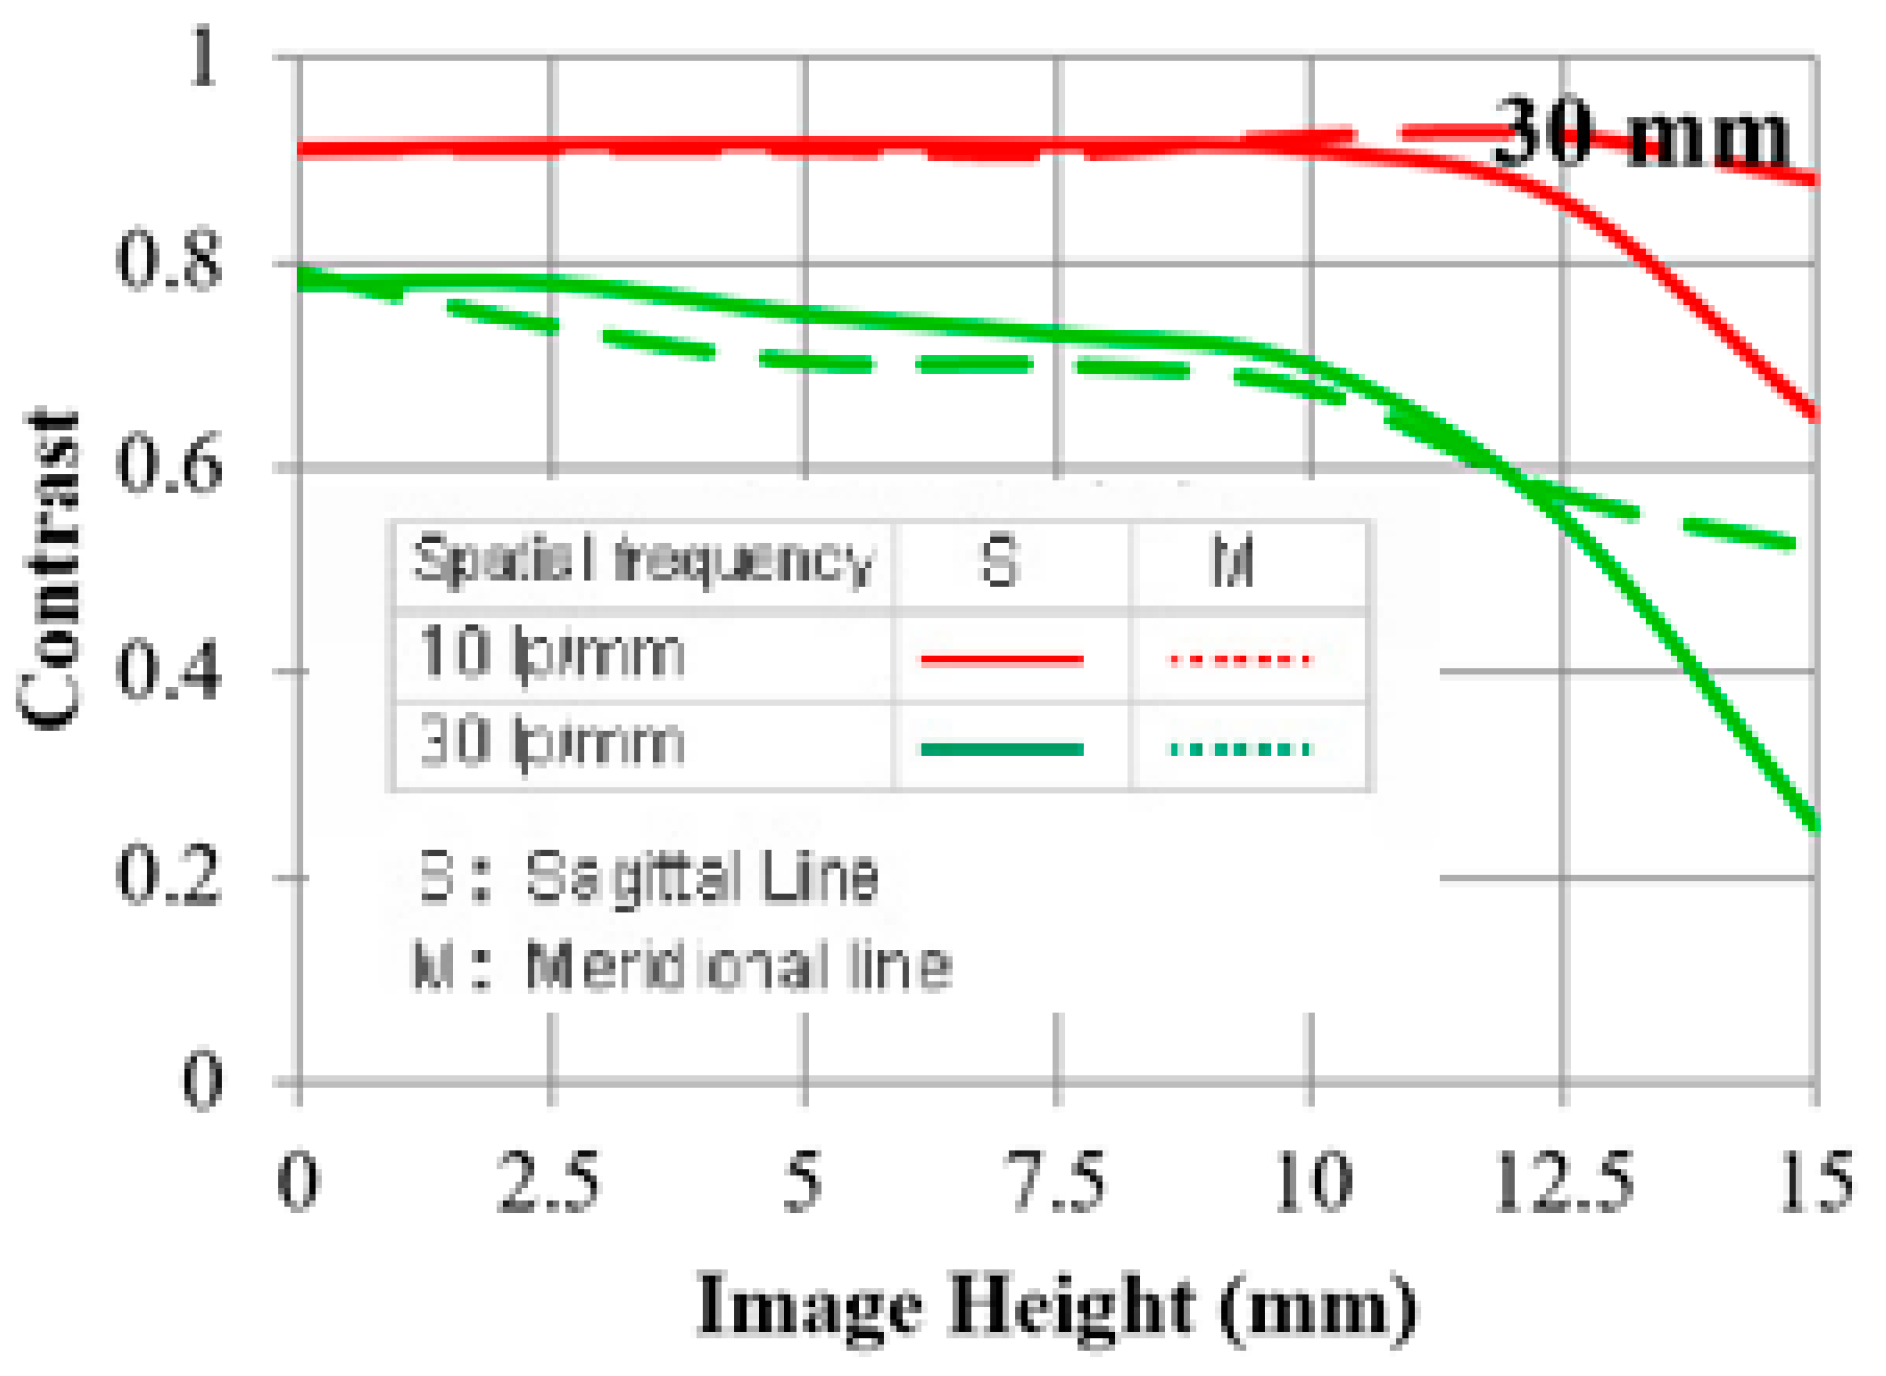
Figure 3 and
Figure 4 are two MTF (Modulation Transfer Function) [
5] charts that are characteristic of the specific lens model. MTF is a measurement of the optical performance potential of a lens. These charts plot the resolution and contrast of all the glass elements combined from the center to the lens’s edges against an “ideal/perfect” lens that would theoretically pass 100% of the light that enters its front element. The contrast of a lens is relevant, as it is correlated to its resolution.
The purpose of using this chart is to measure and calculate the optical performance potential of a lens. Though it does not consider the diffraction of the incoming light, it normally shows greater values in the graph than the actual image produced by the lens. The graph lines at 10 Ip/mm (lines per millimeter) represent the glass’s contrast ability (red lines), and the consecutive fine parallel lines at 30 Ipm represent the glass’s sharpness ability (green lines) at the lowest f-stop values of the lens. The fine repeating lines are Sagittal lines, and the other lines are Meridional lines [
6], which can be inferred from
Table 3 to understand the graphs better. The MTF chart gives the result at the wide-open aperture.
3. Design Approach Details
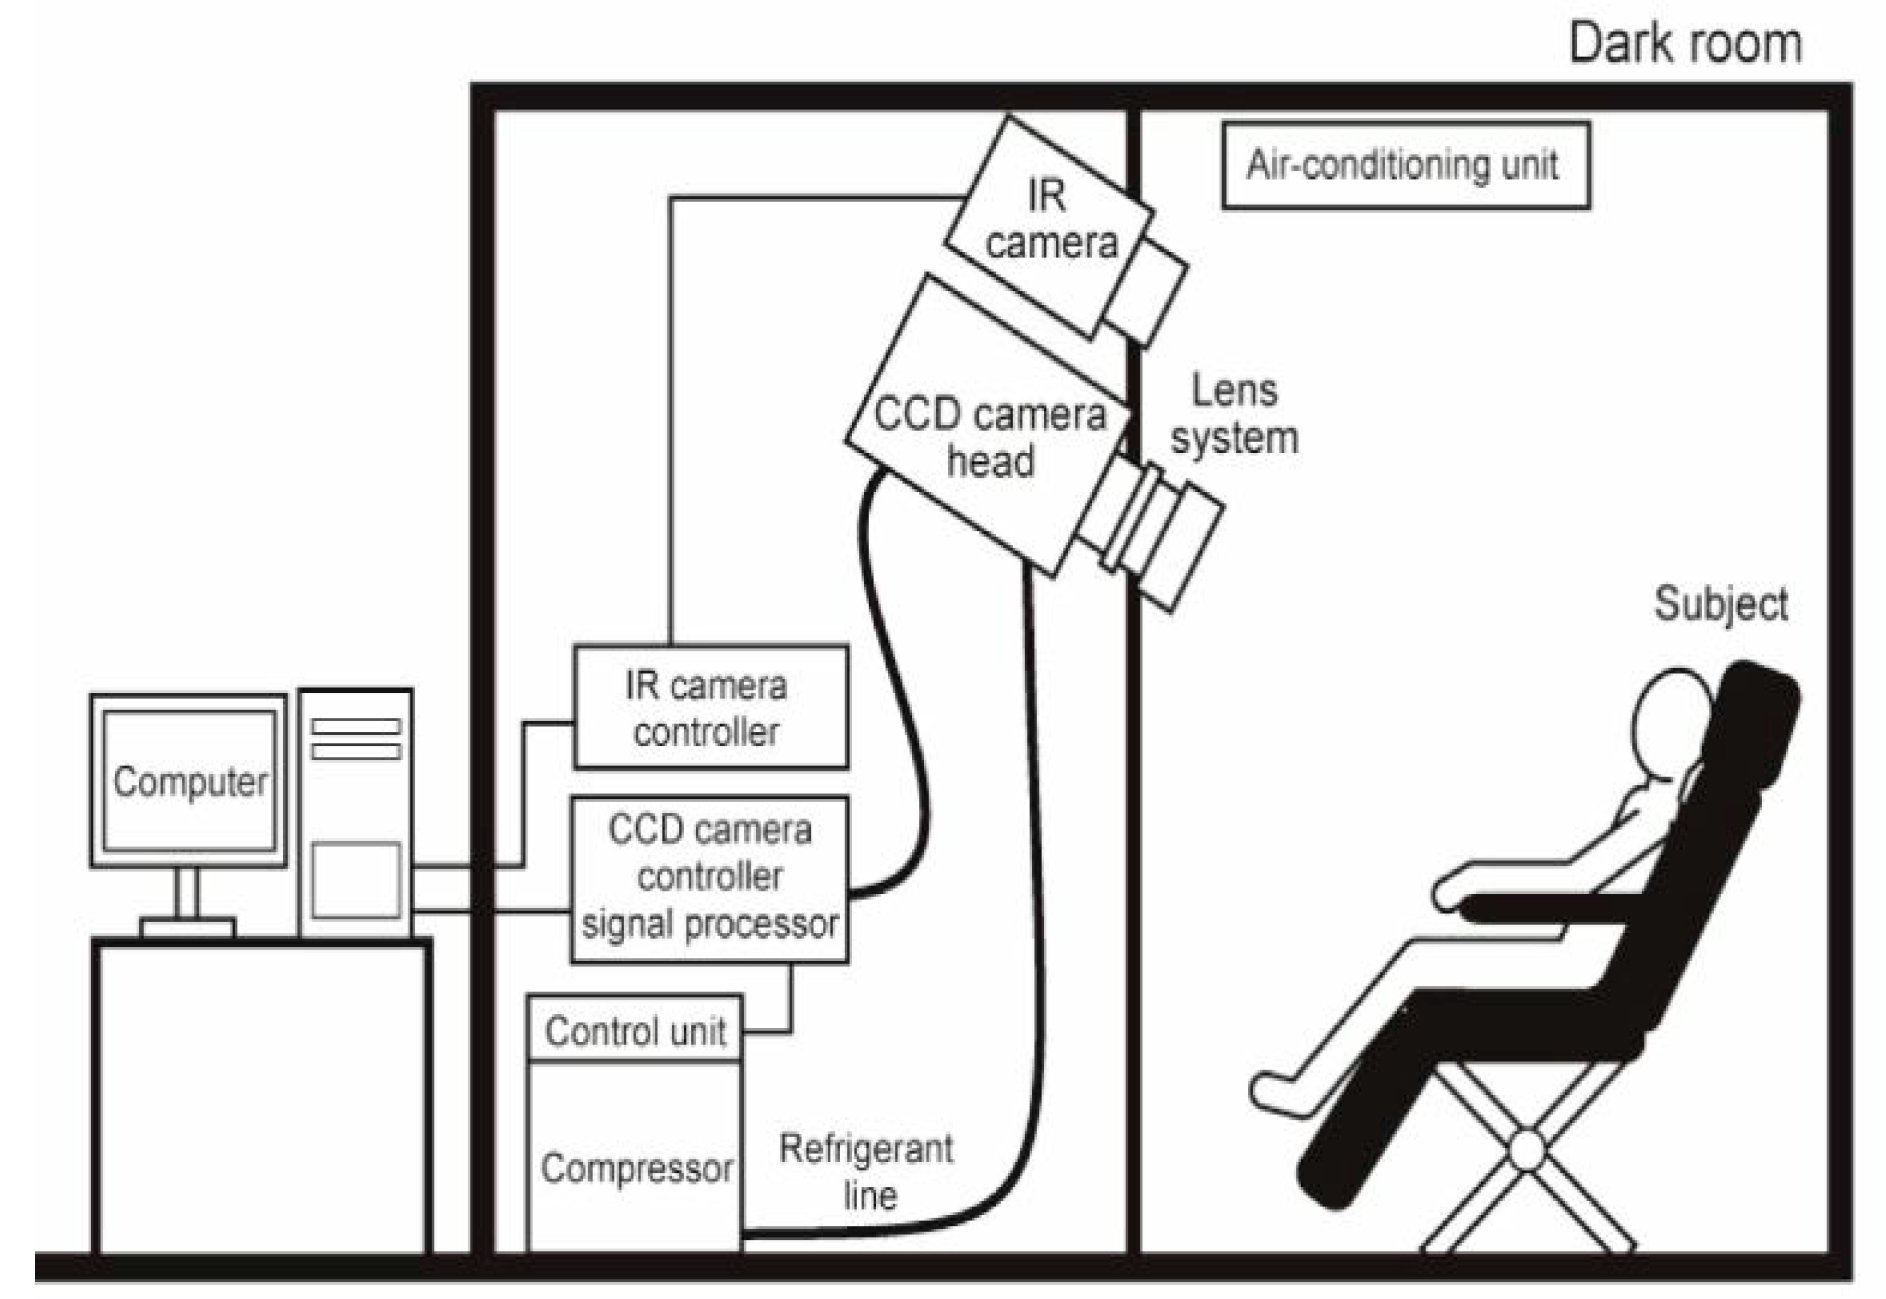
Designing a setup that is capable of capturing human bioluminescence and the faintest of nebulae is a very complicated process, and the experimental setup is shown in
Figure 5. By using a highly sensitive cryogenic CCD camera setup with the ability to detect light at the level of a single photon, Kobayashi succeeded in imaging the spontaneous photon emission of five subjects. The idea of the research was to provide a cost-efficient and simple alternative to the setup and process to perform the same experiments performed in past research that dealt with low light-emitting sources. Though SPADs are a great solution to do so, there were several drawbacks to our use case, which led us to discard them from our paper. First, the current commercial SPAD sensor modules alone retail for five to six times the price of the gear we used for our experiment. In addition, separately buying a lens for the experiment would add to the cost. DSLR and mirrorless cameras have become so common that almost anyone can get their hands on one if they need to carry out a similar study. This will allow for more research, and we shall have more data on human bioluminescence.
Moreover, SPAD detectors work on a single wavelength [
7]. However, we are trying to register photons throughout the visible spectrum of light (not through one particular wavelength), as this gives us a more in-depth idea of the color of light emitted from various parts of the human body. The details are given below:
The CCD sensor camera was cooled to a temperature of −120 °C in slow-scanning mode to avoid overheating.
Before the exposure, the subject is kept awake in a 400 lux room.
The naked subject is placed in a dark room; cortisol samples are taken through saliva 10 min prior to the experiment.
We have chosen a CMOS sensor for the study with sufficient dynamic range (included in the paper) to allow for enough sensitivity in low-light conditions to sense the entire spectrum of visible light (0.4–0.7 um). The expected photon emission at this time was 300 photon/s.cm
2 from the cheeks of the subject. Saliva was taken in these experiments to measure the cortisol level as a biomarker of endogenous circadian rhythms [
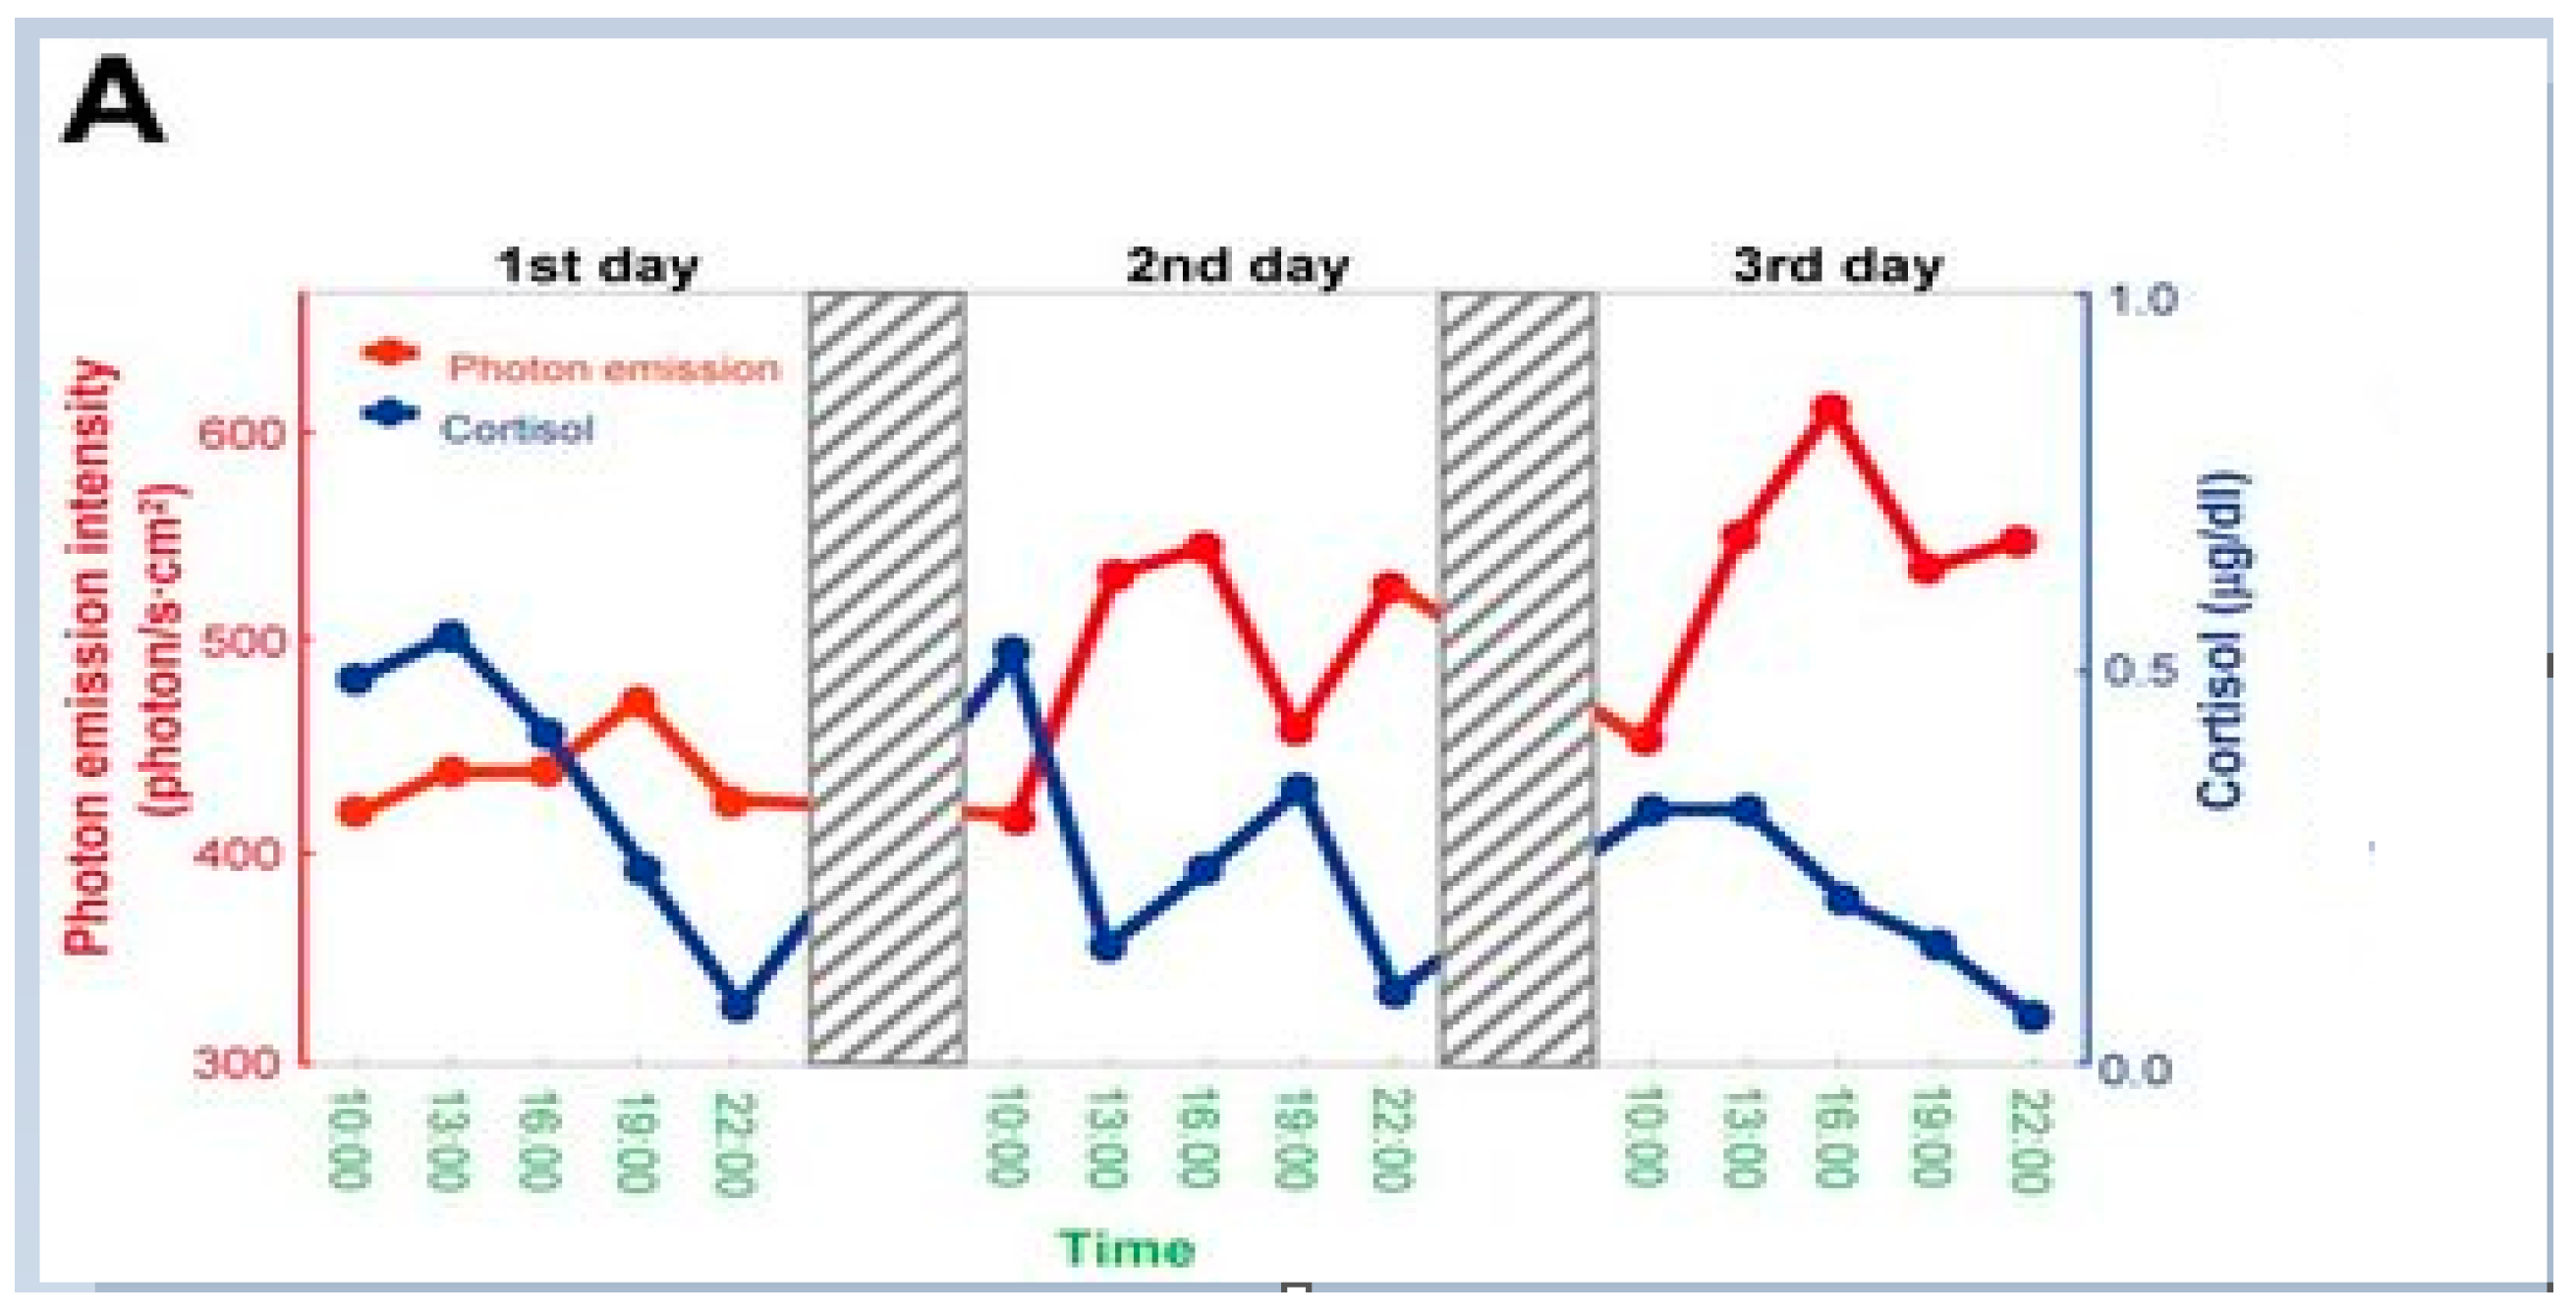
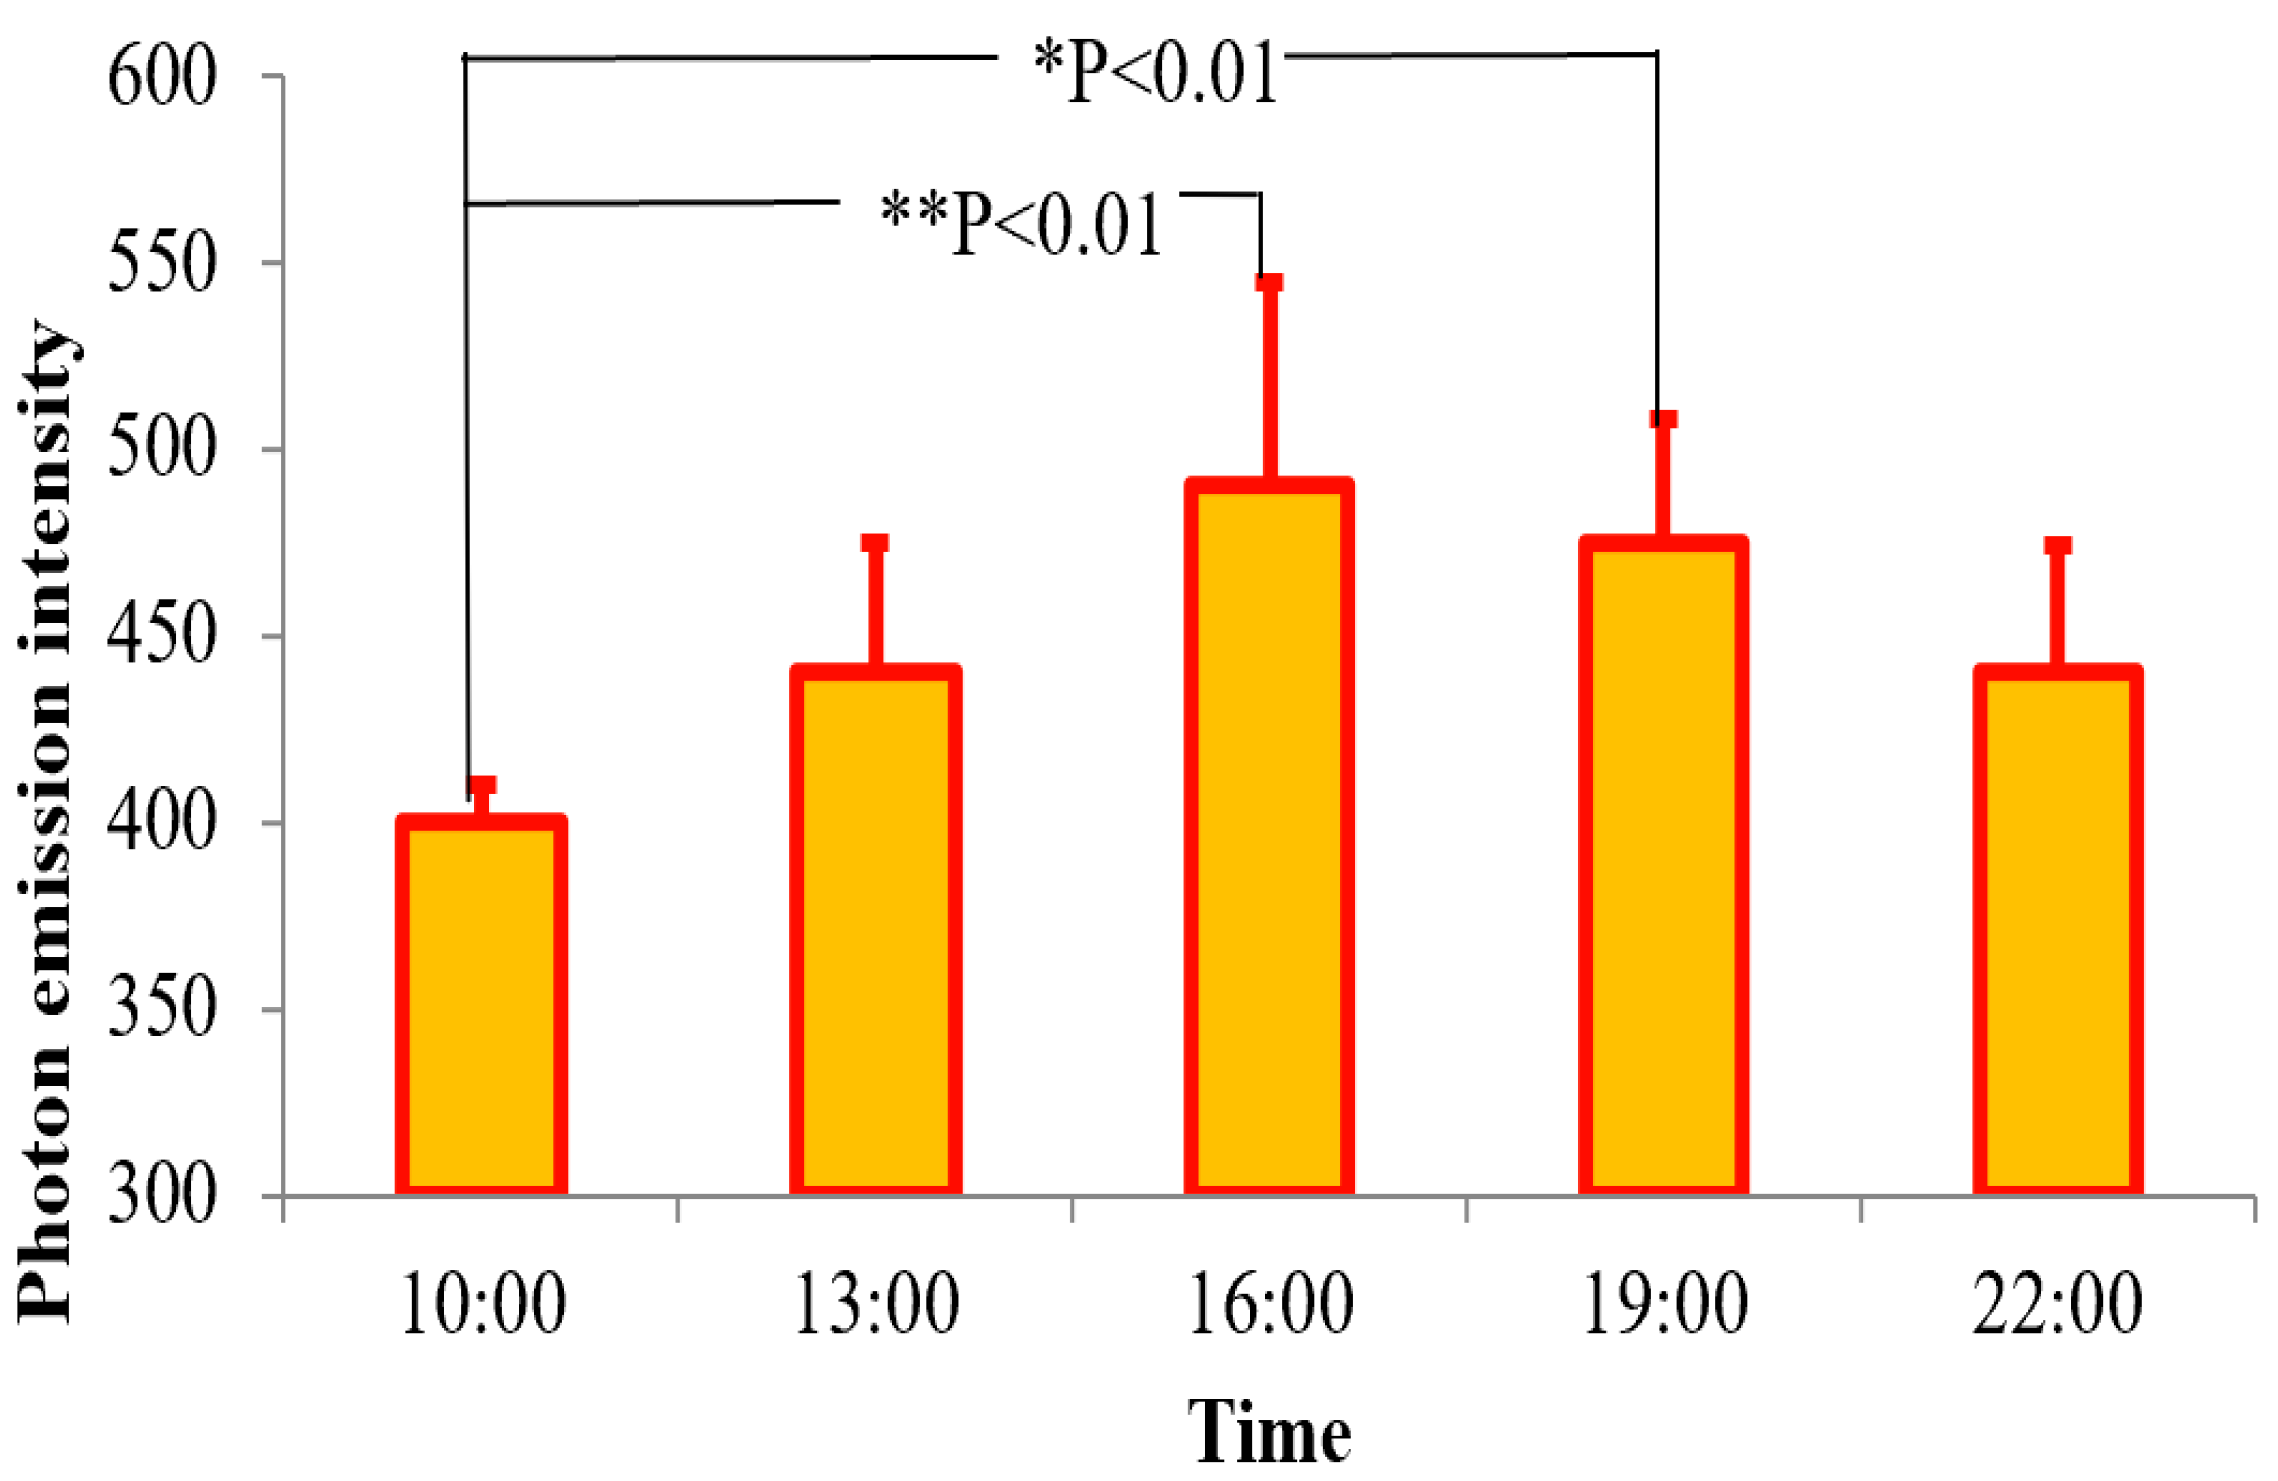
7]. The variations in photon emission (using the images produced) from the volunteer’s face were compared with the cortisol levels. A negative correlation diurnal rhythm of photon emission from the human body was found and is shown in
Figure 8.
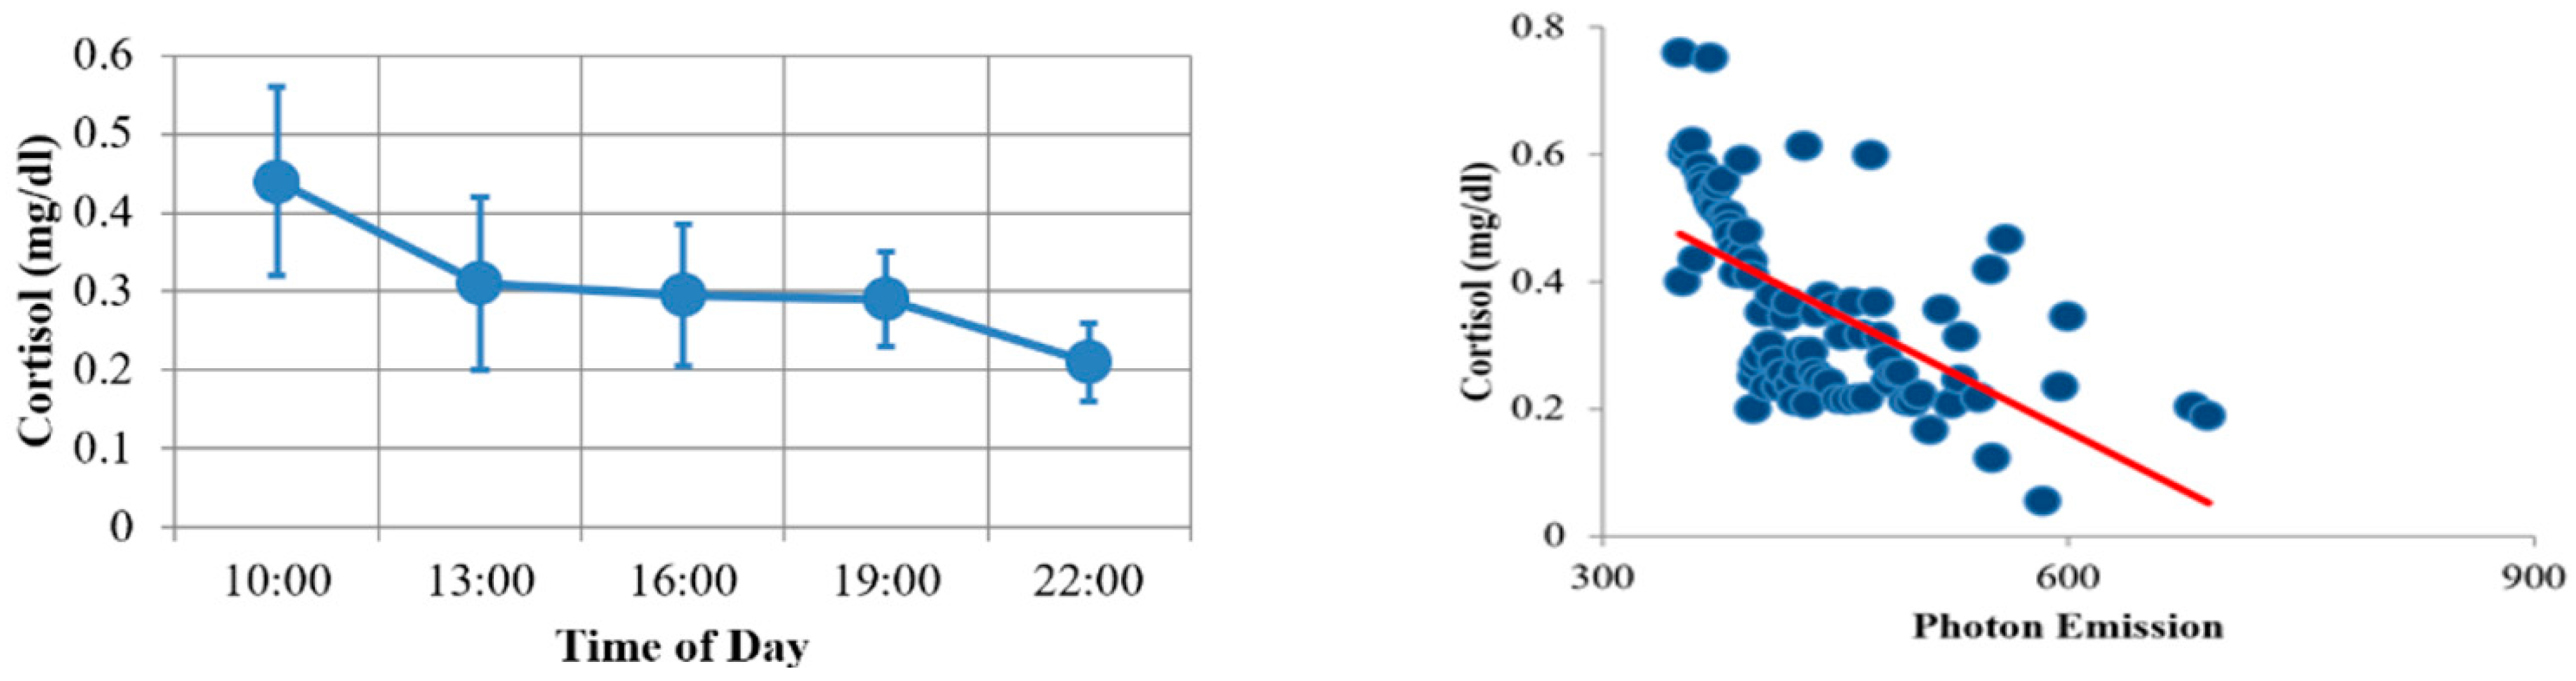
Data strongly suggested that the cortisol levels in the saliva (which is the biomarker of diurnal rhythm) and the photon emission intensity have a negative correlation. This suggests that the photon emission reflects the changes in the metabolic process, the latter of which is controlled by the circadian clock. The shaded region indicated the sleeping time of the subject. This is further illustrated by the daily changes in cortisol secretion and cortisol’s correlation to photon emission intensity in
Figure 9 and
Figure 10. A negative correlation was found: r = −0.3074,
p < 0.002.
3.1. The Process of Creating a Digital Image
The fundamental basis of creating a digital image is light. Without light, an image can never be created. Light can synonymously be called “information” when it comes to photography. When light from a subject reaches a camera, it has to travel through the glass elements of the lens. These elements decide how much light will enter, the focal length of the frame, and where these rays will be focused. For a sharp image to be produced, a real image must be formed on the surface of the sensor. Image sensors consist of photo sites (pixels) that convert the incoming light into charge/electrons. This charge is accumulated in the pixel well before being transferred for further processing. Depending on the nature of the sensor (CMOS or CCD) [
8], the charge is converted into voltage and then amplified using Op-Amps.
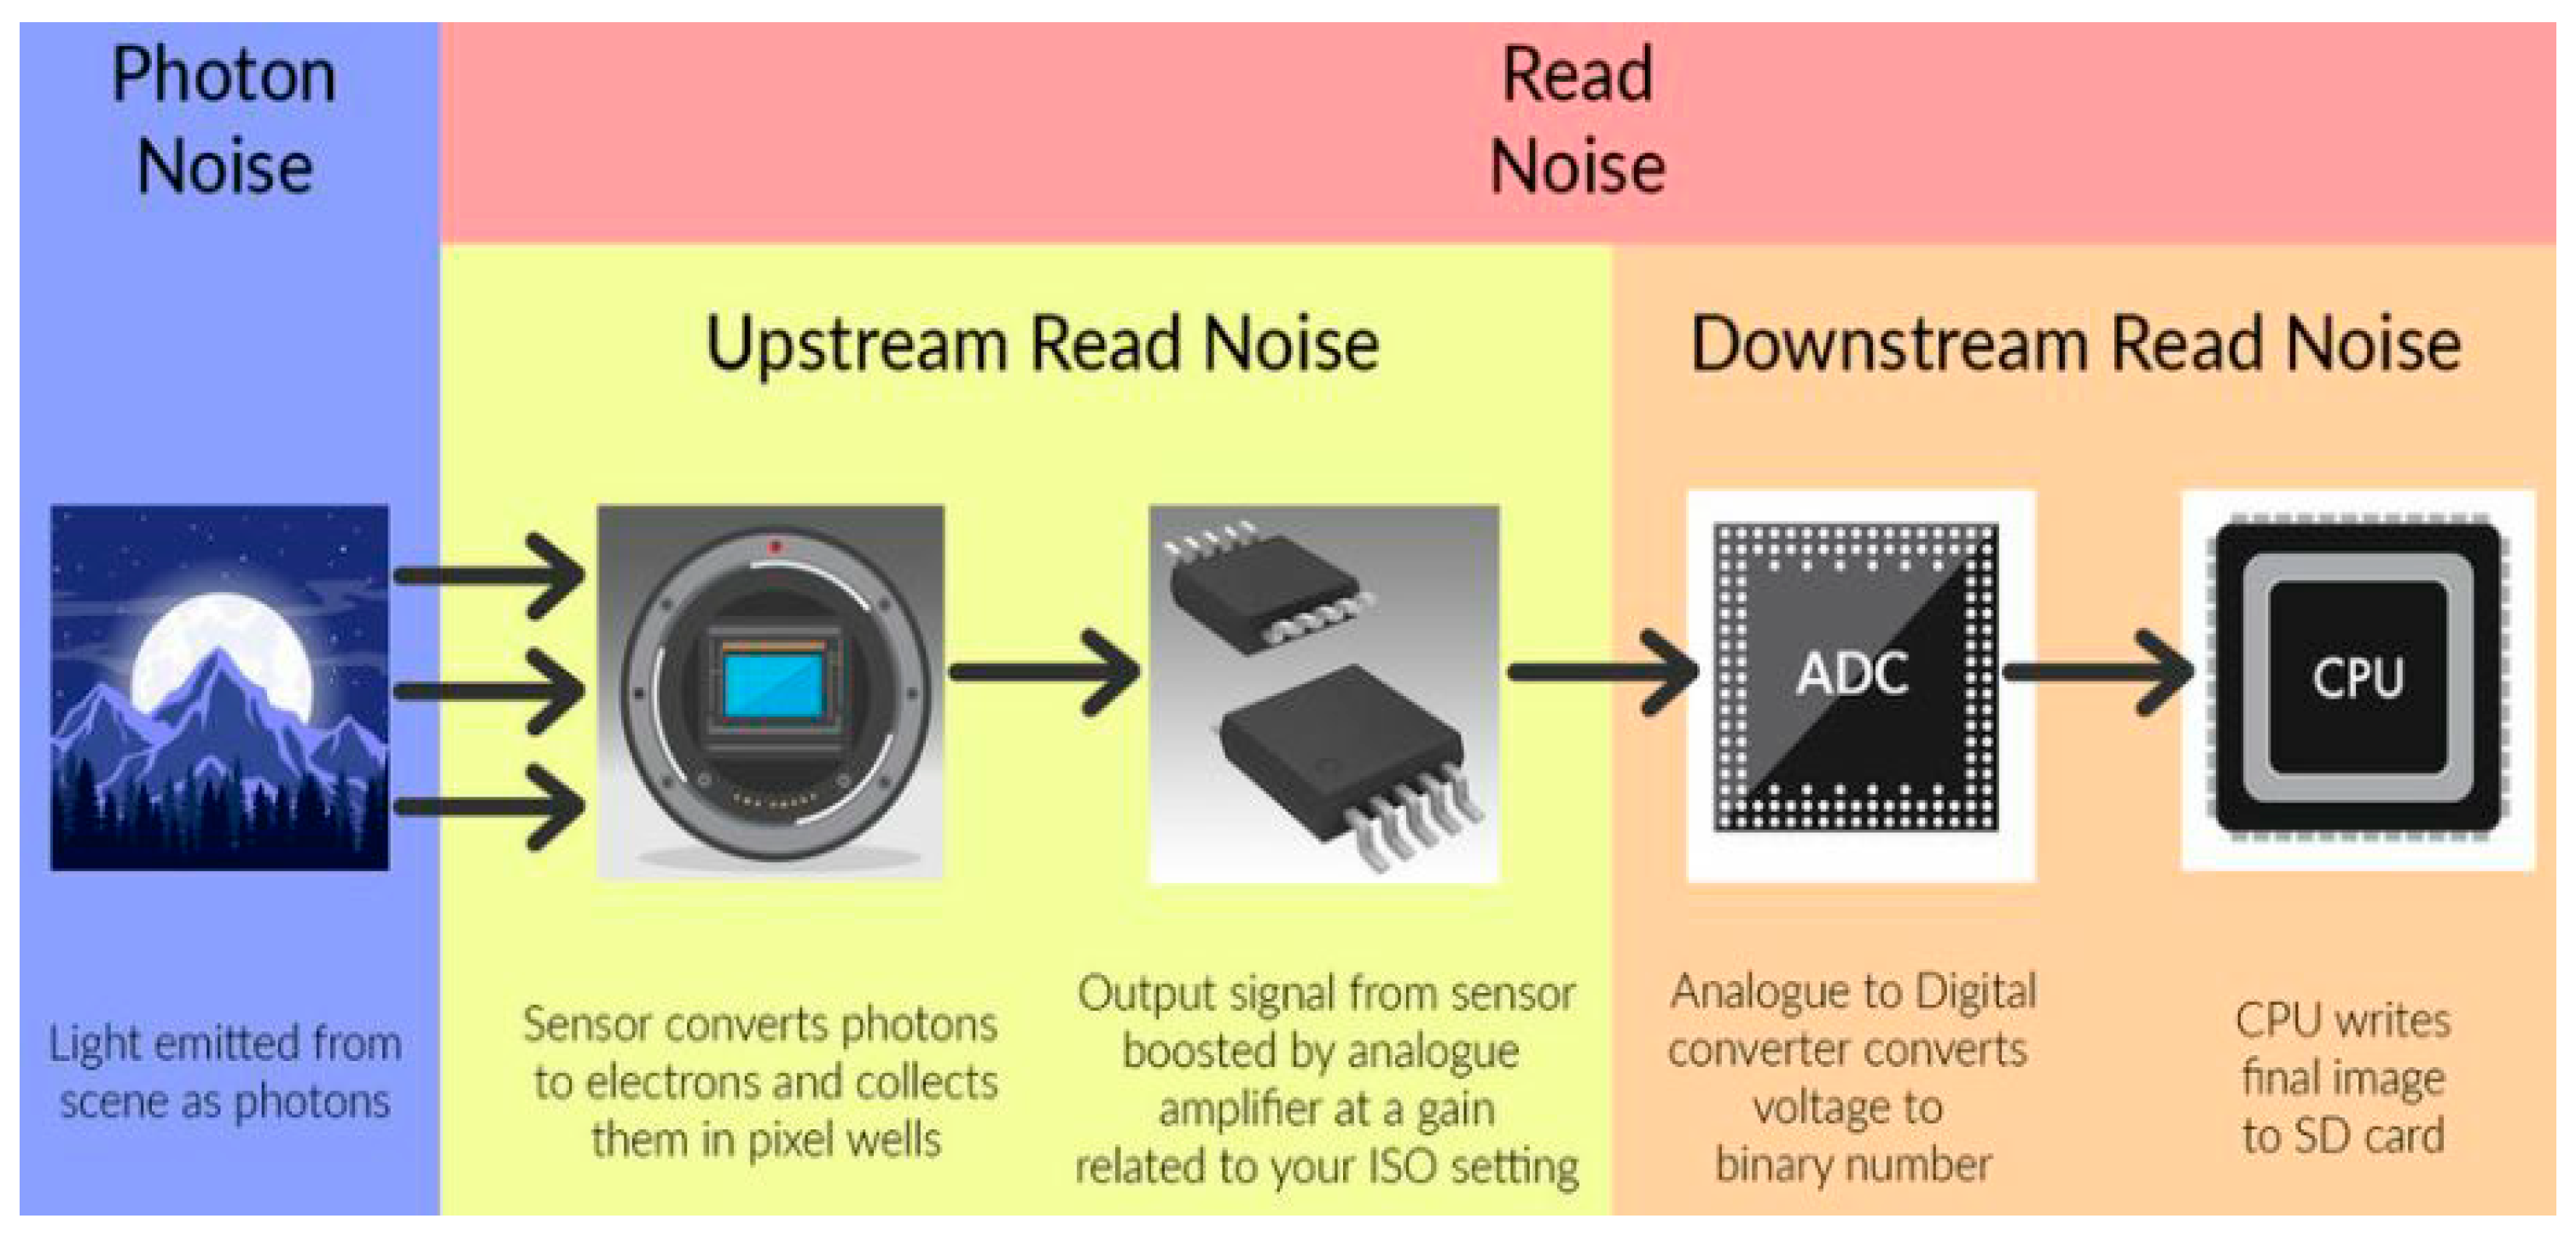
The voltage obtained here is ultimately the data we need. These data are further processed to become an image, but the image’s digital significance starts when a voltage value is assigned to it. When the exposure is concluded, all the electrons in the pixel well are boosted by an op-amp at a factor directly proportional to the ISO value set in the camera. The higher the ISO, the more the amplification occurs. ISO is a measure of the sensitivity of a camera’s sensor to light. The term ISO is an abbreviation for the International Organization for Standardization. The higher the number of the ISO, the more light is recorded by the camera’s sensor. This increases the brightness of the image. Then, the boosted signal is converted from analog to digital. CPU within the camera then processes this digital image and stores it in the memory card. This process is illustrated in
Figure 11.
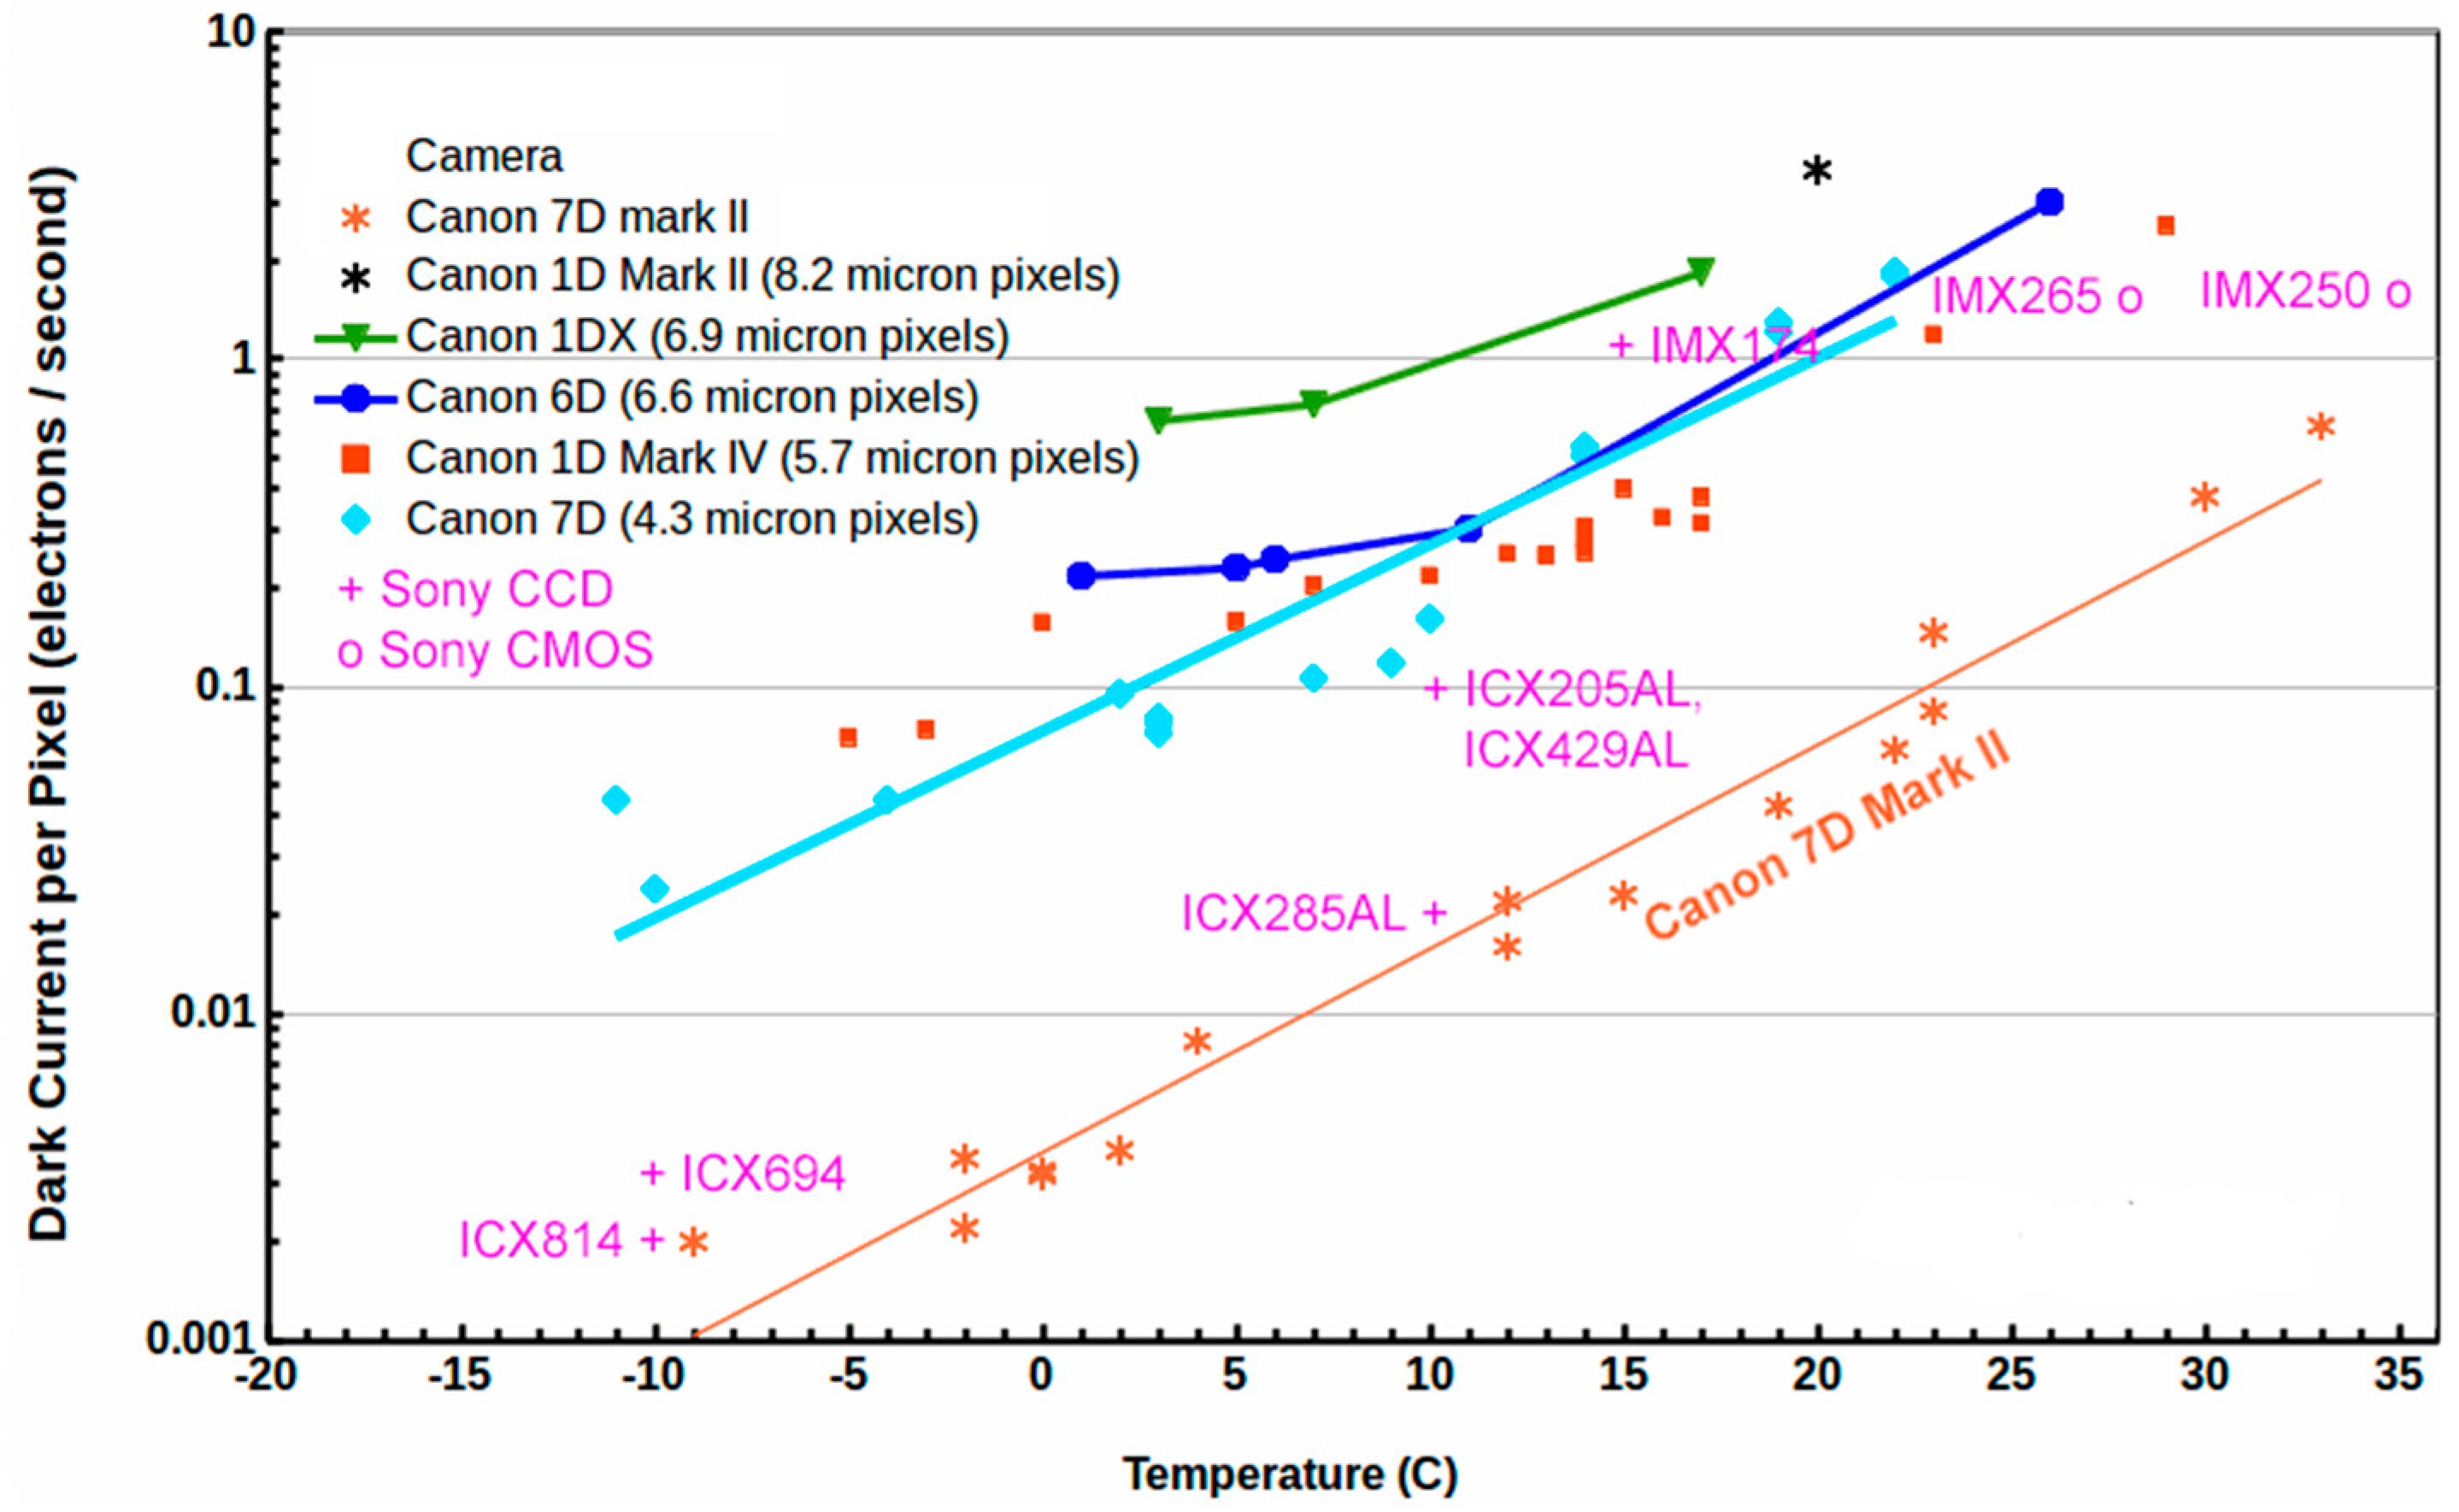
However, this does not conclude the process. When the light is being converted to voltage, various disturbances occur in the system; these disturbances are called “digital noise”. A small amount of current flows in the photosensitive pixel even when no incident photon is hitting it. This current is called a dark current, and it registers as unwanted noise. This noise is the reason to consider a dark frame for calibration in the stacking process. A dark current is the primary reason to have noise in the digital image [
9], and it is by virtue of temperature (
Figure 12).
The signal from dark current = DC * time, and the noise is (DC * time)0.5.
Photons are considered to be discrete. Due to the discrete nature of the electric charge, digital images also suffer from shot noise. The typical read noise in a CMOS is on the order of 6 to 16 electrons. During the process of analog-to-digital conversion, amplification, and imperfections in the electronics, there will be “readout noise”. CMOS-based cameras can provide a much lower noise floor when compared to CCD cameras. Vital information can be hidden due to the high noise profile, and hence lower noise is required to capture such images. There are two types of reading noise, upstream read noise and downstream read noise [
10]. Upstream read noise is the noise that is induced during the hour before the analog amplification process; for example, the noise that is produced due to the sensor heating up during long exposure photography is upstream read noise. Downstream read noise is the noise that is induced after the amplification. Analog-to-digital conversion and image processing, for example, produce downstream read noise. Since upstream read noise is induced during the amplification using higher ISO, it will also increase the read noise and result in a grainy image. However, downstream read noise remains unaffected by ISO amplification. Therefore, it can be seen that if a camera has very low or zero downstream read noise, it would not really matter whether the ISO is increased for amplification while taking a photograph or whether the exposure is increased later during post-processing, since the same upstream read noise is being amplified in both cases. Otherwise, if the downstream read noise is strong, increased exposure in post-processing will also increase the downstream read noise and ruin the image. This concept is further illustrated in
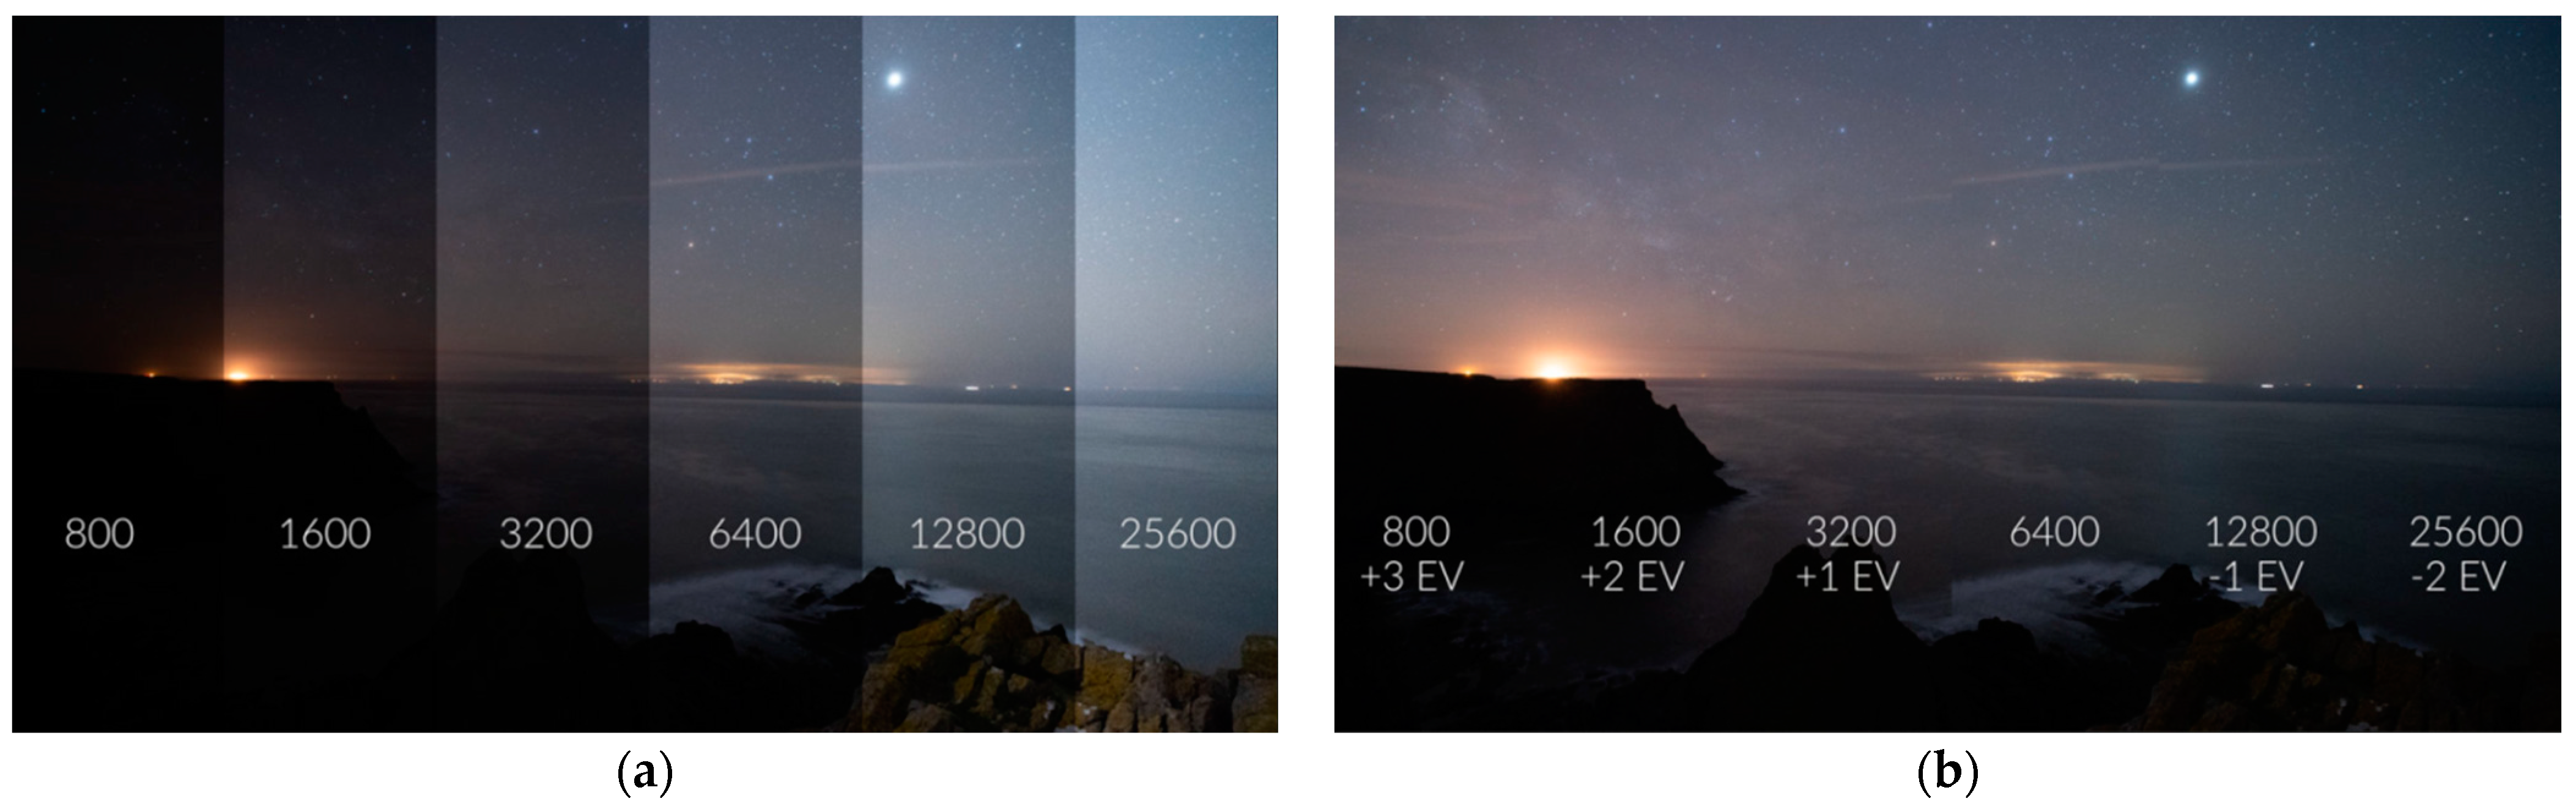
Figure 13. This property of some cameras that have low downstream read noise is called ‘ISO Invariance’. The Sony Alpha camera series is popularly known for having this feature, and hence they are an ideal choice for low-light imaging. Then, if the exposure values (EV) are balanced in post-production, it is observed that each image has the same amount of noise. Thus, boosting the exposure in post is the same as increasing the ISO in the camera due to the lack of downstream read noise. Therefore, this justifies our selection of the camera body for this work.
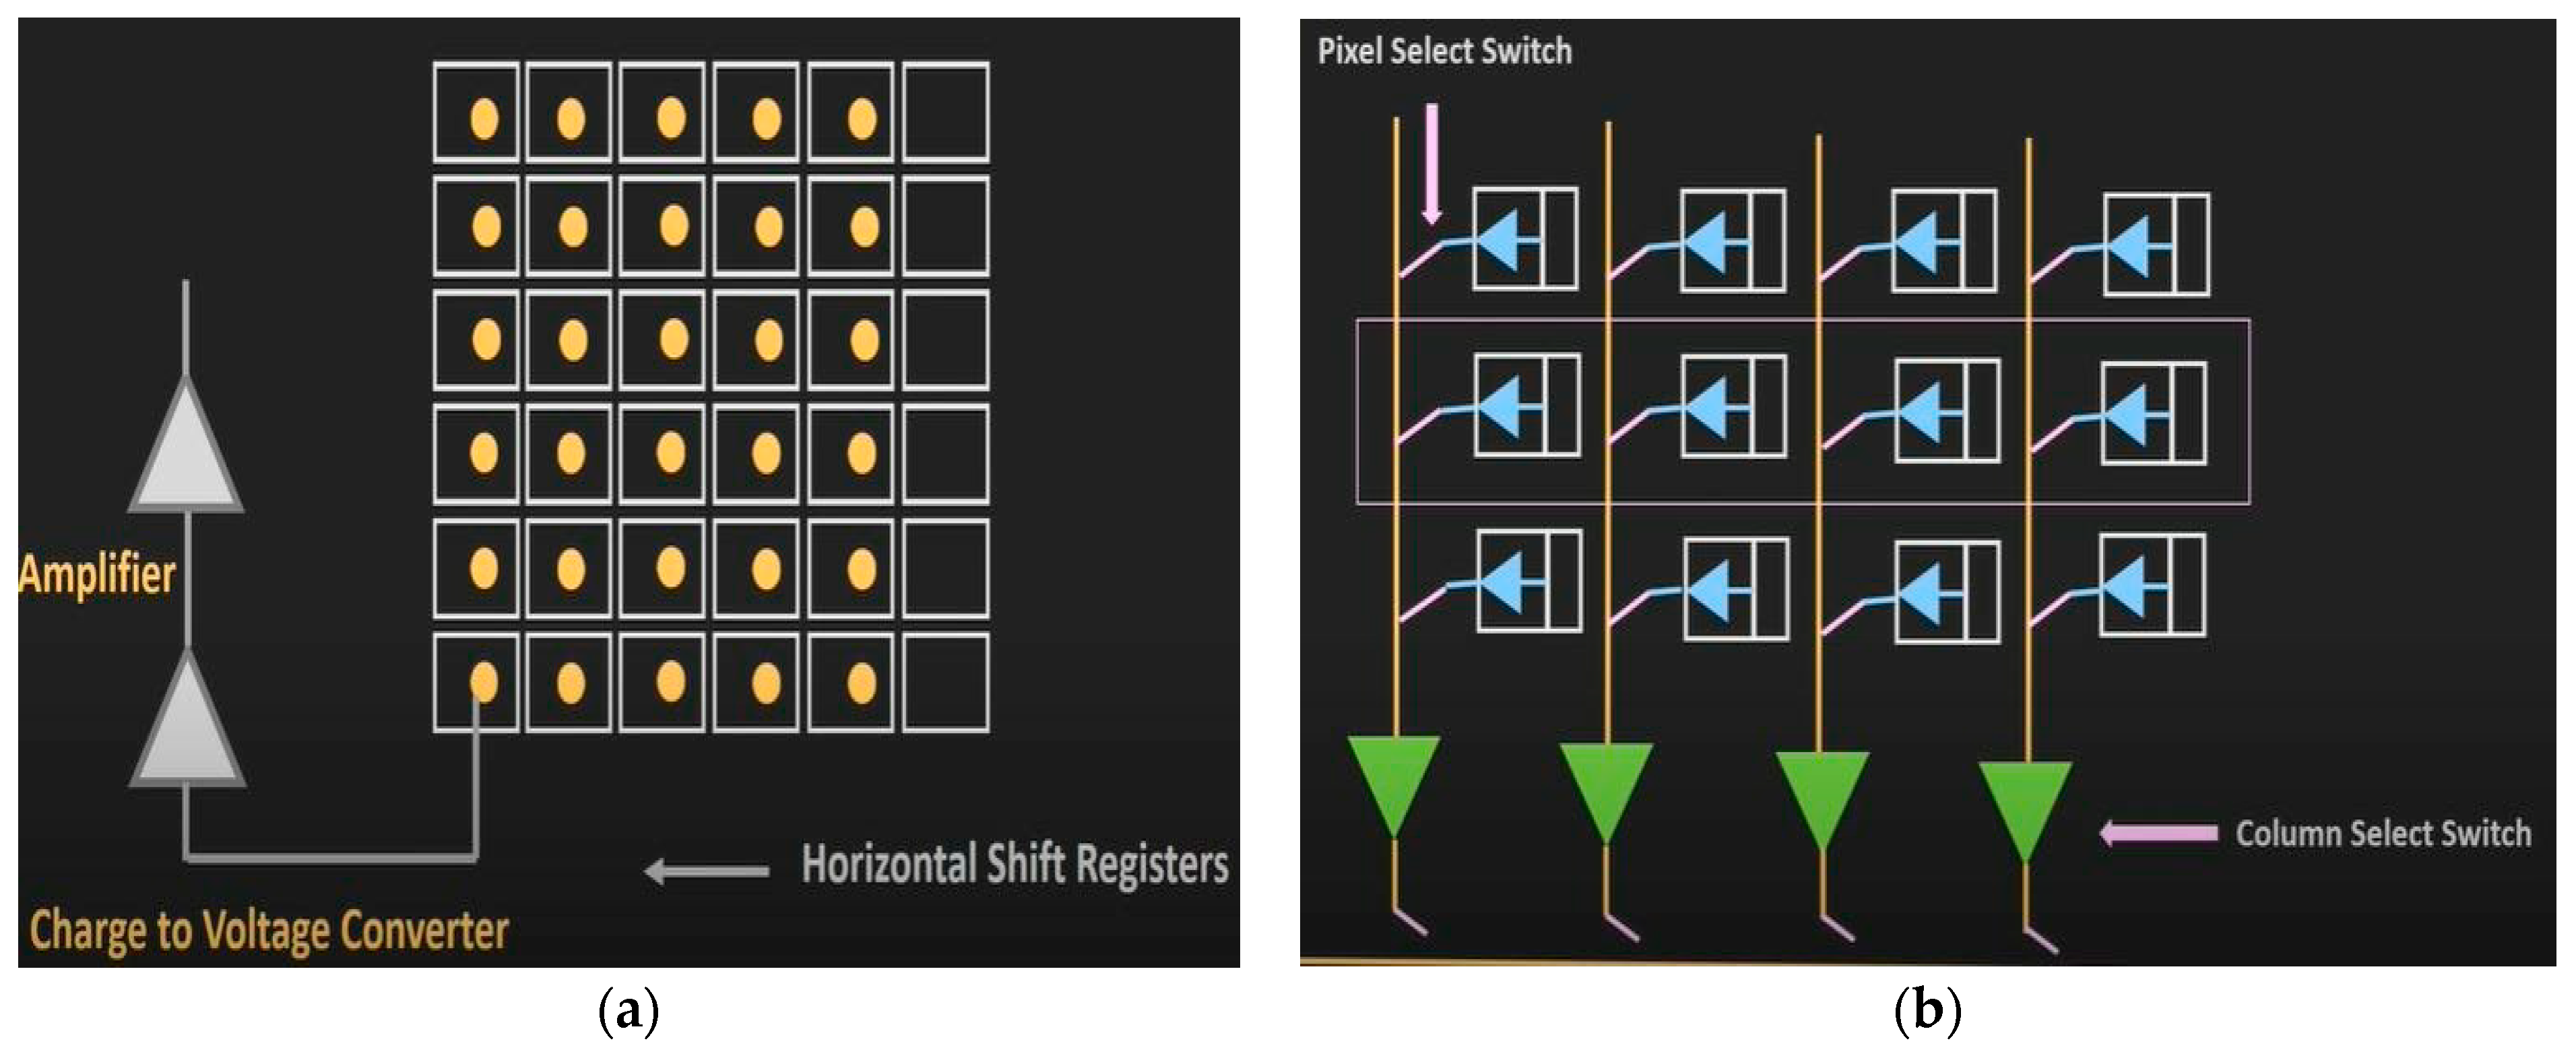
There are primarily two types of sensors, CMOS and CCD (charge-coupled device) sensors in camera bodies [
11]. These have different methods for producing a digital image, and hence these two have different properties. In CCD sensors, each row of charge is individually converted to voltage first. After the conversion, the signal is amplified altogether. Timers and ADC converts are only integrated outside the chip, after the amplifier, as shown in
Figure 14a. Since the charge in each pixel is converted individually, processing speed is low. The same amplifier is used for each pixel, as evident from the diagram. Therefore, the amplification is identical, and the noise pattern remains the same throughout the frame. CMOS cameras can have higher frame rates than their CCD counterparts. This is because the reading of the pixels can be performed faster than having to wait for a CCD’s charge transfer. This feature is essential for machine vision systems that often rely on real-time image processing for automation or image data analysis.
In the CMOS sensor, timers and ADC converters are integrated with each pixel, as shown in
Figure 14b. The charge in each pixel is converted simultaneously using a pixel select switch; hence, the processing speed is high. Since a different amplifier is used for each pixel, the amplification and the noise pattern vary throughout the frame.
3.2. Dslr vs. Mirrorless Camera Bodies
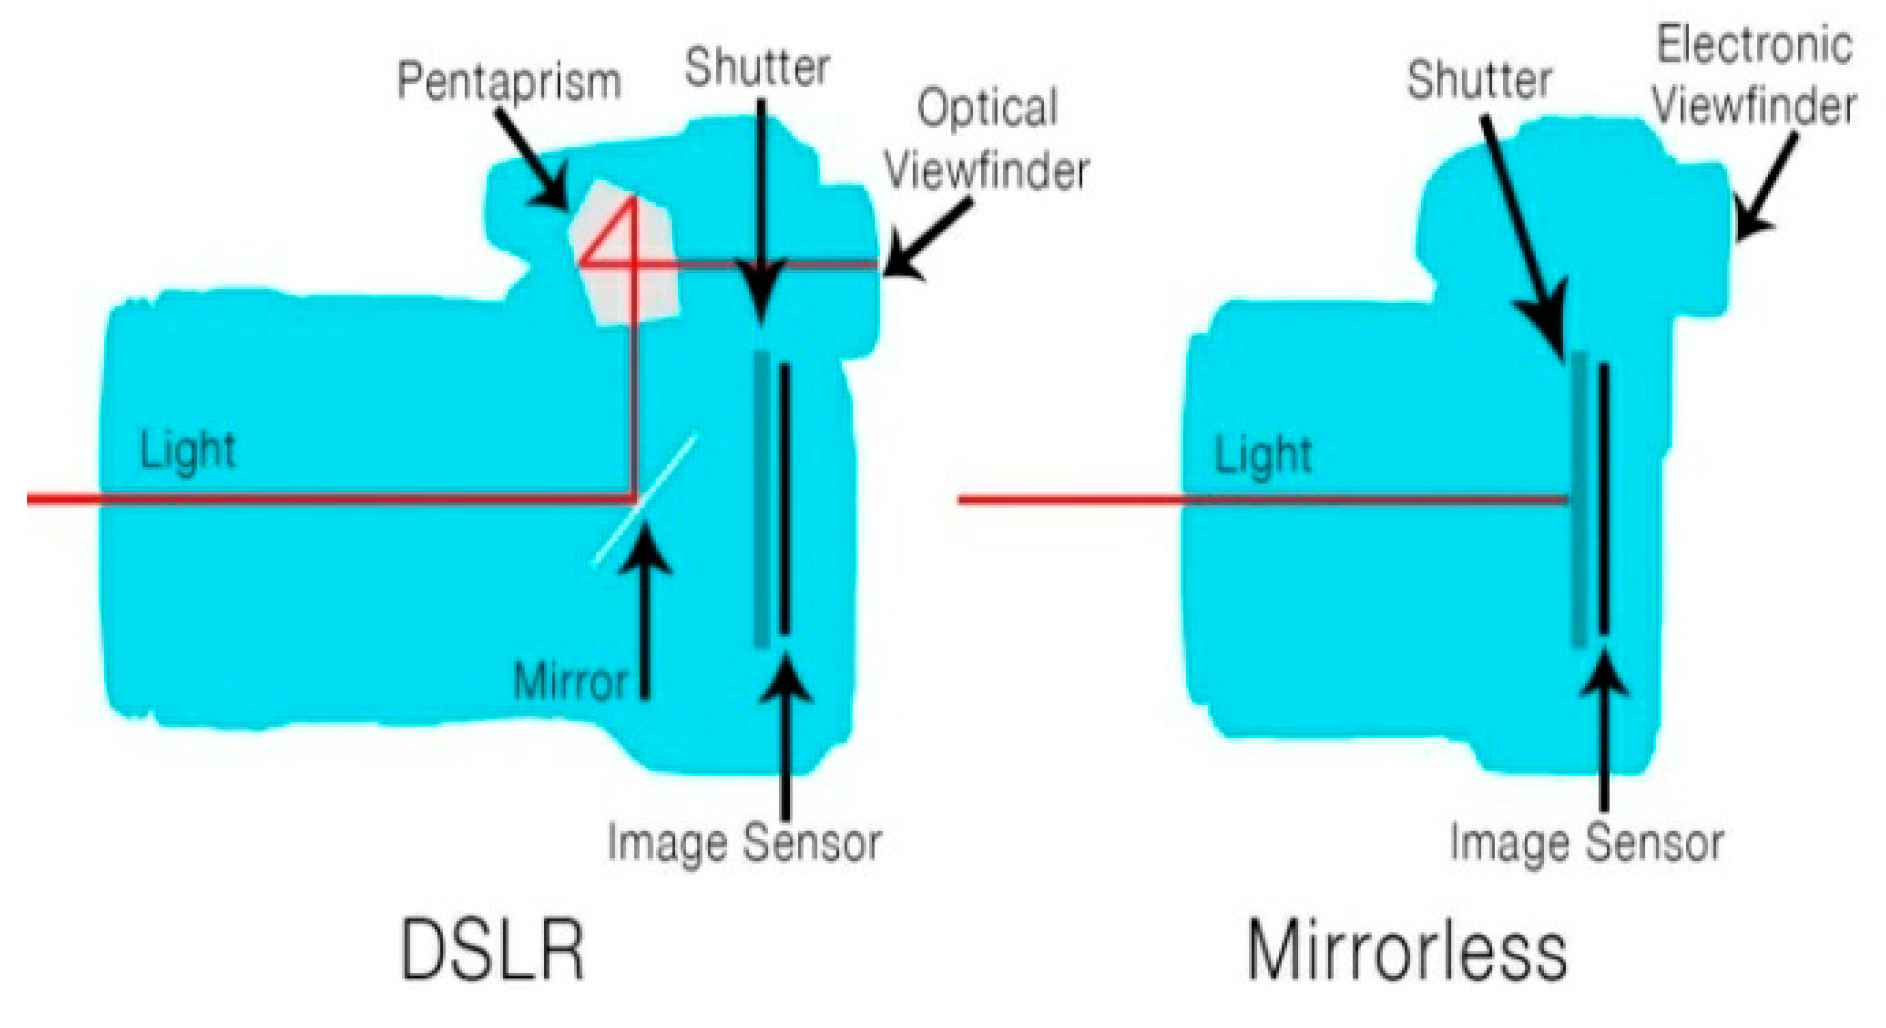
Camera bodies have been an ever-evolving subject, starting from the first SLR cameras that used a chemical film that was photosensitive and when exposed to light would generate a “negative”. In either case, the same lenses were used to form the latent image. Electronic sensors replaced these films, and hence Digital-SLRs were invented. These bodies would allow light directly from the outside world to enter the lens, bounce through a mirror, travel through a prism, and enter the “eyepiece” or “viewfinder” of the DSLR. When the user presses the shutter button, the mirror flips, exposing the sensor to the latent image and forming a digital image. However, this made the camera bodies very bulky, and the event of taking a snap was significantly noisy. Therefore, these cameras were then followed by the invention of mirrorless cameras, in which the mirror and prism system were completely eliminated. This resulted in a much more compact and light camera body. Instead of the real image coming through the viewfinder, it was replaced with the “EVF/Electronic View Finder” [
12], which would take the live feed from the sensor and display it on the back monitor and EVF. This advancement made the cameras more compact and shifted the cameras from mechanical to electronic systems, hence allowing for more reliable image processing. This resulted in better low-light performance and introduced ‘back-illuminated’ sensors.
Figure 15 elaborates further on this.
3.3. Experiment Apparatus
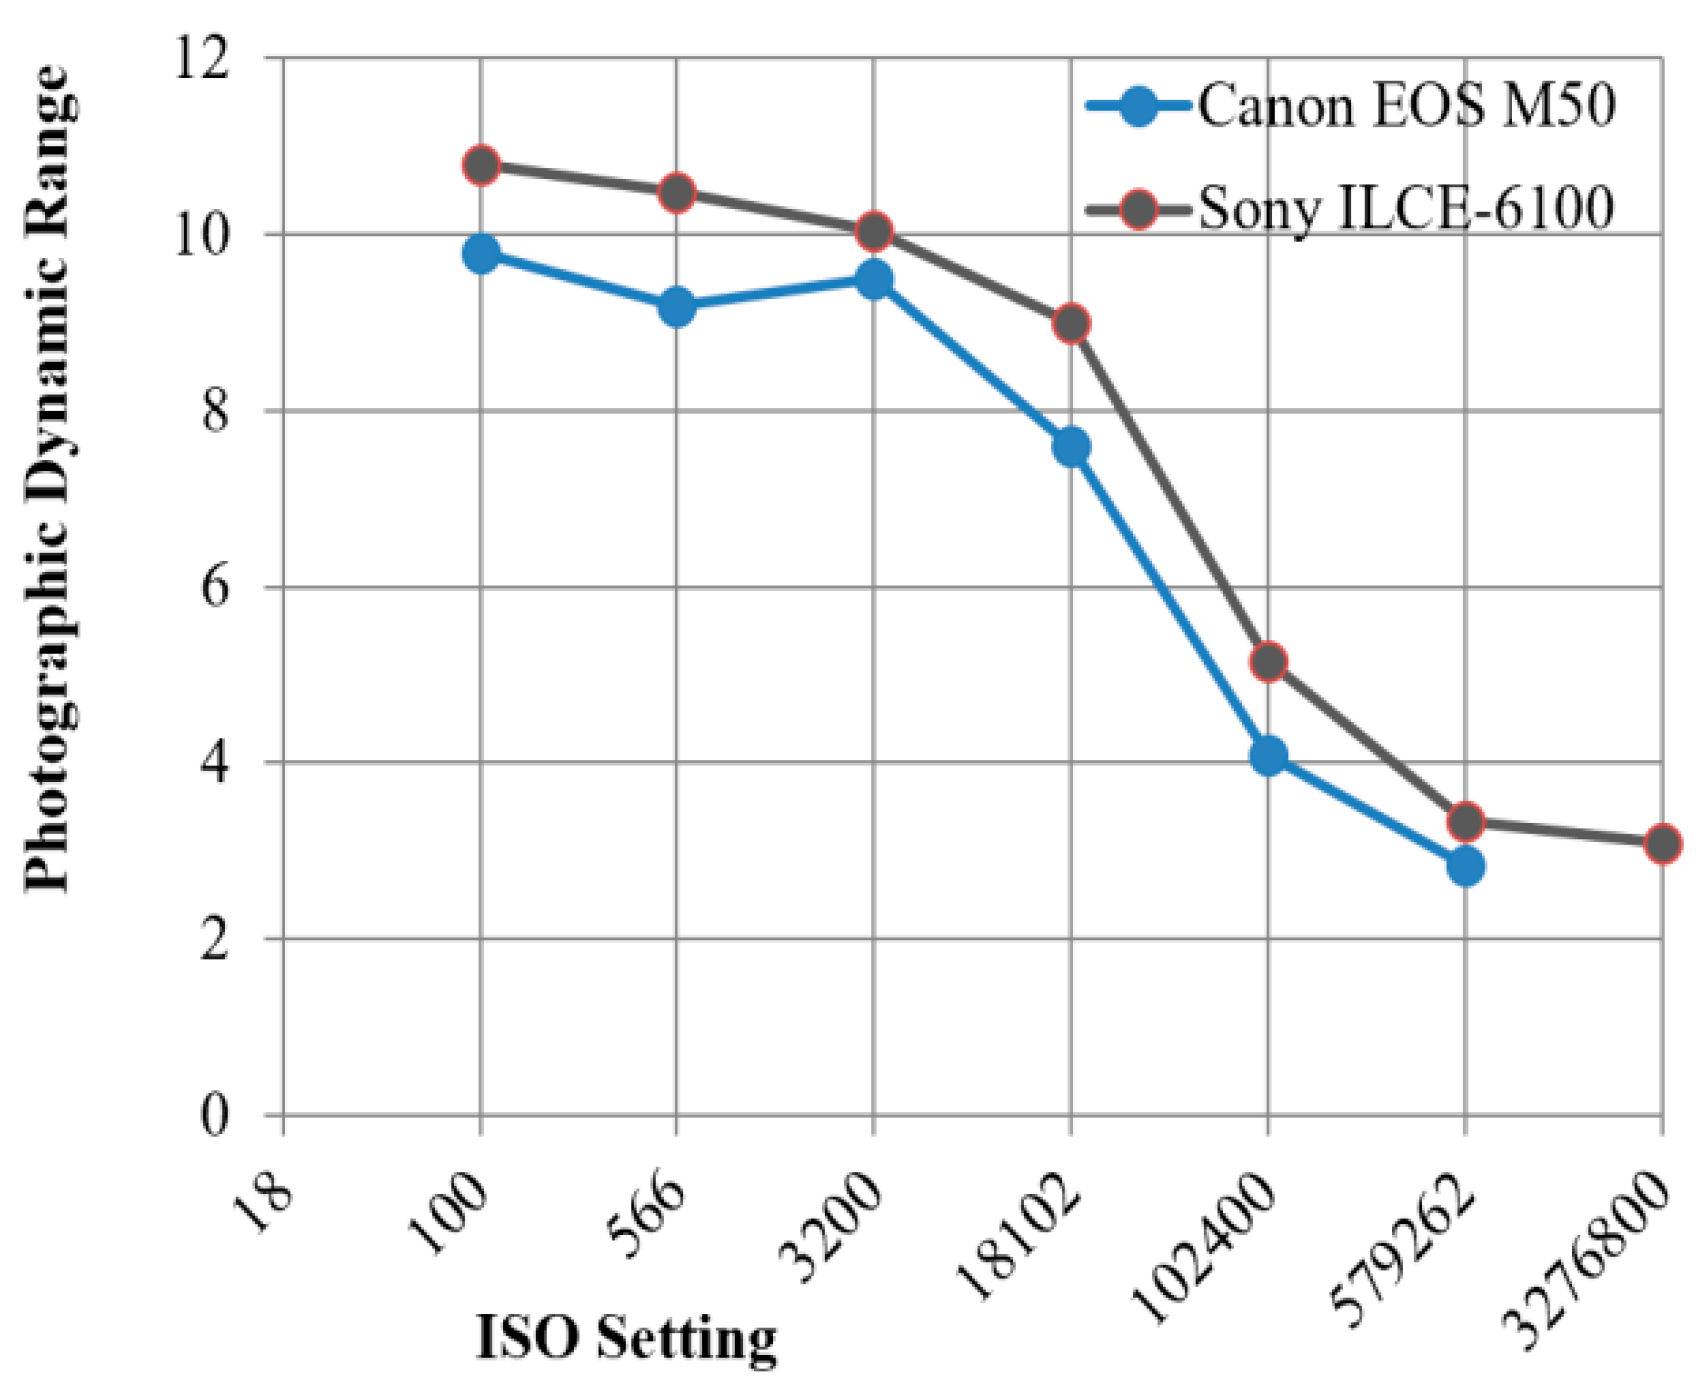
The ISO of the camera at which the photo is being taken amplifies the noise and decreases the dynamic range of the image produced. To choose the right ISO for our work, we refer the reader to the graph in
Figure 16 and
Figure 17. Electron-multiplying CCD (EMCCD) cameras, with their precisely controlled thermoelectric cooling and EM gain, make them the ideal detector solutions for bioluminescent imaging in which photon fluxes from luciferase may be as low as 0.05 photons per µm2 of the sensor. The quantitative stability of EM gain across the entire range of camera readout speeds, pre-amplifiers, and temperature settings is a must to ensure reliable quantitative performance throughout a bioluminescent kinetic acquisition and repeatability between measurements.
3.4. Image Stacking
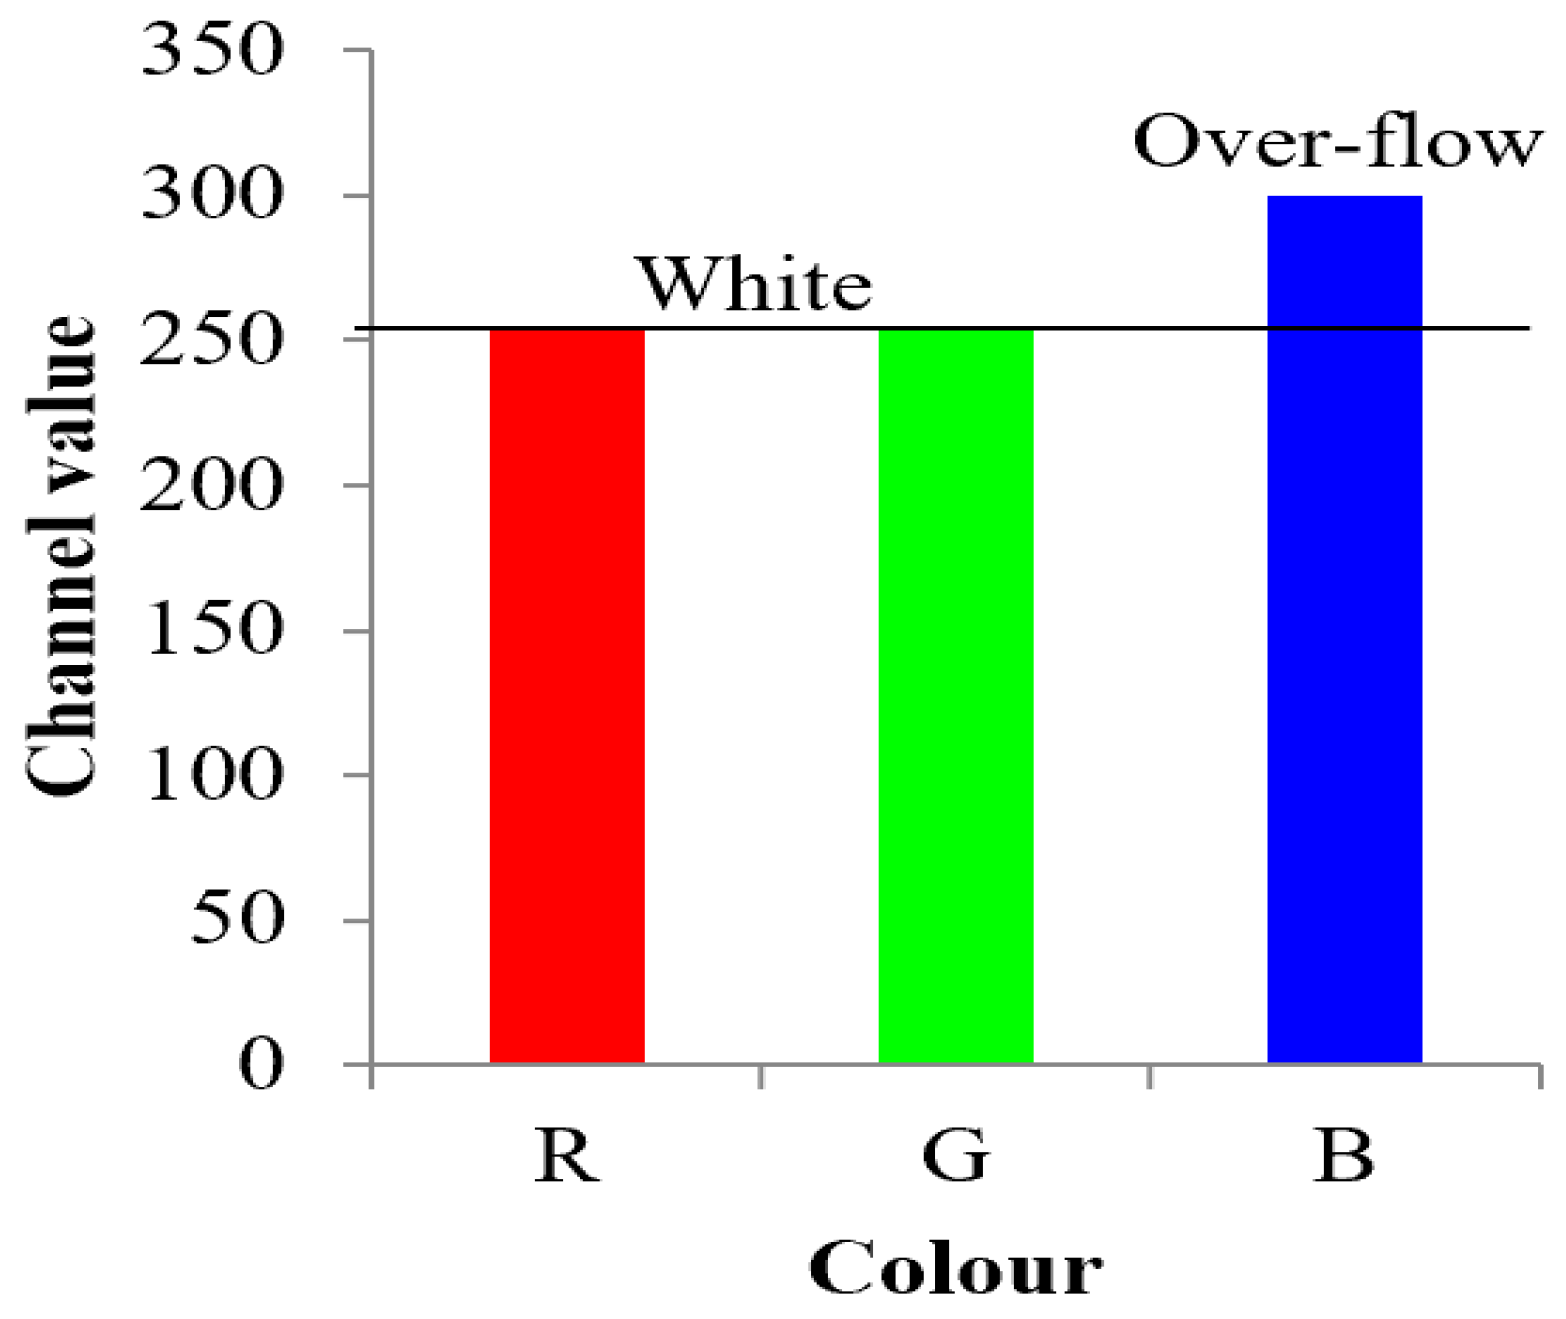
Taking a photo of a celestial object is essentially catching more and more photons using long exposure. Each pixel takes values in red, green, and blue colors only. These channels are divided into 256 discrete digital values from 0 to 255 for each color. A combination of these three values produces the color of the pixel [
13]. Allowing a pixel to expose beyond this value will flood the value above 255 for at least one color and will result in a white pixel with no information.
Waiting for photons is like rolling a die to predict how many photons from a certain object will hit the sensor during a given period of time within a given interval of certainty. These incoming photons are from the target “signal”, and it has to be predicted that the number of photons from the object will be higher than the dark surrounding, but it cannot be predicted where the next photon will hit, since this is totally random. Therefore, the “Law of Large Numbers” has been followed by the rolling the dice method, as shown in
Figure 18.
The first few trials will yield random, unusable information. However, after the experiment of rolling the dice has been performed several times, the bias in information in different pixels starts to appear. Allowing for more dice rolls is as effective as taking longer and longer exposures. Hence, exposures with short durations tend to be noisier than those with longer durations, since more photons have hit the right pixels. By taking more and more exposures, all the data are added by stacking; also, this number is divided by the total number of exposures taken; otherwise, the image will become brighter and brighter, resulting in an unusable white image. The division by ‘n’ only keeps the brightness level constant. This results in a better signal-to-noise ratio (SNR).
The dark current suppression technology blocks the DC * time component, leaving only the random noise. In order to make dark current suppression technology effective, manufacturers have had to refine manufacturing methods so that the sensors are very uniform, reducing pattern noise (banding). The measurement of dark frames has the main purpose of subtracting an offset caused by the accumulation of the dark current level (DC * time) and pattern noise (including banding and amp glow) from the pixel-to-pixel variation in (DC * time), but dark current subtraction cannot remove random noise.
Dark current suppression technology does the same thing, but in the pixel with the hardware architecture of the pixel, and it does so during the exposure on the subject (while the camera is taking the picture). Therefore, there is no need for dark frame subtraction in cameras in which the on sensor dark current suppression technology is well-implemented (e.g., as in most recent camera models from the last few years). With such sensors, dark current is already subtracted during the light integration. There is no need to do it again in post-processing (this would result in more noise).
If the numbers of dark frames are subtracted, the equation for random noise at the darkest signal level in the image is given as:
where
r = read noise,
DC = sensor dark current,
t = time,
DCF = dark frame dark current,
N = number of light frames, and
M = number of dark frames. To measure the dark frames at the same temperature as the light frames, with
DCF =
DC, the equation reduced to the noise is proportional to:
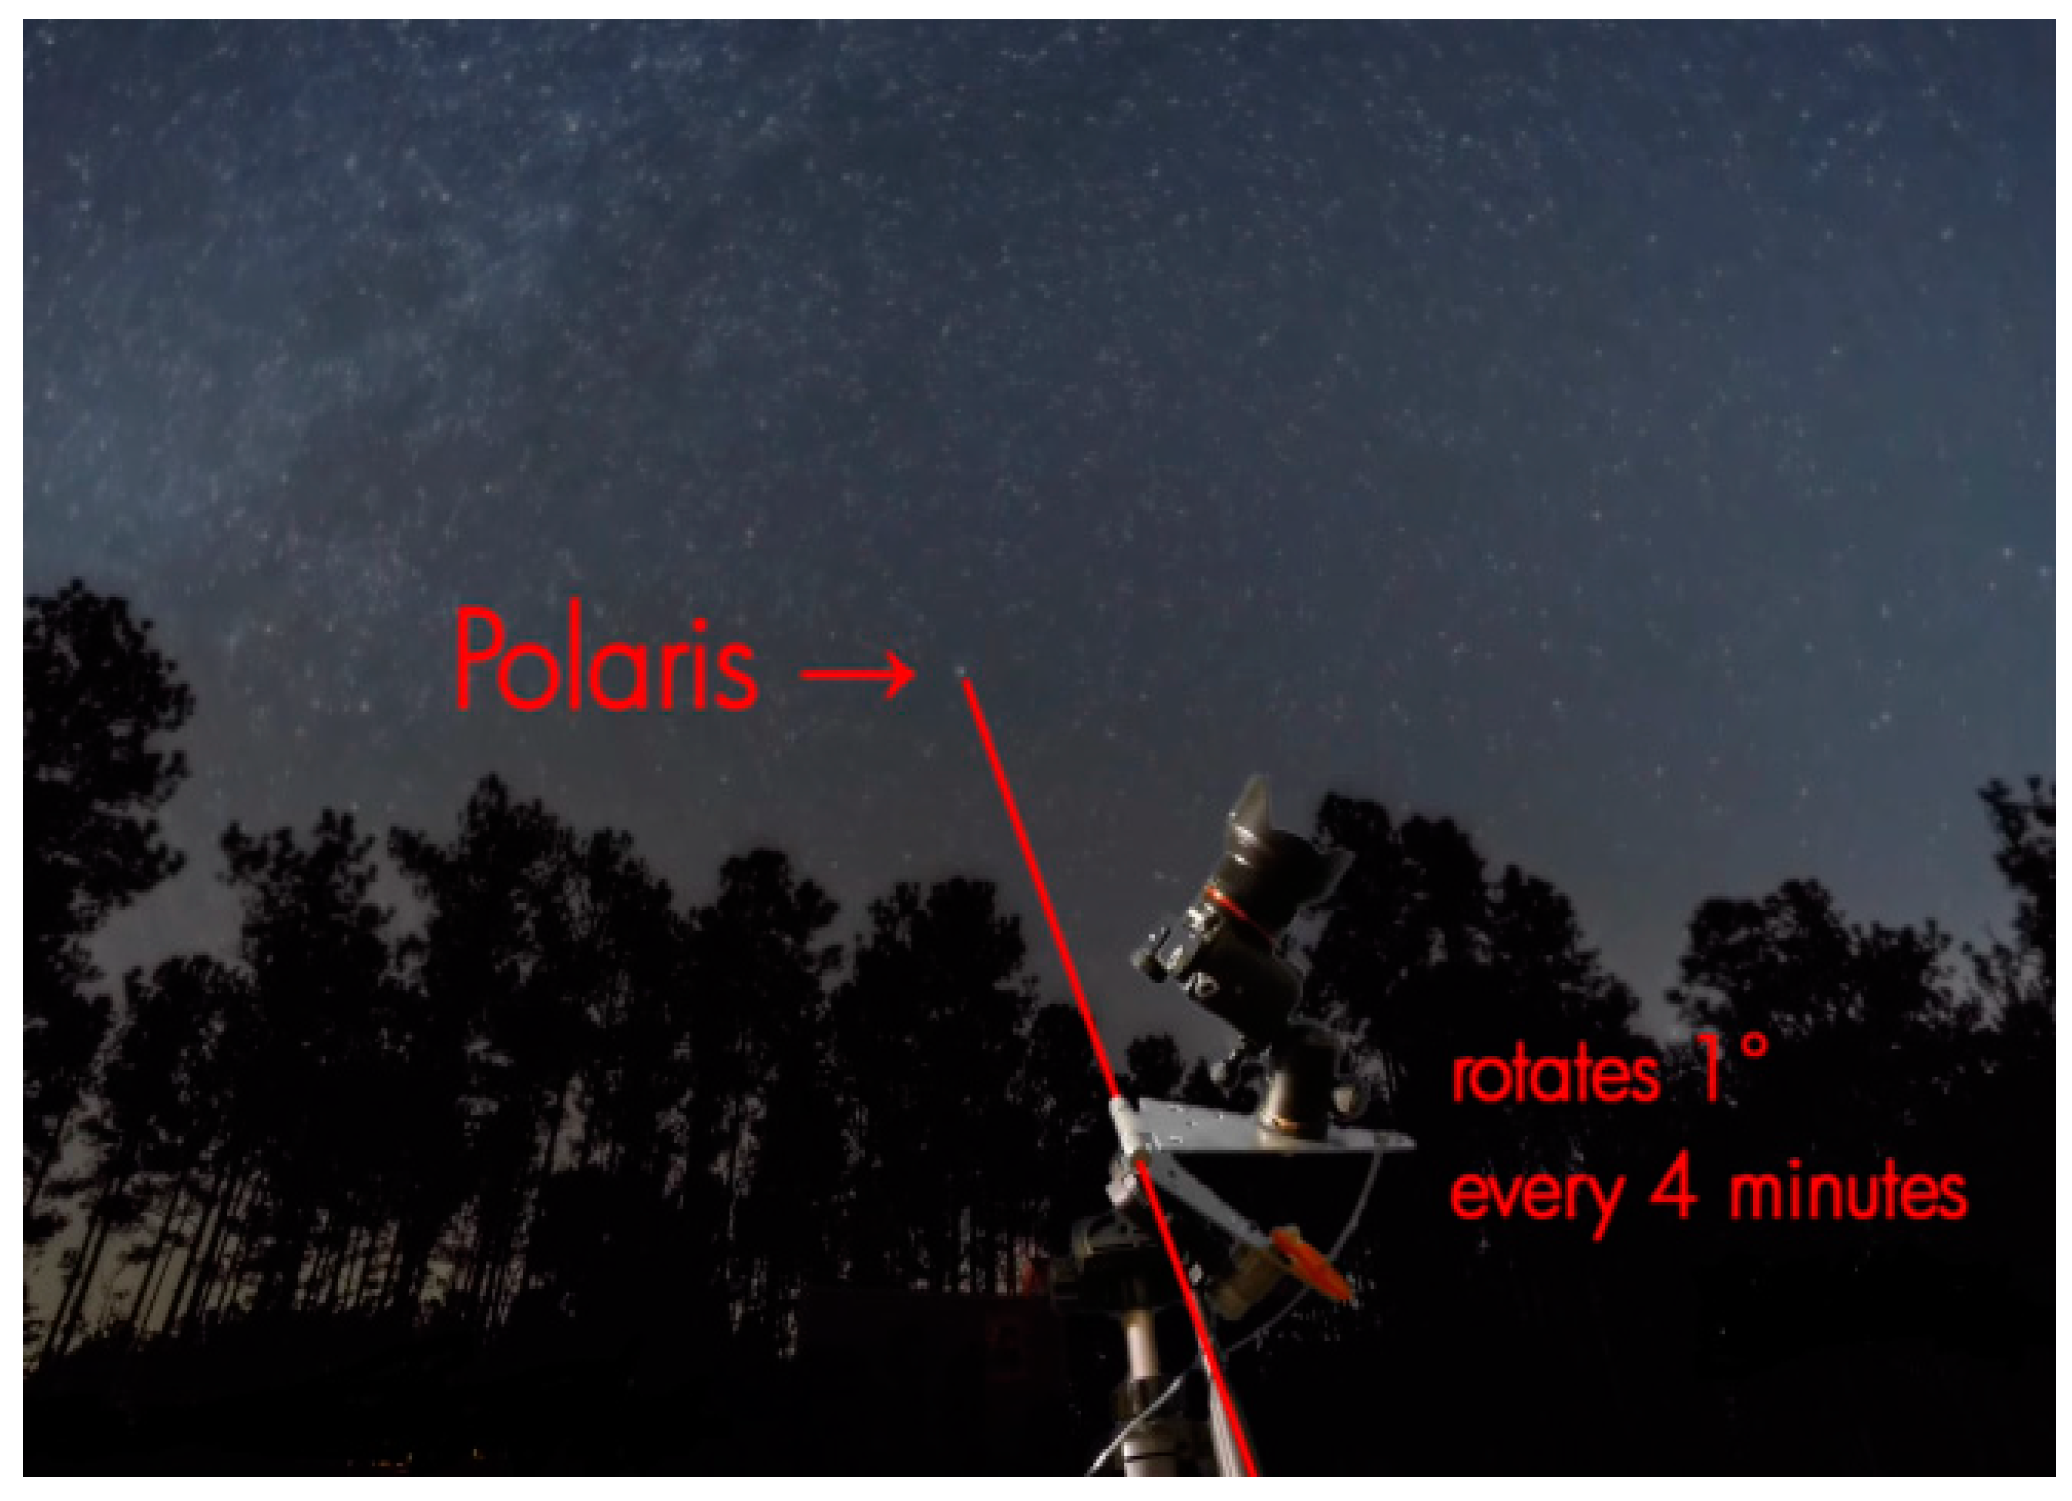
3.5. Barn Door Star Tracker
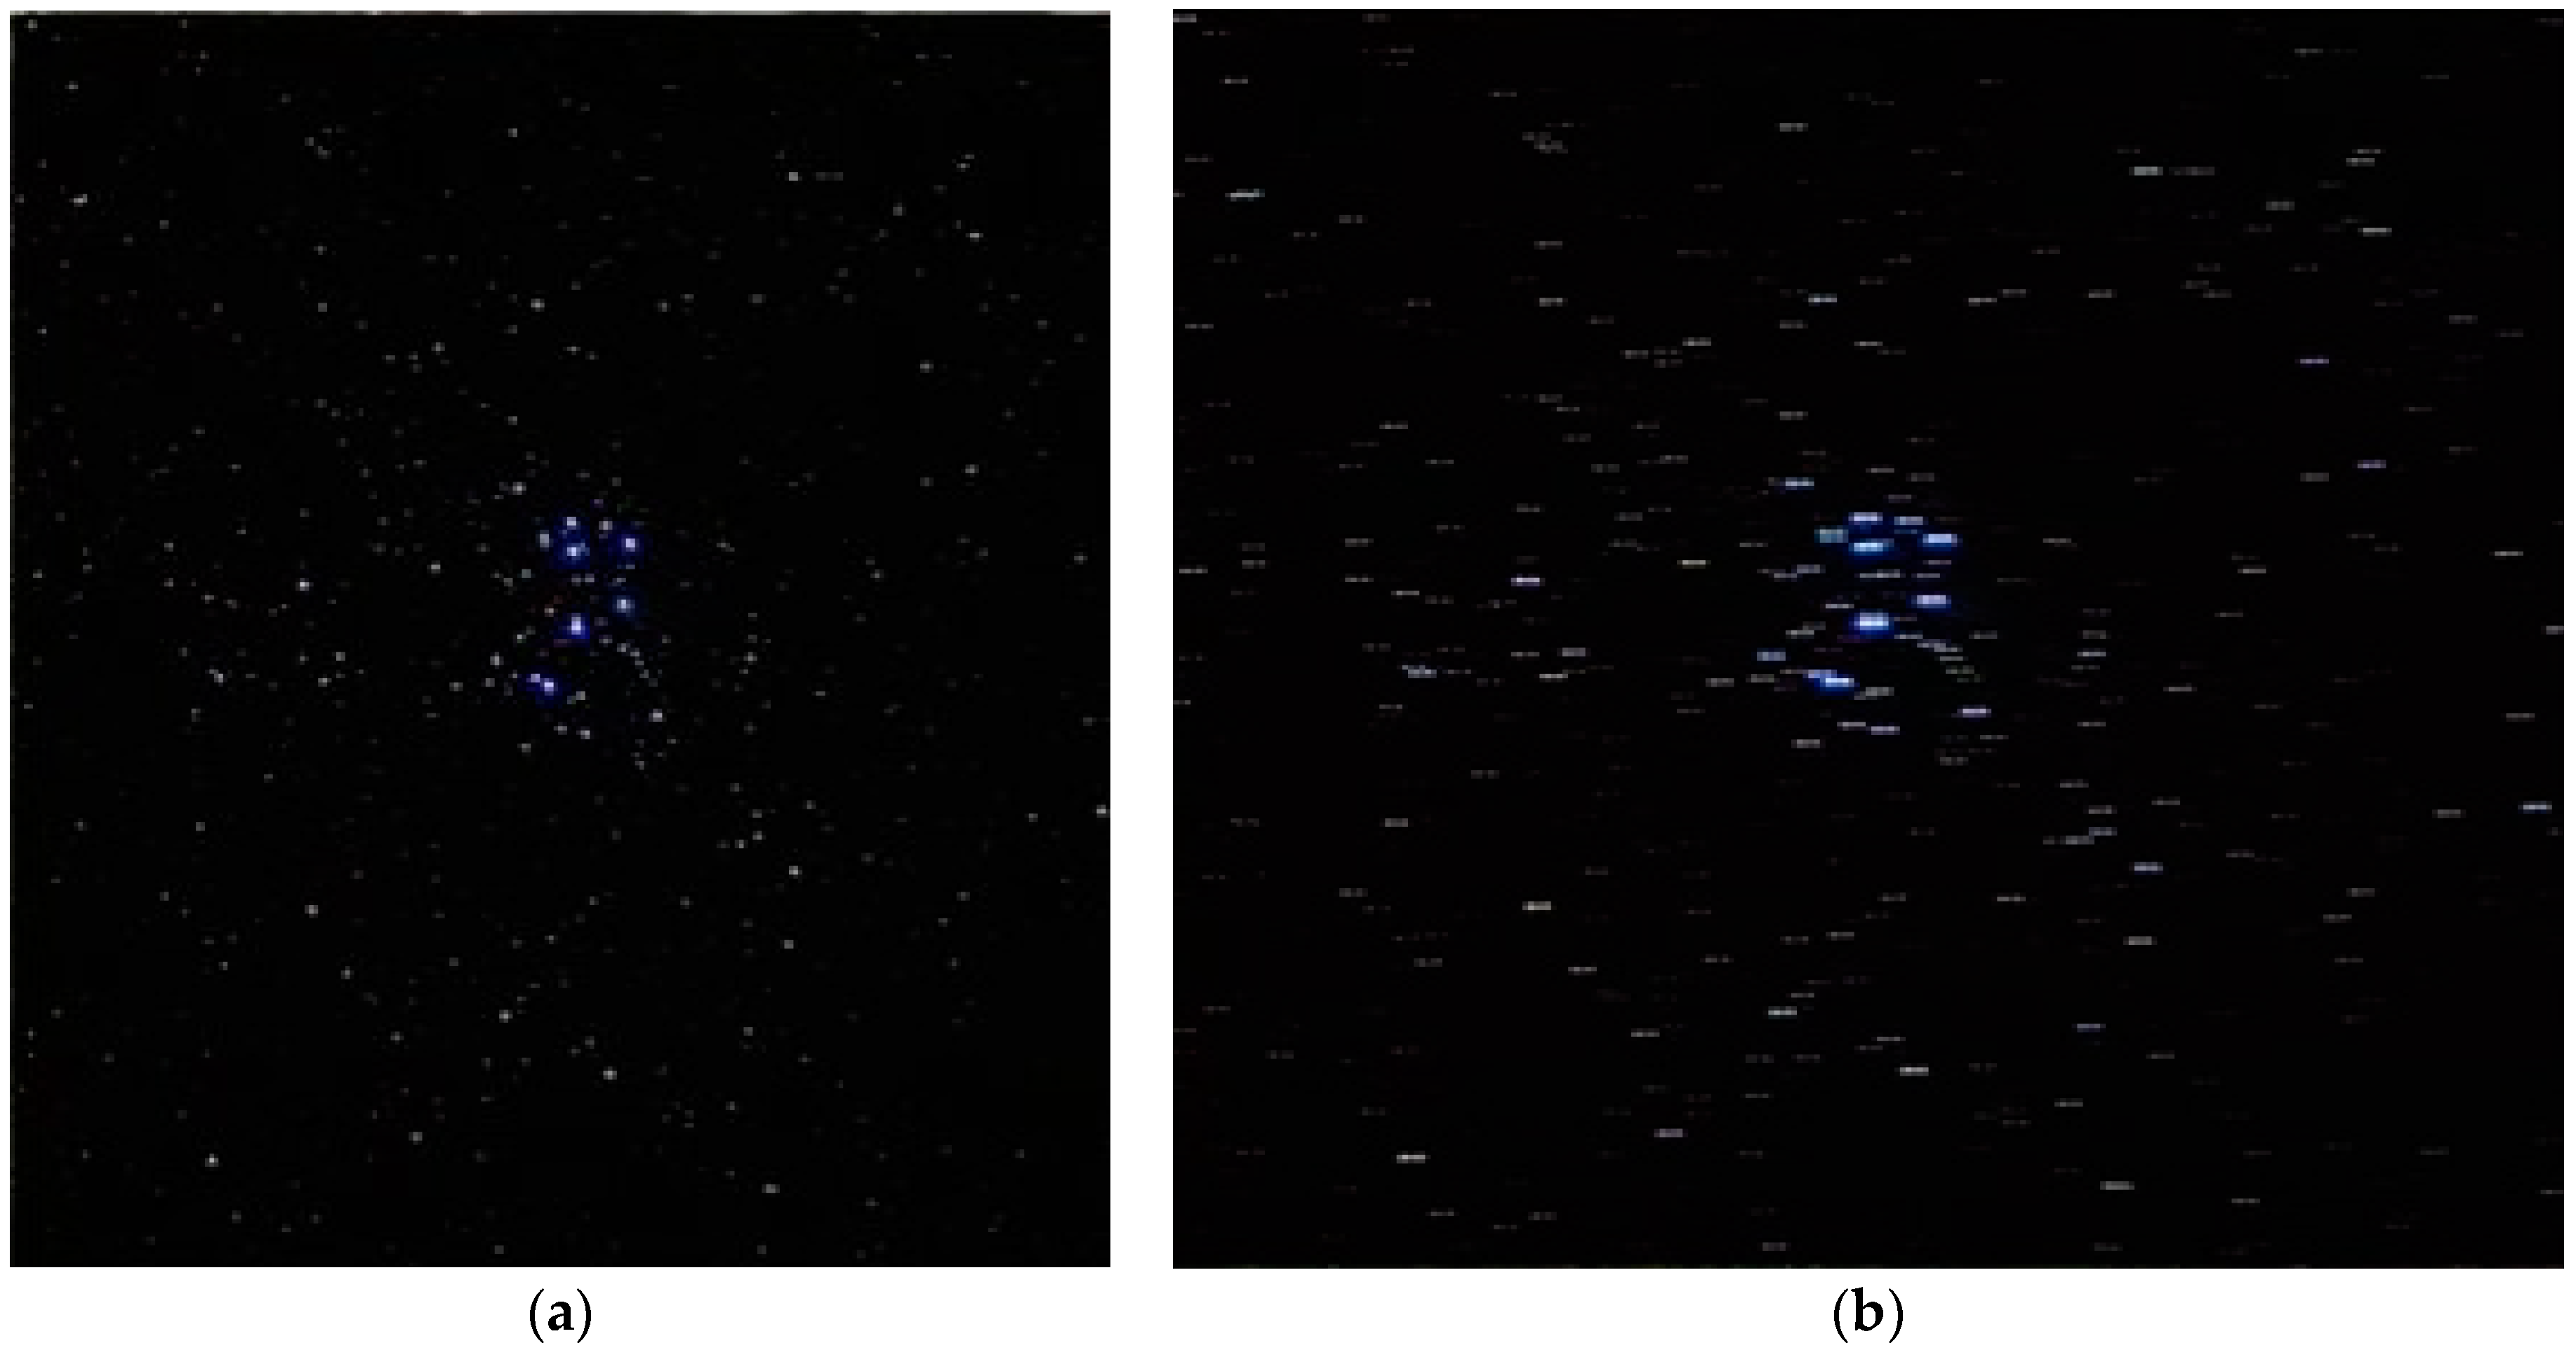
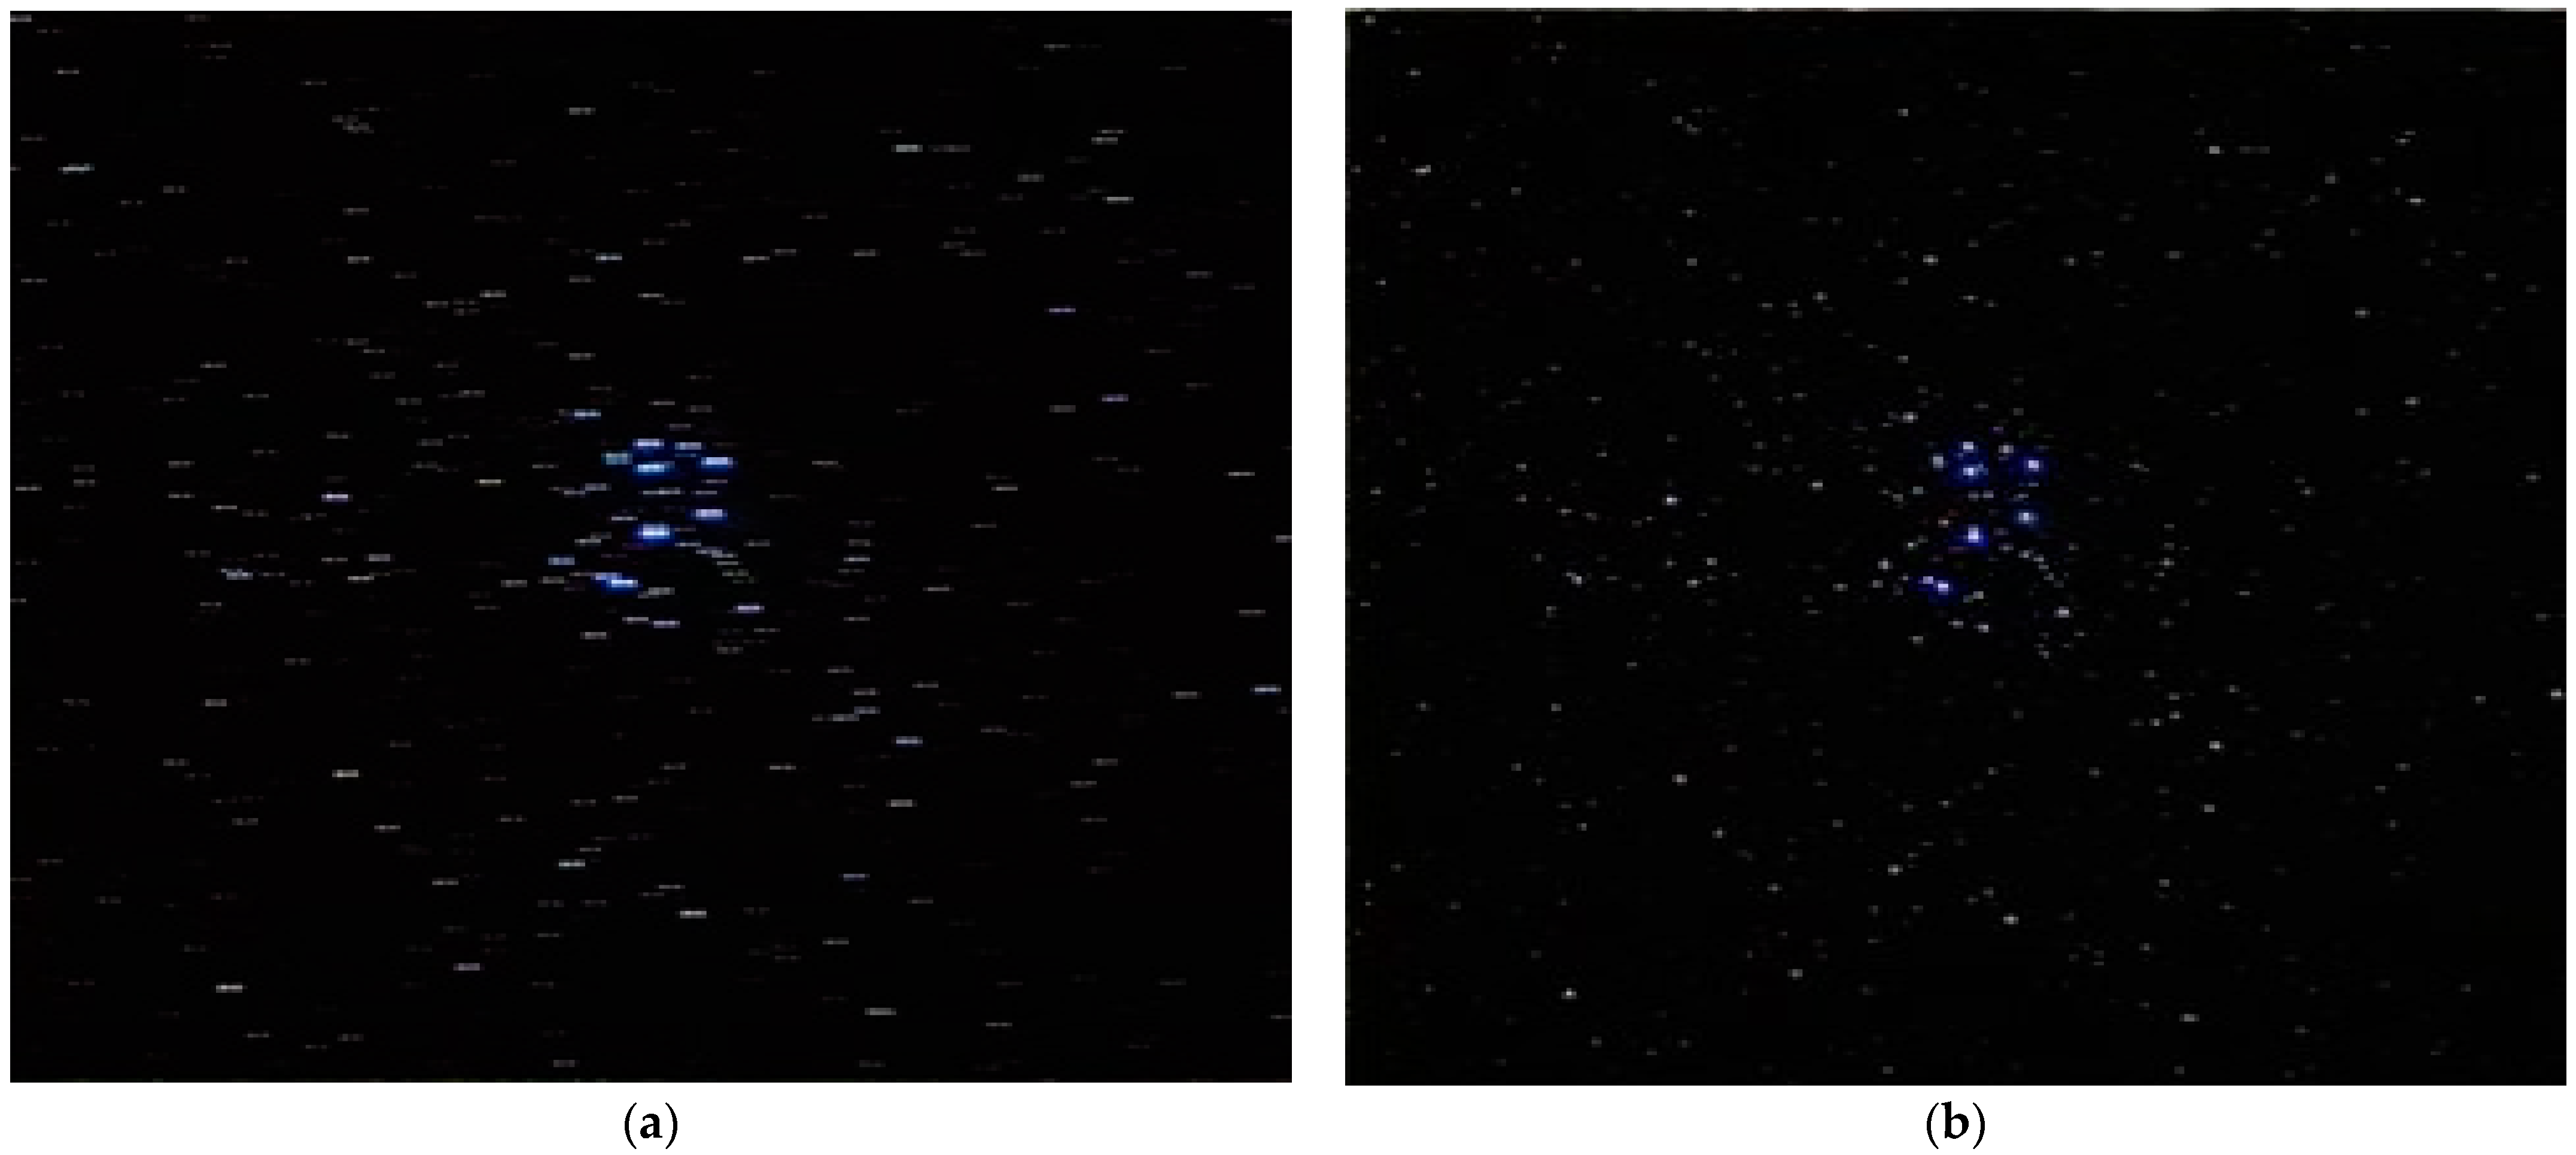
Taking longer exposures of celestial objects produces blurry images due to the rotation of the earth. The stars start to move out of the frame, resulting in motion blur or “start trails”, as shown in
Figure 19. To avoid this, it is necessary to build a device that rotates against the motion of the earth and tracks the celestial object in order to keep it at one point in a frame. This will result in much sharper and more detailed images.
A synchronous electro-mechanical star tracker [
14] was made for this purpose. The idea behind this is that if we point a rod toward the Polaris star and rotate it against the motion of the earth at 360 degrees per 24 h of angular speed, any camera firmly mounted on this rod, pointing to any star, will start tracking that star. The Polaris is a star situated right above the North Pole. Therefore, it remains at a relatively single point in the night sky while all the other stars make concentric circles around it, with Polaris as their center of rotation.
The axis of rotation or “tube” in
Figure 20 points towards Polaris. When the gear turns clockwise, it pushes the camera away, resulting in a rotation, and here, the DSLR/mirrorless camera on the mount should track the star, and it is pointed out.
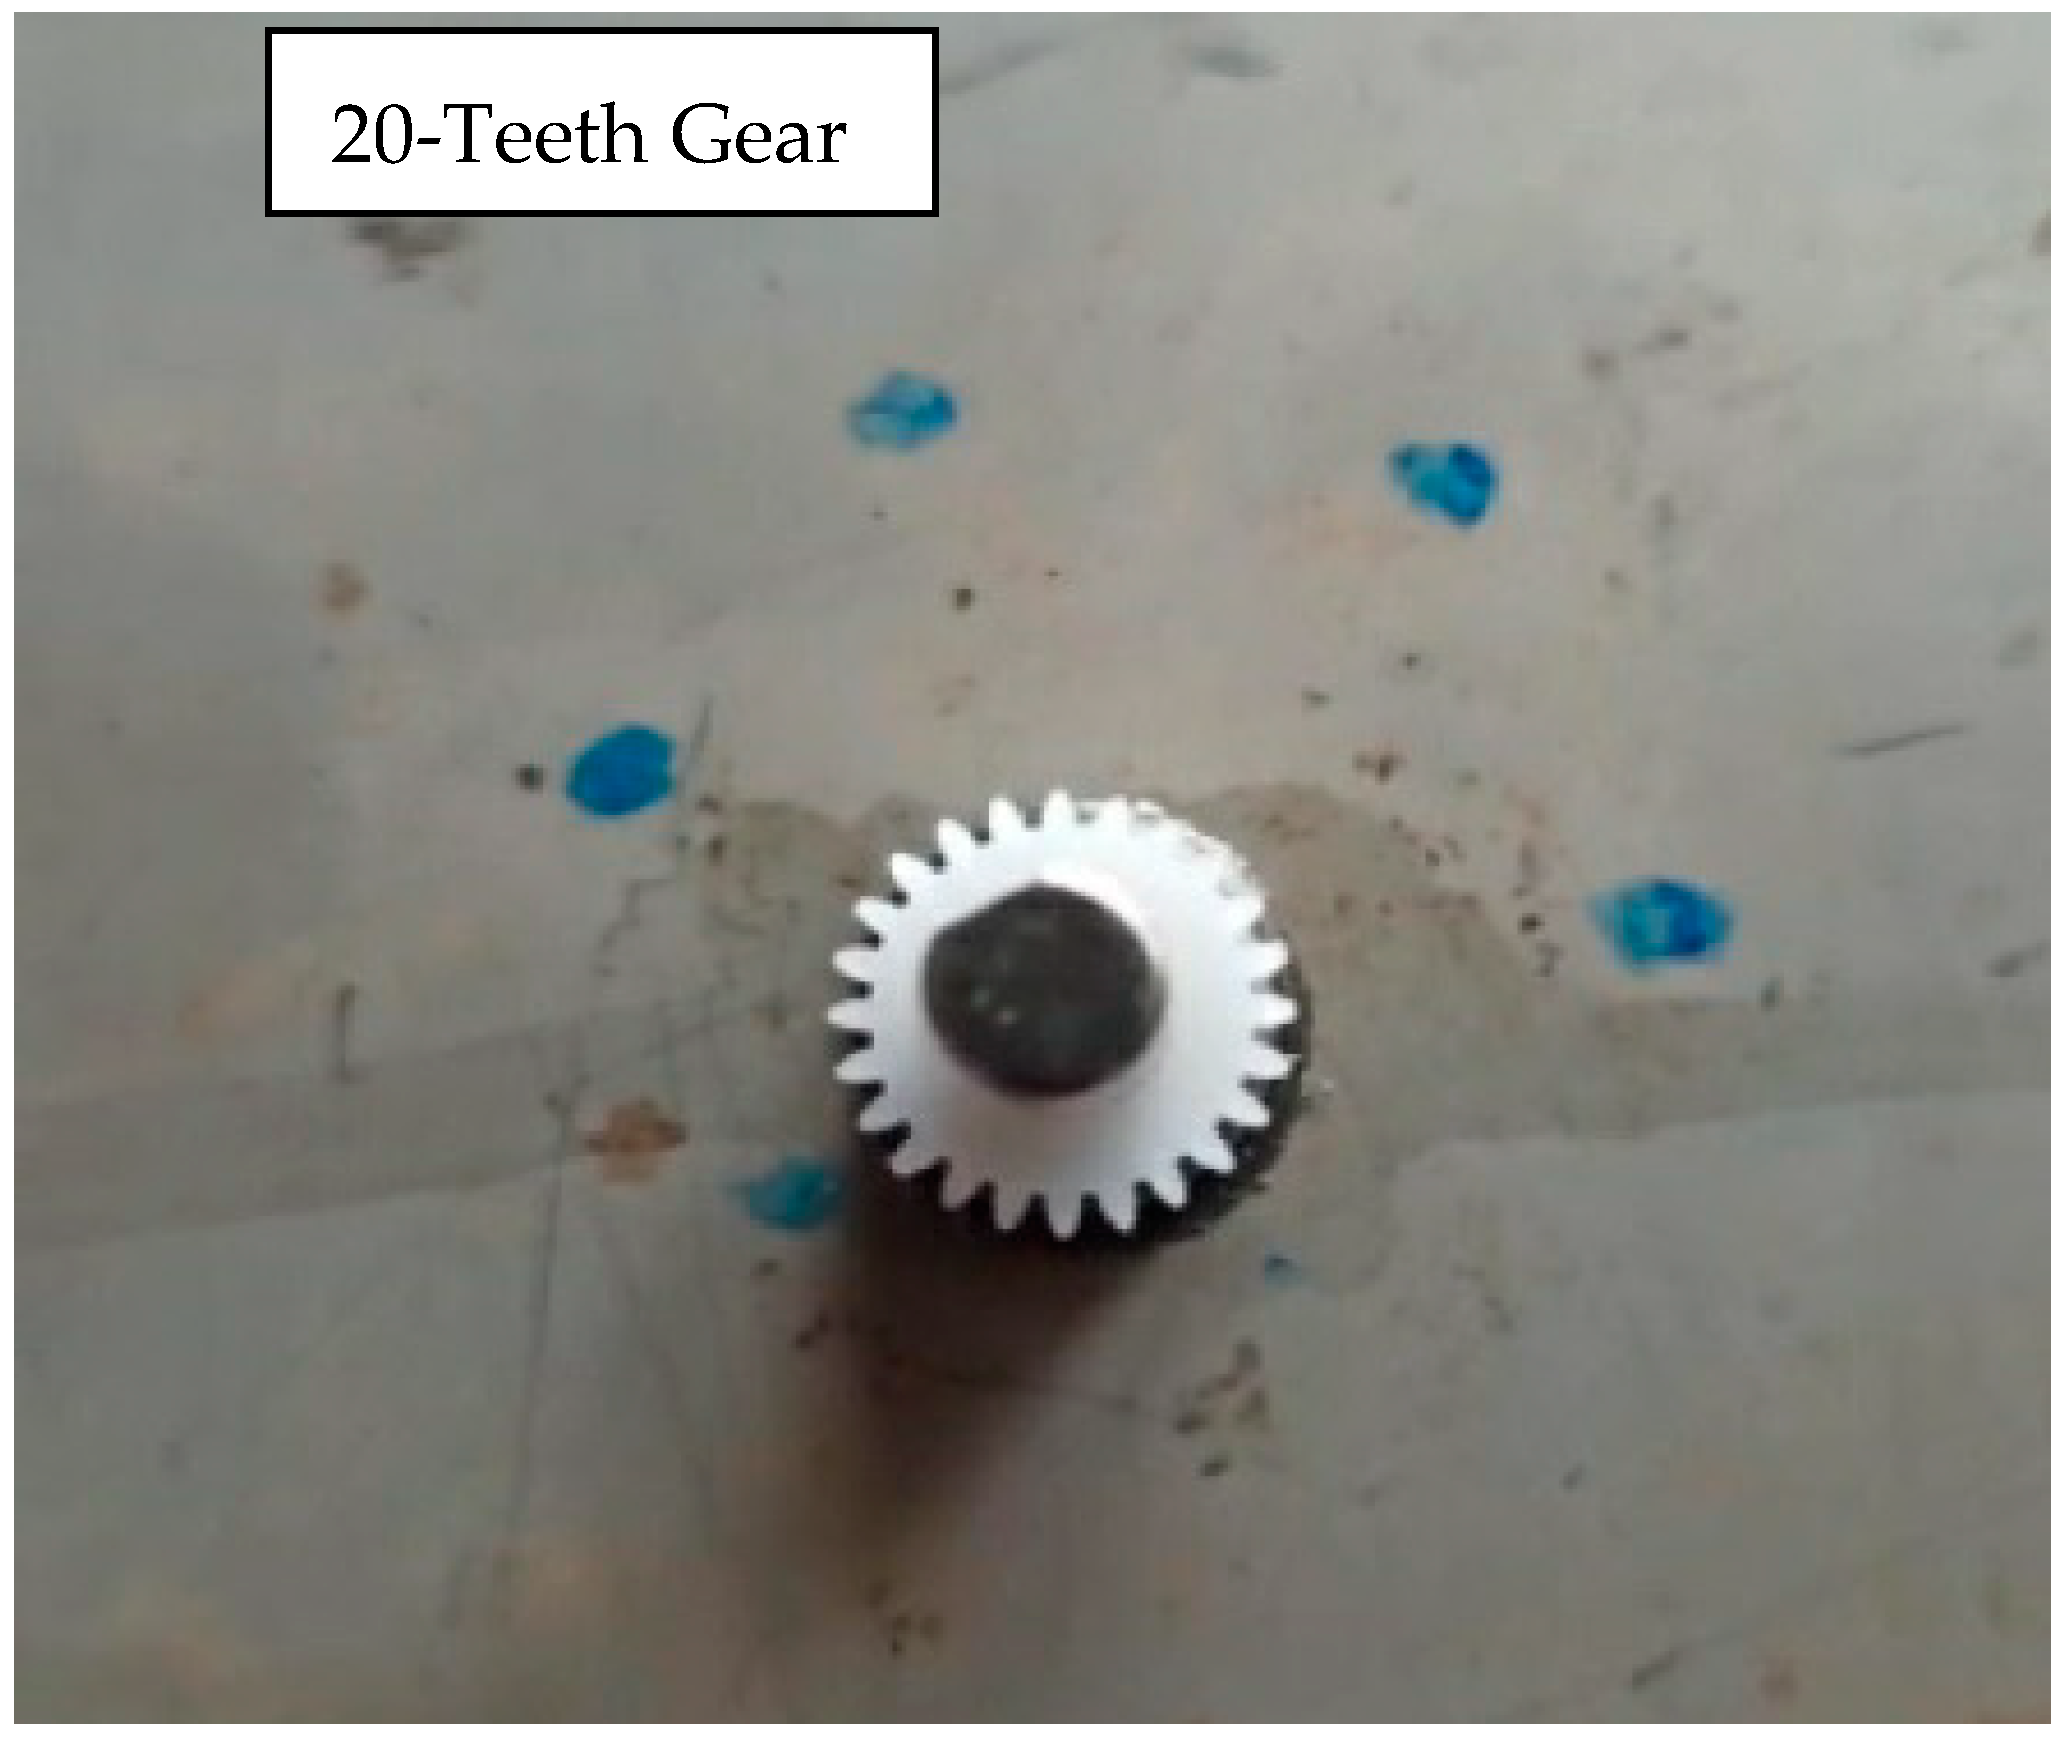
In this setup, a 2.2 rpm high-torque DC motor was used with a gear system to adjust the rotation of the axis at an angular speed of one degree per 4 min. The motor works with a variable voltage of 3 V–12 V with a potentiometer module and the image of a 20-teeth gear to slow down the RPMs, as shown in
Figure 21.
4. Results and Discussion
The dark current noise of the sensor that came out was very high in the long exposure frame that was taken without the on-sensor dark current technology [
15,
16]. Dark current is a steady accumulation of charge with time due to heat that moves electrons in the pixel. Higher temperatures move more electrons, and dark current goes up. It is typically around one electron or less per second, so we do not see problems from dark current with short exposures. Subsequently, when the on-sensor dark current technology was used, a much cleaner image without the sensor heat noise was obtained, and the results are shown in
Figure 22.
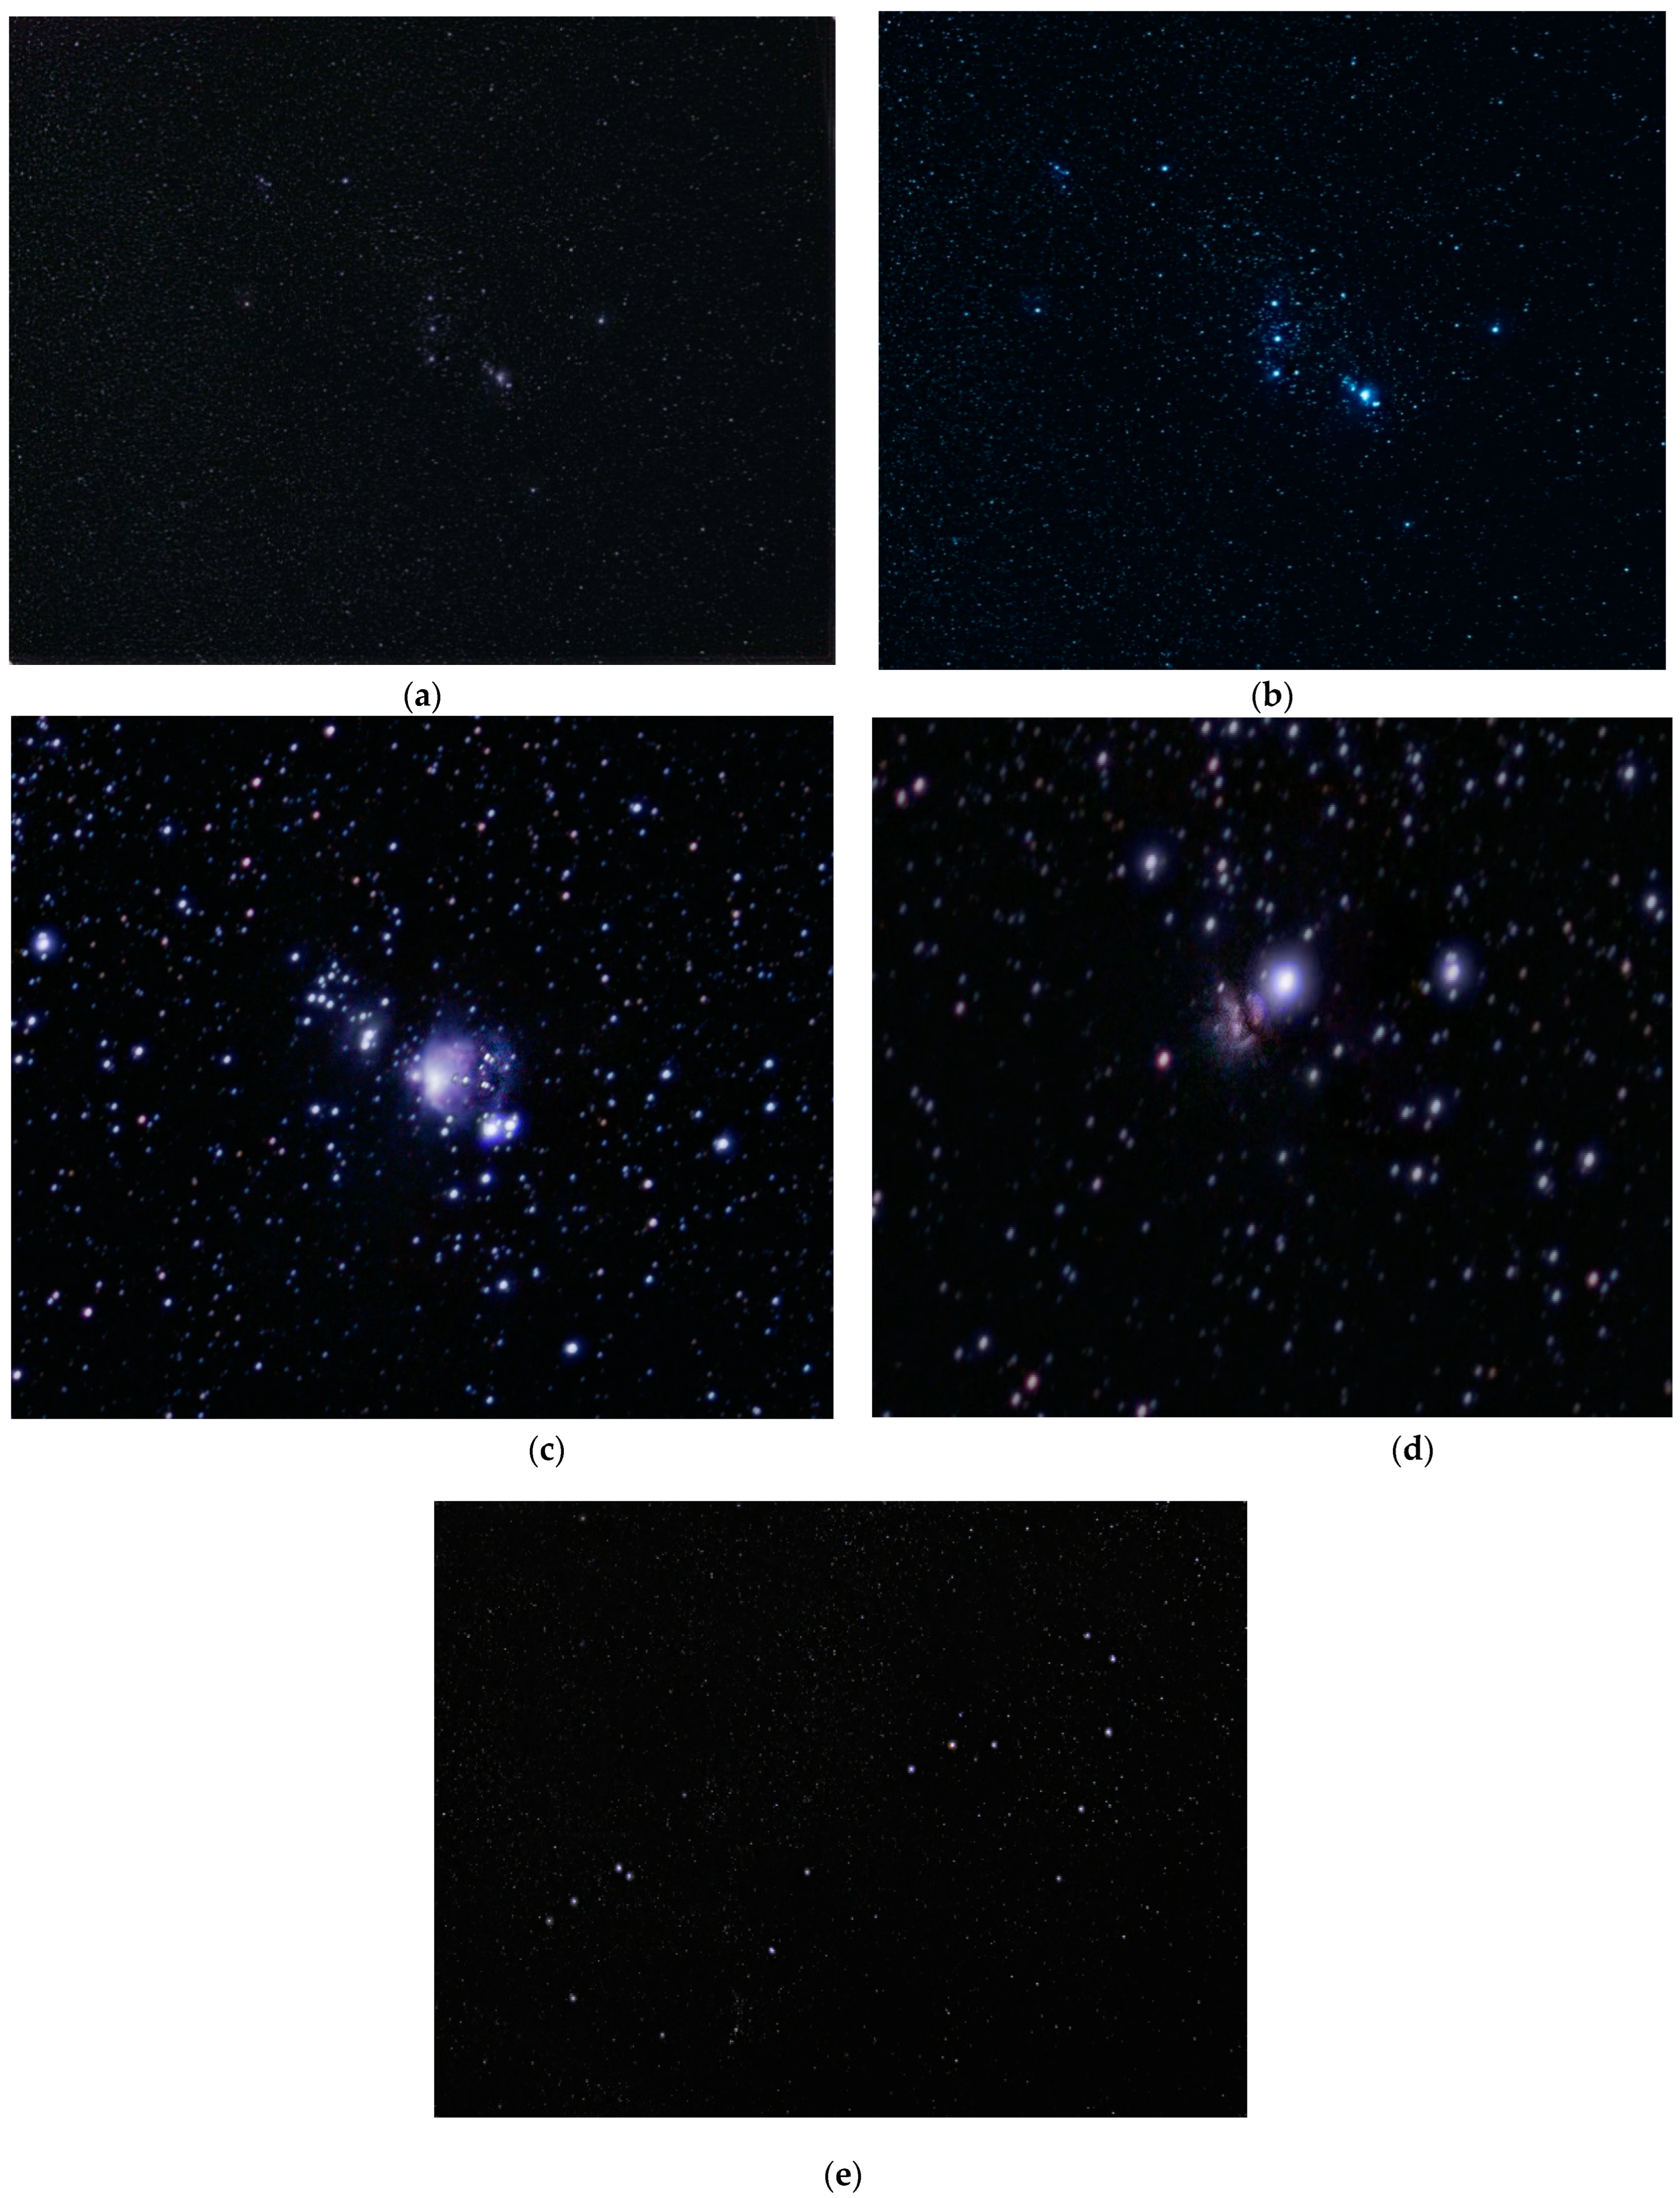
Samples taken with the process discussed are attached in
Figure 23a–e. These photos were captured in the middle of the populated city of Ranchi, Jharkhand, with a light pollution of Bortle 5.5. The experiment was carried out during a rare, dark, starry night sky with no clouds in such high light pollution. These are a stack of 600 light frames, each of 5-s exposure, 30 dark frames, 30 bias frames, and 50 flat frames. The images of the Orion Nebula and Scorpius constellation were taken in the open air, in the light pollution of Bortle class 5, brightness = 1.27 mcd/m
2, artif. brightness = 1100 ucd/m
2, in an uncontrolled environment (in terms of wind speed and temperature). The artificial sky brightness levels are those used in the legend and indicate the following: up to 1% above the natural light (black); from 1 to 8% above the natural light (blue); from 8 to 50% above natural nighttime brightness (green); from 50% above natural to the level of light under which the Milky Way is no longer visible (yellow); from Milky Way loss to estimated cone stimulation (red); and very high nighttime light intensities, with no dark adaption for human eyes (white).
To avoid taking any exposures that would cause any significant change in the temperature of the camera body to avoid photon noise/shot noise, we limited our exposure time of individual frames to 6 s, as compared to the 30 min of single exposure performed in the previous study. The low amount of noise that still made it into the image was easily removed through the process of stacking. Hence, the influence of temperature was negligible. The temperature of the sensor, however, was maintained at 16 degrees Celsius at the time of recording via external cooling fans to minimize the thermal noise even further. A total of 500 lights, 50 darks, 30 bias, and 30 flat frames were recorded, all at the same temperature, at an ISO gain of 160. Even the dim Orion Nebula and Flame Nebula are visible through this process.
We attempted a study to quantitatively compare the brightness of astronomical objects in question to the glow of the human body. This way, we would get a better idea of how much longer the total exposure of the latter needs to be as compared to the astronomical objects. We attempted this by studying four different metrics for each application, namely: lumens, lux, candela, and luminance. However, this study had several practical constraints that pushed us to pursue a different route.
It was difficult to find the lumens value of the exact portion of the night sky in question. Even if we did manage to find the values for all the objects we were recording, it would be of close to no use for the following reason: the observable night sky is constantly changing. Depending upon the geo location of the study, the interference due to clouds, wind, moisture, temperature, and dust would highly influence the actual light that would reach the sensor. Hence, making a comparison based on the lumens of a celestial object became highly impractical. We could, however, measure the lux of the same during the time of recording, but a Bortle class 5 sky made it next to impossible to obtain accurate results.
Instead, we simply studied the exposure required to capture these images to make them comparable. The idea was that if we use a lens of the same aperture as a study in reference, we will just change the number of frames to change the total exposure time and stack the frames later in post-processing. In the experiment performed by Kobayashi, one exposure lasted for 30 min. We took 500 frames of 6 s each, equating to a total exposure time of 50 min, resulting in the same level of brightness of the image. This led us to conclude that the two applications are indeed similar in nature. The contributions of our proposed work are presented in the table. The table presents the differences between the existing work and our proposed work (
Table 4).
5. Conclusions
In this work, a successful design for capturing bioluminescence was tested and compared on various celestial body images. To do this, we have defined a physical model of Barn Door Star Tracker. Then, we used an experimental approach to estimate low-light conditions of lens performance in recording. Multiple images were produced using this experiment, with the total exposure time ranging from 40 to 90 min (500–700 frames). The images had close to zero noise, which was possible only because of stacking. This is in contrast to the last experiment performed in 2009 by Kobayashi in which a single exposure was taken that lasted 30 min. However, a 30 min exposure would produce too much thermal noise in a CMOS camera at room temperature. Therefore, we concluded that instead of taking single exposures, we could take multiple frames of the same subject and stack them using the process mentioned in the paper. In theory, this allowed us to image any low light-emitting source just by adjusting the number of frames taken (to obtain the desired signal-to-noise ratio). The apparatus, making of a Barn Door Tracker, the process of stacking, and the ultimate production of clear images of extremely dim objects are shared in the paper. These conditions allowed us to simulate synthetic data with the help of digital signal-processing techniques. After defining and using comparison criteria, we conclude that the proposed methods are more appropriate for bioluminescence imaging. On real data, we have noticed that the Barn Door Star Tracker method has improved the contrast and resolution of these images. To confirm this study, the work can be further extended, and CCD cameras can be used with Starstax software instead of DSS to capture human bioluminescence much more easily. This could open the door to a much wider data set to look at software such as Tableau and Power BI to find patterns between different functions of the body. This will help us to understand human evolution in a much deeper sense. This work has attempted to understand what is inside the human body by looking outside into the universe.


 ,
, 


