DeepFMD: Computational Analysis for Malaria Detection in Blood-Smear Images Using Deep-Learning Features


Abstract
:1. Introduction
2. Literature Review
3. Materials and Method
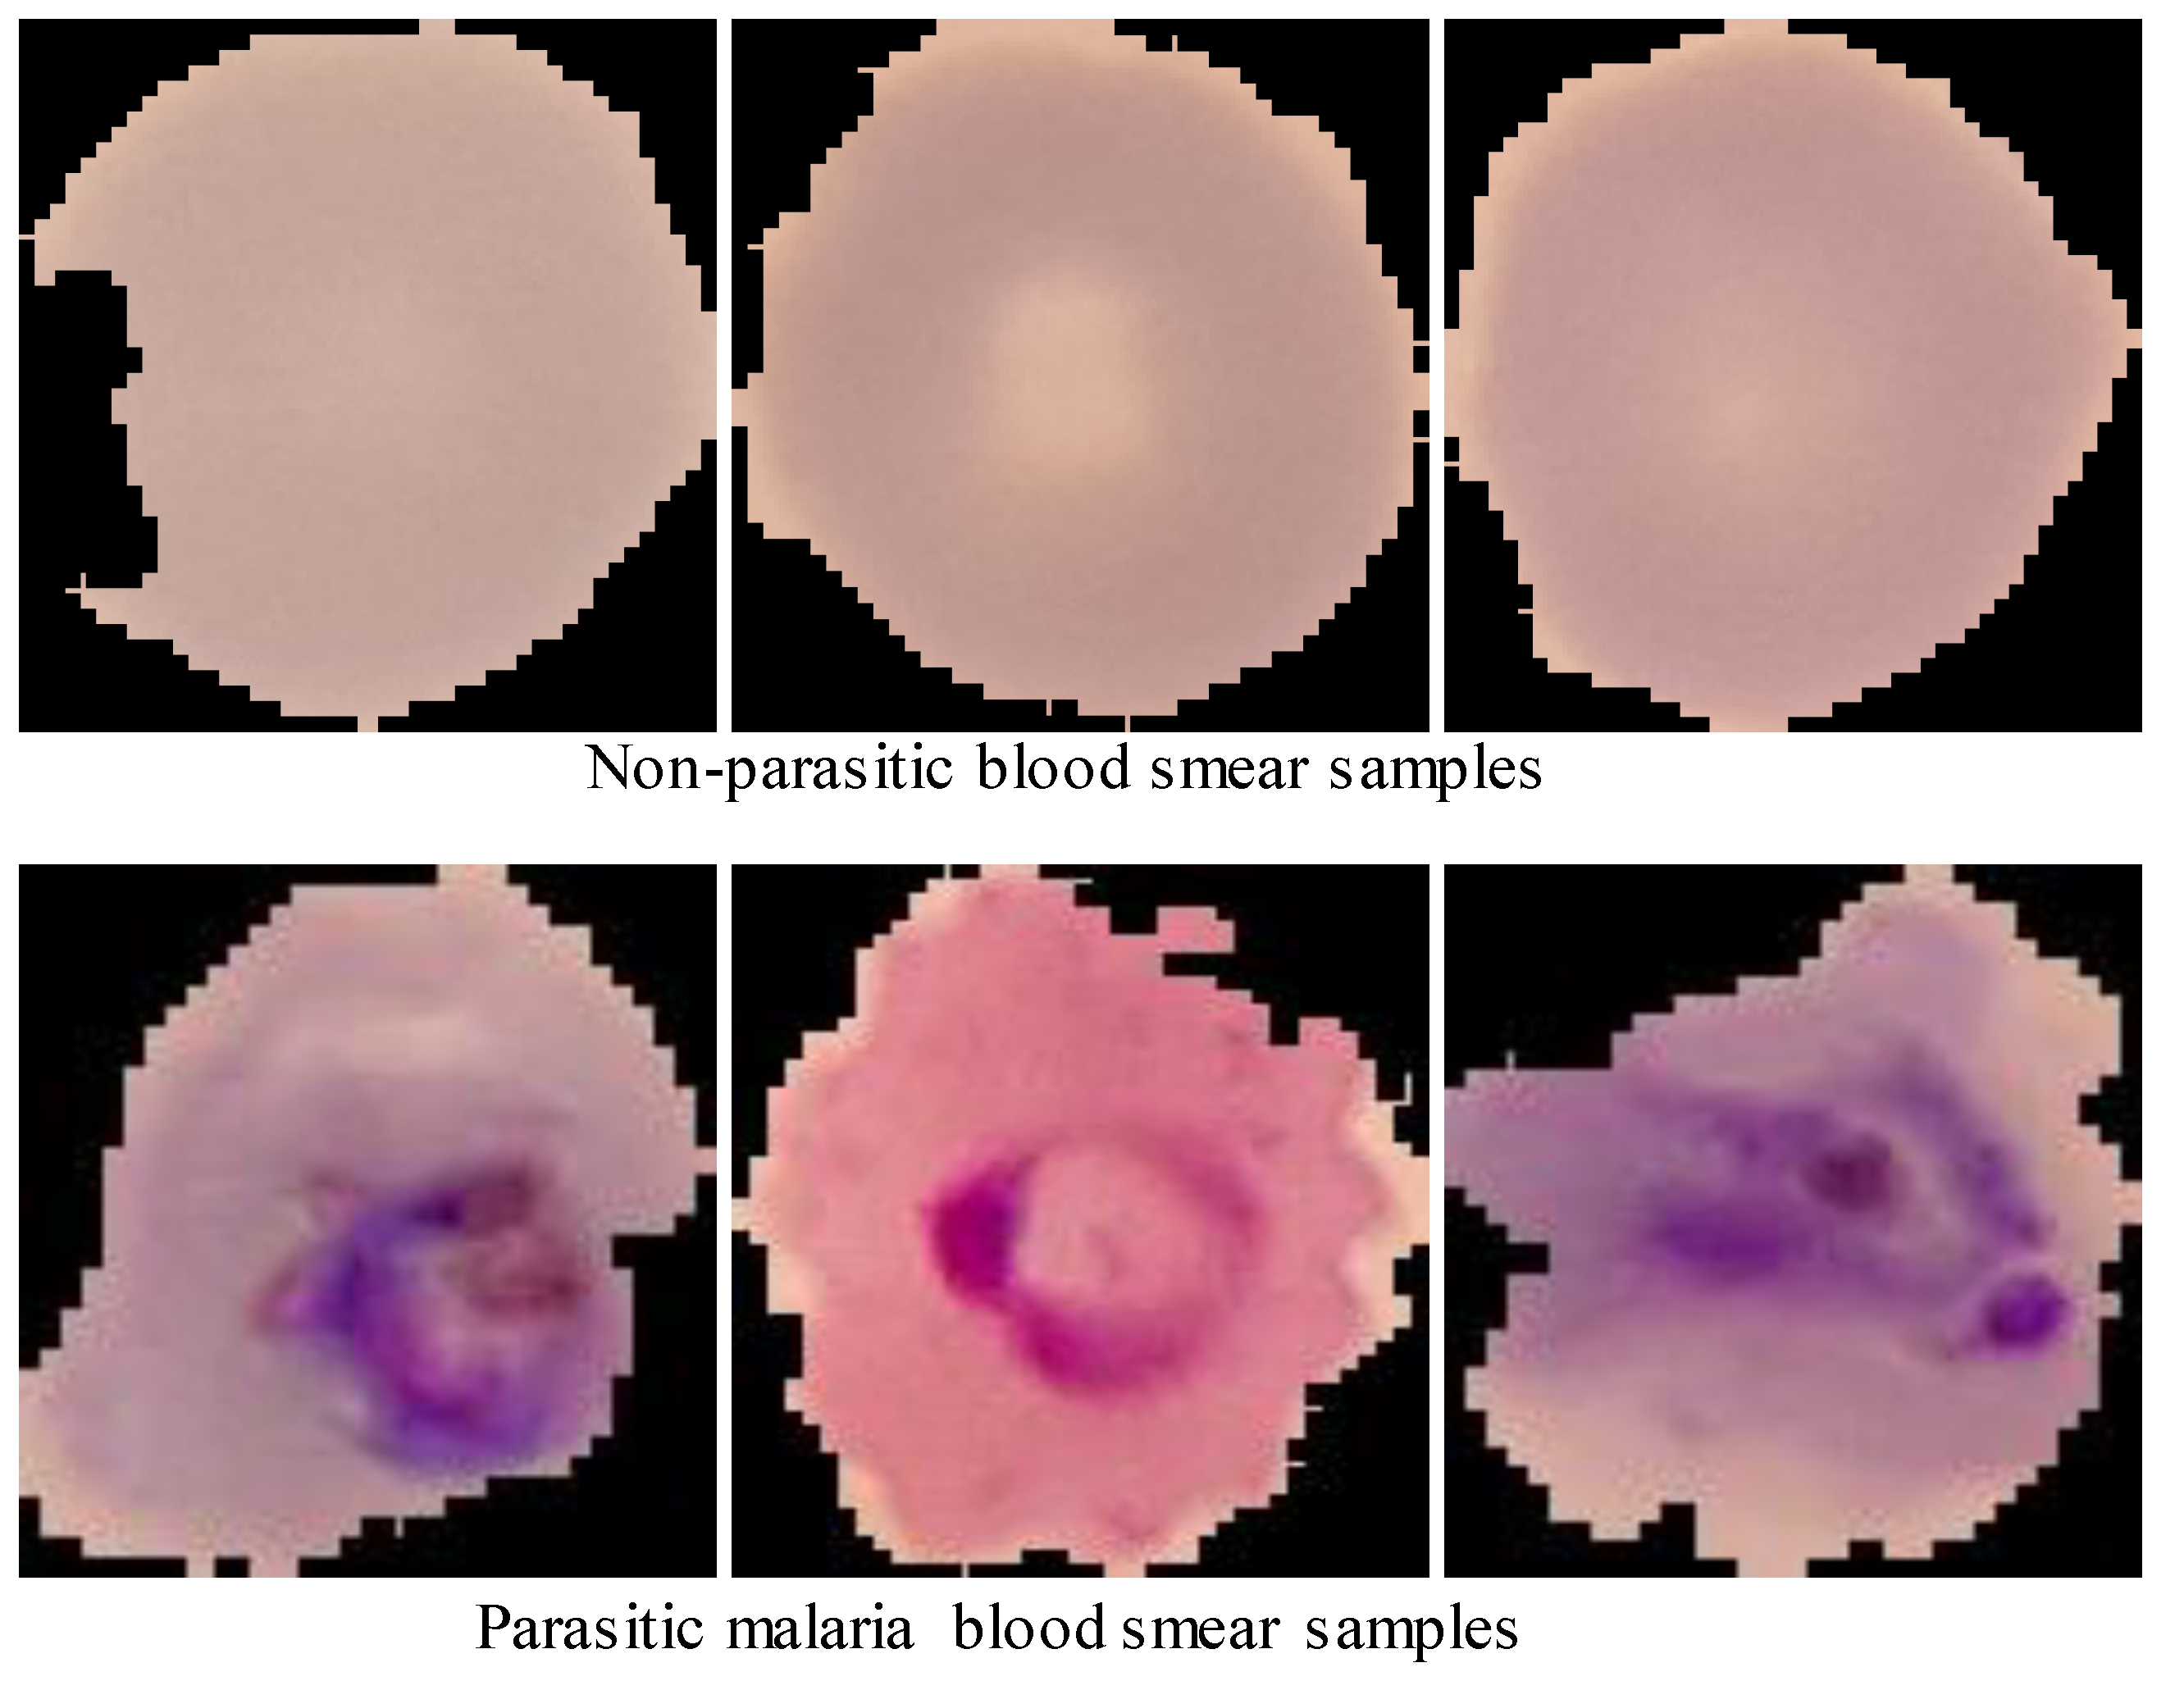
3.1. Dataset
3.2. Dataset Pre-Processing
3.3. Feature Extraction
3.4. Classification
4. Results and Discussion
Receiver Operating Characteristics (ROC) Curve
5. Conclusions
Author Contributions
Funding
Informed Consent Statement
Data Availability Statement
Conflicts of Interest
References
- World Health Organization. WHO Malaria Policy Advisory Group (MPAG) Meeting: Meeting Report; April 2021; World Health Organization: Geneva, Switzerland, 2021. [Google Scholar]
- Abubakar, A.; Ugail, H.; Bukar, A.M. Assessment of human skin burns: A deep transfer learning approach. J. Med. Biol. Eng. 2020, 40, 321–333. [Google Scholar] [CrossRef]
- Lowd, D.; Davis, J. Improving Markov network structure learning using decision trees. J. Mach. Learn. Res. 2014, 15, 501–532. [Google Scholar]
- Anuradha, J.; Ramachandran, V.; Arulalan, K.; Tripathy, B. Diagnosis of ADHD Using SVM Algorithm. In Proceedings of the Third Annual ACM Bangalore Conference, Bangalore, India, 22–23 January 2010; Association for Computing Machinery: New York, NY, USA, 2010; pp. 1–4. [Google Scholar]
- Zulfikar, W.B.; Irfan, M.; Alam, C.N.; Indra, M. The Comparation of Text Mining with Naive Bayes Classifier, Nearest Neighbor, and Decision Tree to Detect Indonesian Swear Words on Twitter. In 2017 5th International Conference on Cyber and IT Service Management (CITSM), Denpasar, Indonesia, 8–10 August 2017; Institute of Electrical and Electronics Engineers: Piscataway, NJ, USA, 2017; pp. 1–5. [Google Scholar]
- Poostchi, M.; Silamut, K.; Maude, R.J.; Jaeger, S.; Thoma, G. Image analysis and machine learning for detecting malaria. Transl. Res. 2018, 194, 36–55. [Google Scholar] [CrossRef] [PubMed] [Green Version]
- Rajaraman, S.; Antani, S.K.; Poostchi, M.; Silamut, K.; Hossain, A.; Maude, R.J.; Jaeger, S.; Thoma, G.R. Pre-trained convolutional neural networks as feature extractors toward improved malaria parasite detection in thin blood smear images. PeerJ 2018, 6, e4568. [Google Scholar] [CrossRef] [PubMed]
- Alom, M.Z.; Taha, T.M.; Yakopcic, C.; Westberg, S.; Sidike, P.; Nasrin, S.; Hasan, M.; Van Essen, B.C.; Awwal, A.A.S.; Asari, V.K. A state-of-the-art survey on deep learning theory and architectures. Electronics 2019, 8, 292. [Google Scholar] [CrossRef] [Green Version]
- Elmahmudi, A.; Ugail, H. A framework for facial age progression and regression using exemplar face templates. Vis. Comput. 2020, 37, 1–16. [Google Scholar]
- Elmahmudi, A.; Ugail, H. Experiments on Deep Face Recognition Using Partial Faces. In Proceedings of the 2018 International Conference on Cyberworlds (CW), Singapore, 3–5 October 2018; Institute of Electrical and Electronics Engineers: Piscataway, NJ, USA, 2018; pp. 357–362. [Google Scholar]
- Jilani, S.K.; Ugail, H.; Bukar, A.M.; Logan, A. On the Ethnic Classification of Pakistani Face using Deep Learning. In Proceedings of the 2019 International Conference on Cyberworlds (CW), Kyoto, Japan, 2–4 October 2019; Institute of Electrical and Electronics Engineers: Piscataway, NJ, USA, 2019; pp. 191–198. [Google Scholar]
- Abubakar, A. Comparative Analysis of Classification Algorithms Using CNN Transferable Features: A Case Study Using Burn Datasets from Black Africans. Appl. Syst. Innov. 2020, 3, 43. [Google Scholar] [CrossRef]
- Abubakar, A.; Ugail, H.; Smith, K.M.; Bukar, A.M.; Elmahmudi, A. Burns Depth Assessment Using Deep Learning Features. J. Med. Biol. Eng. 2020, 40, 1–11. [Google Scholar] [CrossRef]
- Abubakar, A.; Ugail, H. Discrimination of Human Skin Burns Using Machine Learning. In Intelligent Computing—Proceedings of the Computing Conference, London, UK, 16–17 July 2019; Springer: Cham, Switzerland, 2019; pp. 641–647. [Google Scholar]
- Abubakar, A.; Ajuji, M.; Yahya, I.U. Comparison of deep transfer learning techniques in human skin burns discrimination. Appl. Syst. Innov. 2020, 3, 20. [Google Scholar] [CrossRef] [Green Version]
- Ugail, H.; Alzorgani, M.; Bukar, A.; Hussain, H.; Burn, C.; Sein, T.M.; Betmouni, S. A Deep Learning Approach to Tumour Identification in Fresh Frozen Tissues. In Proceedings of the 2019 13th International Conference on Software, Knowledge Information Management and Applications (SKIMA), Ukulhas, Maldives, 26–28 August 2019; Institute of Electrical and Electronics Engineers: Piscataway, NJ, USA, 2019; pp. 1–6. [Google Scholar]
- Singh, R.; Ahmed, T.; Kumar, A.; Kumar Singh, A.; Kumar Pandey, A.; Kumar Singh, S. Imbalanced Breast Cancer Classification Using Transfer Learning. IEEE/ACM Trans. Comput. Biol. Bioinform. 2020, 18, 83–93. [Google Scholar] [CrossRef] [PubMed]
- Hassan, S.A.; Sayed, M.S.; Abdalla, M.I.; Rashwan, M.A. Breast cancer masses classification using deep convolutional neural networks and transfer learning. Multimed. Tools Appl. 2020, 79, 30735–30768. [Google Scholar] [CrossRef]
- Craja, P.; Kim, A.; Lessmann, S. Deep learning for detecting financial statement fraud. Decis. Support Syst. 2020, 139, 113421. [Google Scholar] [CrossRef]
- Oblé, F.; Bontempi, G. Deep-Learning Domain Adaptation Techniques for Credit Cards Fraud Detection. In Recent Advances in Big Data and Deep Learning: Proceedings of the INNS Big Data and Deep Learning Conference INNSBDDL2019, Genova, Italy, 16–18 April 2019; Springer: Cham, Switzerland, 2019; Volume 1, p. 78. [Google Scholar]
- Liang, Z.; Powell, A.; Ersoy, I.; Poostchi, M.; Silamut, K.; Palaniappan, K.; Guo, P.; Hossain, A.; Sameer, A.; Maude, R.J.; et al. CNN-Based Image Analysis for Malaria Diagnosis. In Proceedings of the 2016 IEEE International Conference on Bioinformatics and Biomedicine (BIBM), Shenzhen, China, 15–18 December 2016; Institute of Electrical and Electronics Engineers: Piscataway, NJ, USA, 2016; pp. 493–496. [Google Scholar]
- Huq, A.; Pervin, M.T. Robust Deep Neural Network Model for Identification of Malaria Parasites in Cell Images. In Proceedings of the 2020 IEEE Region 10 Symposium (TENSYMP), Dhaka, Bangladesh, 5–7 June 2020; Institute of Electrical and Electronics Engineers: Piscataway, NJ, USA, 2020; pp. 1456–1459. [Google Scholar]
- Rajaraman, S.; Jaeger, S.; Antani, S.K. Performance evaluation of deep neural ensembles toward malaria parasite detection in thin-blood smear images. PeerJ 2019, 7, e6977. [Google Scholar] [CrossRef] [PubMed] [Green Version]
- Reddy, A.S.B.; Juliet, D.S. Transfer Learning with ResNet-50 for Malaria Cell-Image Classification. In the Proceedings of the 2019 International Conference on Communication and Signal Processing (ICCSP), Chennai, India, 4–6 April 2019; Institute of Electrical and Electronics Engineers: Piscataway, NJ, USA, 2019; pp. 0945–0949. [Google Scholar]
- Sriporn, K.; Tsai, C.-F.; Tsai, C.-E.; Wang, P. Analyzing Malaria Disease Using Effective Deep Learning Approach. Diagnostics 2020, 10, 744. [Google Scholar] [CrossRef]
- Russakovsky, O.; Deng, J.; Su, H.; Krause, J.; Satheesh, S.; Ma, S.; Huang, Z.; Karpathy, A.; Khosla, A.; Bernstein, M.; et al. Imagenet large scale visual recognition challenge. Int. J. Comput. Vis. 2015, 115, 211–252. [Google Scholar] [CrossRef] [Green Version]
- Deng, J.; Dong, W.; Socher, R.; Li, L.-J.; Li, K.; Fei-Fei, L. Imagenet: A large-scale hierarchical image database. In the Proceedings of the 2009 IEEE Conference on Computer Vision and Pattern Recognition, Miami, FL, USA, 20–25 June 2009; Institute of Electrical and Electronics Engineers: Piscataway, NJ, USA, 2009; pp. 248–255. [Google Scholar]
- Myles, A.J.; Feudale, R.N.; Liu, Y.; Woody, N.A.; Brown, S.D. An introduction to decision tree modeling. J. Chemom. 2004, 18, 275–285. [Google Scholar] [CrossRef]
- Friedl, M.A.; Brodley, C.E. Decision tree classification of land cover from remotely sensed data. Remote Sens. Environ. 1997, 61, 399–409. [Google Scholar] [CrossRef]


| Classification Algorithms | Performance Evaluation Metrics | ||||
|---|---|---|---|---|---|
| Precision | Recall | F1-Score | Accuracy | Time (s) | |
| DT | 0.8910 | 0.8933 | 0.8922 | 0.8924 | 3528.79 |
| SVM | 0.9426 | 0.9557 | 0.9491 | 0.9488 | 71,163.34 |
| NB | 0.6283 | 0.9647 | 0.7610 | 0.6970 | 23.01 |
| KNN | 0.8866 | 0.9649 | 0.9241 | 0.9207 | 9626.79 |
| Classification Algorithms | Performance Evaluation Metrics | ||||
|---|---|---|---|---|---|
| Precision | Recall | F1-Score | Accuracy | Time (s) | |
| DT | 0.8606 | 0.8582 | 0.8594 | 0.8594 | 2375.60 |
| SVM | 0.9384 | 0.9522 | 0.9452 | 0.9448 | 80,246.96 |
| NB | 0.6026 | 0.9664 | 0.7423 | 0.6646 | 23.64 |
| KNN | 0.8571 | 0.9515 | 0.9019 | 0.8964 | 9635.20 |
| Classification Algorithms | Performance Evaluation Metrics | ||||
|---|---|---|---|---|---|
| Precision | Recall | F1-Score | Accuracy | Time (s) | |
| DT | 0.8689 | 0.8717 | 0.8703 | 0.8705 | 2723.95 |
| SVM | 0.9422 | 0.9553 | 0.9487 | 0.9484 | 34,231.91 |
| NB | 0.8082 | 0.8767 | 0.8411 | 0.8343 | 11.90 |
| KNN | 0.8469 | 0.9476 | 0.8944 | 0.8881 | 5029.97 |
| Classification Algorithms | Performance Evaluation Metrics | ||||
|---|---|---|---|---|---|
| Precision | Recall | F1-Score | Accuracy | Time (s) | |
| DT | 0.8893 | 0.8840 | 0.8845 | 0.8848 | 3315.88 |
| SVM | 0.9411 | 0.9560 | 0.9485 | 0.9481 | 30,682.47 |
| NB | 0.8295 | 0.8867 | 0.8572 | 0.8522 | 11.86 |
| KNN | 0.8311 | 0.9602 | 0.8910 | 0.8825 | 4988.34 |
| Classification Algorithms | Performance Evaluation Metrics | ||||
|---|---|---|---|---|---|
| Precision | Recall | F1-Score | Accuracy | Time (s) | |
| DT | 0.8745 | 0.8682 | 0.8713 | 0.8708 | 1607.55 |
| SVM | 0.9255 | 0.9615 | 0.9432 | 0.9421 | 26,035.99 |
| NB | 0.7167 | 0.7379 | 0.7271 | 0.7231 | 6.91 |
| KNN | 0.7977 | 0.8927 | 0.8426 | 0.8300 | 2671.86 |
| Classification Algorithms | Performance Evaluation Metrics | ||||
|---|---|---|---|---|---|
| Precision | Recall | F1-Score | Accuracy | Time (s) | |
| DT | 0.8660 | 0.8614 | 0.8637 | 0.8633 | 3612.66 |
| SVM | 0.9293 | 0.9599 | 0.9443 | 0.9434 | 50,593.37 |
| NB | 0.6805 | 0.8396 | 0.7517 | 0.7227 | 12.96 |
| KNN | 0.7795 | 0.9393 | 0.8520 | 0.8368 | 4246.80 |
Publisher’s Note: MDPI stays neutral with regard to jurisdictional claims in published maps and institutional affiliations. |
© 2021 by the authors. Licensee MDPI, Basel, Switzerland. This article is an open access article distributed under the terms and conditions of the Creative Commons Attribution (CC BY) license (https://creativecommons.org/licenses/by/4.0/).
Share and Cite
Abubakar, A.; Ajuji, M.; Yahya, I.U. DeepFMD: Computational Analysis for Malaria Detection in Blood-Smear Images Using Deep-Learning Features. Appl. Syst. Innov. 2021, 4, 82. https://doi.org/10.3390/asi4040082
Abubakar A, Ajuji M, Yahya IU. DeepFMD: Computational Analysis for Malaria Detection in Blood-Smear Images Using Deep-Learning Features. Applied System Innovation. 2021; 4(4):82. https://doi.org/10.3390/asi4040082
Chicago/Turabian StyleAbubakar, Aliyu, Mohammed Ajuji, and Ibrahim Usman Yahya. 2021. "DeepFMD: Computational Analysis for Malaria Detection in Blood-Smear Images Using Deep-Learning Features" Applied System Innovation 4, no. 4: 82. https://doi.org/10.3390/asi4040082
APA StyleAbubakar, A., Ajuji, M., & Yahya, I. U. (2021). DeepFMD: Computational Analysis for Malaria Detection in Blood-Smear Images Using Deep-Learning Features. Applied System Innovation, 4(4), 82. https://doi.org/10.3390/asi4040082