
Sedimentary Ancient DNA Reveals Local Vegetation Changes Driven by Glacial Activity and Climate
 ,
,  and
and 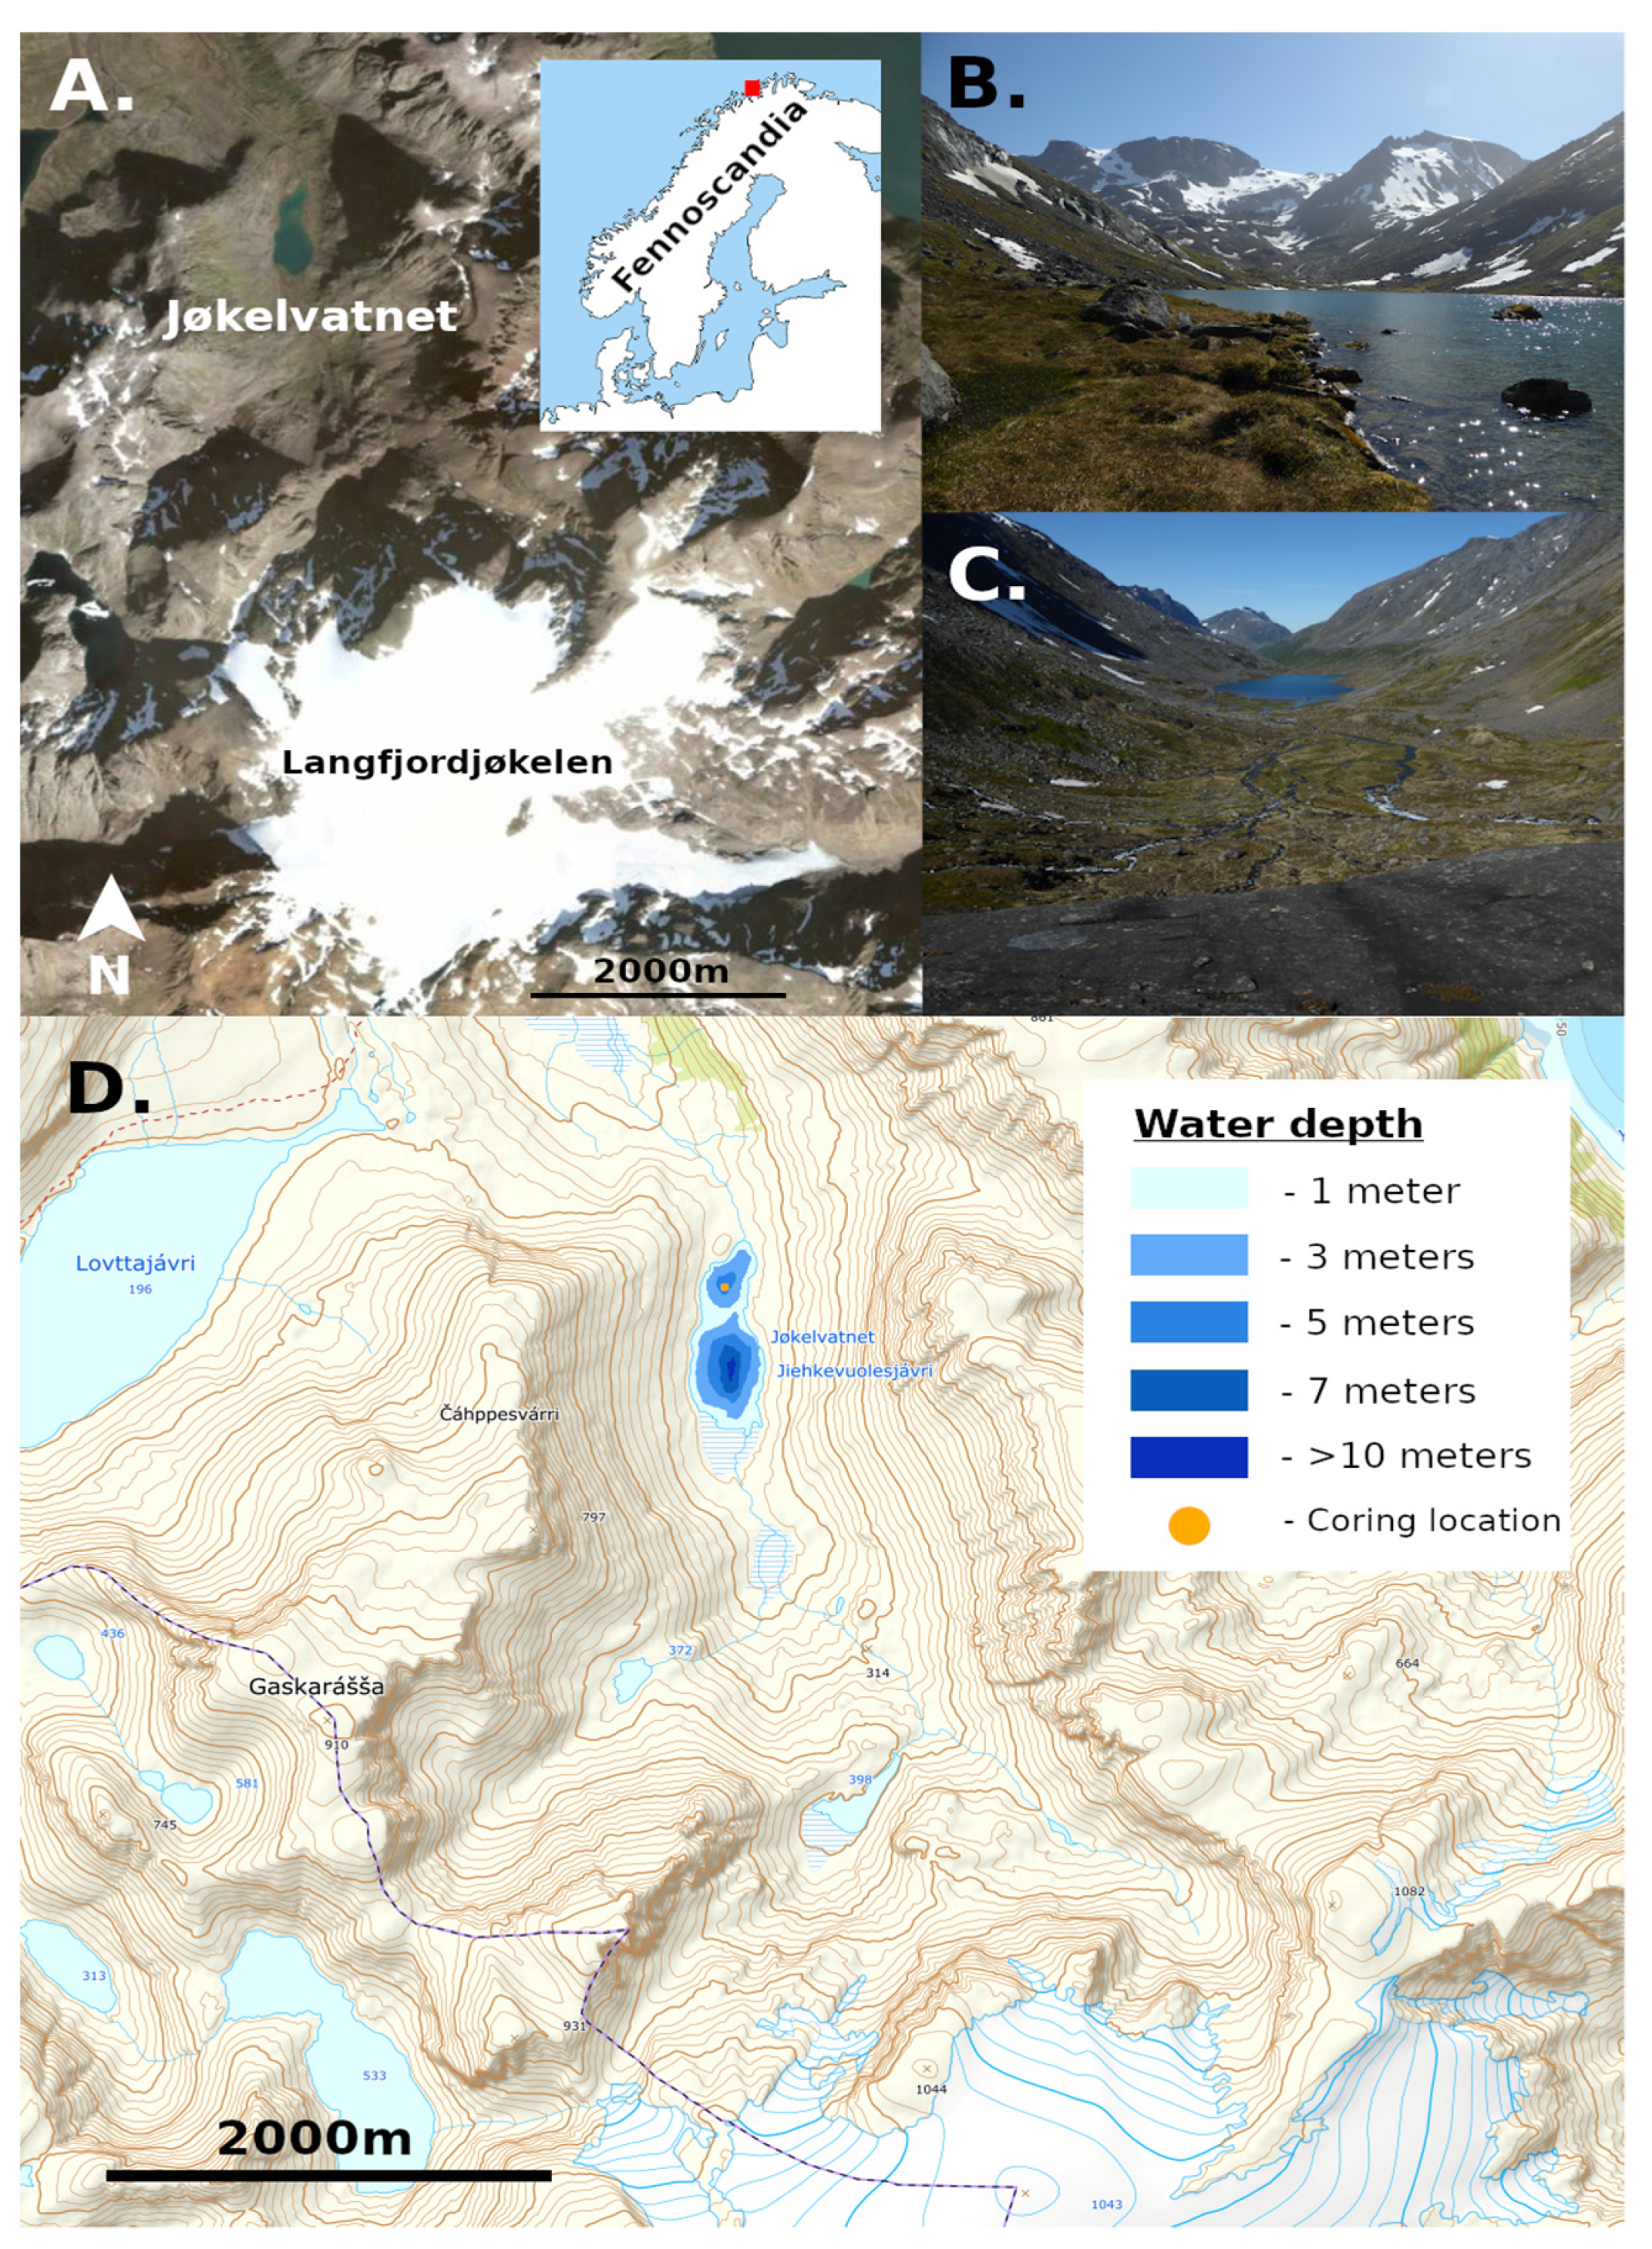
Abstract
1. Introduction
2. Materials and Methods
2.1. Study Site
2.2. Vegetation Surveys
2.3. Coring, Age-Depth Model, and Stratigraphy
2.4. sedaDNA Data Generation
2.5. Bioinformatics
2.6. Data Analysis
3. Results
3.1. sedaDNA Dataset Composition
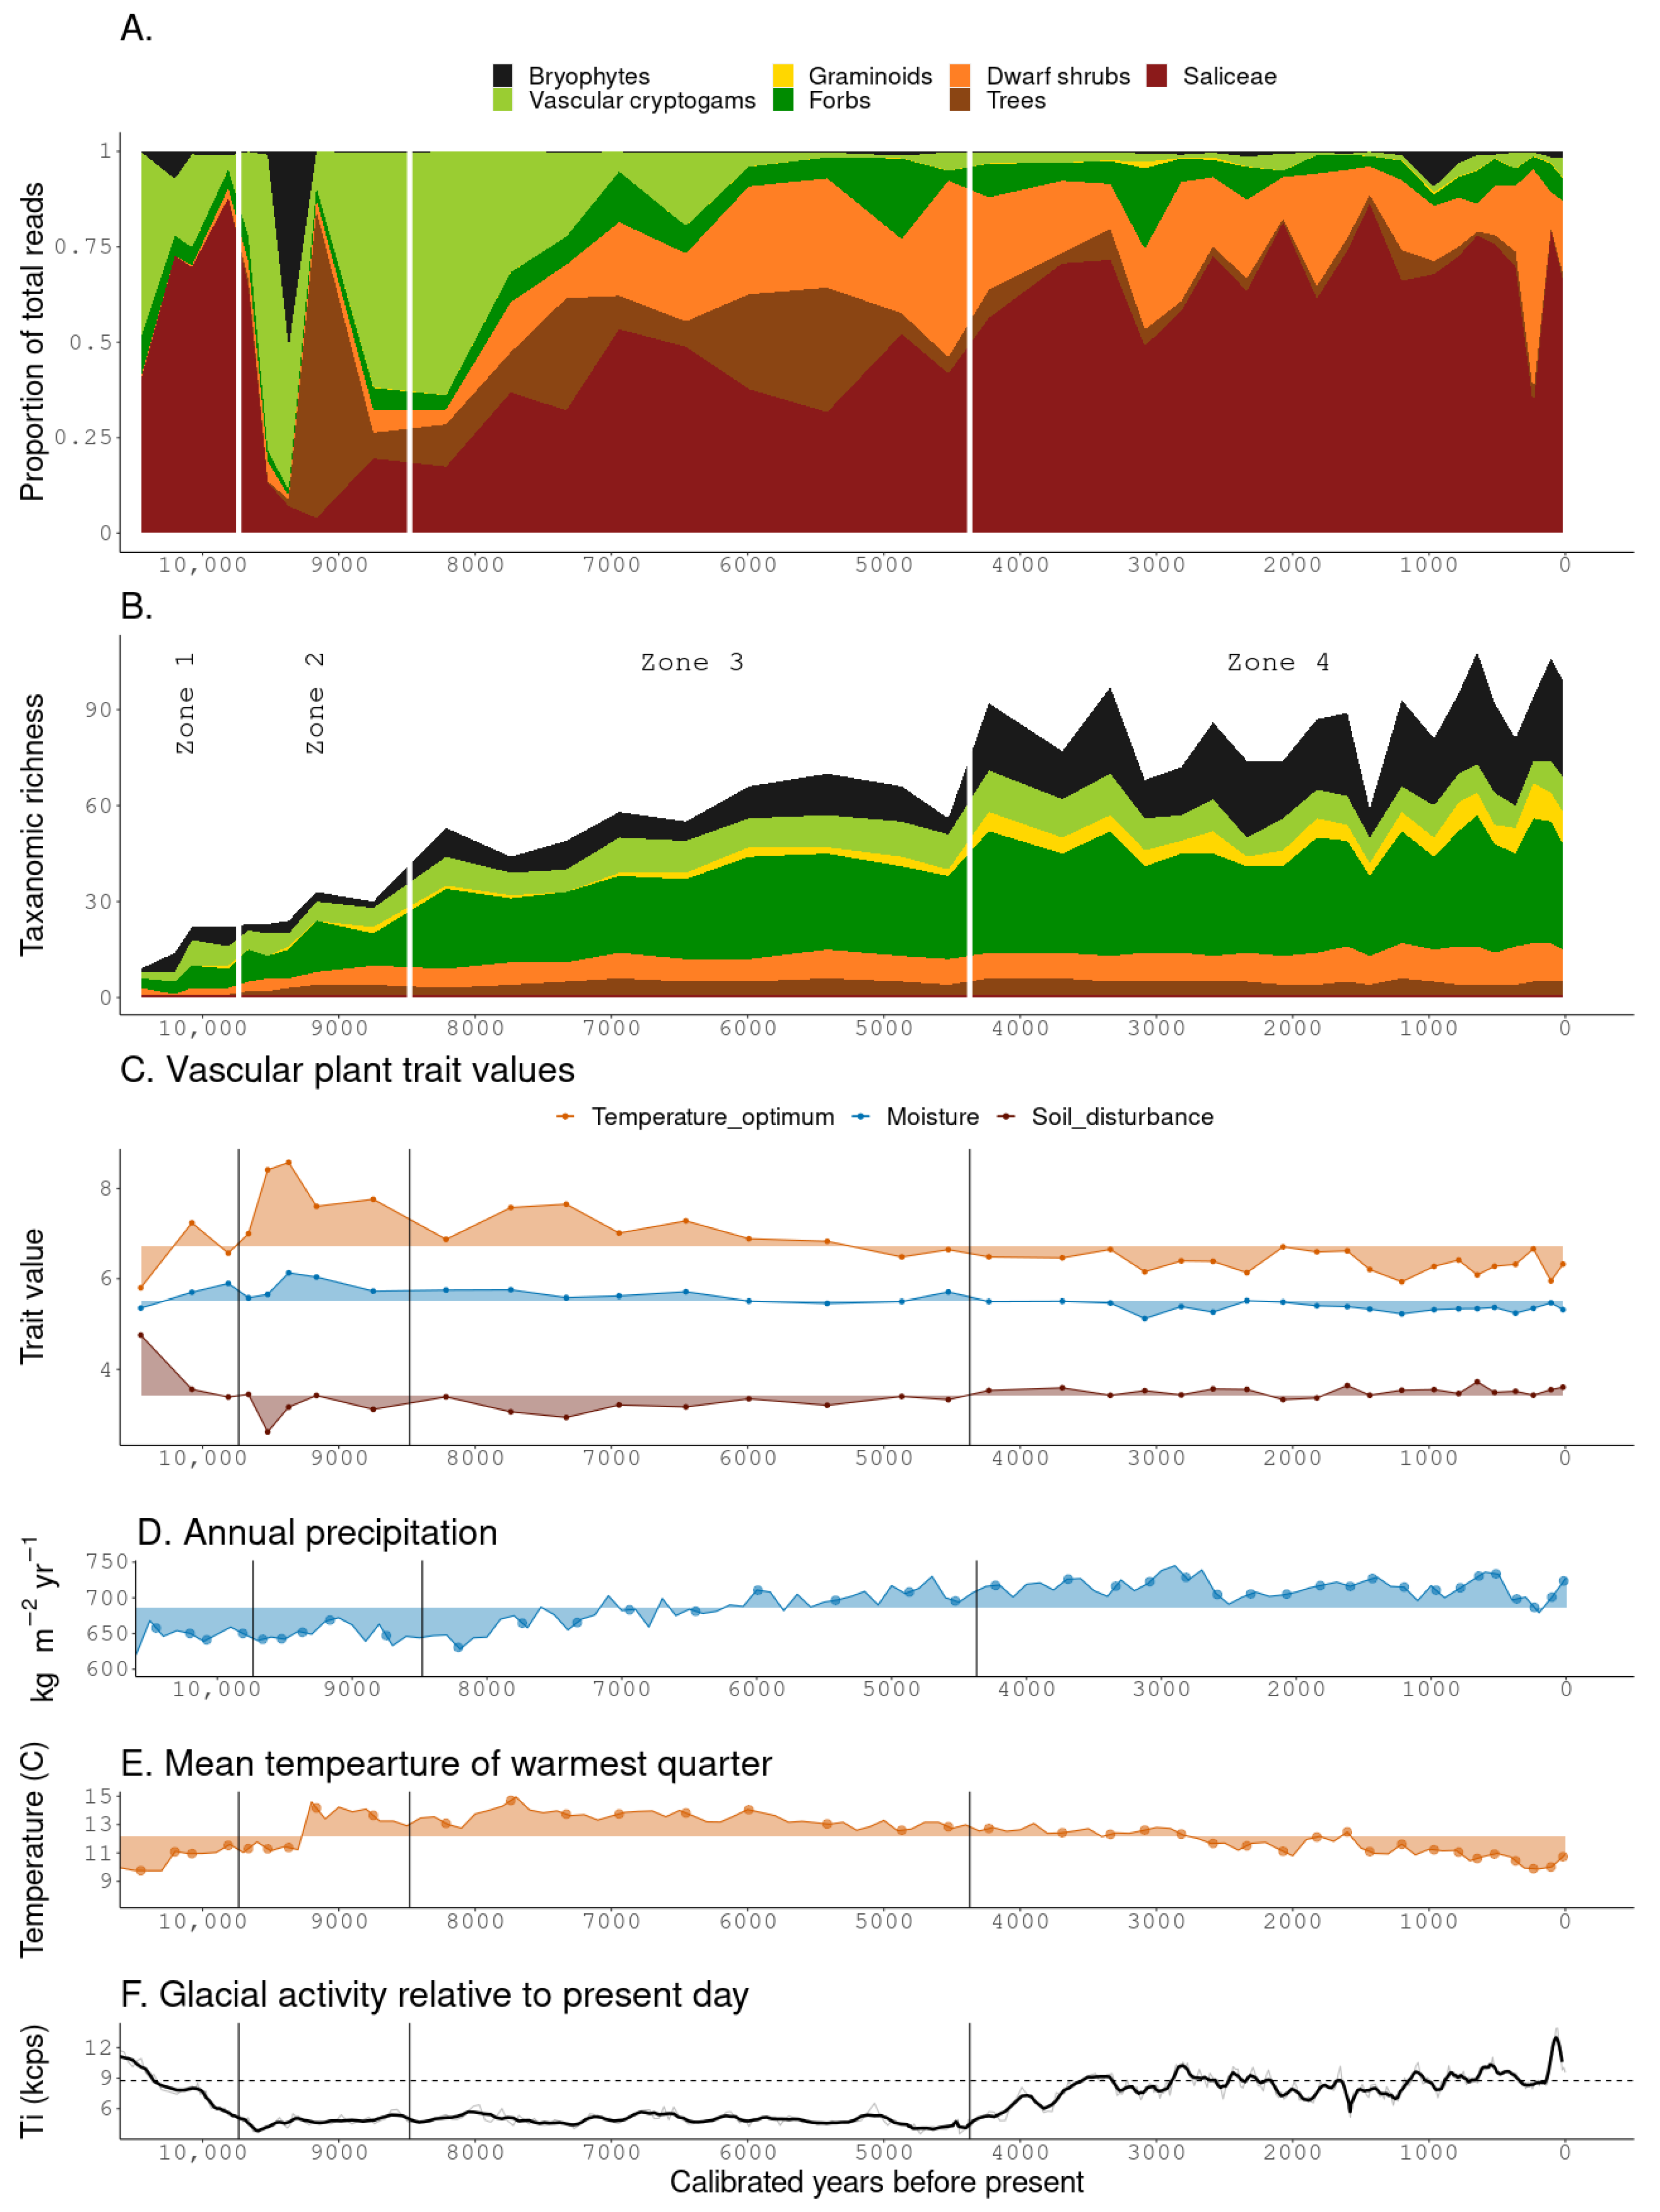
3.2. Zonation
3.2.1. Zone 1
3.2.2. Zone 2
3.2.3. Zone 3
3.2.4. Zone 4
3.3. Ecological Trait Values
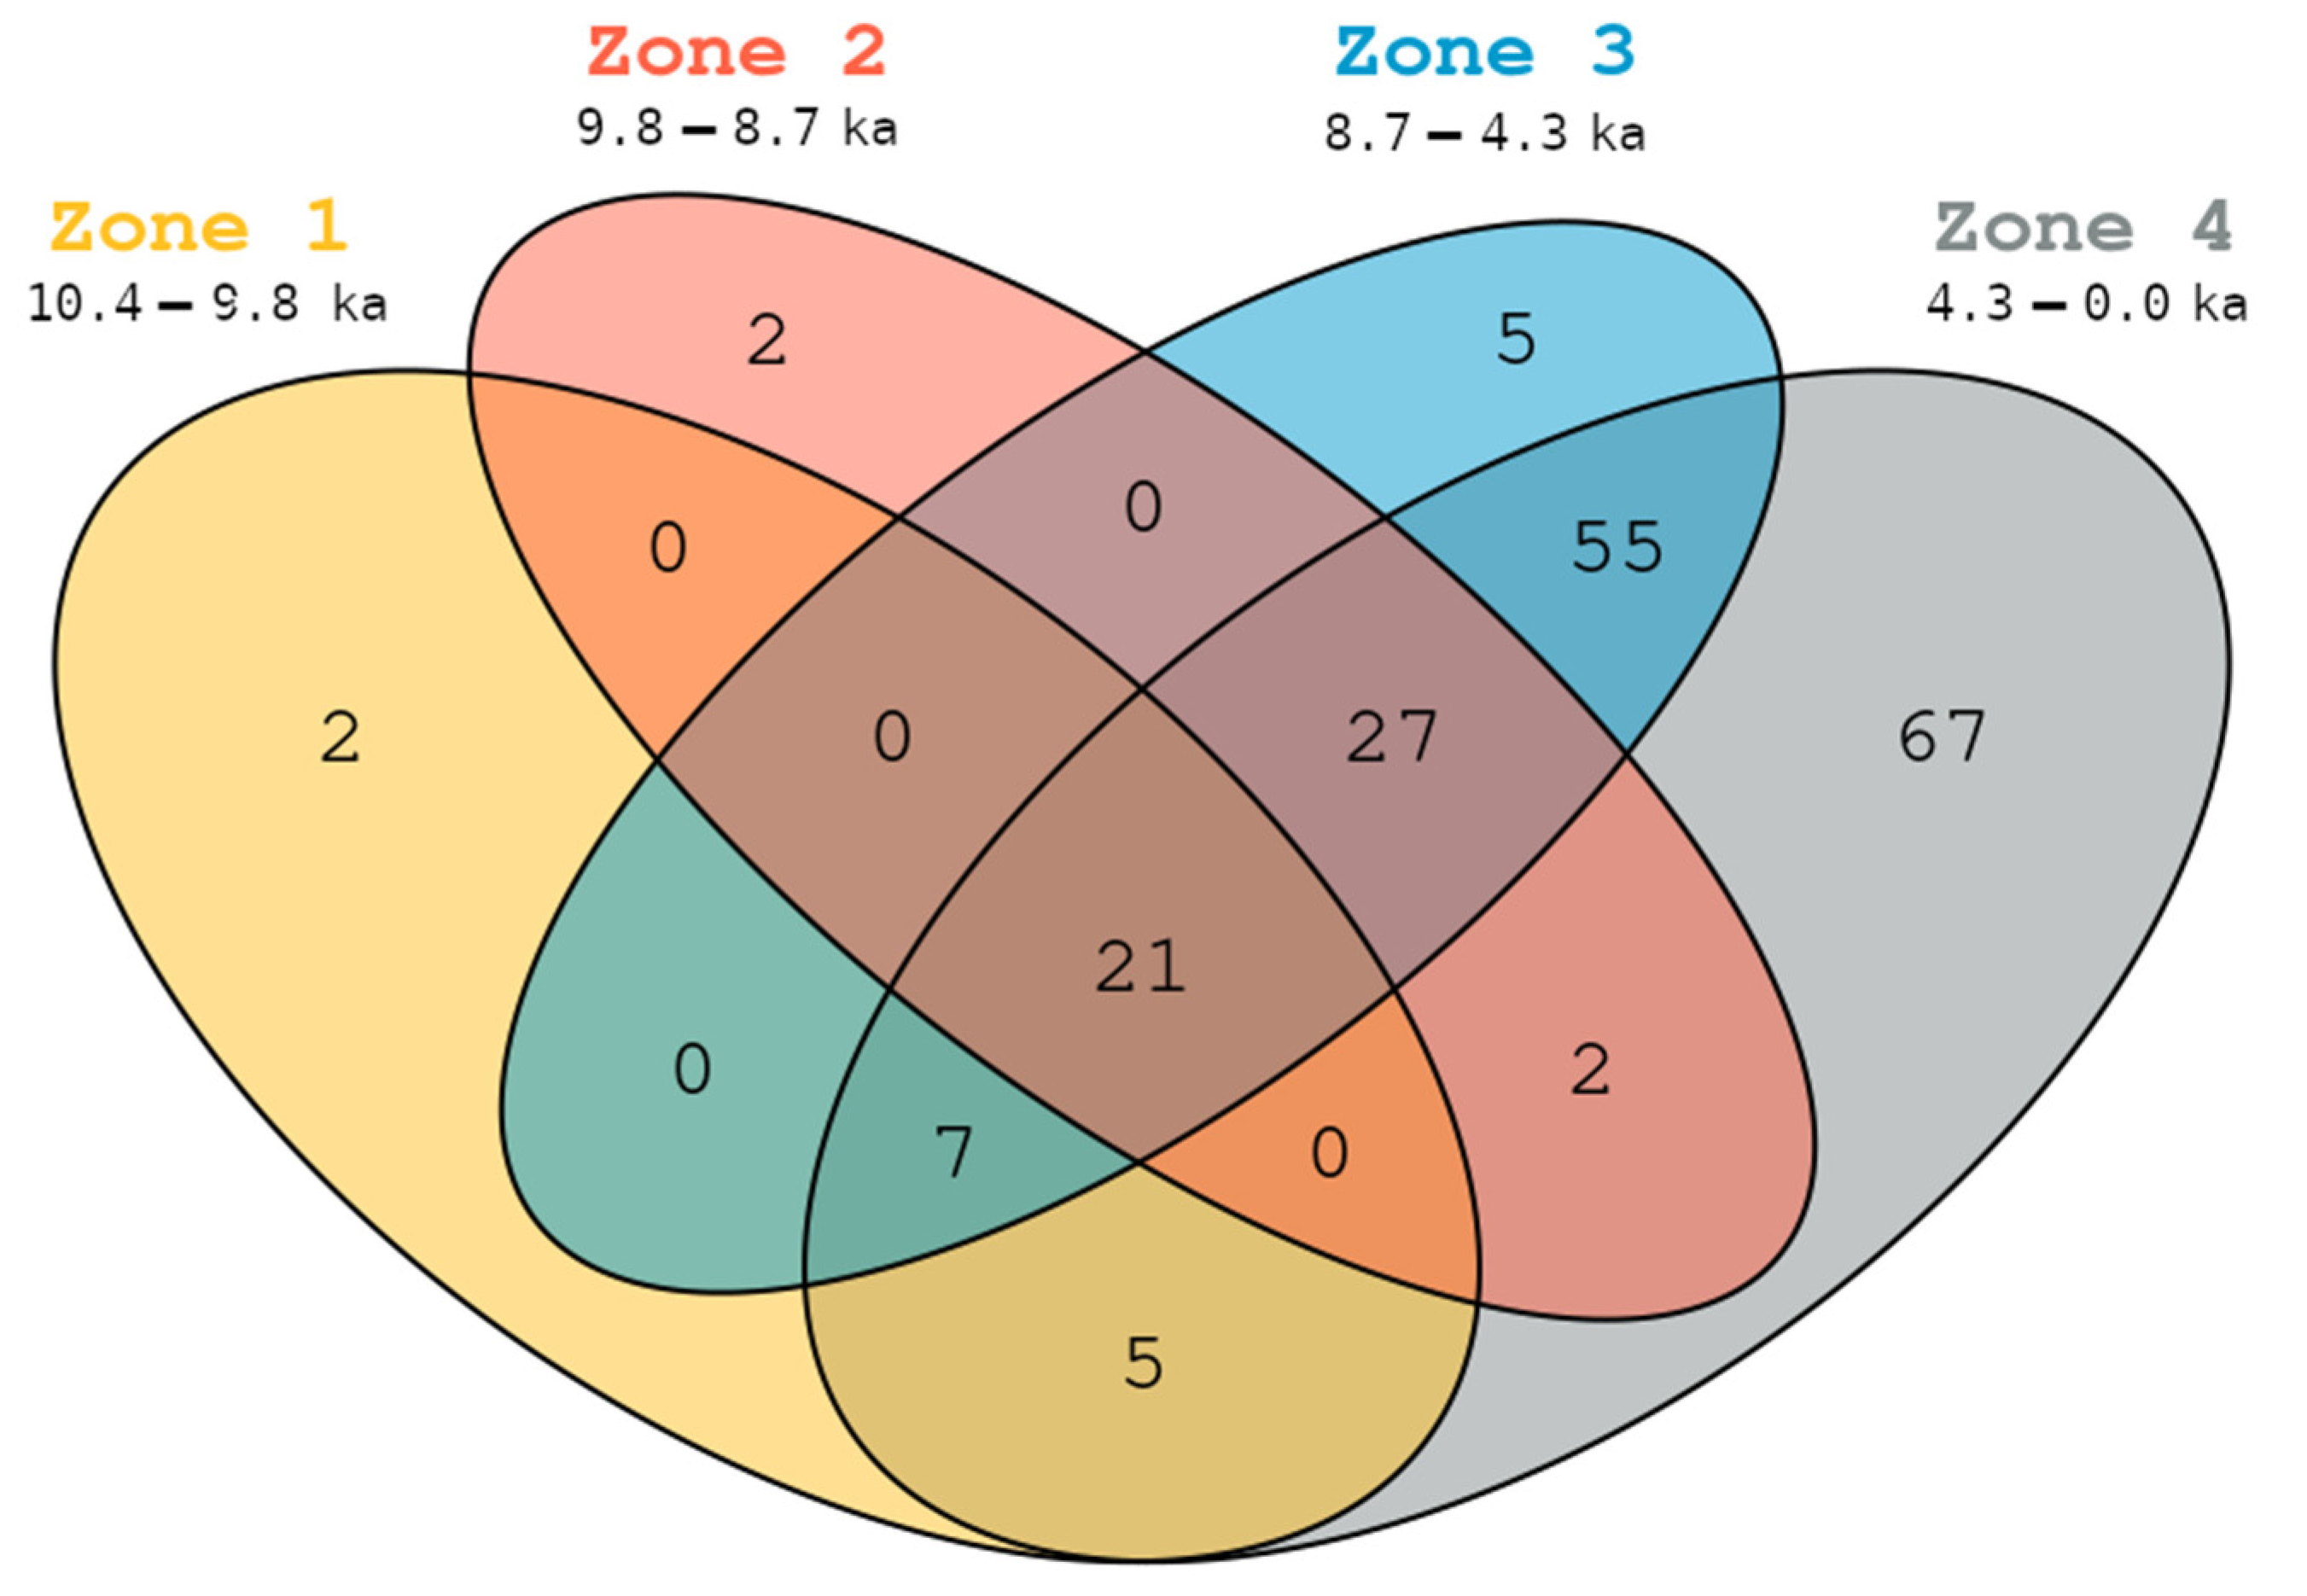
3.4. Taxonomic Persistence and Vegetation Surveys
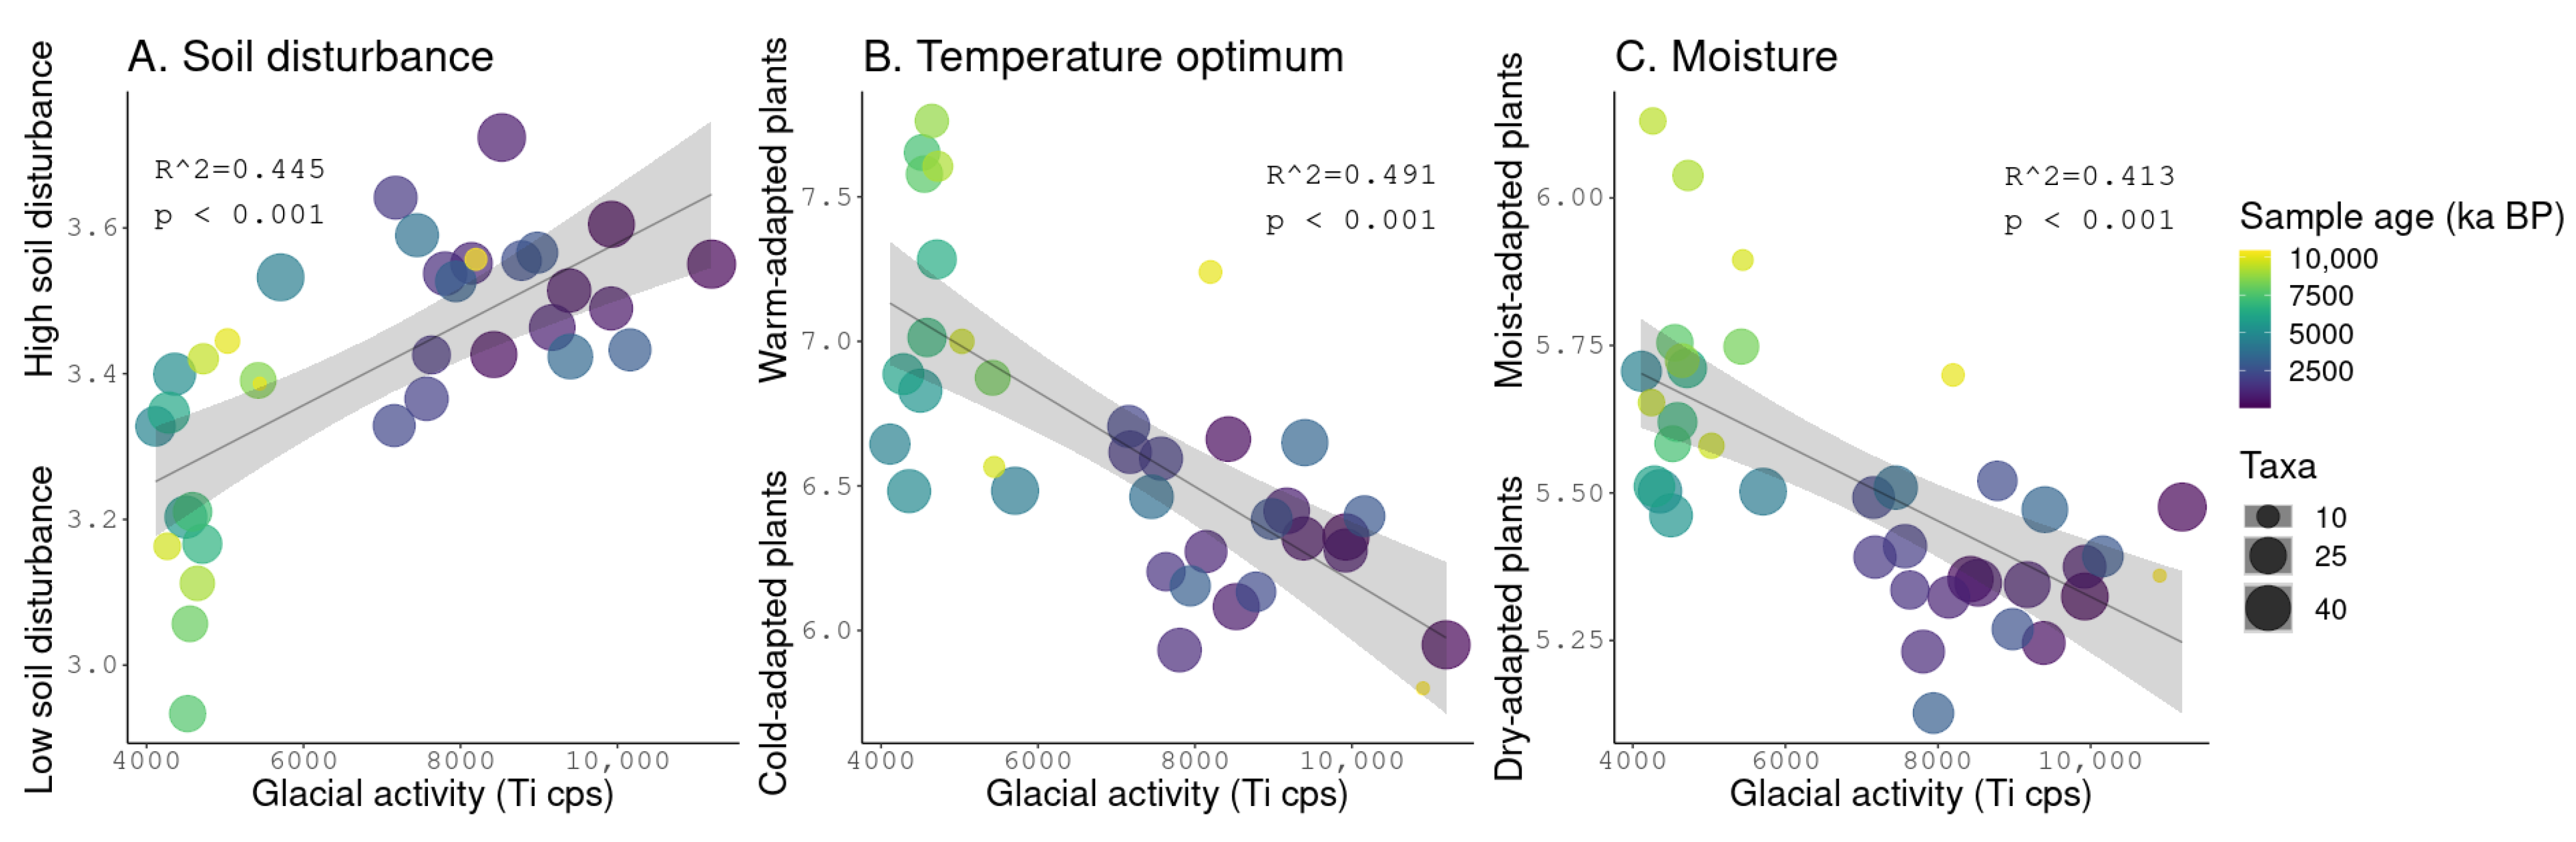
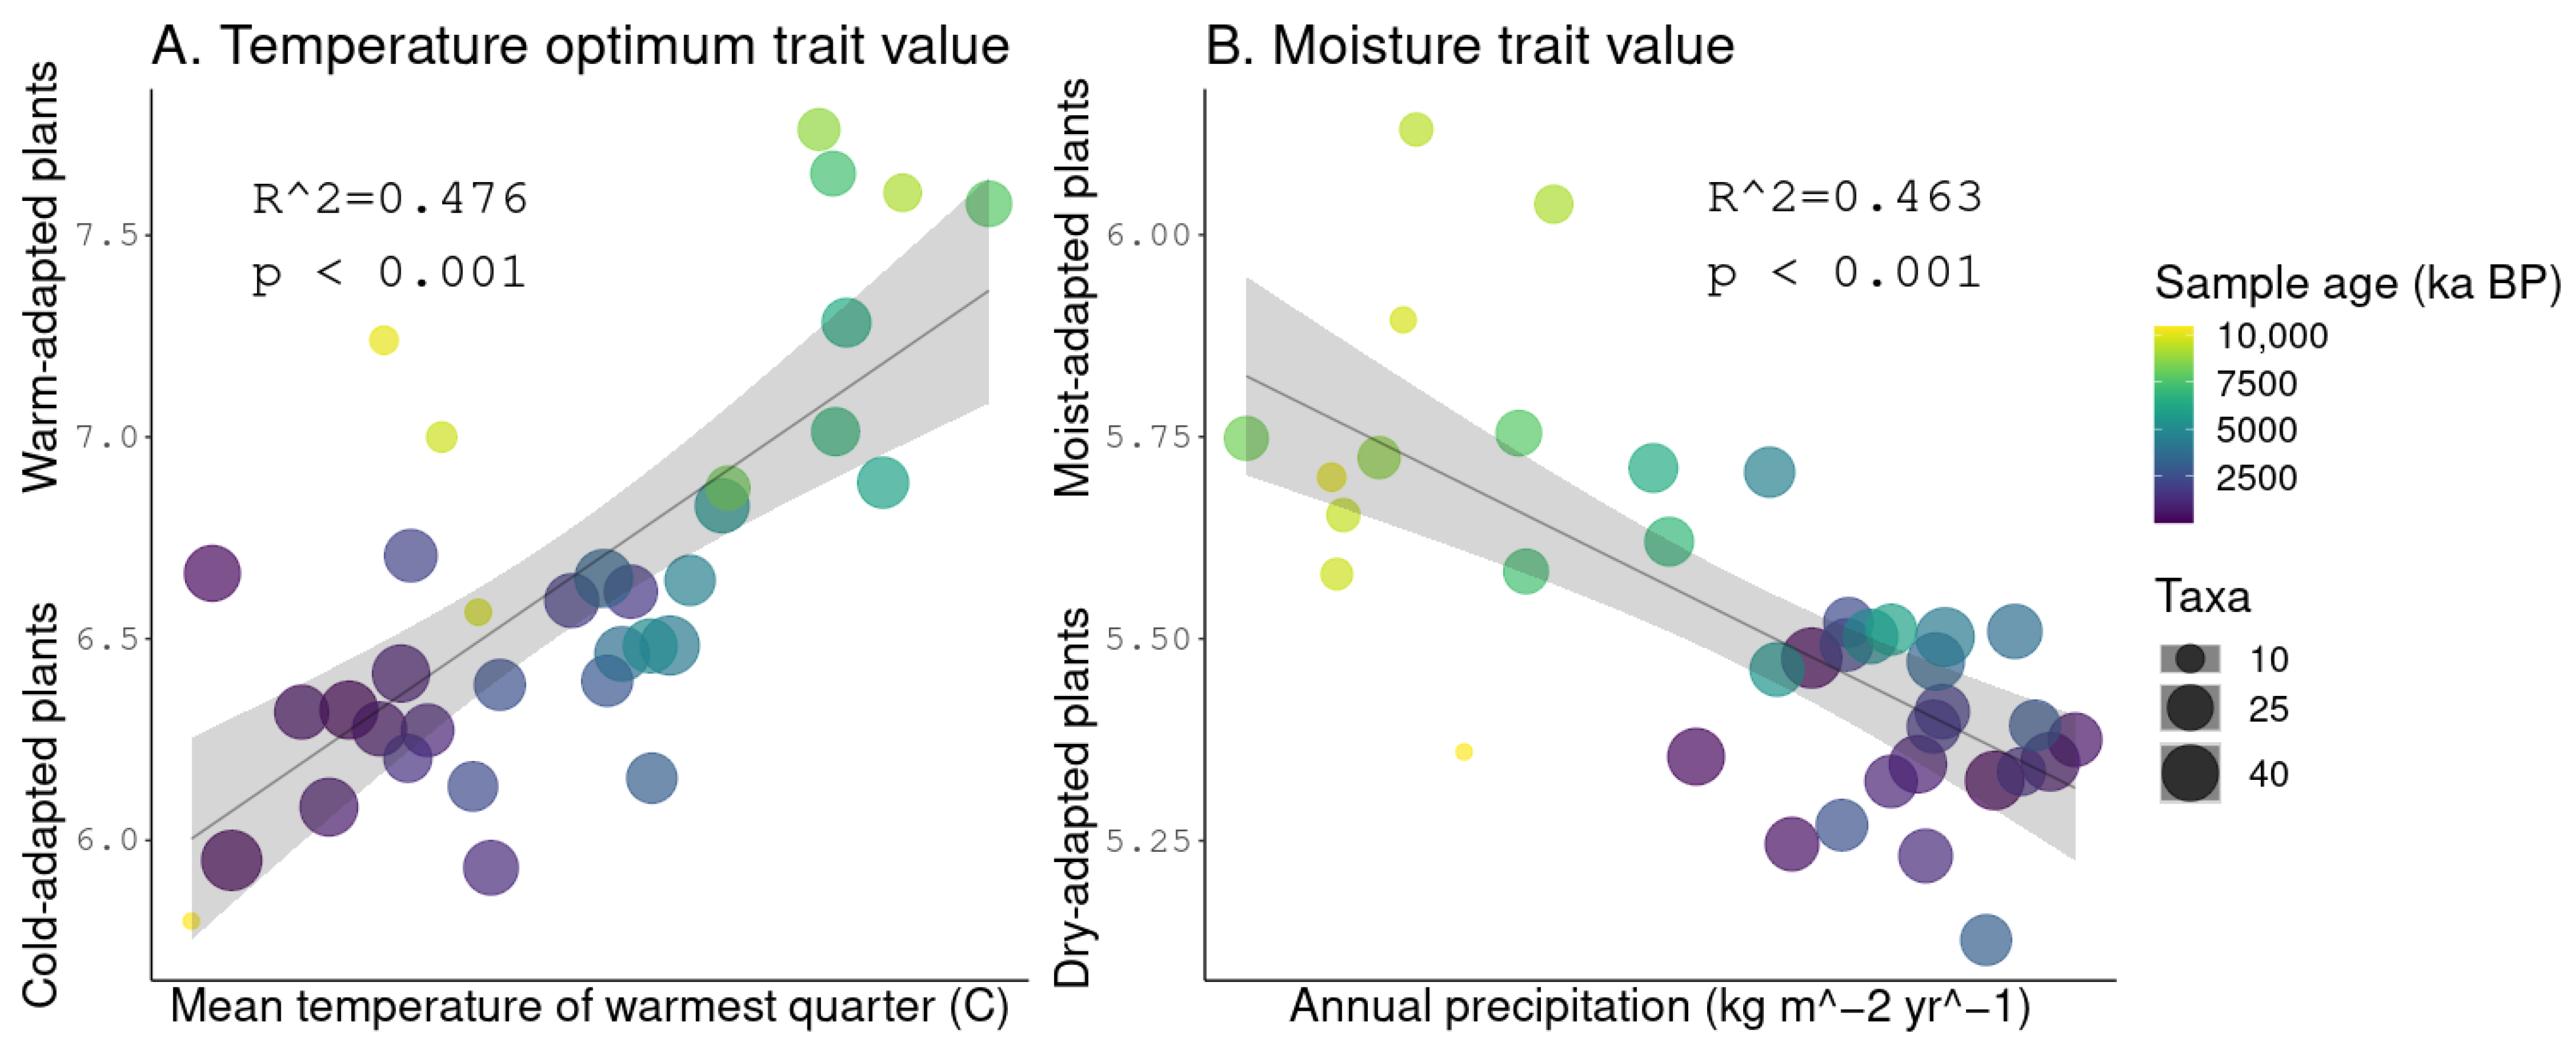
3.5. Linear Regressions
4. Discussion
5. Conclusions
Supplementary Materials
Author Contributions
Funding
Data Availability Statement
Acknowledgments
Conflicts of Interest
References
- Matthews, J.A. The Ecology of Recently-deglaciated Terrain: A Geoecological Approach to Glacier Forelands; Cambridge University Press: Cambridge, UK, 1992; 386p. [Google Scholar]
- Raffl, C.; Mallaun, M.; Mayer, R.; Erschbamer, B. Vegetation Succession Pattern and Diversity Changes in a Glacier Valley, Central Alps, Austria. Arctic Antarct. Alp. Res. 2006, 38, 421–428. [Google Scholar] [CrossRef]
- Eichel, J.; Krautblatter, M.; Schmidtlein, S.; Dikau, R. Biogeomorphic interactions in the Turtmann glacier forefield, Switzerland. Geomorphology 2013, 201, 98–110. [Google Scholar] [CrossRef]
- Wojcik, R.; Eichel, J.; Bradley, J.A.; Benning, L.G. How allogenic factors affect succession in glacier forefields. Earth-Science Rev. 2021, 218, 103642. [Google Scholar] [CrossRef]
- Romundset, A.; Akçar, N.; Fredin, O.; Tikhomirov, D.; Reber, R.; Vockenhuber, C.; Christl, M.; Schlüchter, C. Lateglacial retreat chronology of the Scandinavian Ice Sheet in Finnmark, northern Norway, reconstructed from surface exposure dating of major end moraines. Quat. Sci. Rev. 2017, 177, 130–144. [Google Scholar] [CrossRef]
- Hughes, A.L.C.; Gyllencreutz, R.; Lohne, Ø.S.; Mangerud, J.; Svendsen, J.I. The Last Eurasian Ice Sheets—A Chronological Database and Time-Slice Reconstruction, DATED-1. Boreas 2016, 45, 1–45. [Google Scholar] [CrossRef]
- Sjögren, P.J. An Overview of Holocene Climate Reconstructions in Northernmost Fennoscandia. SapReps. 15 February 2021. Available online: https://septentrio.uit.no/index.php/SapReps/article/view/5747 (accessed on 1 May 2022).
- Larocca, L.J.; Axford, Y. Arctic glaciers and ice caps through the Holocene:a circumpolar synthesis of lake-based reconstructions. Clim. Past 2022, 18, 579–606. [Google Scholar] [CrossRef]
- Nesje, A.; Bakke, J.; Dahl, S.O.; Lie, Ø.; Matthews, J.A. Norwegian mountain glaciers in the past, present and future. Glob. Planet. Chang. 2008, 60, 10–27. [Google Scholar] [CrossRef]
- Wanner, H.; Solomina, O.; Grosjean, M.; Ritz, S.P.; Jetel, M. Structure and origin of Holocene cold events. Quat. Sci. Rev. 2011, 30, 3109–3123. [Google Scholar] [CrossRef]
- Birks, H.J.B. Contributions of Quaternary botany to modern ecology and biogeography. Plant Ecol. Divers. 2019, 12, 189–385. [Google Scholar] [CrossRef]
- Sjögren, P.; Damm, C. Holocene Vegetation Change in Northernmost Fennoscandia and the Impact on Prehistoric Foragers 12 000–2000 cal. a BP—A Review. Boreas 2019, 48, 20–35. [Google Scholar] [CrossRef]
- Sjögren, P.; van der Knaap, W.; Huusko, A.; van Leeuwen, J.F. Pollen productivity, dispersal, and correction factors for major tree taxa in the Swiss Alps based on pollen-trap results. Rev. Palaeobot. Palynol. 2008, 152, 200–210. [Google Scholar] [CrossRef]
- Ritchie, J.C. Current trends in studies of long-term plant community dynamics. New Phytol. 1995, 130, 469–494. [Google Scholar] [CrossRef] [PubMed]
- Alsos, I.G.; Sjögren, P.J.E.; Edwards, M.E.; Landvik, J.Y.; Gielly, L.; Forwick, M.; Coissac, E.; Brown, A.; Jakobsen, L.V.; Føreid, M.K.; et al. Sedimentary ancient DNA from Lake Skartjørna, Svalbard: Assessing the resilience of arctic flora to Holocene climate change. Holocene 2015, 26, 627–642. [Google Scholar] [CrossRef]
- Birks, H.H.; Birks, H.J.B. Future uses of pollen analysis must include plant macrofossils. J. Biogeogr. 2000. Available online: https://www.jstor.org/stable/2655981 (accessed on 14 October 2021).
- Parducci, L.; Bennett, K.D.; Ficetola, G.F.; Alsos, I.G.; Suyama, Y.; Wood, J.R.; Pedersen, M.W. Ancient plant DNA in lake sediments. New Phytol. 2017, 214, 924–942. [Google Scholar] [CrossRef]
- Sjögren, P.; Edwards, M.E.; Gielly, L.; Langdon, C.T.; Croudace, I.W.; Merkel, M.K.F.; Fonville, T.; Alsos, I.G. Lake sedimentary DNA accurately records 20th Century introductions of exotic conifers in Scotland. New Phytol. 2016, 213, 929–941. [Google Scholar] [CrossRef] [PubMed]
- Taberlet, P.; Coissac, E.; Pompanon, F.; Gielly, L.; Miquel, C.; Valentini, A.; Vermat, T.; Corthier, G.; Brochmann, C.; Willerslev, E. Power and limitations of the chloroplast trnL (UAA) intron for plant DNA barcoding. Nucleic Acids Res. 2006, 35, e14. [Google Scholar] [CrossRef] [PubMed]
- Wang, Y.; Pedersen, M.W.; Alsos, I.G.; De Sanctis, B.; Racimo, F.; Prohaska, A.; Coissac, E.; Owens, H.L.; Merkel, M.K.F.; Fernandez-Guerra, A.; et al. Author Correction: Late Quaternary dynamics of Arctic biota from ancient environmental genomics. Nature 2021, 600, 86–92. [Google Scholar] [CrossRef]
- Tyler, T.; Herbertsson, L.; Olofsson, J.; Olsson, P.A. Ecological indicator and traits values for Swedish vascular plants. Ecol. Indic. 2020, 120, 106923. [Google Scholar] [CrossRef]
- Alsos, I.G.; Rijal, D.P.; Ehrich, D.; Karger, D.N.; Yoccoz, N.G.; Heintzman, P.D.; Brown, A.G.; Lammers, Y.; Pellissier, L.; Alm, T.; et al. Postglacial species arrival and diversity buildup of northern ecosystems took millennia. Sci. Adv. 2022, 8, eabo7434. [Google Scholar] [CrossRef]
- Wittmeier, H.E.; Bakke, J.; Vasskog, K.; Trachsel, M. Reconstructing Holocene glacier activity at Langfjordjøkelen, Arctic Norway, using multi-proxy fingerprinting of distal glacier-fed lake sediments. Quat. Sci. Rev. 2015, 114, 78–99. [Google Scholar] [CrossRef]
- Karger, D.N.; Nobis, M.P.; Normand, S.; Graham, C.H.; Zimmermann, N.E. CHELSA-TraCE21k v1.0. Downscaled transient temperature and precipitation data since the last glacial maximum. Clim. Past. 2021, pp. 1–27. Available online: https://cp.copernicus.org/preprints/cp-2021-30/ (accessed on 18 May 2022).
- Andreassen, L.M.; Winsvold, S.H.; Paul, F.; Hausberg, J.E. Inventory of Norwegian glaciers. In Rapport; Andreassen, L.M., Winsvold, S.H., Eds.; Norwegian Water Resources and Energy Directorate: Oslo, Norway, 2012; Volume 38, p. 240. [Google Scholar]
- Rijal, D.P.; Heintzman, P.D.; Lammers, Y.; Yoccoz, N.G.; Lorberau, K.E.; Pitelkova, I.; Goslar, T.; Murguzur, F.J.A.; Salonen, J.S.; Helmens, K.F.; et al. Sedimentary ancient DNA shows terrestrial plant richness continuously increased over the Holocene in northern Fennoscandia. Sci. Adv. 2021, 7. [Google Scholar] [CrossRef]
- Nesje, A. A Piston Corer for Lacustrine and Marine Sediments. Arct. Alp. Res. 1992, 24, 257. [Google Scholar] [CrossRef]
- Blaauw, M.; Christen, J.A. Flexible paleoclimate age-depth models using an autoregressive gamma process. Bayesian Anal. 2011, 6, 457–474. [Google Scholar] [CrossRef]
- Reimer, P.J.; Bard, E.; Bayliss, A.; Warren Beck, J.; Blackwell, P.G.; Ramsey, C.B.; Buck, C.E.; Cheng, H.; Edwards, R.L.; Friedrich, M.; et al. IntCal13 and Marine13 Radiocarbon Age Calibration Curves 0–50,000 Years cal BP. Radiocarbon 2013, 55, 1869–1887. [Google Scholar] [CrossRef]
- Taberlet, P.; Bonin, A.; Zinger, L.; Coissac, E. Environmental DNA: For Biodiversity Research and Monitoring; Oxford University Press: Oxford, UK, 2018; 253p. [Google Scholar]
- Boyer, F.; Mercier, C.; Bonin, A.; Bras, Y.L.; Taberlet, P.; Coissac, E. Obitools: A unix-inspired software package for DNA metabarcoding. Mol. Ecol. Resour. 2016, 16, 176–182. [Google Scholar] [CrossRef] [PubMed]
- Sønstebø, J.H.; Gielly, L.; Brysting, A.K.; Elven, R.; Edwards, M.; Haile, J.; Willerslev, E.; Coissac, E.; Rioux, D.; Sannier, J.; et al. Using next-generation sequencing for molecular reconstruction of past Arctic vegetation and climate. Mol. Ecol. Resour. 2010, 10, 1009–1018. [Google Scholar] [CrossRef] [PubMed]
- Willerslev, E.; Davison, J.; Moora, M.; Zobel, M.; Coissac, E.; Edwards, M.E.; Lorenzen, E.D.; Vestergård, M.; Gussarova, G.; Haile, J.; et al. Fifty thousand years of Arctic vegetation and megafaunal diet. Nature 2014, 506, 47–51. [Google Scholar] [CrossRef] [PubMed]
- Soininen, E.M.; Gauthier, G.; Bilodeau, F.; Berteaux, D.; Gielly, L.; Taberlet, P.; Gussarova, G.; Bellemain, E.; Hassel, K.; Stenøien, H.K.; et al. Highly overlapping winter diet in two sympatric lemming species revealed by DNA metabarcoding. PLoS ONE 2015, 10, e0115335. [Google Scholar] [CrossRef] [PubMed]
- Alsos, I.G.; Lavergne, S.; Merkel, M.K.F.; Boleda, M.; Lammers, Y.; Alberti, A.; Pouchon, C.; Denoeud, F.; Pitelkova, I.; Pușcaș, M.; et al. The Treasure Vault Can be Opened: Large-Scale Genome Skimming Works Well Using Herbarium and Silica Gel Dried Material. Plants 2020, 9, 432. [Google Scholar] [CrossRef] [PubMed]
- Elven, R.; Murray, D.F.; Razzhivin, V.Y.; Yurtsev, B.A. Annotated Checklist of the Panarctic Flora (PAF) Vascular Plants; Natural History Museum, University of Oslo: Oslo, Norway, 2011. [Google Scholar]
- Elven, R.; Alm, T.; Berg, T.; Båtvik, J.I.I.; Fremstad, E.; Pedersen, O. Johannes Lid & Dagny Tande Lid: Norsk Flora; Det Norske Samlaget: Oslo, Norway, 2005. [Google Scholar]
- Oksanen, J.; Blanchet, F.G.; Friendly, M.; Kindt, R.; Legendre, P.; McGlinn, D.; Minchin, P.; O’Hara, R.B.; Simpson, G.; Solymos, P.; et al. vegan: Community Ecology Package. R package version 2.5-6. Available online: https://CRAN.R-project.org/package=vegan (accessed on 10 March 2021).
- Juggins, S. Rioja: Analysis of Quaternary Science Data. 2020. Available online: https://cran.r-project.org/package=rioja (accessed on 10 March 2021).
- Wickham, H. Ggplot2: Elegant Graphics for Data Analysis; Springer: New York, NY, USA, 2016; Available online: https://ggplot2.tidyverse.org (accessed on 10 March 2021).
- Walker, M.D.; Walker, D.A.; Welker, J.M.; Arft, A.M.; Bardsley, T.; Brooks, P.D.; Fahnestock, J.T.; Jones, M.H.; Losleben, M.; Parsons, A.N.; et al. Long-Term Experimental Manipulation of Winter Snow Regime and Summer Temperature in Arctic and Alpine Tundra. Hydrol. Process. 1999, 13, 2315–2330. [Google Scholar] [CrossRef]
- Clarke, C.L.; Edwards, M.E.; Gielly, L.; Ehrich, D.; Hughes, P.D.M.; Morozova, L.M.; Haflidason, H.; Mangerud, J.; Svendsen, J.I.; Alsos, I.G. Persistence of arctic-alpine flora during 24,000 years of environmental change in the Polar Urals. Sci. Rep. 2019, 9, 1–11. [Google Scholar] [CrossRef]
- Giguet-Covex, C.; Ficetola, G.F.; Walsh, K.; Poulenard, J.; Bajard, M.; Fouinat, L.; Sabatier, P.; Gielly, L.; Messager, E.; Develle, A.L.; et al. New insights on lake sediment DNA from the catchment: Importance of taphonomic and analytical issues on the record quality. Sci. Rep. 2019, 9, 1–21. [Google Scholar] [CrossRef]
- Heinecke, L.; Epp, L.S.; Reschke, M.; Stoof-Leichsenring, K.R.; Mischke, S.; Plessen, B.; Herzschuh, U. Aquatic macrophyte dynamics in Lake Karakul (Eastern Pamir) over the last 29 cal ka revealed by sedimentary ancient DNA and geochemical analyses of macrofossil remains. J. Paleolimnol. 2017, 58, 403–417. [Google Scholar] [CrossRef]
- Alsos, I.G.; Lammers, Y.; Yoccoz, N.G.; Jørgensen, T.; Sjögren, P.; Gielly, L.; Edwards, M.E. Plant DNA metabarcoding of lake sediments: How does it represent the contemporary vegetation. PLoS ONE 2018, 13, e0195403. [Google Scholar] [CrossRef] [PubMed]
- Ariza, M.; Fouks, B.; Mauvisseau, Q.; Halvorsen, R.; Alsos, I.G.; de Boer, H.J. Plant Biodiversity Assessment through Soil eDNA Reflects Temporal and Local Diversity. Methods Ecol. Evol. 2022. [CrossRef]
- Giaccone, E.; Luoto, M.; Vittoz, P.; Guisan, A.; Mariéthoz, G.; Lambiel, C. Influence of microclimate and geomorphological factors on alpine vegetation in the Western Swiss Alps. Earth Surf. Process. Landforms 2019, 44, 3093–3107. [Google Scholar] [CrossRef]
- Niittynen, P.; Luoto, M. The importance of snow in species distribution models of arctic vegetation. Ecography 2017, 41, 1024–1037. [Google Scholar] [CrossRef]
- Schuler, T.V.; Crochet, P.; Hock, R.; Jackson, M.; Barstad, I.; Johannesson, T. Distribution of snow accumulation on the Svartisen ice cap, Norway, assessed by a model of orographic precipitation. Hydrol. Process. 2008, 22, 3998–4008. [Google Scholar] [CrossRef]
- Bates, J.W. Is “life-form” a useful concept in bryophyte ecology? Oikos 1998, 82, 223. [Google Scholar] [CrossRef]
- Svendsen, J.I.; Færseth, L.M.B.; Gyllencreutz, R.; Haflidason, H.; Henriksen, M.; Hovland, M.N.; Lohne, S.; Mangerud, J.; Nazarov, D.; Regnéll, C.; et al. Glacial and environmental changes over the last 60 000 years in the Polar Ural Mountains, Arctic Russia, inferred from a high-resolution lake record and other observations from adjacent areas. Boreas 2018, 48, 407–431. [Google Scholar] [CrossRef]
- Jones, G.A.; Henry, G.H.R. Primary plant succession on recently deglaciated terrain in the Canadian High Arctic. J. Biogeogr. 2003, 30, 277–296. [Google Scholar] [CrossRef]


Disclaimer/Publisher’s Note: The statements, opinions and data contained in all publications are solely those of the individual author(s) and contributor(s) and not of MDPI and/or the editor(s). MDPI and/or the editor(s) disclaim responsibility for any injury to people or property resulting from any ideas, methods, instructions or products referred to in the content. |
© 2023 by the authors. Licensee MDPI, Basel, Switzerland. This article is an open access article distributed under the terms and conditions of the Creative Commons Attribution (CC BY) license (https://creativecommons.org/licenses/by/4.0/).
Share and Cite
Elliott, L.D.; Rijal, D.P.; Brown, A.G.; Bakke, J.; Topstad, L.; Heintzman, P.D.; Alsos, I.G. Sedimentary Ancient DNA Reveals Local Vegetation Changes Driven by Glacial Activity and Climate. Quaternary 2023, 6, 7. https://doi.org/10.3390/quat6010007
Elliott LD, Rijal DP, Brown AG, Bakke J, Topstad L, Heintzman PD, Alsos IG. Sedimentary Ancient DNA Reveals Local Vegetation Changes Driven by Glacial Activity and Climate. Quaternary. 2023; 6(1):7. https://doi.org/10.3390/quat6010007
Chicago/Turabian StyleElliott, Lucas D., Dilli P. Rijal, Antony G. Brown, Jostein Bakke, Lasse Topstad, Peter D. Heintzman, and Inger G. Alsos. 2023. "Sedimentary Ancient DNA Reveals Local Vegetation Changes Driven by Glacial Activity and Climate" Quaternary 6, no. 1: 7. https://doi.org/10.3390/quat6010007
APA StyleElliott, L. D., Rijal, D. P., Brown, A. G., Bakke, J., Topstad, L., Heintzman, P. D., & Alsos, I. G. (2023). Sedimentary Ancient DNA Reveals Local Vegetation Changes Driven by Glacial Activity and Climate. Quaternary, 6(1), 7. https://doi.org/10.3390/quat6010007