Grain-Size Distribution and Structural Characteristics of Varved Sediments from Lake Żabińskie (Northeastern Poland)


Abstract
:1. Introduction
2. Materials and Methods
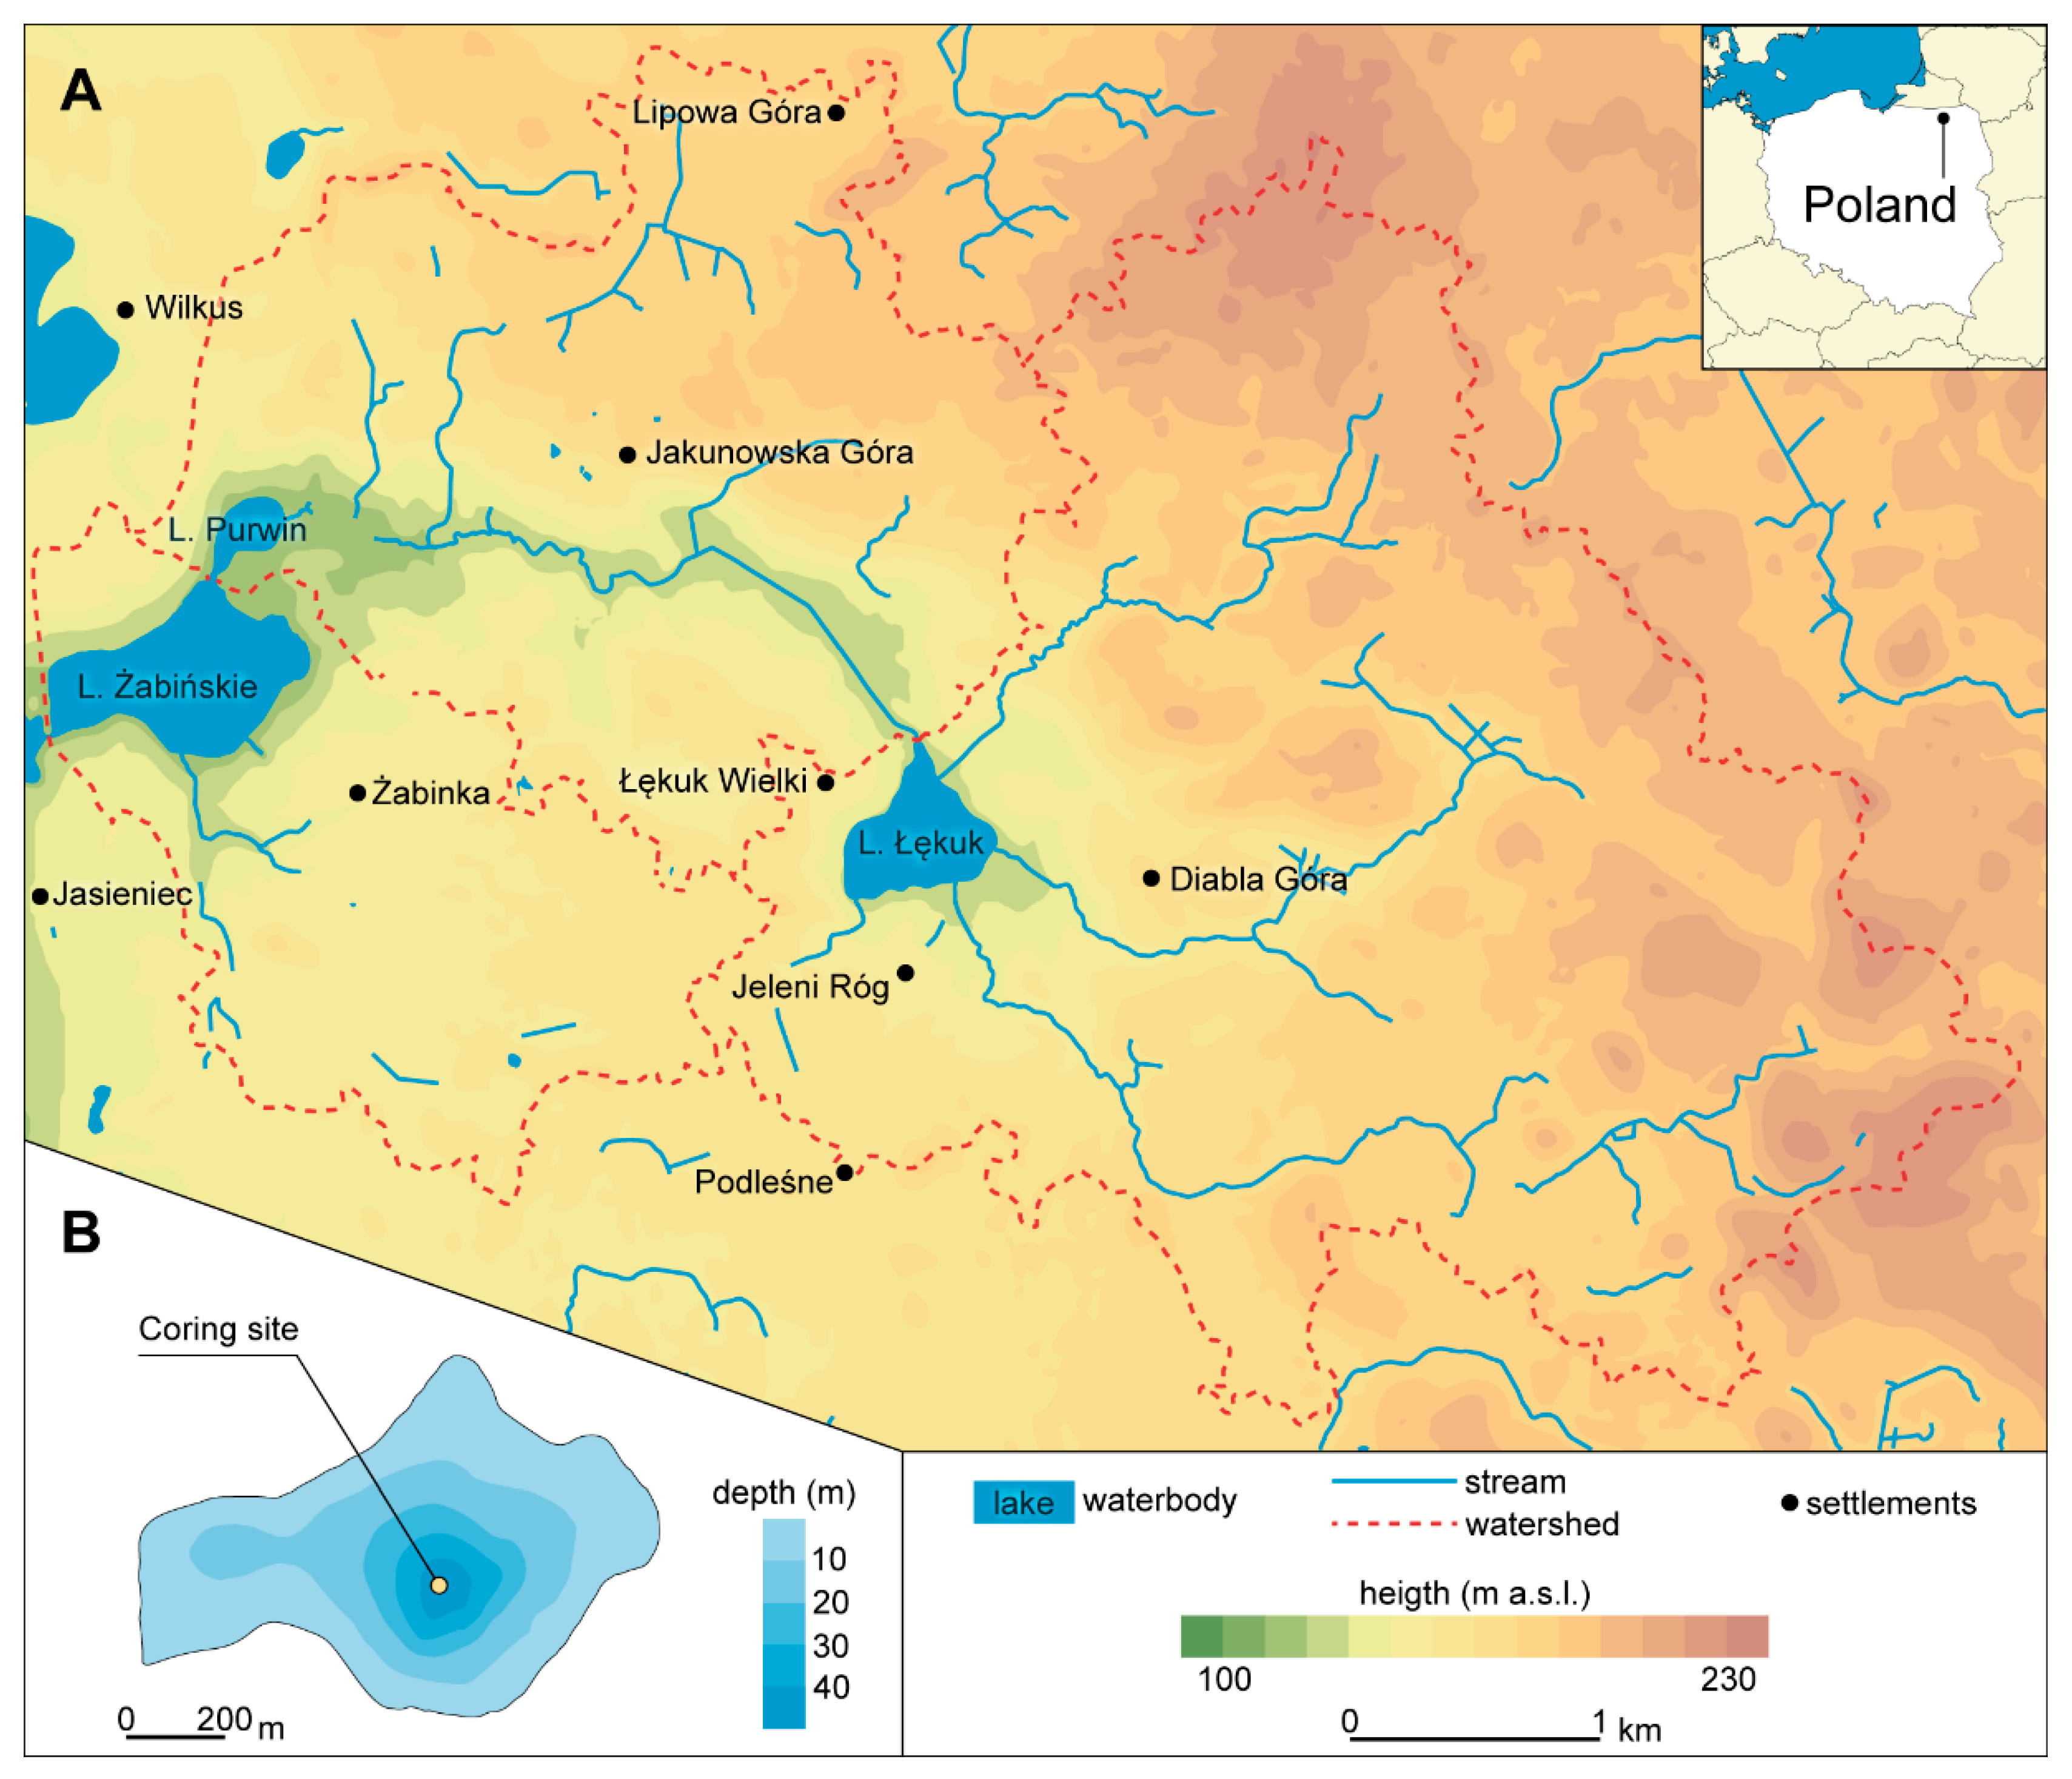
2.1. Study Area
2.2. Coring and Composite Profile
2.3. Initial Analyses
2.4. Chronology and Sedimentological Variables
2.5. Microfacies Analysis
2.6. Grain-Size Determination
2.7. Statistics
3. Results
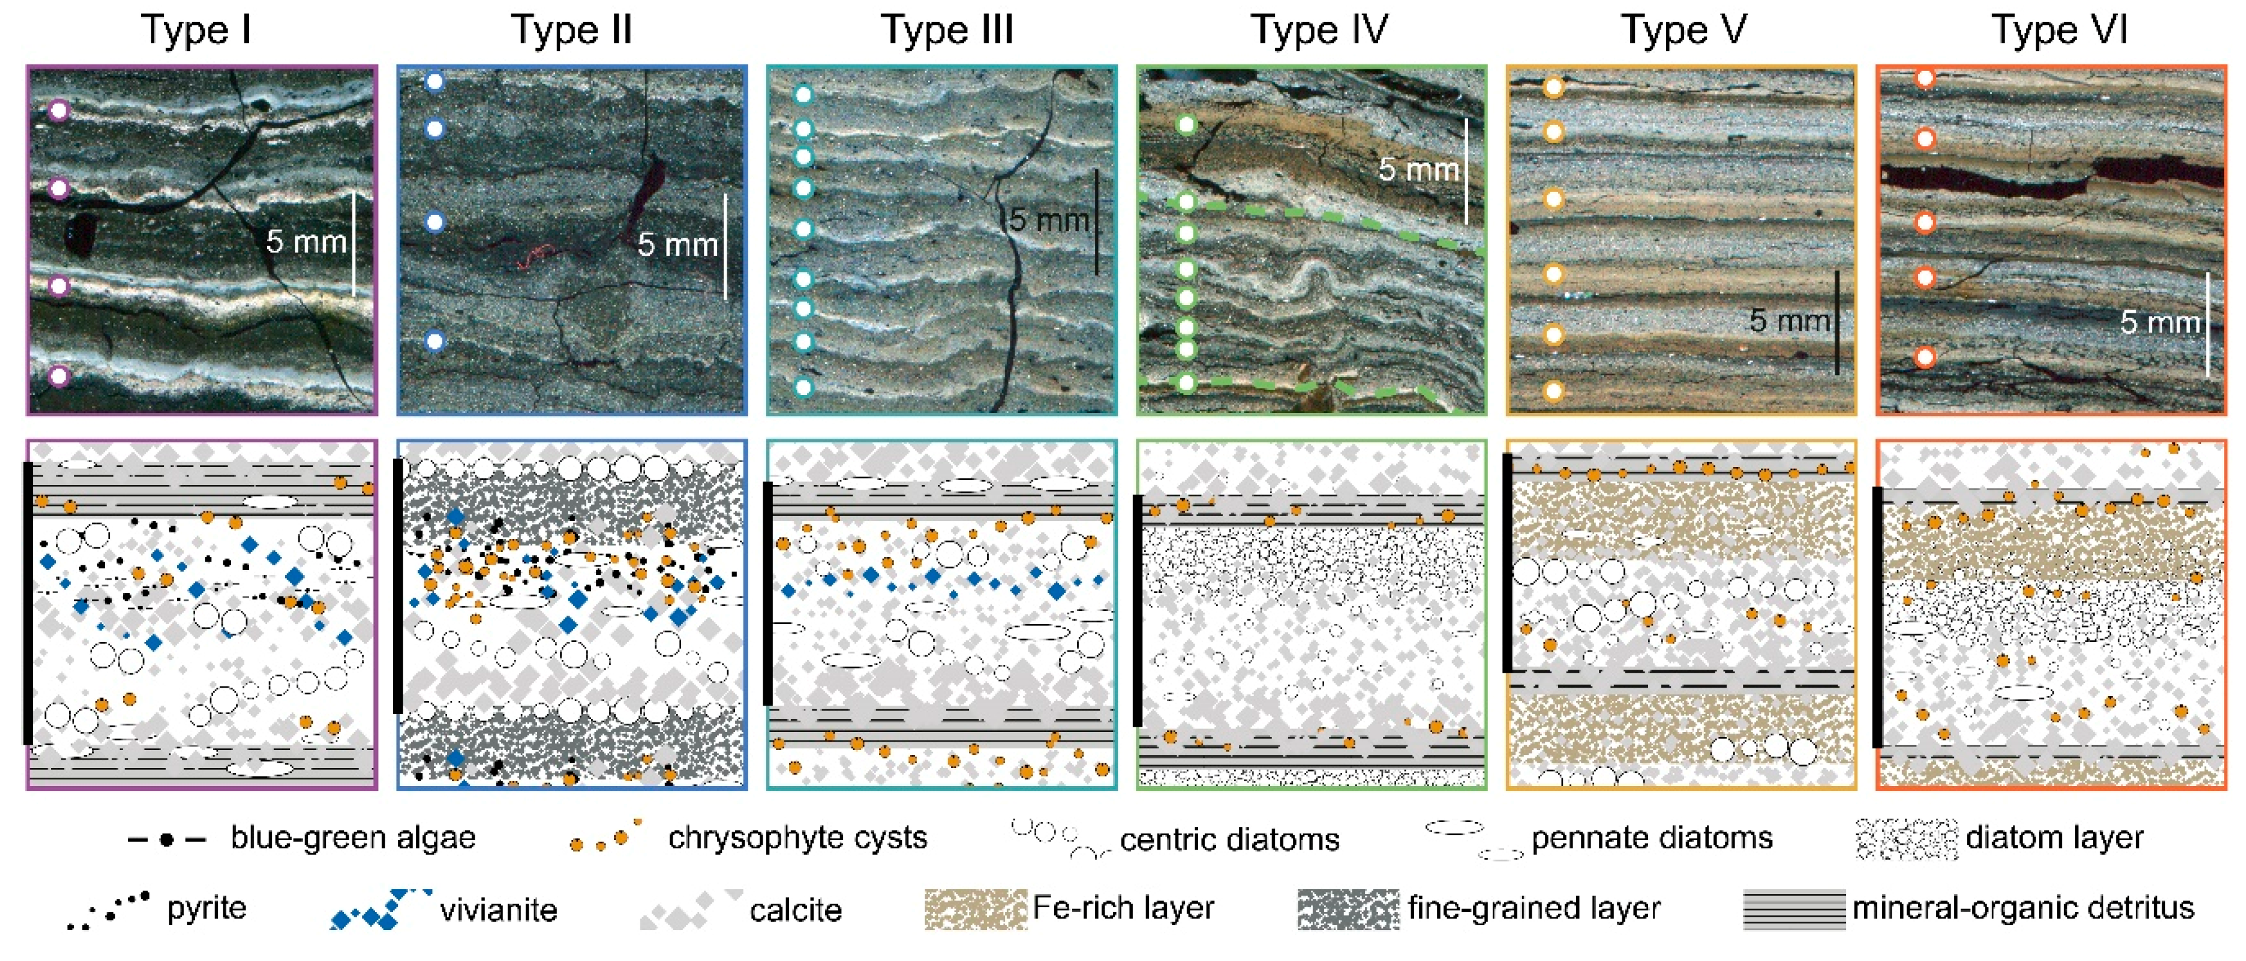
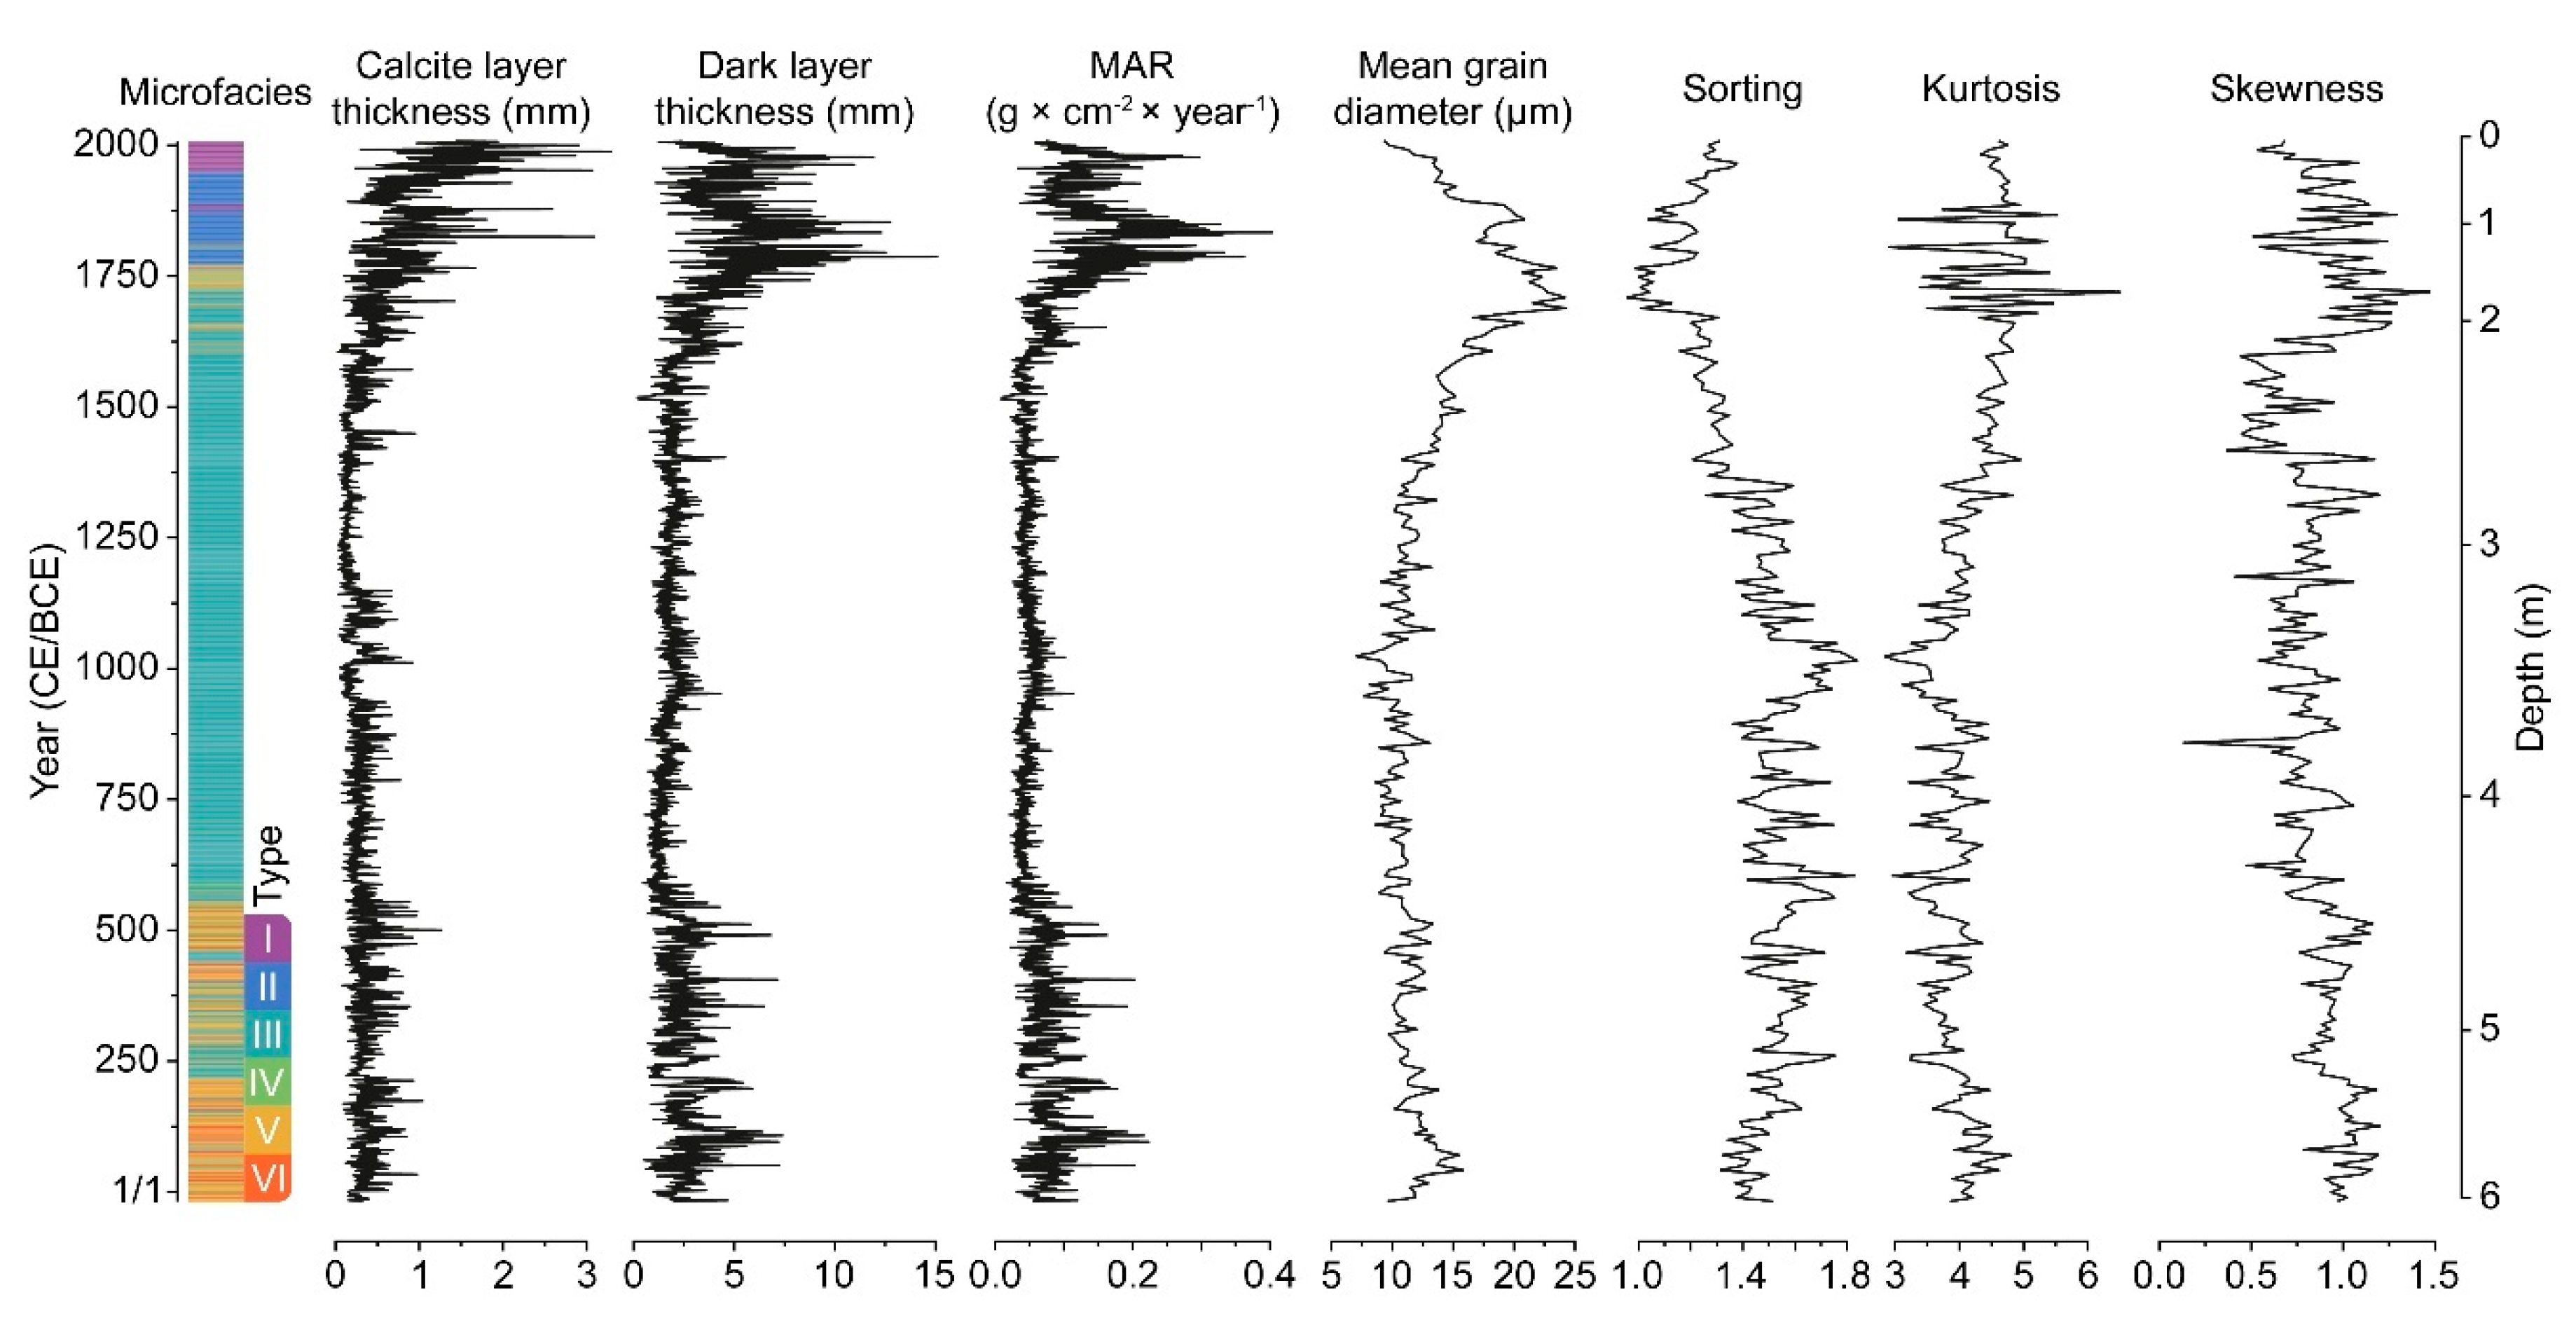
3.1. Microfacies
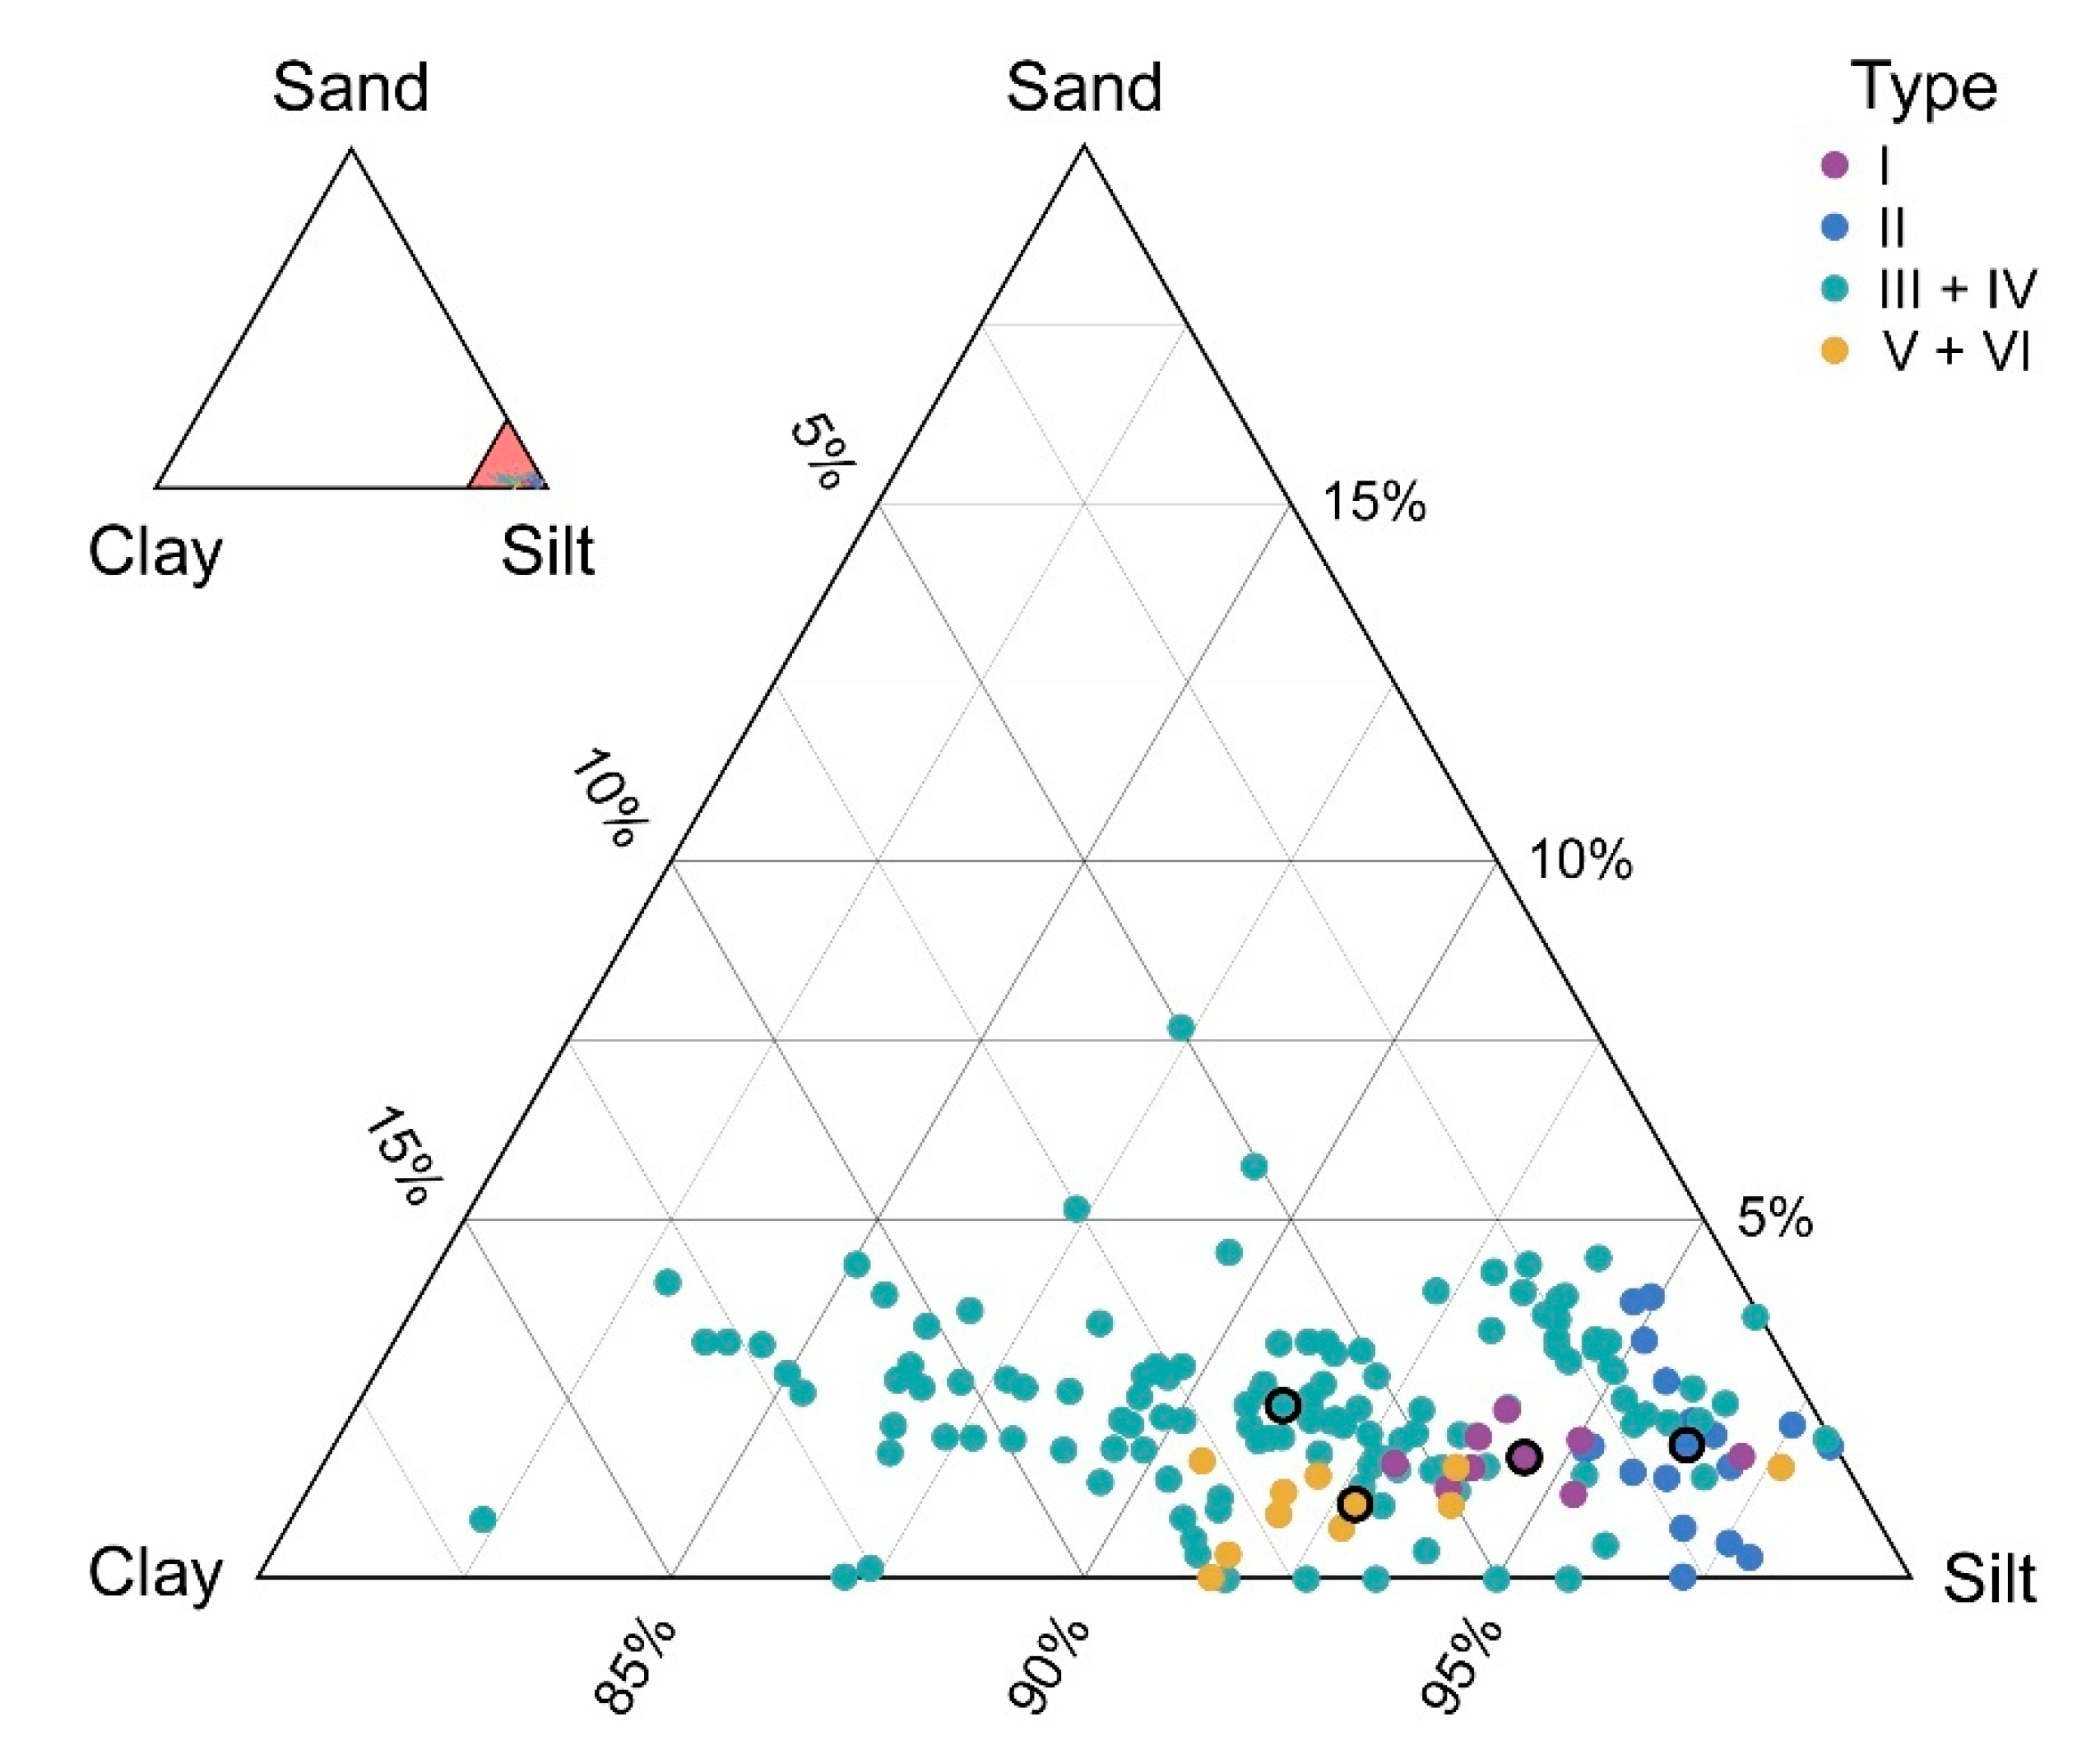
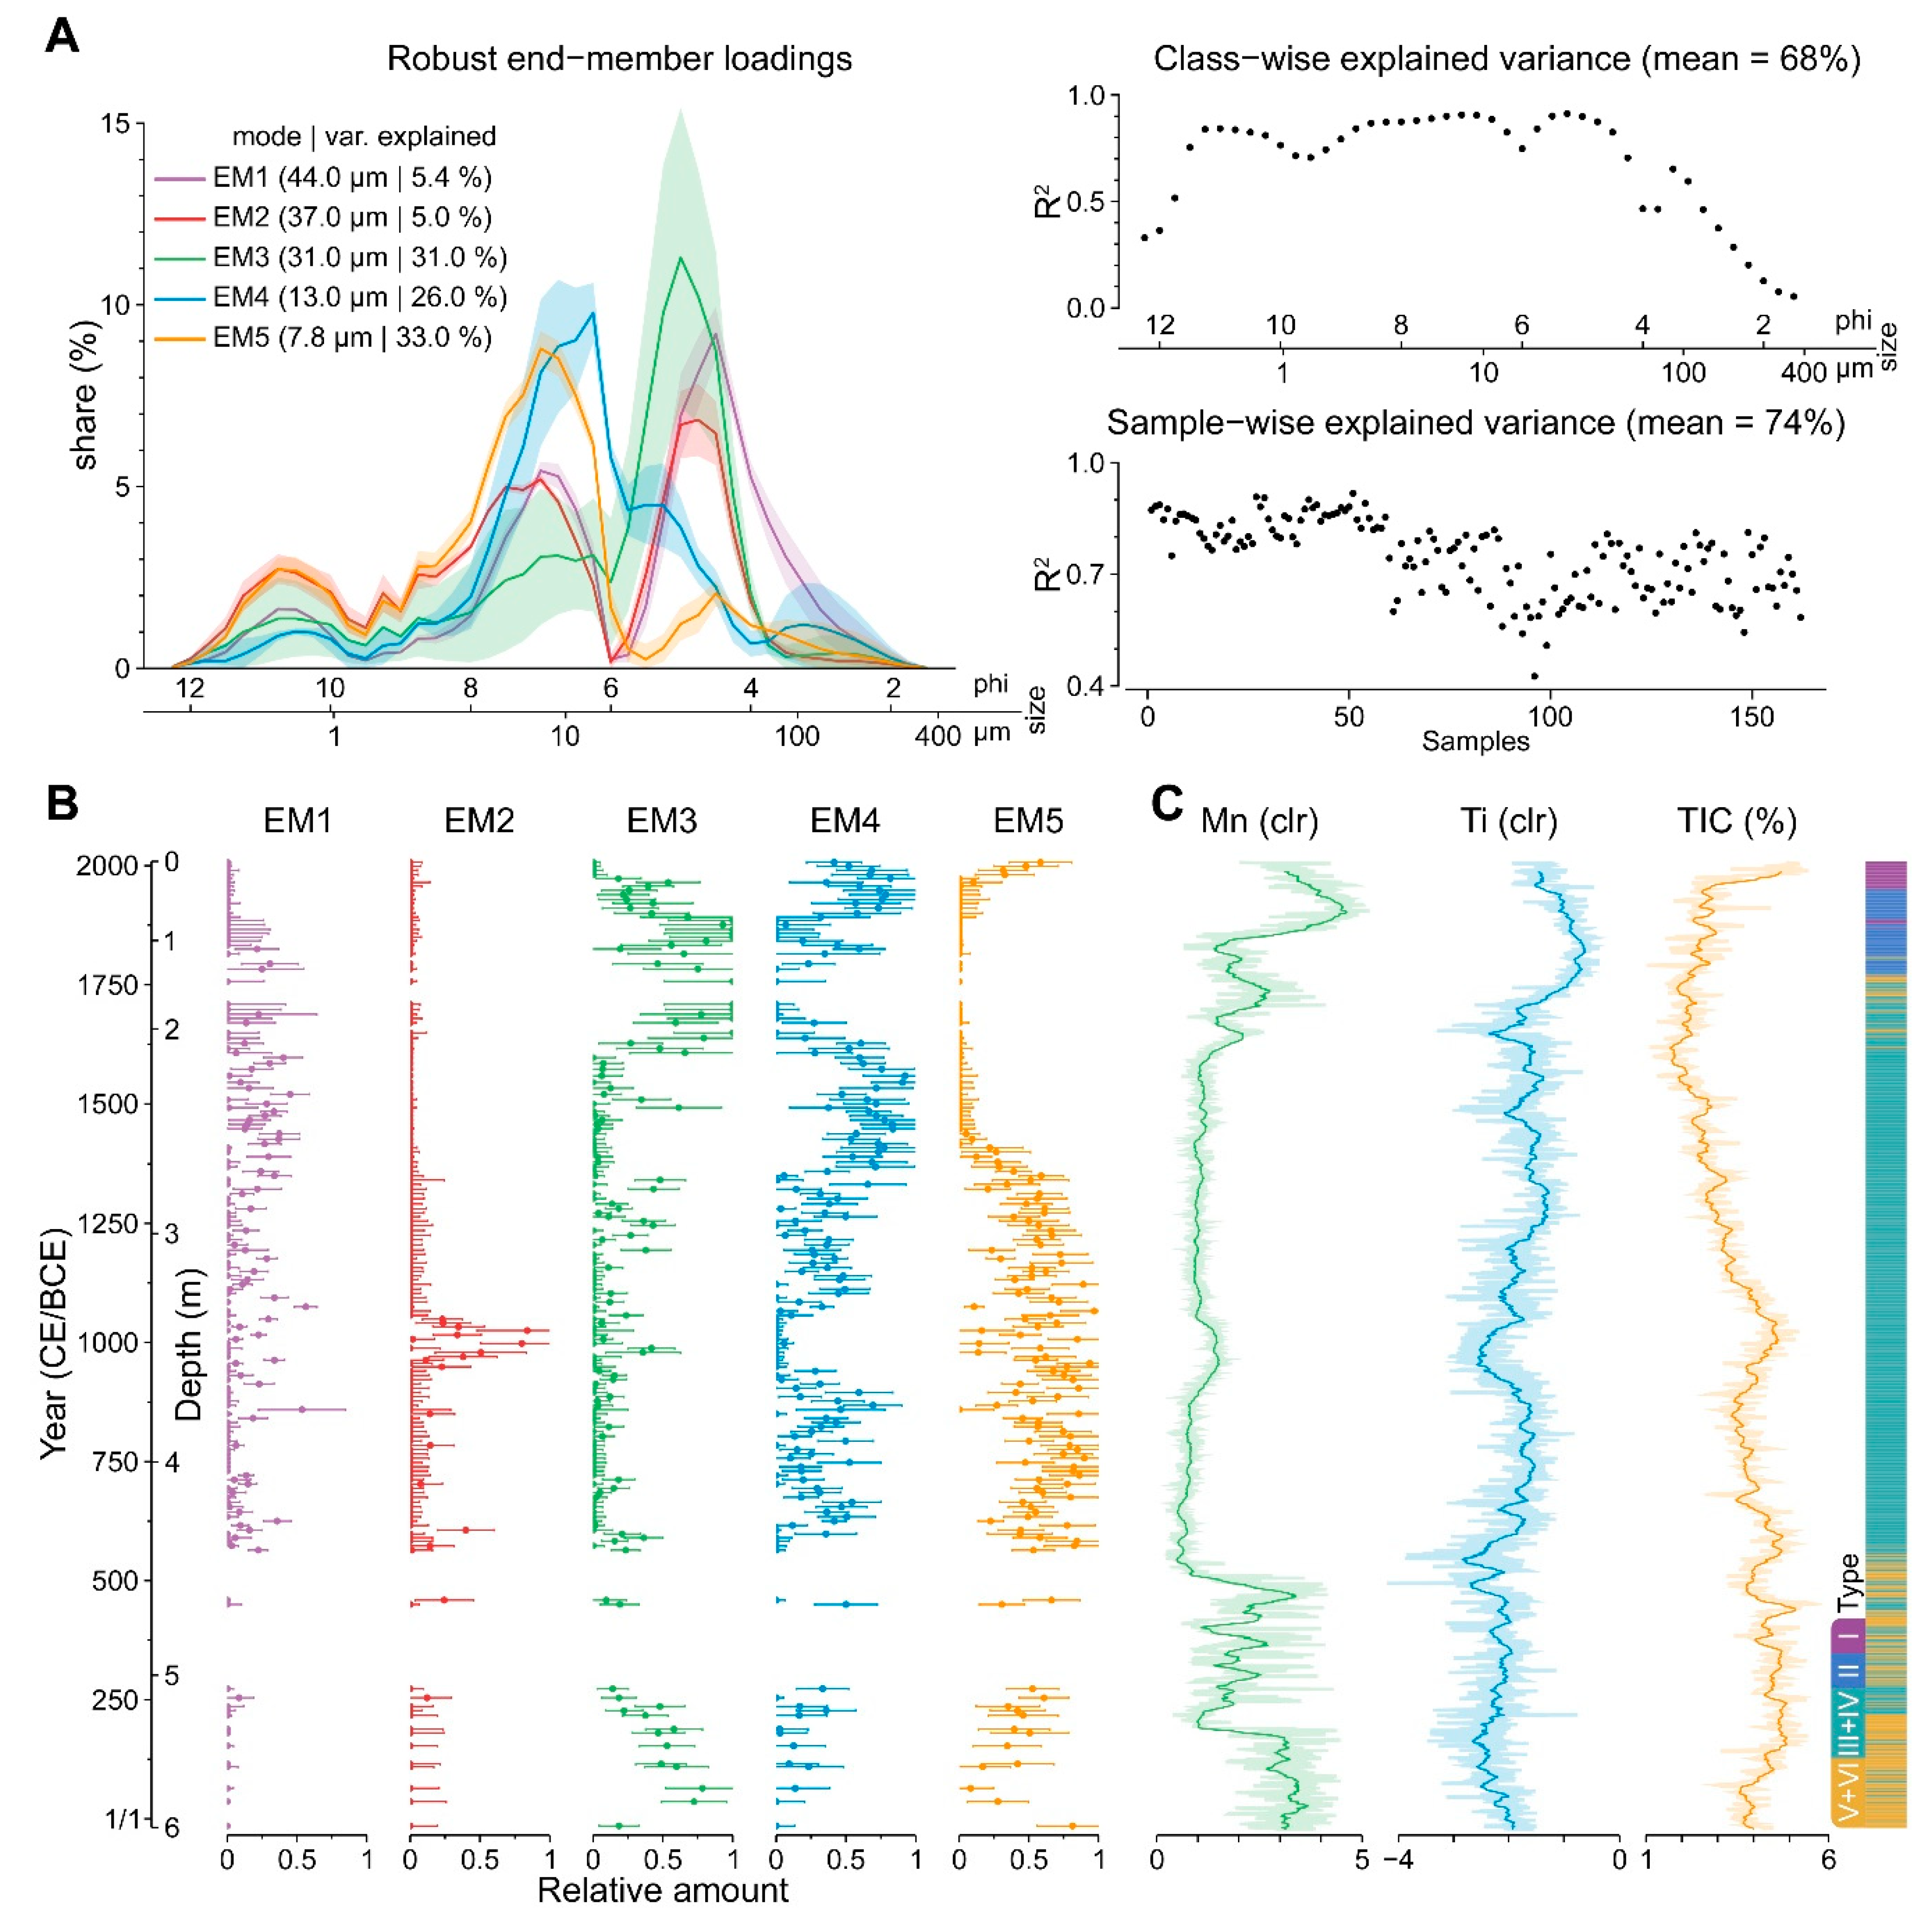
3.2. Grain-Size
3.3. Statistical Analyses
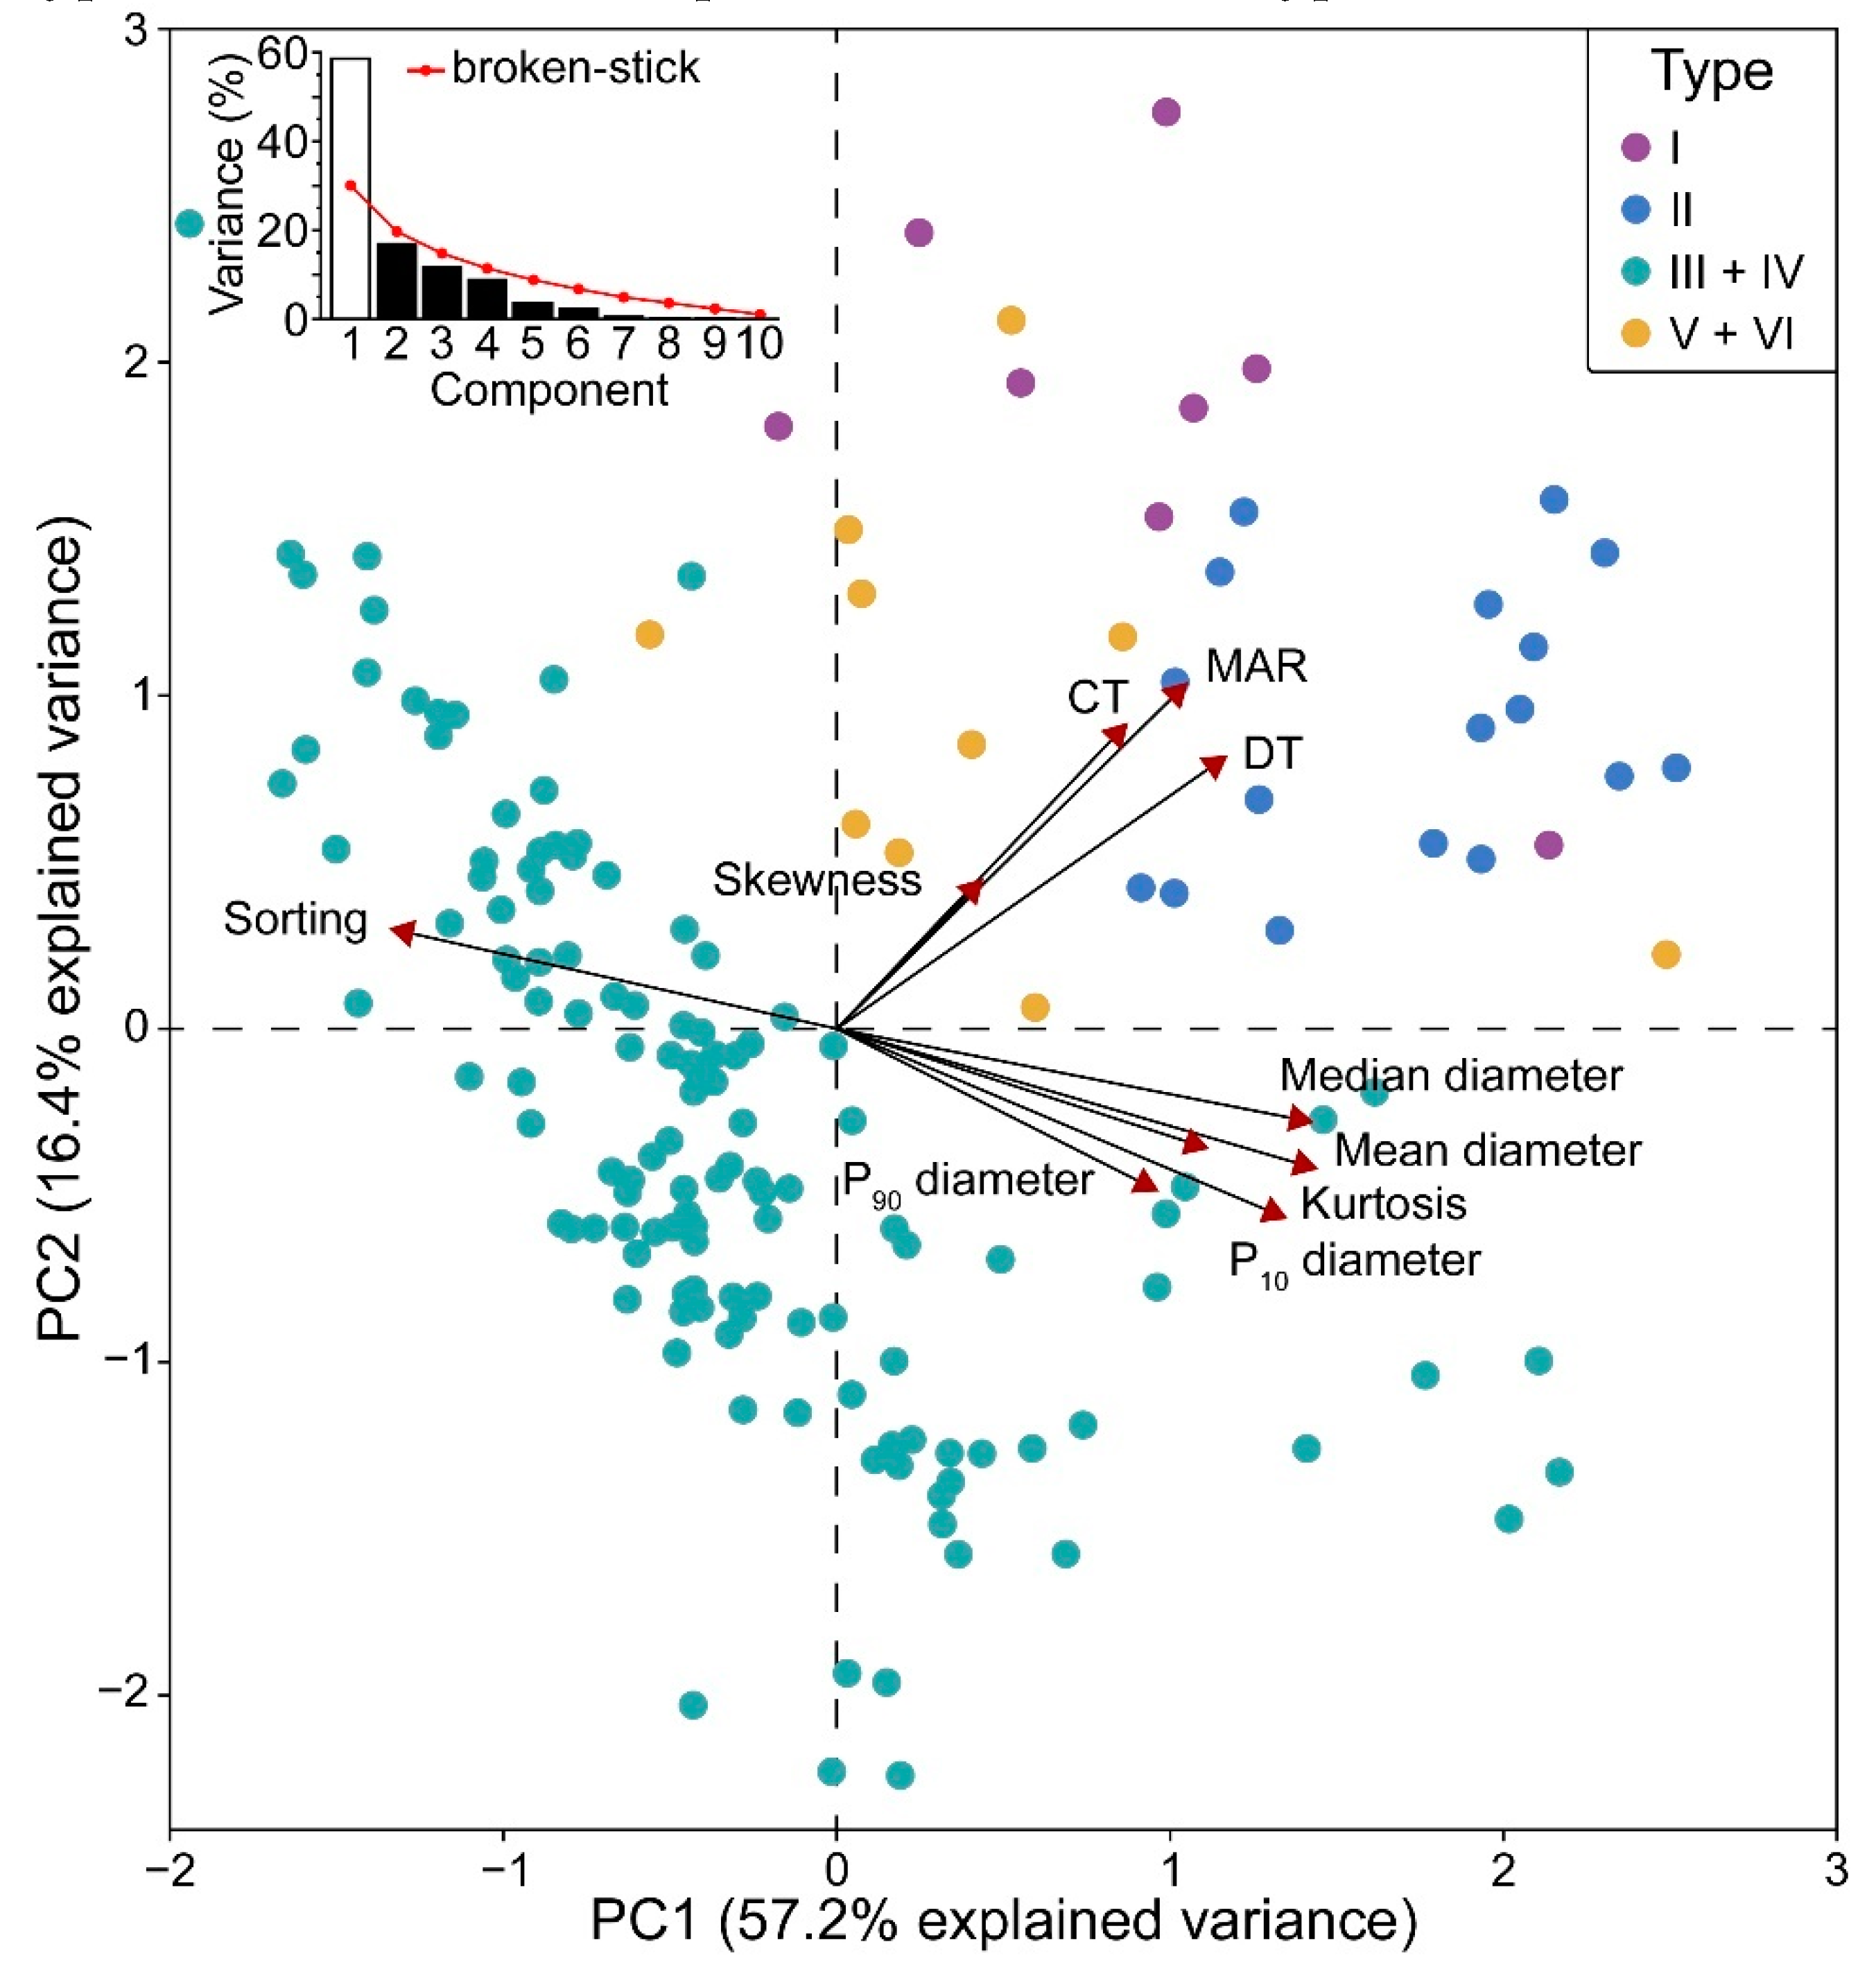
3.3.1. Principal Components Analysis
3.3.2. End-Member Analysis
4. Discussion
5. Conclusions
Supplementary Materials
Author Contributions
Funding
Acknowledgments
Conflicts of Interest
References
- Brauer, A. Annually Laminated Lake Sediments and Their Palaeoclimatic Relevance. In The Climate in Historical Times: Towards a Synthesis of Holocene Proxy Data and Climate Models; Fischer, H., Kumke, T., Lohmann, G., Flöser, G., Miller, H., von Storch, H., Negendank, J.F.W., Eds.; Springer: Berlin/Heidelberg, Germany, 2004; Volume 18, pp. 109–127. ISBN 978-3-662-10313-5. [Google Scholar]
- Zolitschka, B.; Francus, P.; Ojala, A.E.K.; Schimmelmann, A. Varves in lake sediments—A review. Quat. Sci. Rev. 2015, 117, 1–41. [Google Scholar] [CrossRef]
- Ojala, A.E.K.; Francus, P.; Zolitschka, B.; Besonen, M.; Lamoureux, S.F. Characteristics of sedimentary varve chronologies—A review. Quat. Sci. Rev. 2012, 43, 45–60. [Google Scholar] [CrossRef]
- Bonk, A.; Tylmann, W.; Amann, B.; Enters, D.; Grosjean, M. Modern limnology, sediment accumulation and varve formation processes in Lake Żabińskie, northeastern Poland: Comprehensive process studies as a key to understand the sediment record. J. Limnol. 2015, 74, 358–370. [Google Scholar] [CrossRef]
- Zolitschka, B. Varved lake sediments. In Encyclopedia of Quaternary Science; Elsevier B.V.: Amsterdam, The Netherlands, 2007; pp. 3105–3114. ISBN 978-0-444-52747-9. [Google Scholar]
- Dräger, N.; Theuerkauf, M.; Szeroczyńska, K.; Wulf, S.; Tjallingii, R.; Plessen, B.; Kienel, U.; Brauer, A. Varve microfacies and varve preservation record of climate change and human impact for the last 6000 years at Lake Tiefer See (NE Germany). Holocene 2017, 27, 450–464. [Google Scholar] [CrossRef]
- Trapote, M.C.; Vegas-Vilarrúbia, T.; López, P.; Puche, E.; Gomà, J.; Buchaca, T.; Cañellas-Boltà, N.; Safont, E.; Corella, J.P.; Rull, V. Modern sedimentary analogues and integrated monitoring to understand varve formation in the Mediterranean Lake Montcortès (Central Pyrenees, Spain). Palaeogeogr. Palaeoclimatol. Palaeoecol. 2018, 496, 292–304. [Google Scholar] [CrossRef]
- Last, W.M.; Smol, J.P. An Introduction to Physical and Geochemicalmethods Used in Paleolimnology. In Tracking Environmental Change Using Lake Sediments. Volume 2: Physical and Geochemical Methods; Last, W.M., Smol, J.P., Eds.; Kluwer Academic Publishers: Dordrecht, The Netherlands, 2001; Volume 2, pp. 1–5. ISBN 978-0-306-47670-9. [Google Scholar]
- Smol, J.P.; Birks, J.; Last, W.M. Using biology to study long-term environmental change. In Tracking Environmental Change Using Lake Sediments. Volume 3: Terrestrial, Algal, and Siliceous Indicators; Smol, J.P., Birks, H.J.B., Last, W.M., Eds.; Kluwer Academic Publishers: Dordrecht, The Netherlands, 2001; Volume 3, p. 3. [Google Scholar]
- Smol, J.P.; Birks, H.J.B.; Last, W.M. Zoological indicators in lake sediments: An introduction. In Tracking Environmental Change Using Lake Sediments. Volume 4: Zoological Indicators; Smol, J.P., Birks, H.J.B., Last, W.M., Eds.; Kluwer Academic Publishers: Dordrecht, The Netherlands, 2001; Volume 4, pp. 1–4. [Google Scholar]
- Hernández-Almeida, I.; Grosjean, M.; Gomez-Navarro, J.J.; Larocque-Tobler, I.; Bonk, A.; Enters, D.; Ustrzycka, A.; Piotrowska, N.; Przybylak, R.; Wacnik, A.; et al. Resilience, rapid transitions and regime shifts: Fingerprinting the responses of Lake Zabinskie (NE Poland) to climate variability and human disturbance since AD 1000. Holocene 2017, 27, 258–270. [Google Scholar] [CrossRef]
- Last, W.M. Textural Analysis of Lake Sediments. In Tracking Environmental Change Using Lake Sediments. Volume 2: Physical and Geochemical Methods; Last, W.M., Smol, J.P., Eds.; Kluwer Academic Publishers: Dordrecht, The Netherlands, 2001; Volume 2, pp. 41–81. ISBN 978-0-306-47670-9. [Google Scholar]
- Jin, Z.; Li, F.; Cao, J.; Wang, S.; Yu, J. Geochemistry of Daihai Lake sediments, Inner Mongolia, north China: Implications for provenance, sedimentary sorting, and catchment weathering. Geomorphology 2006, 80, 147–163. [Google Scholar] [CrossRef]
- IJmker, J.; Stauch, G.; Dietze, E.; Hartmann, K.; Diekmann, B.; Lockot, G.; Opitz, S.; Wünnemann, B.; Lehmkuhl, F. Characterisation of transport processes and sedimentary deposits by statistical end-member mixing analysis of terrestrial sediments in the Donggi Cona lake catchment, NE Tibetan Plateau. Sediment. Geol. 2012, 281, 166–179. [Google Scholar] [CrossRef]
- Schillereff, D.N.; Chiverrell, R.C.; Macdonald, N.; Hooke, J.M. Flood stratigraphies in lake sediments: A review. Earth-Sci. Rev. 2014, 135, 17–37. [Google Scholar] [CrossRef]
- Ota, Y.; Kawahata, H.; Sato, T.; Seto, K. Flooding history of Lake Nakaumi, western Japan, inferred from sediment records spanning the past 700 years. J. Quat. Sci. 2017, 32, 1063–1074. [Google Scholar] [CrossRef]
- Liu, X.; Vandenberghe, J.; An, Z.; Li, Y.; Jin, Z.; Dong, J.; Sun, Y. Grain size of Lake Qinghai sediments: Implications for riverine input and Holocene monsoon variability. Palaeogeogr. Palaeoclimatol. Palaeoecol. 2016, 449, 41–51. [Google Scholar] [CrossRef]
- Zhai, Q.; Guo, Z.; Li, Y.; Li, R. Annually laminated lake sediments and environmental changes in Bashang Plateau, North China. Palaeogeogr. Palaeoclimatol. Palaeoecol. 2006, 241, 95–102. [Google Scholar] [CrossRef]
- De Geer, G. On late Quaternary time and climate. Geol. Foereningan i Stock. Foerhandlingar 1908, 30, 459–464. [Google Scholar] [CrossRef]
- Ojala, A.E.K.; Kosonen, E.; Weckström, J.; Korkonen, S.; Korhola, A. Seasonal formation of clastic-biogenic varves: The potential for palaeoenvironmental interpretations. GFF 2013, 135, 237–247. [Google Scholar] [CrossRef]
- Haltia-Hovi, E.; Saarinen, T.; Kukkonen, M. A 2000-year record of solar forcing on varved lake sediment in eastern Finland. Quat. Sci. Rev. 2007, 26, 678–689. [Google Scholar] [CrossRef]
- Amann, B.; Lamoureux, S.F.; Boreux, M.P. Winter temperature conditions (1670–2010) reconstructed from varved sediments, western Canadian High Arctic. Quat. Sci. Rev. 2017, 172, 1–14. [Google Scholar] [CrossRef]
- Ojala, A.E.K.; Francus, P. Comparing X-ray densitometry and BSE-image analysis of thin section in varved sediments. Boreas 2002, 31, 57–64. [Google Scholar] [CrossRef]
- Ojala, A.E.K. Application of X-ray radiography and densitometry in varve analysis. In Image Analysis, Sediments and Paleoenvironments; Francus, P., Ed.; Springer: Dordrecht, The Netherlands, 2004; pp. 187–202. [Google Scholar]
- Gee, G.W.; Or, D. Particle-Size Analysis. In Methods of Soil Analysis: Part 4 Physical Methods; SSSA Book Ser. 5.4; Soil Science Society of America: Madison, WI, USA, 2002; pp. 255–293. ISBN 978-0-89118-893-3. [Google Scholar]
- Augustinus, P.; Bleakley, N.; Deng, Y.; Shane, P.; Cochran, U. Rapid change in early Holocene environments inferred from Lake Pupuke, Auckland City, New Zealand. J. Quat. Sci. 2008, 23, 435–447. [Google Scholar] [CrossRef]
- Solon, J.; Borzyszkowski, J.; Bidłasik, M.; Richling, A.; Badora, K.; Balon, J.; Brzezińska-Wójcik, T.; Chabudziński, Ł.; Dobrowolski, R.; Grzegorczyk, I.; et al. Physico-geographical mesoregions of Poland: Verification and adjustment of boundaries on the basis of contemporary spatial data. Geogr. Pol. 2018, 91, 143–170. [Google Scholar] [CrossRef]
- Marks, L.; Dzierżek, J.; Janiszewski, R.; Kaczorowski, J.; Lindner, L.; Majecka, A.; Makos, M.; Szymanek, M.; Tołoczko-Pasek, A.; Woronko, B. Quaternary stratigraphy and palaeogeography of Poland. Acta Geol. Pol. 2016, 66, 403–427. [Google Scholar] [CrossRef]
- Szumański, A. Objaśnienia do Szczegółowej Mapy Geologicznej Polski, Arkusz Giżycko (104) (Explanation to the Detailed Geological Map of Poland, Sheet Giżycko (104)); Państwowy Instytut Geologiczny: Warszawa, Poland, 2000. [Google Scholar]
- Pochocka-Szwarc, K.; Lisicki, S. Objaśnienia do Szczegółowej Mapy Geologicznej Polski, Arkusz Orłowo (105) (Explanation to the Detailed Geological Map of Poland, Sheet Orłowo (105)); Państwowy Instytut Geologiczny—Państwowy Instytut Badawczy: Warszawa, Poland, 2015; ISBN 9788378634331. [Google Scholar]
- Bonk, A.; Tylmann, W.; Goslar, T.; Wacnik, A.; Grosjean, M. Comparing Varve Counting And 14C-Ams Chronologies In The Sediments Of Lake Żabińskie, Northeastern Poland: Implications For Accurate 14C Dating Of Lake Sediments. Geochronometria 2015, 42, 159–171. [Google Scholar] [CrossRef]
- Żarczyński, M.; Tylmann, W.; Goslar, T. Multiple varve chronologies for the last 2000 years from the sediments of Lake Żabińskie (northeastern Poland)—Comparison of strategies for varve counting and uncertainty estimations. Quat. Geochronol. 2018, 47, 107–119. [Google Scholar] [CrossRef]
- Tylmann, W.; Bonk, A.; Goslar, T.; Wulf, S.; Grosjean, M. Calibrating 210Pb dating results with varve chronology and independent chronostratigraphic markers: Problems and implications. Quat. Geochronol. 2016, 32, 1–10. [Google Scholar] [CrossRef]
- Blott, S.J.; Pye, K. GRADISTAT: A grain size distribution and statistics package for the analysis of unconsolidated sediments. Earth Surf. Process. Landf. 2001, 1248, 1237–1248. [Google Scholar] [CrossRef]
- Hamilton, N. ggtern: An Extension to “ggplot2”, for the Creation of Ternary Diagrams 2018. Available online: https://cran.r-project.org/package=ggtern (accessed on 1 November 2018).
- R Core Team. R: A Language and Environment for Statistical Computing; R Core Team: Vienna, Austria, 2018. [Google Scholar]
- Dietze, E.; Maussion, F.; Ahlborn, M.; Diekmann, B.; Hartmann, K.; Henkel, K.; Kasper, T.; Lockot, G.; Opitz, S.; Haberzettl, T. Sediment transport processes across the Tibetan Plateau inferred from robust grain-size end members in lake sediments. Clim. Past 2014, 10, 91–106. [Google Scholar] [CrossRef]
- Dietze, M.; Dietze, E. EMMAgeo: End-Member Modelling of Grain-Size Data 2016. Available online: https://github.com/coffeemuggler/EMMAgeo (accessed on 1 November 2018).
- Żarczyński, M.; Wacnik, A.; Tylmann, W. Tracing lake mixing and oxygenation regime using the Fe/Mn ratio in varved sediments: 2000 year-long record of human-induced changes from Lake Żabińskie (NE Poland). Sci. Total Environ. 2019, 657, 585–596. [Google Scholar] [CrossRef] [PubMed]
- Bonk, A.; Kinder, M.; Enters, D.; Grosjean, M.; Meyer-Jacob, C.; Tylmann, W. Sedimentological and geochemical responses of Lake Żabińskie (north-eastern Poland) to erosion changes during the last millennium. J. Paleolimnol. 2016, 56, 239–252. [Google Scholar] [CrossRef]
- Czymzik, M.; Dulski, P.; Plessen, B.; Von Grafenstein, U.; Naumann, R.; Brauer, A. A 450 year record of spring-summer flood layers in annually laminated sediments from Lake Ammersee (southern Germany). Water Resour. Res. 2010, 46, 1–16. [Google Scholar] [CrossRef]
- Sly, P.G.; Thomas, R.L.; Pelletier, B.R. Interpretation of moment measures derived from water-lain sediments. Sedimentology 1983, 30, 219–233. [Google Scholar] [CrossRef]
- Szmańda, J.B. Main determinants of the grain size distribution of overbank deposits in Poland—An overview of literature on models of sedimentation. Geol. Q. 2018, 62, 873–880. [Google Scholar] [CrossRef]
- Håkanson, L. The influence of wind, fetch, and water depth on the distribution of sediments in Lake Vänern, Sweden. Can. J. Earth Sci. 1977, 14, 397–412. [Google Scholar] [CrossRef]
- McLaren, P. An Interpretation of Trends in Grain Size Measures. J. Sediment. Res. 1981, 51, 629–714. [Google Scholar] [CrossRef]
- Amann, B.; Lobsiger, S.; Tylmann, W.; Filipiak, J.; Grosjean, M. Spring temperature variability and eutrophication history inferred from sedimentary pigments in the varved sediments of Lake Zabinskie, northeast Poland, 1907-2008 AD. Glob. Planet. Chang. 2014, 123, 86–96. [Google Scholar] [CrossRef]
- Dean, W.E.; Megard, R.O. Environment of deposition of CaCO3 in Elk Lake, Minnesota. In Elk Lake, Minnesota: Evidence for Rapid Climate Change in the North-Central United States; Bradbury, J.P., Dean, W.E., Eds.; Geological Society of America: Boulder, CO, USA, 1993; pp. 97–114. [Google Scholar]
- Bayley, G.V.; Hammersley, J.M. The “Effective” Number of Independent Observations in an Autocorrelated Time Series. Suppl. J. R. Stat. Soc. 1946, 8, 184. [Google Scholar] [CrossRef]
- Weltje, G.J.; Prins, M.A. Muddled or mixed? Inferring palaeoclimate from size distributions of deep-sea clastics. Sediment. Geol. 2003, 162, 39–62. [Google Scholar] [CrossRef]
- van Hateren, J.A.; Prins, M.A.; van Balen, R.T. On the genetically meaningful decomposition of grain-size distributions: A comparison of different end-member modelling algorithms. Sediment. Geol. 2018, 375, 49–71. [Google Scholar] [CrossRef]
- Leng, M.J.; Jones, M.D.; Frogley, M.R.; Eastwood, W.J.; Kendrick, C.P.; Roberts, C.N. Detrital carbonate influences on bulk oxygen and carbon isotope composition of lacustrine sediments from the Mediterranean. Glob. Planet. Chang. 2010, 71, 175–182. [Google Scholar] [CrossRef]
- Filipek, L.H.; Owen, R.M. Geochemical associations and grain-size partitioning of heavy metals in lacustrine sediments. Chem. Geol. 1979, 26, 105–117. [Google Scholar] [CrossRef]
- Horowitz, A.J.; Elrick, K.A. The relation of stream sediment surface area, grain size and composition to trace element chemistry. Appl. Geochem. 1987, 2, 437–451. [Google Scholar] [CrossRef]


© 2019 by the authors. Licensee MDPI, Basel, Switzerland. This article is an open access article distributed under the terms and conditions of the Creative Commons Attribution (CC BY) license (http://creativecommons.org/licenses/by/4.0/).
Share and Cite
Żarczyński, M.; Szmańda, J.; Tylmann, W. Grain-Size Distribution and Structural Characteristics of Varved Sediments from Lake Żabińskie (Northeastern Poland). Quaternary 2019, 2, 8. https://doi.org/10.3390/quat2010008
Żarczyński M, Szmańda J, Tylmann W. Grain-Size Distribution and Structural Characteristics of Varved Sediments from Lake Żabińskie (Northeastern Poland). Quaternary. 2019; 2(1):8. https://doi.org/10.3390/quat2010008
Chicago/Turabian StyleŻarczyński, Maurycy, Jacek Szmańda, and Wojciech Tylmann. 2019. "Grain-Size Distribution and Structural Characteristics of Varved Sediments from Lake Żabińskie (Northeastern Poland)" Quaternary 2, no. 1: 8. https://doi.org/10.3390/quat2010008
APA StyleŻarczyński, M., Szmańda, J., & Tylmann, W. (2019). Grain-Size Distribution and Structural Characteristics of Varved Sediments from Lake Żabińskie (Northeastern Poland). Quaternary, 2(1), 8. https://doi.org/10.3390/quat2010008