Abstract
Goethite, a ubiquitous Fe(III) oxyhydroxide mineral, typically occurs in very small particle sizes whose interfacial properties critically influence the fate and transport of ionic species in natural systems. The surface site density of synthetic goethite increases with particle size, resulting in enhanced adsorption capacity per unit area. In the first two parts of this study, we modeled the adsorption of protons, nitrate, As(V), Pb(II), Zn(II), and phosphate on goethite as a function of particle size, adsorbate concentration, pH, and ionic strength, using unified parameters within the CD-MUSIC framework. Here, we extend this work to characterize the interfacial behavior of carbonate in goethite suspensions, using a comprehensive dataset generated previously under both closed and open CO2 system conditions. Carbonate oxyanions, prevalent in geochemical environments, exhibit competitive and complexation interactions with other ions and mineral surfaces. Although a bidentate bridging surface carbonate complex has been successful in previous modeling efforts on goethite, we found that the size of the carbonate moiety is too small and would require extreme octahedron bending of the goethite’s singly coordinated sites to accommodate this type of binding. Here, we propose a novel complex configuration that considers structural, physicochemical, and spectroscopic evidence. Optimal unified affinity constants and charge distribution parameters for this complex simulated all experimental data successfully, providing further validation of the CD-MUSIC model for describing relevant goethite/aqueous interfacial reactions.
1. Introduction
Goethite (α-FeOOH), a thermodynamically stable Fe(III) oxyhydroxide, is an abundant mineral in the Earth’s critical zone. It is found in very small particle sizes, which makes it a highly influential player in the adsorption of nutrient and contaminant ions and, thus, in their fate and transport in geochemical environments [1].
Carbon dioxide and its carbonate dissolution products are ubiquitous components of aqueous environments, affecting the reactivity of ionic species through complexing and competitive reactions. Among these, their binding to mineral surfaces affects the adsorption behavior of other anions, as well as that of cations; therefore, it is of wide interest to determine the carbonate adsorption behavior and surface affinity parameters in relevant minerals, especially of goethite [2,3,4].
In this work, we report the surface complexation modeling results of a previously generated extensive dataset for carbonate adsorption onto goethite [2] under closed and open CO2 systems, spanning a wide range of conditions in total carbonate concentrations, pH, and ionic strength. We used the Charge-Distribution MultiSite Ion Complexation model (CD-MUSIC) [5] to unify adsorption parameters for goethite, following two previous articles published in this series [6,7].
Synthetic goethite particles were previously reported to have acicular morphologies that expose various crystal faces [1], the most prevalent being {101}, {100}, and {210} (Pnma space group). More recently, using a suite of electron microscopies [5,8,9] and tomography [8], it was found that face {100} is negligible or absent, resulting in a lath morphology. The other two faces have been typically considered for surface complexation modeling of goethite using CD-MUSIC. As the specific surface areas (SSAs) of goethite particles decrease below ca 82 m2/g, they show progressively higher adsorption capacities per surface area due to increasing reactive surface site densities [6], which, in turn, is due to a progressive increase in the total proportion of crystal face {210} over {101} (in the form of alternating steps on the {101} face [8,9]) because {210} has more than twice the surface density of singly coordinated (SC) sites than {101} (7.5 sites/nm2 vs. 3.03 sites/nm2). We have previously carefully characterized the surfaces of four different goethites in the range of 42–94 m2/g through high-resolution electron microscopy techniques to accurately determine the total crystal face contributions of each goethite [8,9].
With the above information, we then calculated, for the same four goethites in the first part of this series [6], the total reactive surface site densities, i.e., of SC and triply coordinated (TC) >O(H) sites bound to central Fe(III) species in the structural octahedral arrangements of the exposed goethite faces. With this information, we were able to better constrain parameter optimization in the CD-MUSIC model by fixing the above site densities for each goethite. This allowed us to determine the acidity constants of the two proton-reactive surface groups of goethite as log K formation of 8.82 for sites and 9.65 for sites [6].
There is controversy in the literature regarding whether carbonate adsorbs onto goethite as a monodentate or as a bidentate complex. Previous work using the Triple-Layer Model has shown successful simulations of the same adsorption dataset we used in the present work by defining a monodentate non-protonated complex [3], but a small contribution of a protonated complex was required. In a later work using the Basic Stern CD-MUSIC model, a bidentate non-protonated complex yielded the best simulations [4]. Several arguments were employed to arrive at the latter conclusion, but the most important one lies in the similarity between the optimized charge distribution parameters and the expected theoretical values based on Pauling bond strengths and valence considerations, which point to the carbonate moiety directing two of its oxygen atoms to the surface. Therefore, a bidentate (bridging) complex on two SC sites was found to describe the data quite well [4].
In the present work, we revisit this surface complexation modeling procedure of carbonate adsorption onto goethite, considering the CD-MUSIC model and in light of our recent developments regarding the unification of the goethite parameters. So far, these have been particularly successful for describing the adsorption of the oxyanions arsenate and phosphate. We explored different possible surface carbonate complex configurations, including two simultaneous ones, taking into account the size of the carbonate moiety and the interatomic site distances, to describe the experimental data and report the optimal configuration, affinity constant, and charge distribution (CD) parameters.
2. Materials and Methods
2.1. Carbonate Adsorption Data
An extensive adsorption dataset previously generated with a carefully designed apparatus was used [2,3,10]. Most data were collected on a goethite reported to have 70 m2/g, as determined by nitrogen adsorption BET, and ionic strengths of 0.01 M and 0.1 M imposed by NaCl. The conditions for the latter were as follows: Closed systems with total volumes of 800 mL divided between gaseous (Vg) and aqueous (Vl) phases in ranges of Vg/Vl from 0.67 to 1.30, along with total investigated CO2 concentrations of ca. 63, 90, and 133 μM; open systems with 237, 400, and 5520 μatm CO2, one system with 327 μatm CO2 in NaNO3 electrolyte, and, finally, one system with 400 μatm CO2 in 0.1 NaNO3 electrolyte on a 94 m2/g goethite [10]. The pH ranges investigated were from 3 to 7.3–7.9 for closed systems and from 3.2 or 4 to 7.8 or 8.8 for open systems, except for the 94 m2/g goethite, for which the pH range was 4 to 8.5 [10].
2.2. Goethite Site Densities for CD-MUSIC Modeling
The SC reactive surface sites show different arrangements on each goethite crystal face. However, in the MUSIC model, we have approximated equal behavior for all SC sites, independently of the crystal face where they are found, and computed their total site density (cf. sum of SC site densities for the two crystal faces in Table 1) to simplify an already highly complex model [6]. The surface proton charge modeling showed excellent results and indicates that, along the whole pH range, SC sites, which are considered the most reactive towards ions, show a wide range of significant surface density of both positively and negatively charged proton sites, although the net proton charge for these sites is negative from pH values of ca. 4, depending on the ionic strength. Further model results have provided successful unified parameters that additionally describe the affinity for Pb(II), Zn(II), As(V), and phosphate on the same four goethites previously characterized [6,7].

Table 1.
Crystal face contributions and SC and TC site densities for reactive surface sites a.
2.3. Goethite Surface Protonation Behavior and CD-MUSIC Modeling in NaCl
The protonation parameters are required before modeling any other ion adsorption behavior, but all previous unified work [6,7] had been performed with NaNO3 as the background electrolyte and with goethites of 42, 53, 76, and >82 m2/g (cf. CD-MUSIC model parameters in Table 2).
Table 2.
Goethite surface protonation reactions and unified (optimized) parameters using the CD-MUSIC model a.
In the carbonate adsorption experimental work [2], the acid–base titrations were performed at three different ionic strengths (0.01 M, 0.05 M, and 0.1 M), both in NaCl and in NaNO3, on a 70 m2/g goethite. Therefore, we initially had two unknown variables: the corresponding site density and capacitance parameters for the latter goethite and the affinity constants for Cl− towards goethite SC and TC positively charged sites. However, we realized that the acid–base titration (proton adsorption) data in NaNO3 for this goethite [2] were relatively close to those of our well-characterized 76 m2/g goethite in NaNO3 [6]. We then corrected the 70 m2/g adsorption data from [2] to 76 m2/g and obtained identical results to our data [6] for the 76 m2/g goethite (cf. Figure 1a).
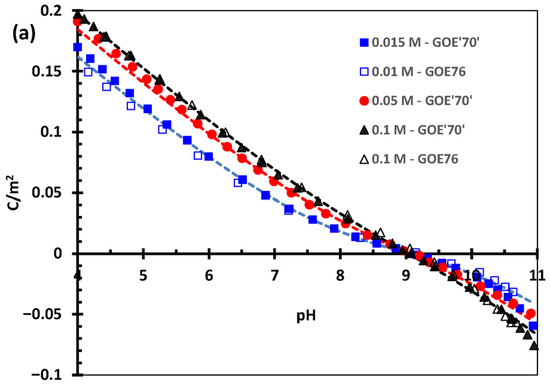
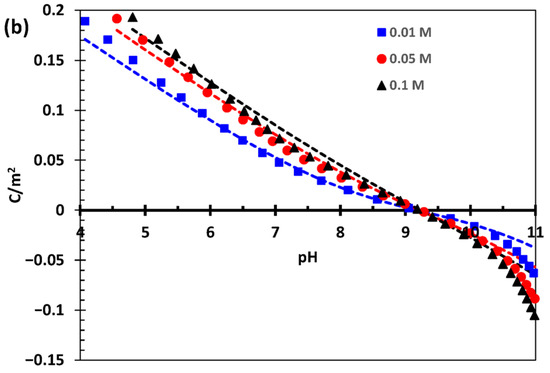
Figure 1.
Surface proton charging curves as a function of pH and three ionic strengths (see legends) (a) in NaNO3 (goethite: 76 m2/g [6] and a preparation previously reported as 70 m2/g [2] but corrected to 76 m2/g) and (b) in NaCl (for goethite previously reported [2] as 70 m2/g but corrected to 76 m2/g). Symbols represent the experimental data, and lines indicate optimized simulations using the CD-MUSIC model parameters reported in Table 2.
With this and our previous modeling of the 76 m2/g [6], we obtained an excellent description of the proton charging behavior of the goethite previously labelled as 70 m2/g in NaNO3. This gave us confidence to optimize the proton charging data with NaCl using the model parameters optimized previously (cf. Table 2), given that most carbonate adsorption data were obtained using the latter electrolyte. The only parameters that needed optimization were thus the Cl− binding constants, while all remaining parameters were maintained constant, including the site densities and capacitance values for the 76 m2/g and the 94 m2/g goethites (cf. Table 1 and Table 2).
2.4. General Modeling Using CD-MUSIC
The three-plane formalism of the CD-MUSIC surface complexation model [5] with an extended Stern model was used to simulate the carbonate adsorption data and obtain the optimal binding parameters for the stoichiometries of the surface complexes tested. The ECOSAT and FIT program codes were used, and the system was fed with the fixed site densities listed in Table 1 and other parameters listed in Table 2 for goethites of 76 and 94 m2/g.
2.5. Configuration of the Adsorbed Carbonate Complex
Both monodentate and bidentate non-protonated surface carbonate complexes were tested initially, all on SC sites of both crystal faces. The protonated versions performed poorly in simulating the experimental data, as did the combinations of one protonated and the other non-protonated complex, and vice versa. As was found earlier [4], both monodentate and bidentate complexes alone yielded acceptable simulations with low global errors; however, the monodentate complex was always accompanied by a large proportion of the negative carbonate charge distributed towards the 0-plane in comparison with the 1-plane. This is physicochemically unrealistic given that in a monodentate complex, only one of the carbonate oxygens is bound to the surface, and thus, the remaining two are set to occupy the 1-plane, contributing ideally 2/3 of the −2 charge of carbonate to the latter plane. Similar results have been reported before for the same carbonate adsorption dataset [4], and a very detailed quantitative explanation has been provided using Pauling bond strength and valence analysis. It shows conclusive evidence of how the charge distribution parameter with two oxygens placed on the 0-plane defines the adequate modeling of carbonate adsorption to goethite [4]; in fact, whatever the configuration of the complex used (protons included), the optimization procedure always pointed to a higher negative charge brought about by the carbonate anion to the 0-plane. Therefore, the optimal complex configuration would seem to be a bidentate complex on adjacent (bridging) SC sites, and only one complex is necessary to describe the whole set of experimental data available.
Nevertheless, there are some complicating factors when proposing this bidentate binuclear complex, which will be presented in the following sub-sections:
2.5.1. Structural and Spatial Evidence
Carbonate is a relatively small oxyanion that shows a planar trigonal structure between the C atom and the three oxygens, with O-O interatomic distances of 2.22–2.23 Å, which are highly constant in crystalline solids and aqueous ions [11,12]. On the other hand, the O-O interatomic distances from adjacent SC surface sites on goethite faces {101} and {210} are 3.02 Å (cf. Figure 2a), and 2.90, 2.96 Å, respectively [13], if no bond relaxation occurred. In order to fit a bidentate bridged (binuclear) carbonate complex between two adjacent SC > O sites, a very large stretch of the involved oxygens would have to occur, i.e., 0.7–0.8 Å. These values seem too large to justify a possible relaxation of bonds because the tension created by the bent octahedra would be high. In fact, given the C-O bond average distances of 1.28 Å, if the angle of the trigonal anion stretched to yield a maximum of 180° (i.e., making an O-C-O straight line), the interatomic distance would become only 2.56 Å (= 2 × 1.28 Å); therefore, it is physically impossible for carbonate to form a bidentate carbonate on adjacent SC sites of either crystal faces without large bond relaxation between the latter.

Figure 2.
Goethite crystal face {101} (only the top-most structural octahedral layer is shown) rotated in different directions to show more clearly (a) the O-O interatomic distances for adjacent SC sites (3.02 Å) and from SC sites adjacent to reactive TC sites (2.83 Å), as well as (b) the configuration of the carbonate complex proposed bound to a SC site and an adjacent positively charged TC OH site. The O-O interatomic distances for carbonate are 2.22 Å on average. The blue circles denote protons that confer a net positive charge to the vast majority of these sites across the pH range studied (Figure 3b). The structures were cut from a multiplied goethite unit cell [13] using the VESTA 3 software [14].


Figure 3.
Surface protonation simulations using the CD-MUSIC model for GOE94 in 0.01 mol/L NaNO3 (from data reported by [6]); proton charge components separating total negatively and positively proton-charged sites; and the net proton charge for (a) singly coordinated (SC) sites, also showing the total proton charge (which includes triply coordinated (TC) sites), and (b) the individual triply coordinated (TC) sites. For (a), the components shown include the corresponding electrolyte-binding complexes, while for (b), all surface species are shown separately. A similar behavior occurs with Cl−, with a higher contribution of the Cl− bound complex.

2.5.2. Physicochemical Evidence
Rows of TC > OH sites occur in adjacent octahedra to those of SC > O sites at a distance of 2.83 Å from the former (Figure 2a). These TC sites are predicted by the CD-MUSIC model to be mostly protonated and, thus, positively charged across the whole pH range [6,7] (cf. Figure 3b), conveying a definite electrostatic attraction towards negatively charged oxygens from the monodentate-bound carbonate moieties on SC sites. Therefore, we propose a surface carbonate complex that binds to a SC site in an inner-sphere fashion through a ligand exchange mechanism and to an adjacent protonated TC > OH site. This is only possible on crystal face {101} because face {210} does not have TC sites, and we considered DC sites (present in both faces) as non-reactive. An adjacent SC site will probably not be positively charged (Figure 3a) and lies further away (3.02 Å—Figure 2a) from the one that binds the first carbonate (0.2 Å farther).
The 0.6 Å that are missing to complete the distance between the C-O− and Fe3OH0.5+ is shorter than the typical covalent O-H bond distance of 0.96 Å, and thus, an actual bond is proposed for this second part of the complex. There are two chemical advantages to form this second bond: it does not require (1) the breaking of a second covalent Fe-OH bond, as does the formation of a bidentate complex with an adjacent SC site (although breaking a strong hydrogen bond of a surface-bound water molecule to the TC site in question is most likely), or (2) the extreme bending of the adjacent Fe octahedra in the bidentate complex; therefore, the activation energy for the reaction proposed is expected to be lower than that of a bidentate complex and, thus, show faster kinetics and higher stability. When we tried to add a second monodentate (or bidentate) complex only on face {210}, optimizations did not yield an adequate combination of both complexes, with the latter complex yielding highly unrealistic CD values.
In this manner, the proposed complex (Figure 2b) shows an intermediate nature between purely monodentate and typical bidentate complexes.
2.5.3. DFT Evidence
Kubicki and collaborators [15] simulated the hematite (α-Fe2O3) surface as small edge-sharing dioctahedral Fe3+ clusters, and predicted formation of stable bidentate (bridged) and monodentate carbonate surface complexes using MO/DFT (Molecular Orbitals/Density Functional Theory) model calculations. In order to accommodate the bidentate carbonate configuration, the model predicted a large stretching of the bound Fe-O angles. The theoretical calculations were able to predict previous infrared evidence [16] for these complexes. Since no periodic slab models of Fe(III) octahedra were tested for carbonate adsorption, the question remains whether such a large stretching is possible in real larger-scale crystal faces with more constraints from surrounding octahedra (both from those that share edges and from those found in rows at close distance from the occupied SC sites). Also, the presence of adjoining rows of positively charged TC sites was not considered in the DFT modeling (See Figure 2).
2.5.4. Spectroscopic Evidence
Another line of reasoning that does not support the formation of a bidentate binuclear carbonate complex comes from infrared experimental evidence: The asymmetric OCO stretching band ν3 at 1390 cm−1 of the aqueous CO32− oxyanion is affected when it binds to other cationic species and to mineral surface sites because the symmetry of all free oxygens bound in resonance to the central C atom is broken, and thus, a split band appears [3,4,17,18]. The magnitude of the difference between the resulting bands (Δν3) is directly proportional to the binding strength of the carbonate to the moiety in question; therefore, surface monodentate complexes are expected to show a lower split than bidentate ones [3,4,17,18,19,20]. The particular magnitude difference previously reported for carbonate adsorbed onto the same goethite (76 m2/g) is Δν3 = 155 cm−1 [3], which closely coincides with [21,22,23].
Jolivet and collaborators [17] showed that the magnitude of Δν3 is directly proportional to the polarizing power (= z/r2) of the central cation to which the carbonate moiety binds (with attenuating factors, such as H-bond formation, etc.). Cations with similar polarizing power as Fe(III), such as Co(III), show Δν3 values in the range of 400 to 750 cm−1 for bidentate bridged (binuclear) complexes, 310 to 340 cm−1 for bidentate mononuclear complexes, and 80 to 110 cm−1 for monodentate complexes [17,18,19]. The Δν3 of 155 cm−1 lies between the values of the above monodentate and bidentate mononuclear complexes, and the complex we propose (Figure 2b) could represent such an intermediate complex. The vast majority of bidentate bridged carbonate compounds yield high values of Δν3: even for cations with a considerably lower polarizing power, such as Cu(II), they are ca. 200 cm−1 [17]. Only in an exceptional case did a solid dehydrated Cu(II)-carbonate compound with bidentate bridged binding yields a lower Δν3 than its bidentate mononuclear hydrated counterparts [20]. In addition, for carbonate adsorbed on different polymorphs of Ga2O3 [Ga(III) having a very similar polarizing power as Fe(III)], an observed Δν3 of 400 cm−1 was assigned to a bridged bidentate carbonate, while one with a Δν3 of 262 cm−1 was assigned to a bidentate mononuclear complex [24]. A monodentate bicarbonate was assigned a Δν3 of 199 cm−1.
The above infrared evidence points to a surface carbonate complex on goethite that yields too low a Δν3 band split to consider it to be arising from a bidentate bridged (binuclear) complex; so, the most likely complex configuration would be an intermediate one between a monodentate and a bidentate mononuclear complex.
2.6. CD-MUSIC Model Fitting Procedure
The stoichiometry of the proposed complex is shown in Equation (1). This complex is only possible on goethite crystal face {101} because no TC sites occur on the {210} face. The model description required a definition of separate reactive SC site densities for the {101} face from those of the {210} face according to Table 1.
The charge distribution of the complex cannot be placed in the above stoichiometry because both FenO sites should be placed on the same (left) side of the complex formula to match their surface structural arrangement more closely. However, −1 + ΔZ0 computes the optimal final charge present at the 0-plane, and ΔZ1 is directly the final charge on the 1-plane.
To account for expected differences in surface reactivity between goethites and due to software limitations, the experimental data were divided into two subsets: those on the 76 m2/g goethite and those on the 94 m2/g goethite. However, the data in which NaCl was used as the background electrolyte were also fitted separately from those in NaNO3, thus resulting in an additional dataset (because data for the former goethite were both in NaCl and in NaNO3). Each dataset was fitted separately to optimize the log K of the carbonate complex and ΔZ0, and all other parameters were fixed to the values listed in Table 1 and Table 2.
To unify the three optimized parameters obtained, the average ΔZ0 was computed and held constant for a second optimization process of log K for each dataset. The three resulting log K values were then used to define a final procedure to determine the optimal overall log K value. The program (ECOSAT) was run with the overall dataset without fitting to compute the root mean square error (RMSE) and coefficient of determination (R2) for all the values of log K obtained before, beginning with the highest value and finishing with the lowest one in decrements of 0.01 log units, recalculating the RMSE and R2 in each step.
The optimal log K was selected as the one that provided the best overall fit, defined by the highest R2 (closest to 1) and the lowest RMSE. This final value, along with its estimated uncertainties (standard deviations) for log K and ΔZ0, is reported in Table 3.
3. Results
3.1. Goethite Surface Proton Charging in NaCl
The positive surface proton charge of goethite is higher for Cl− than for NO3− at any given pH below the point of zero net proton charge (PZNPC—compare Figure 1a to Figure 1b), and this is evident in the larger intrinsic binding constant obtained for Cl− of −0.1 log units than for NO3− of −0.6 log units (Table 2). This yields a slightly lower symmetry in the electrolyte binding with Na+ ions for NaCl, but it is not large enough that a common intersection point among charging curves of different ionic strengths cannot be found to assign a PZNPC of ca. pH 9.1. The model successfully describes the surface proton charging behavior with pH and ionic strength, but the data are somewhat better simulated in NaNO3 than in NaCl.
3.2. Carbonate Adsorption Modeling
The proposed complex (Figure 2b), when optimized, yielded a global affinity constant of 22.51 logarithmic units, with a relatively low error, below 0.1 log units, when simulating all the experimental data (Table 3). Its optimal charge distribution (CD) was −0.28 (= −1 + 0.72) and −0.72 (cf. ΔZ values in Table 3) for the 0-plane and the 1-plane, respectively. The simulations of the experimental data were very good (Figure 4) but did not perform as well for systems at high ionic strength in NaCl (Figure 4a,b), except for the systems at 5.52 matm, for which performance was excellent for both ionic strengths. Simulations were also excellent for the open systems in nitrate electrolyte at high ionic strength, especially for the 94 m2/g goethite (Figure 4c). The global coefficient of determination (R2) was high (0.984—Table 3). This value is slightly higher than when fitting a non-protonated bidentate complex on adjacent SC sites on both goethite crystal faces (0.980).
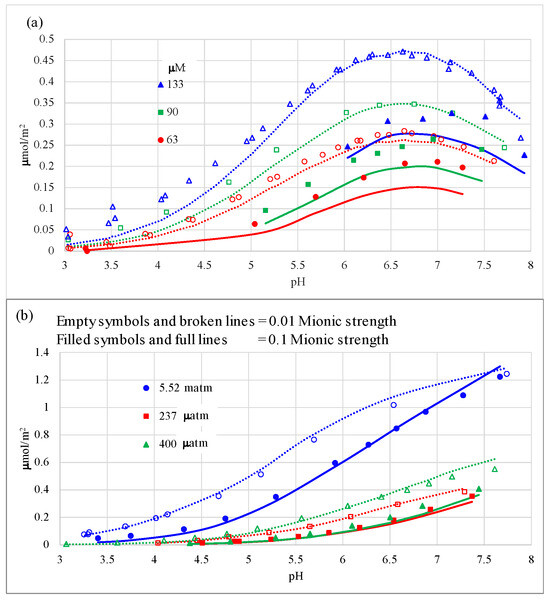
Figure 4.
Carbonate adsorption behavior and CD-MUSIC modeling on a 76 m2/g goethite (previously reported as 70 m2/g [2,3,10]) in NaCl electrolyte on (a) closed systems with gaseous to aqueous volumes of 0.7–0.8 (legends refer to total CO2 added in μmol/L of suspension); (b) open CO2 systems; and (c) open CO2 systems in NaNO3 electrolyte. Empty symbols and broken lines refer to experimental and modeled data, respectively, under 0.01 M ionic strength; and filled symbols and full lines refer to experimental and modeled data, respectively, under 0.1 M ionic strength.
The computed proton co-adsorption from the model yielded linear values of [H]ads/[carbonate]ads = 1.3–1.6 in NaCl, which align very closely with those derived from the experimental data, i.e., 1.3–1.7 [2]. In NaNO3, the values are exactly the same across both sources: 1.5–1.7 adsorbed protons per adsorbed carbonate.
4. Discussion
4.1. Goethite Specific Surface Area and Surface Proton Charging in NaCl
The SSA of the goethite previously used in the carbonate adsorption experiments (and acid–base titrations) in both NaCl and NaNO3 was reported as 70 m2/g [2,3], but the proton charging data in NaNO3 coincided with our data for the more recent 76 m2/g goethite [6,9] in the same electrolyte. We suspect that the reason for this comes from the different drying procedures followed for each goethite preparation. The previous goethite was oven-dried, while the more recent goethite was freeze-dried. The decrease of 6 m2/g in the BET determination could be a result of particle aggregation that occurs under oven-drying conditions, thus blocking a fraction of the SSA (despite the fact that it is later dispersed in a mortar), compared to the freeze-drying procedure, which is meant to minimize particle aggregation. Based on the equal surface charging results when correcting the 70 m2/g goethite data to 76 m2/g, we conclude that, under aqueous suspension, both goethites had the same SSA exposed due to an adequate particle dispersion.
Chloride is known to bind more strongly than nitrate to oxide surfaces; this is evident in the experimental proton charging data on goethite (Figure 1), which is also manifested in the optimized intrinsic binding constants of −0.1 log units for Cl− and −0.60 log units for nitrate (Table 2). A similar difference had been reported previously by Hiemstra and co-workers [4], but their values were −0.5 and −1 log units, respectively, i.e., 0.4 log units lower than our values. This is probably because they approximated the log value of both goethite acidity constants (i.e., to SC and TC sites) to the goethite PZNPC of 9.2. Also, they used a Basic Stern model with an extremely high value of capacitance of 0.9 F/m2, whereas our total capacitance value for the extended Stern CD-MUSIC model is 0.42 (= 1/[1/0.93 + 1/0.75]) (cf. Table 2), in which both capacitance values are close to each other. The latter approach was later used by Hiemstra and collaborators, e.g., in [25,26], with the corresponding values of their capacitances being 0.85 and 0.75 F/m2 [25] or 0.92 F/m2 [26] for both (yielding total capacitances of 0.40 and 0.46, respectively). In the latter case, their intrinsic affinity values for Cl− and NO3− binding were corrected to −0.45 and −0.7 log units, respectively, but both acidity constants were still approximated to the PZNPC (of 9.0). Finally, their total site density for goethite refers to ideal goethite crystals made of pure face {101} on their elongated section and pure face {210} at the tips, which yield values of 3.45 SC sites/nm2 and 2.7 TC sites/nm2. Compare these values to 4.24 and 2.21 sites/nm2, respectively, for the 76 m2/g goethite (Table 1), according to our previous calculations [6].
These distinctions in binding strength, capacitance, and site density values are important to confer accurate model descriptions of the goethite/aqueous interface that carry lower error propagations when modeling ion adsorption, and which may play important roles in describing the competition for surface binding with other ions.
4.2. Carbonate Adsorption
Optimal simulations were obtained with a carbonate complex formed with a covalent bond of a -CO− moiety to a single Fe(III) surface species and a second covalent bond of another -CO− moiety to a TC positively charged surface >OH. Strong theoretical and spectroscopic evidence for the formation of this complex has been given in Section 2.5. This complex alone described all carbonate adsorption data quite well, especially those under open systems or at low ionic strength (Figure 4). The model reproduces well the observed large negative effect of ionic strength on total carbonate adsorption, which is due to effective competition for adsorption sites of the electrolyte anion with carbonate. This is the result of two contributions: a relatively weak carbonate binding constant of 22.5 log units (Table 3), compared to those obtained using the same model in a previous work of this article series for the bidentate complexes of As(V) (29.1 log units [6]) and phosphate (29.8 log units [7]), combined with the fact that a relatively large absolute negative charge (−0.72) was found at the 1-plane (cf., ΔZ1 value in Table 3), i.e., the sample plane where the electrolyte anions reside. The optimized ΔZ values are very close to the theoretical ones, where ΔZ1 is −0.67; this is in agreement with previous CD-MUSIC modeling of the same experimental data [4].
Also, the open-system data on 0.1 M NaNO3 on GOE94 under 400 μatm CO2 showed slightly lower adsorbed carbonate concentrations in the pH range of ca. 4–7 than the corresponding GOE76 system under 327 μatm CO2 (despite a lower partial pressure) and was well reproduced by the model (Figure 4c). This illustrates the higher capacitance-1 value (despite lower SC and TC site densities on face {101}) of GOE 76 compared to that of GOE94 (cf. Table 1 and Table 2). The description of these adsorption variations (increasing adsorption as SSA decreases) with unified parameters on goethite is one of the main goals of the present article series.
It is noteworthy that the model is able to capture the crossover and increase in carbonate adsorption at high ionic strength and high pH values over the adsorption at low ionic strength for open systems at high pH values, e.g., at 327 μatm at pH values above 8 (Figure 4c), especially at 5.52 matm at pH values above 7.5 (Figure 4b). In these regions, the adsorbed concentrations at 0.1 M ionic strength surpass those at 0.01 M, whereas at lower pH values, the 0.1 M ionic strength systems yield considerably lower carbonate adsorption because of competition with the electrolyte anion. This may be explained by the fact that in open systems, the total aqueous carbonate concentration present is growing logarithmically with pH after the first carbonic acid pKa (ca. pH of 6.3), and the increase is larger as ionic strength increases in such a way that the dissolved bicarbonate becomes progressively larger with pH at 0.1 M ionic strength than at 0.01 M (cf., Figure 7 in [2]). It was not necessary to invoke an outer-sphere surface carbonate complex with Na+ at high pH and ionic strength, as was done previously [3,4,27].
The reason for this behavior arises from a chemical activity effect: for the bicarbonate anion, the coefficient (γ), calculated with the extended Debye–Hückel equation, is 0.90 at 0.01 M ionic strength but decreases considerably to 0.77 at 0.1 M ionic strength. Therefore, the corresponding ionic concentrations required to uphold the thermodynamic dissociation constant of carbonic acid (more properly, of aqueous hydrated CO2) at the same activity of aqueous protons, i.e., at the same pH, are larger at higher ionic strength. The absolute concentration of the total dissolved carbonate is higher at pH values when bicarbonate becomes predominant in the aqueous carbonate speciation (pH > 6.3) for the systems with higher ionic strength.
Quantitative calculations may be performed, considering that at a pH above ca. 6.5 (and below 10.3), the chemical activity of dissolved bicarbonate must be equal regardless of the ionic strength, i.e., (γHCO3−[HCO3−])I=0.01 M = (γHCO3−[HCO3−])I=0.1 M, or 0.90[HCO3−]I=0.01 M = 0.77[HCO3−]I=0.1 M. This means that the bicarbonate concentration ratios are as follows: [HCO3−]I=0.1 M/[HCO3−]I=0.01 M are 0.90/0.77 = 1.17. The dissolved bicarbonate concentrations at 0.1 M ionic strength become sufficiently high at higher pH values (which decrease as the partial pressure of CO2 increases), causing higher adsorption of carbonate at 0.1 M ionic strength. These higher dissolved/adsorbed concentrations reverse the net negative effect of ionic strength on carbonate adsorption observed at lower pH values due to anion competition.
When carbonic acid predominates (pH < 6.3), no dissolved carbonate difference is calculated between ionic strengths because its activity does not depend on this parameter, since this species has no electrostatic charge.
Finally, our optimized log K of the carbonate complex of 22.51 log units (Table 3) is much larger than the corresponding one obtained previously [4] with the CD-MUSIC model, i.e., 3.90 log units. This is likely the result of the very high total capacitance value they used (0.9 F/m2) compared to ours (0.42 F/m2) (cf. Section 4.1). In a later study by the same group [27], using the extended Stern version of the model (with lower total capacitance [26]), they determined an affinity value much closer to ours (22.01 log units) for a bidentate bridged complex. This value was obtained indirectly from competition experiments with phosphate, but they used extreme conditions meant to mimic very alkaline environments, such as soda lakes: total dissolved carbonate (30–500 mM), pH (7–12), and ionic strengths (mainly of 0.5 M). We believe that obtaining indirect values from ternary systems (with two solutes) may result in error propagation from the binary system modeled (in their case, phosphate adsorption to goethite). It is always a better choice to ensure accurate values from separate well-controlled single-solute (binary) experiments.
They required very high values of total carbonate [27] to observe the competitive adsorption effect of carbonate vs. phosphate (at 0.4 mM total concentration) because the latter shows a much larger affinity for the goethite surface (e.g., log K = 29.84 for the same bidentate configuration, in addition to log K = 27.48 for the monodentate configuration [7]—both required to simulate adequate phosphate adsorption under a wide range of conditions). In these extreme conditions, a Na+-outer-sphere interaction with the bidentate carbonate surface complex was required, and a significant contribution of an outer-sphere carbonate complex, with a CO32− anion, was modeled at the highest pH values investigated (ca. pH 11–12) [27]. The justification of the bidentate bridged carbonate complex modeled came from MO/DFT calculations of dioctahedral Fe3+ clusters that allowed large bending of the Fe-OH SC octahedral bonds to accommodate the short O-O distances of the bound carbonate moieties (cf. Section 2.5.1), as described in [15]. The possible interaction of the adsorbed carbonate with the adjoining positively charged TC sites was not considered.
5. Conclusions
Unified proton charging parameters have been complemented in this third part of the article series by adding the Cl− affinity to positively charged SC and TC surface sites, with an intrinsic value of −0.1 log units, making it 0.5 log units stronger than NO3−. We propose a single carbonate surface complex on goethite that describes the carbonate adsorption behavior in a wide range of conditions, such as pH, carbonate concentrations, and ionic strength. This surface complex has a mixed configuration of monodentate binding to a SC site on crystal face {101} and a covalent bond to an adjacent positively charged >OH TC site on this face. Structural, spatial, physicochemical, and infrared evidence supports the formation of the proposed surface carbonate complex, which shows a spectroscopic behavior between that of a monodentate complex and a bidentate complex.
The formation constant of the surface carbonate complex was optimized to 22.51 log units with a charge distribution of −0.28 and −0.72 valence units for the 0-plane and the 1-plane, respectively, which yielded a better correlation coefficient than when fitting the data with a bidentate bridged carbonate complex. These parameters accurately describe the carbonate behavior under all conditions studied and unified for goethites of different particle sizes and under different electrolyte anions at different ionic strengths. In this manner, the parameters found may be incorporated in a geochemical speciation database to be applicable for adsorption reactions at any condition with an underlying thermodynamic basis. This is an important step in describing more complex geochemical scenarios when goethite is present as a dominant Fe (hydr-)oxide, since carbonate is a ubiquitous anion found as a major component in aqueous geochemical environments.
Author Contributions
Conceptualization, M.V.; methodology, M.V. and A.X.C.-V.; validation, A.X.C.-V.; formal analysis, A.X.C.-V.; investigation, A.X.C.-V. and M.V.; resources, M.V.; writing—original draft preparation, M.V.; writing—review and editing, M.V. and A.X.C.-V.; visualization, M.V. and A.X.C.-V.; supervision, M.V.; project administration, M.V.; funding acquisition, M.V. All authors have read and agreed to the published version of the manuscript.
Funding
This research was funded by the UNAM PAPIIT Project IN104923, and general infrastructure and equipment maintenance funds were acquired through the LANGEM and provided by UNAM in Mexico City. A.X.C.-V. is thankful for the assistantship funds provided by SECIHTI (previously CONAHCyT) from the Mexican government.
Data Availability Statement
Data are available through Mendeley Data at: https://doi.org/10.17632/k2f6ff56fh.1.
Acknowledgments
The authors thank Alan Ulises Loredo Jasso of the IGL-LANGEM for facilitating access to the hardware and software (ECOSAT and FIT) to work on the CD-MUSIC modeling.
Conflicts of Interest
The authors declare no conflicts of interest. The funders had no role in the design of this study, the collection, analyses, or interpretation of data, the writing of the manuscript, or the decision to publish the results.
Abbreviations
The following abbreviations are used in this manuscript:
| CD-MUSIC | Charge-Distribution MultiSite Ion Complexation |
| SC | singly coordinated |
| TC | triply coordinated |
| RMSE | root mean square error |
| PZNPC | point of zero net proton charge |
| MO/DFT | Molecular Orbitals/Density Functional Theory |
References
- Cornell, R.M.; Schwertmann, U. The Iron Oxides: Structure, Properties, Reactions, Occurrences and Uses, 2nd ed.; WILEY-VCH Verlag GmbH: Weinheim, Germany, 2003; pp. 64–69, 253–296, 441–447. [Google Scholar]
- Villalobos, M.; Leckie, J.O. Carbonate adsorption on goethite under closed and open CO2 conditions. Geochim. Cosmochim. Acta 2000, 64, 3787–3802. [Google Scholar] [CrossRef]
- Villalobos, M.; Leckie, J.O. Surface complexation modeling and FTIR study of carbonate adsorption to goethite. J. Colloid Interface Sci. 2001, 235, 15–32. [Google Scholar] [CrossRef]
- Hiemstra, T.; Rahnemaie, R.; van Riemsdijk, W.H. Surface complexation of carbonate on goethite: IR spectroscopy, structure and charge distribution. J. Colloid Interface Sci. 2004, 278, 282–290. [Google Scholar] [CrossRef]
- Hiemstra, T.; van Riemsdijk, W.H. A surface structural approach to ion adsorption: The charge distribution (CD) model. J. Colloid Interface Sci. 1996, 179, 488–508. [Google Scholar] [CrossRef]
- Martínez, R.J.; Villalobos, M.; Loredo-Jasso, A.U.; Cruz-Valladares, A.X.; Mendoza-Flores, A.; Salazar-Rivera, H.; Cruz-Romero, D. Towards building a unified adsorption model for goethite based on variable crystal face contributions: I. Acidity behavior and As(V) adsorption. Geochim. Cosmochim. Acta 2023, 354, 252–262. [Google Scholar] [CrossRef]
- Villalobos, M.; Cruz-Valladares, A.X.; Loredo-Jasso, A.U.; Villa-Nava, P.; López-Castilla, F.; Huerta-Hernández, L.F. Towards building a unified adsorption model for goethite based on variable crystal face contributions: II. Pb(II), Zn(II) and phosphate adsorption. Geochim. Cosmochim. Acta 2025, 396, 1–12. [Google Scholar] [CrossRef]
- Livi, K.J.T.; Villalobos, M.; Leary, R.; Varela, M.; Barnard, J.; Villacís-García, M.; Zanella, R.; Goodridge, A.; Midgley, P. Crystal face distributions and surface site densities of two synthetic goethites: Implications for adsorption capacities as a function of particle size. Langmuir 2017, 33, 8924–8932. [Google Scholar] [CrossRef]
- Livi, K.J.T.; Villalobos, M.; Ramasse, Q.; Brydson, R.; Salazar-Rivera, H.S. Surface site density of synthetic goethites and its relationship to atomic surface roughness and crystal size. Langmuir 2023, 39, 556–562. [Google Scholar] [CrossRef]
- Villalobos, M.; Trotz, M.A.; Leckie, J.O. Surface complexation modeling of carbonate effects on the adsorption of Cr(VI), Pb(II) and U(VI) on goethite. Environ. Sci. Technol. 2001, 35, 3849–3856. [Google Scholar] [CrossRef]
- Maslen, E.N.; Streltsov, V.A.; Streltsova, N.R. X-ray study of the electron density in calcite, CaCO3. Acta Crystallog. Sect. B Struct. Sci. 1993, 49, 636–641. [Google Scholar] [CrossRef]
- Dusek, M.; Chapuis, G.; Meyer, M.; Petricek, V. Sodium carbonate revisited. Acta Crystallog. Sect. B Struct. Sci. 2003, 59, 337–352. [Google Scholar] [CrossRef]
- Hazemann, J.; Berar, J.; Manceau, A. Rietveld studies of the aluminium-iron substitution in synthetic goethite. Mater. Sci. Forum 1991, 79, 821–826. [Google Scholar] [CrossRef]
- Momma, K.; Izumi, F. VESTA 3 for three-dimensional visualization of crystal, volumetric and morphology data. J. Appl. Crystallogr. 2011, 44, 1272–1276. [Google Scholar] [CrossRef]
- Kubicki, J.D.; Kwon, K.D.; Paul, K.W.; Sparks, D.L. Surface complex structures modelled with quantum chemical calculations: Carbonate, phosphate, sulphate, arsenate and arsenite. Eur. J. Soil. Sci. 2007, 58, 932–944. [Google Scholar] [CrossRef]
- Bargar, J.R.; Kubicki, J.D.; Reitmeyer, R.; Davis, J.A. ATR-FTIR spectroscopic characterization of coexisting carbonate surface complexes on haematite. Geochim. Cosmochim. Acta 2005, 69, 1527–1542. [Google Scholar] [CrossRef]
- Jolivet, J.P.; Thomas, Y.; Taravel, B.; Lorenzelli, V.; Busca, G. Infrared spectra of Ce and Th pentacarbonate complexes. J. Mol. Struct. 1982, 79, 403–408. [Google Scholar] [CrossRef]
- Gatehouse, B.M.; Livingstone, S.E.; Nyholm, R.S. The infrared spectra of some simple and complex carbonates. J. Chem. Soc. 1958, III, 3137–3142. [Google Scholar] [CrossRef]
- Fujita, J.; Martell, A.E.; Nakamoto, K. Infrared spectra of metal chelate compounds. VIII. Infrared spectra of Co (III) carbonato complexes. J. Chem. Phys. 1962, 36, 339–345. [Google Scholar] [CrossRef]
- Mosset, A.; Bonnet, J.J.; Galy, J. Structure cristalline de la chalconatronite synthetique: Na2Cu(CO3)2*3H2O. Z. Kristallogr. 1978, 148, 165–177. [Google Scholar] [CrossRef]
- Zeltner, W.A.; Anderson, M.A. Surface charge development at the goethite/aqueous solution interface: Effects of CO2 adsorption. Langmuir 1988, 4, 469–474. [Google Scholar] [CrossRef]
- Bargar, J.R.; Reitmeyer, R.; Davis, J.A. Spectroscopic confirmation of uranium(VI)-carbonato adsorption complexes on hematite. Environ. Sci. Technol. 1999, 33, 2481–2484. [Google Scholar] [CrossRef]
- Ostergren, J.D.; Trainor, T.P.; Bargar, J.R.; Brown, G.E., Jr.; Parks, G.A. Inorganic ligand effects on Pb(II) sorption to goethite (α-FeOOH) I. Carbonate. J. Colloid Interface Sci. 2000, 225, 466–482. [Google Scholar] [CrossRef]
- Collins, S.E.; Baltanás, M.A.; Bonivardi, A.L. Infrared spectroscopic study of the carbon dioxide adsorption on the surface of Ga2O3 polymorphs. J. Phys. Chem. B 2006, 110, 5498–5507. [Google Scholar] [CrossRef]
- Stachowicz, M.; Hiemstra, T.; van Riemsdijk, W.H. Surface speciation of As(III) and As(V) in relation to charge distribution. J. Colloid Interface Sci. 2006, 302, 62–75. [Google Scholar] [CrossRef]
- Rahnemaie, R.; Hiemstra, T.; van Riemsdijk, W.H. Geometry, charge distribution, and surface speciation of phosphate on goethite. Langmuir 2007, 23, 3680–3689. [Google Scholar] [CrossRef]
- Rahnemaie, R.; Hiemstra, T.; van Riemsdijk, W.H. Carbonate adsorption on goethite in competition with phosphate. J. Colloid Interface Sci. 2007, 315, 415–425. [Google Scholar] [CrossRef] [PubMed]


Disclaimer/Publisher’s Note: The statements, opinions and data contained in all publications are solely those of the individual author(s) and contributor(s) and not of MDPI and/or the editor(s). MDPI and/or the editor(s) disclaim responsibility for any injury to people or property resulting from any ideas, methods, instructions or products referred to in the content. |
© 2025 by the authors. Licensee MDPI, Basel, Switzerland. This article is an open access article distributed under the terms and conditions of the Creative Commons Attribution (CC BY) license (https://creativecommons.org/licenses/by/4.0/).