Abstract
Drying is ubiquitous. However, its influence on surface speciation has been seldom studied. Through an in situ Attenuated Total Reflection–Infrared (ATR-IR) spectroscopy analysis of the drying of molybdate solutions on a lepidocrocite particle film, the change in surface speciation is followed. No formation polymolybdates nor precipitate are observed upon drying at pH 8. An in situ washing of the dried solid/solution interface unveils the existence of surface outer-sphere and inner-sphere complexes. Decreasing the molybdate concentration highlights a saturation effect of the surface upon drying. Moreover, the careful analysis of substrate IR bands showed non-uniform drying which is an important insight to understand dehydration chemistry. The remaining molybdate ions at the surface as inner-sphere complexes are present as binuclear monodentate complexes stabilized by sodium.
1. Introduction
From the preparation of heterogeneous catalysts [1] to the study of pollutants in soils [2,3,4], drying is a ubiquitous phenomenon. It consists of the transition from a solid/solution interface to a gas/solid interface, driven by the evaporation of the solvent. It is often bolstered by heating, leading to a more complicated phenomenon, which in turn can affect the surface speciation. While the studies of wet and dry interfaces are numerous, the investigation of the evolution between these two chemical states has seldom been investigated.
According to the few works reported on this transition, the general conclusion is that the formation of strongly bonded surface complexes, as (multidentate) inner sphere (IS) complexes is promoted [5,6,7]. The main characterization technique used for these studies is infrared (IR) spectroscopy, as it is one of the privileged technique to straightforwardly distinguish between IS and outer-sphere (OS) complexes as well as enabling for in situ, surface-sensitive, real-time studies. Amongst interesting adsorbates, molybdates are known precursors in heterogeneous catalysis [8], generally used to form heptamolybdates at the surface of a support. They are also known soil pollutants [9]. As such, they are subject to weather changes, likely to witness humid and dry conditions similar to non-thermal drying. Other systems, e.g., sulfate/goethite, have been studied [6], but the drying of molybdate species, which have a propensity to form polymers, is expected to be more complex. Hence research efforts are needed to decipher the evolution of the speciation.
Our work aims to unveil the surface chemistry of molybdates adsorbed on lepidocrocite upon dehydration. Furthermore, it deciphers whether the changes in the conditions at the surface of lepidocrocite can modify molybdate chemistry towards polymerization or not. The contrast with results from the literature is reported, along with a mechanism of adsorption provided by studying the effect of the adsorbate concentration on the drying.
2. Materials and Methods
All solutions and suspensions were prepared using purified water (Milli-Q, Millipore, Burlington, MA, USA) with a resistivity of 18.2 MΩ⋅cm. An aqueous molybdate solution (0.1 mol⋅L−1) was prepared from Na2MoO4.2 H2O (Prolabo, Radnor, PA, USA). In the sample solutions, the ionic strength was fixed at 0.01 mol⋅L−1 NaCl salt (VWR Prolabo, Radnor, PA, USA). The pH was increased with sodium hydroxide solution. All drying operations were performed with nitrogen gas. Lepidocrocite with a N2 Brunauer–Emmett–Teller (BET) surface area of 76 m2/g was synthesized in two steps according to the protocol of Schwertmann and Cornell [10] based on the hydrolysis of an iron(II) salt followed by the oxidation of the obtained precipitate by controlling the pH and kinetics. The ATR-FTIR spectra were collected with a dry air-purged Thermo Scientific (Waltham, MA, USA) Nicolet 6700 FTIR equipped with an MCT (Mercury–Cadmium–Telluride) detector. The spectral resolution was 4 cm−1, and the spectra were averaged from 256 scans. The horizontal ZnSe crystal had a single reflection (area = 2.54 mm2) and an angle of incidence of 45° (Smart PIKE, Buckinghamshire, UK). Numerical simulations of interface drying were performed using PHREEQC v2 [11] (details in Table S1).
The first step was to make a nanoparticle film on the ATR crystal by drop casting 1 μL of a 1 g.L−1 suspension of lepidocrocite on the ATR crystal. The operation was repeated three times to obtain a covering film. The spectral backgrounds were then collected (ATR crystal covered with the lepidocrocite film). Once the lepidocrocite deposit was made, a hydration step was performed by contacting the particle film with the support electrolyte using a peristaltic pump (Ismatec S.A., Glattbrugg, Switzerland). It was monitored by regular analysis of the sample and comparison with the baseline. Once a stationary state (which cannot be assimilated to a thermodynamic equilibrium on its own) was assumed to be reached (ca. 20 min), the adsorption step consisted of the addition of sodium molybdate to reach one of the two targeted concentrations (10−3 mol⋅L−1, sample Mo-3 and 10−4 mol⋅L−1, sample Mo-4). The concentrations have been chosen based on a previous study of the solid/solution interface [12]. Beside the adsorbate, the composition of the adsorption solution was kept constant at pH 8, with 0.01 mol⋅L−1 of sodium chloride as a support electrolyte. More details on the drop casting, hydration, and adsorption steps are available elsewhere [12,13].
Once a stationary state was reached for the adsorption step, the drying was performed. First, removing the liquid phase inside the tubes connecting the stock solution the flow cell with a syringe containing nitrogen. Once most of the liquid was removed, a nitrogen flow (ca. 100 mL⋅min−1, RH = 0%, T ≈ 298 K) was used to dry the remaining drop of solution on top of the particle film (ca. 1.5 μL). The drying was monitored in a similar way to the hydration and adsorption steps, and the final spectra were acquired once a new stationary state was reached. The washing of the dried sample includes the same steps as the hydration process, with a duration of only 30 s followed by a second drying process. The experimental steps and the phases in contact are summarized in the diagram in Figure S1. Similar methodologies were used to obtain a deposit of sodium heptamolybdates (10−2 mol⋅L−1 sodium molybdate, pH 3, 10−2 mol⋅L−1 NaCl) and a precipitate of sodium molybdate (10−4 mol⋅L−1 sodium molybdate, pH 8, 10−2 mol⋅L−1 NaCl).
3. Results and Discussion
3.1. Simple Drying: Investigation of the Precipitation/Polymerization of Monomolybdates
The solid/solution interface is dried at pH 8 in order to control the diversity of molybdate species existing in solution and at the surface of the lepidocrocite [12]. For example, polymolybdates cannot form in the initial conditions of the solution (pH 8, Mo concentration 10−3 mol⋅L−1), which means that the appearance of polymolybdates after drying would highlight important changes taking place at the interface such as a reversed reactivity to the one previously observed for polymerization [14].
Two different phenomena can be expected due to the drying of the solution: the precipitation of (poly) molybdate sodium salt, or the formation of surface complexes. In this latter case, the distinction between IS and OS is important, for example, to predict the possibility of remobilization in contact with an aqueous solution. While the IS complexes constitute the surface speciation, one must distinguish between IS and OS to discuss said speciation. Consequently, the existence and nature of OS must be addressed.
The initial state of the drying is the solid/solution interface. This system has been previously studied [12], showing that molybdate ions adsorb onto the lepidocrocite surface mostly as monodentate binuclear complexes at pH 8 on the (010) facets of the solid. A small amount of molybdates is also adsorbed on defect surface sites. This latter species is thought to be a monodentate mononuclear complex, present in negligible amounts at pH 8.
The drying of the solid/solution interface is coupled with the accumulation of the solute above the surface (in solution). Following this increase in concentration, the IR signal is more intense in the dry gas/solid interface than in the solid/solution interface (Figure S2). Figure 1a shows the comparison of the spectrum for the dried Mo-4 interface with the spectrum of a dried sodium heptamolybdate solution. Among the bands observed in the heptamolybdate spectrum, the 710 cm−1 band is not observed in the Mo-4 interface spectrum. This band has been assigned in the literature to a vibrational mode of the polyanion, and its absence from Figure 1a is an early sign of the lack of polymers at the surface after drying. Other bands, corresponding to normal modes of the Mo7 cluster, are absent from the dried interface spectrum such as 950 cm−1 (A1(ν2)) for hydrated heptamolybdate. The 900 cm−1 band in Figure 1a could correspond to the heptamolybdate A1(ν1) mode; however, no intense band at 950 cm−1 can be found to match the band pattern. Beside the missing bands, the shapes of both spectra are different, highlighting that heptamolybdates are not prevailing at the lepidocrocite surface after drying. Hence the accumulation of monomers at the surface upon drying is unable to overcome the strong basicity of the aqueous medium. It consequently prevents the polymerization of the adsorbate, whether at the surface or in solution. For a more concentrated solution, where polymerization is more likely to occur (dried Mo-3 interface, Figure S2 top), the difference with the spectrum of the heptamolybdate clusters is even more significant, indicating that its formation is not triggered by drying.
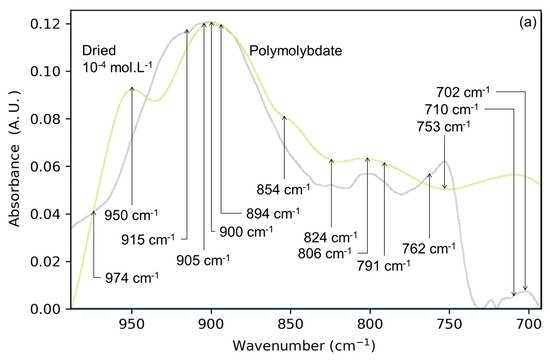
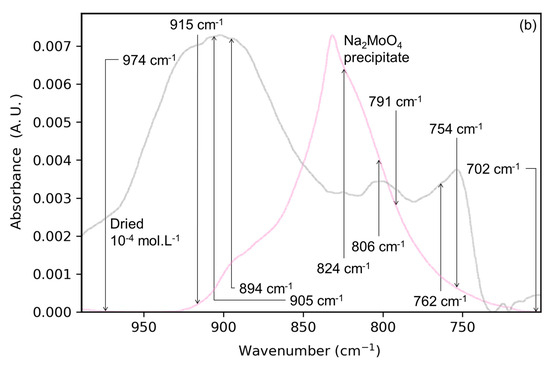
Figure 1.
Spectra of the dried Mo-4 interface (gray) superimposed onto (a) dried solution of polymolybdates (green) and (b) a sodium molybdate precipitate (pink). Arrows are highlighting the main bands for Mo-4 interface spectrum.
Another possible product of the accumulation of solute is a precipitate of sodium monomolybdate (Na2MoO4). Figure 1b shows the spectrum of the Mo-4 interface with the spectrum of a precipitate of sodium molybdate obtained by drying a solution in similar conditions (pH 8, NaCl 0.01 mol⋅L−1). The spectra of the Mo-4 interface and Na2MoO4 precipitate differ in terms of IR maxima (830 cm−1 for the precipitate and 905 cm−1 for the dried interface) and overall shapes. These observations suggest that sodium molybdate precipitate is not prevailing at the surface of the lepidocrocite upon drying of the solid/solution interface. The differences in IR signals are summarized in Table 1.

Table 1.
Main IR bands for the Na2MoO4 precipitate, polymolybdate precipitate, and Mo-4 and Mo-3 interfaces after drying (without washing).
In conclusion, the drying of an aqueous solution of molybdates on a thin lepidocrocite film does not induce the formation of polymolybdates nor precipitate. Nevertheless, these species appear upon the dehydration of the solution alone, suggesting the prevailing role of the interface during the accumulation of anions at the surface.
3.2. Washing of the Dried Film: Experimental Separation of OS/IS Contributions
To progress the identification of the molybdate surface species, the influence of adsorbate concentration has first been studied. In Figure 2a, the spectra of the dried Mo-3 interface is shown. The spectrum is dominated by a large band at 827 cm−1 which is not seen in the dried Mo-4 interface (Figure 2b). This wavenumber is characteristic of the asymmetric stretching of molybdate ions in solution [15], most likely indicating that the lepidocrocite surface is covered by OS molybdate complexes. These species, coming from non-specific, ionic interactions, are necessary to maintain the electroneutrality of the solid/solution interface. In the dried state, they need to be neutralized by sodium ions nearby, effectively forming Na2MoO4-like precipitates at the surface of lepidocrocite. Depending on the amount of outer-sphere complexes present at the surface, they can be thought of as a hydrated, amorphous Na2MoO4 precipitate, different from the one obtained by the drying of a solution without substrate (Figure 1b).
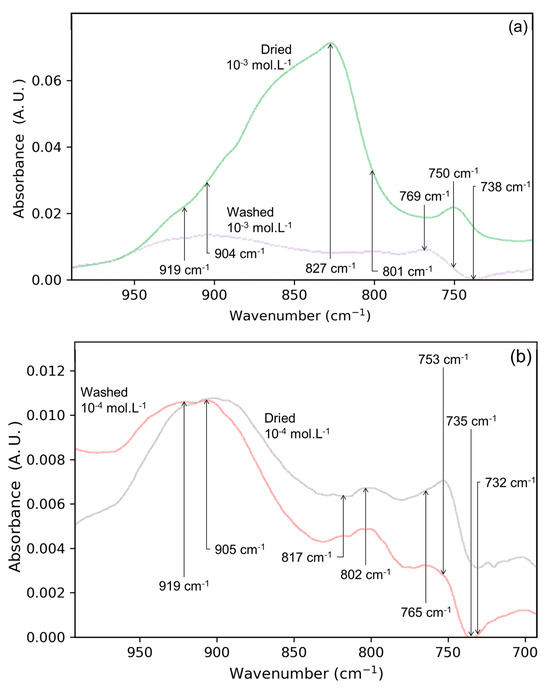
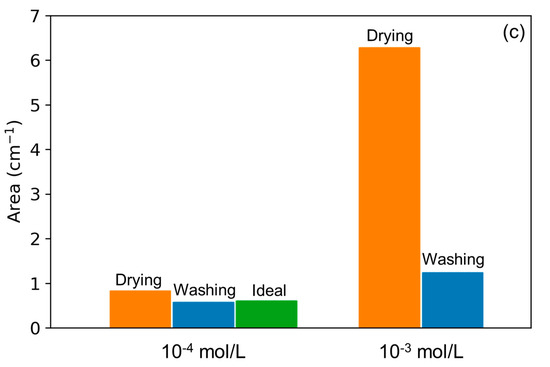
Figure 2.
Superimposed spectra of (a) Mo-3 interface dried (red) and washed/dried (green), (b) Mo-4 interface dried (red) and washed/dried (blue) as well as (c) histogram of band areas after drying (orange) and washing/drying (blue) for interfaces Mo-4 (left) and Mo-3 (right). The green bar on the left side shows the ideal dilution of the surface concentration, which is one tenth of the band area measured for Mo-3 interface.
Such a conclusion is inconsistent with a completely anhydrous surface, but the drying process using a dry nitrogen flow at room temperature is not able to dehydrate the solid surface fully. Hence, the dried interface could retain the ice-like water layers at the surface [16,17]. This ice-like water is also supporting the existence of OS molybdates that come from the saturation of lepidocrocite, as they can act as solvation water for the OS molybdate species. This observation is reported here for the first time, to the best of our knowledge, and provides a different vision of the expected result of interface drying. However, to further explore the nature of the surface species on lepidocrocite, the spectra need to be free of any OS complexes since their signal overwhelms the other bands. These labile species are expected to readily desorb in contact with an aqueous phase. On the other hand, IS complexes, with a higher adsorption energy, are expected to desorb more slowly [18,19].
Considering the aqueous solution as a mobile phase and the particle film as a fixed phase, an analogy can be made with chromatographic principles: labile species (e.g., OS complexes) have a shorter retention time (close to the void time) while chemisorbed species (IS complexes) are expected to have a longer one. Thus, washing the particle film with a pulse of aqueous solution with a similar composition, although deprived of adsorbate, would suffice to eliminate most of the OS complexes, leaving most of the IS complexes at the surface of the lepidocrocite. One of the key parameters here is the duration of the washing step. During the adsorption step, approximately 20 min was needed to reach a stationary state. The washing time was chosen to be 30 s, i.e., 40 times less than the adsorption step to minimize the risk of desorption of IS complexes and/or major changes in speciation.
In order to highlight the modifications brought by the washing step, the spectra of the dried solid/solution interface before and after washing step are compared in Figure 2. For the Mo-3 interface (Figure 2a), the signals significantly changed after washing, while the shape and intensity of the bands of the Mo-4 interface are not significantly impacted. Thus, the wide intense band at ca. 827 cm−1 disappeared in the Mo-3 experiment, revealing a low intensity spectrum with bands previously not visible. This is consistent with the presence of a large number of OS complexes at the surface after simple drying. Moreover, the wavenumbers of these newly observed bands are close to those obtained after the drying and washing of the Mo-4 interface.
The lack of modification of the Mo-4 interface (Figure 2b), along with the important changes noticed on the spectrum of the Mo-3 interface upon washing, confirms the existence of chemisorbed species at both interfaces. These observations also show that the species observed at the Mo-4 interface are the ones that are strongly bonded to the surface and prevail at the surface of the lepidocrocite after simple drying. From a quantitative point of view, Figure 2c shows the evolution of the signal area between 990 and 700 cm−1 for both solid/gas interfaces before and after the washing step. The differences between the two concentrations of molybdate is evidenced by the band area of the spectrum, which is divided by five after washing the Mo-3 interface. For the Mo-4 interface, however, its value is very close to the first dried state (before washing). The band areas after the washing step indicate that twice the amount of molybdates has been chemisorbed at the surface of the lepidocrocite upon drying between the Mo-4 and Mo-3 interfaces. A low increase in IS complexes would be consistent with the usual non-linear shape of isotherms [20], considering that the molybdates in solution are ten times more concentrated than for the Mo-4 interface. Moreover, the short washing time in comparison to the adsorption step suggests that the surface coverage has only been slightly modified by the brief contact with the solution. This further points to the saturation of the lepidocrocite surface by the inner-sphere complexes upon drying. The existence of OS complexes after drying stems from the inability of lepidocrocite to accommodate all of the adsorbate as IS complexes, which is related to its adsorption capacity. If the amount of molybdates is superior to the adsorption capacity then they cannot be chemisorbed, hence they remain at the surface as OS complexes.
3.3. Surface Speciation and Adsorption Mechanism
After isolating the IS molybdate complexes at the lepidocrocite surface, the normalized spectra of both the solid/solution interface and gas/solid interface (Figure 3a) are going to help attribute the IR signals, revealing the surface speciation of molybdates after drying.
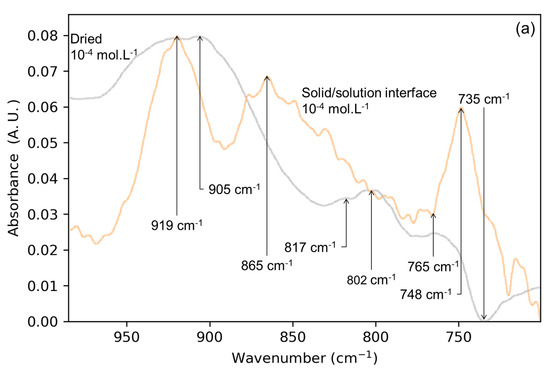
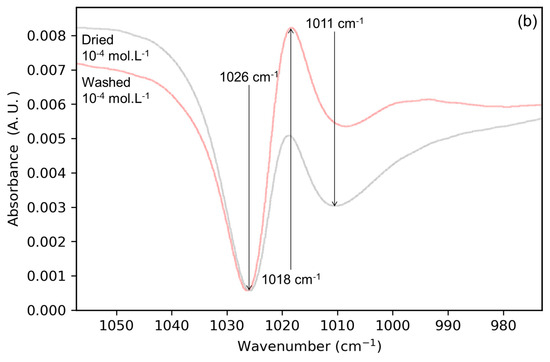
Figure 3.
Spectra of (a) solid/solution Mo-4 interface (light blue) superimposed onto its dried counterpart (light red) as well as (b) lepidocrocite OH wavenumber range after drying (light red) and after washing (yellow) for Mo-4 interface.
According to previous research works on the solid/solution interface, the 919 cm−1 band comes from the symmetric stretching of the molybdate monodentate binuclear complex, mixed with one asymmetric stretching mode of the same species [21]. These interpretations are supported by DFT simulations that have been performed without surrounding water molecules. The agreement between the experimental IR signals with the simulation was excellent, hence the same assignment being made here. The band at 802 cm−1 is also observed in the lower wavenumber range of the spectrum. Binuclear bidentate complexes would explain these signals, as reported in previous work [12]. Most of the complexes occupying the lepidocrocite surface at the solid/solution interface are monodentate binuclear complexes, which are weakly chemisorbed [12].
The band at 748 cm−1 in the solid/solution interface (Figure 3a) is due to a particularly stable molybdate surface complex. Hence, it is surprising to see the absence of a signal at ca 748 cm−1 while the saturation of the surface by the monomolybdates should leave a higher amount of them at the surface and a positive band in the associated IR spectrum. This band overlaps with a bending mode of surface hydroxyls and the molybdate adsorption should leave a negative band as mentioned earlier. As neither a clear negative band nor a clear positive band are noticed, and as several species are active in the 710 to 775 cm−1 range, this region is left out of the analysis.
Figure 3b shows the 970 to 1060 cm−1 region, associated with the signals of the lepidocrocite [15], before and after the washing step. The background of these spectra is the lepidocrocite film in the presence of water. Three bands are visible at 1026 (negative), 1018 (positive), and 1010 cm−1 (negative), suggesting the disappearance of two surface species and the appearance of one. However, only one band is present in the spectrum of lepidocrocite alone and this band has been reported to shift at the solid/solution interface due to adsorption [12]. Furthermore, the surface of the (010) facets of lepidocrocite show only one type of OH environment [22]. These three apparent bands are therefore more likely to come from one wide negative band arising from the massive adsorption of molybdate ions (accompanied by the substitution of a surface OH) upon drying. This negative band would then be compensated by a positive band, thinner, coming from the adsorption of hydroxyl ions (Reaction (1)) and the subsequent desorption of molybdates. This feature is illustrated in Figure S3. The only way to reconcile these two observations is to have both reactions happening at different locations in the lepidocrocite film, i.e., having non-uniform drying. This is spectroscopic proof that the drying is yielding a non-uniform system, with different populations of surface species. However, assessing the location remains elusive without the clear targeting of part of the deposit.
To further understand the drying phenomenon and associated changes in solution, the evolution of the pH upon drying must be discussed. A slight pH decrease can be expected in the presence of lepidocrocite in contrast with an aqueous solution of sodium hydroxide alone of which the pH increases by ca. 1.5 upon drying. This buffering effect is most likely due to reactions of the hydroxide ions with the substrate’s surface. This behavior has been simulated using a surface complexation model which has shown that the evolution of the pH is around only 0.2 pH unit (Figure S4). While the hydroxide ion is a strong base, it can also be considered a nucleophile that is able to compete with the molybdates for the adsorption sites and therefore dissociate part of the surface complexes. One of these reactions is the substitution of one adsorbed molybdate by a hydroxide ion as follows:
forming OH groups at the surface of lepidocrocite. This observation is in agreement with the analysis of the 910–1060 cm−1 wavenumber range; a conventional protonation being unlikely at pH 8. Moreover, these observations validate the desorption of molybdate ions and further contradicts the assignment of the 802 and 817cm−1 bands to a bidentate surface complex. To explain the appearance of the band at 817 cm−1, one must take into account the deprotonation of the surface by hydroxyl ions responsible for the slight decrease in pH in this system. Indeed, as the evaporation of an aqueous NaOH solution is followed by an increase in the pH and the presence of lepidocrocite is reversing this trend, the concentration of HO− ions must decrease according to (1) but also according to the following:
While surprising, the consumption of hydroxide ion forces the pH to decrease to maintain the auto-ionization equilibrium of water. Therefore, the consumption of HO− ions slightly decreases the pH of the solution in contact with the lepidocrocite. Reaction (2) steers the system towards the interaction of sodium cations with the surface according to the following:
in the absence of adsorbate and
in presence of adsorbate. The surface ionic pair forms because of the drying stabilizing the surface complex and increasing its ν3 splitting [22]. The interaction of the sodium cations with the surface is mostly ionic and therefore can have multiple adsorption sites with neighboring charges [23,24]. This weak and non-directional interaction therefore increases the splitting of the ν3 bands without breaking the C3v symmetry of the monodentate complex in a similar fashion to sulfate OS complexes that see their ν3 bands shifted in correlation with the polarizing power of the surface they are bonded to [25,26]. In Figure 3, the wide band at ca. 905 cm−1 is superposed onto the band at 919 cm−1 as well as part of the 868 cm−1 band (solid/solution interface). The band at ca. 919 cm−1 corresponds exclusively to inner-sphere complexes (symmetric and asymmetric stretching) while the 868 cm−1 band was assigned to an OS complex. The bathochromic wing of the 868 cm−1 band in the spectrum of the solid/solution interface is not found at the solid/gas interface. All the conclusions in this paper obtained by studying the drying and subsequent washing of the molybdate adsorbed on lepidocrocite are summarized in Figure 4.
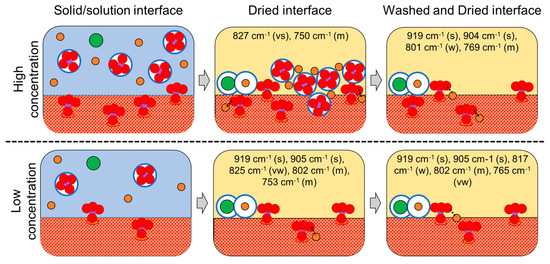
Figure 4.
Summary of the drying and washing/drying of the solid/solution interfaces of molybdates on lepidocrocite at high and low concentrations. Purple circles are Mo ions (associated with red oxygen atoms), orange sodium ions, and green chloride ions. The white circles with blue borders represent solvation spheres. Main bands are indicated for both interfaces before and after washing. Intensities (in parentheses): very strong (vs), strong (s), medium (m), weak (w), very weak (vw).
4. Conclusions
The drying chemistry of a basic solution of molybdates on lepidocrocite and its evolution with concentration has been elucidated. Polymerization has been found not to take place at the surface of lepidocrocite, despite the accumulation of monomolybdates on the surface. The precipitation of sodium molybdate has not been found to occur either. The addition of a washing step allows us to distinguish molybdates adsorbed as IS and OS complexes, the latter prevailing without any washing at high molybdate concentrations. The influence of molybdate concentration has been highlighted by the disappearance of OS complexes at lower Mo concentrations, with the adsorbate being mostly present as inner-sphere complexes. The surface of the substrate seems to be saturated by the molybdates upon the dehydration of the solid/solution interface. The surface speciation of molybdate ions at the surface of lepidocrocite has been proposed, with similar bands to those of the solid/solution interface with different assignments, i.e., monodentate binuclear IS complexes interacting with surface sodium ions.
This work is a first step toward the complete exploration of water-unsaturated systems and their transitions. It also provides spectroscopic proof of non-uniform dehydration (the adsorption/desorption of hydroxyls on the surface) which may be useful for further studies. The insights provided can be applied to heterogeneous catalyst preparation as well as in pollutant remediation in soils.
Supplementary Materials
The following supporting information can be downloaded at: https://www.mdpi.com/article/10.3390/colloids9050059/s1, Figure S1: diagram of the methodology; Table S1: Parameters of the Phreeqc simulation; Figure S2: Solid/solution interfaces superposed to their dried counterpart at same scale. Top: Mo-3 interface, bottom: Mo-4 interface; Figure S3: Evolution of pH during drying (A) of a solution of molybdate similar to those used in Mo-4, and (B) of the Mo-4 interface up to 99.9% of initial water evaporated. Conditions of the calculation are listed in Table S1. This buffering effect is most likely due to reactions of the hydroxide ions with the substrate’s surface [27].
Author Contributions
Conceptualization, R.B.; methodology, R.B.; validation, G.L.; formal analysis, R.B.; investigation, R.B.; writing—original draft preparation, R.B.; writing—review and editing, R.B. and G.L.; supervision, G.L.; funding acquisition, G.L. All authors have read and agreed to the published version of the manuscript.
Funding
Grant from Doctoral School 388 Chimie-Paris-Centre.
Data Availability Statement
The original contributions presented in this study are included in the article. Further inquiries can be directed to the corresponding author.
Conflicts of Interest
The authors declare no conflict of interest.
References
- Bourikas, K.; Kordulis, C.; Lycourghiotis, A. The role of the liquid-solid interface in the preparation of supported catalysts. Catal. Rev. 2006, 48, 363–444. [Google Scholar] [CrossRef]
- Kaiser, M.; Kleber, M.; Berhe, A.A. How air-drying and rewetting modify soil organic matter characteristics: An assessment to improve data interpretation and inference. Soil Biol. Biochem. 2015, 80, 324–340. [Google Scholar] [CrossRef]
- Yi, P.; Yan, Y.; Kong, Y.; Chen, Q.; Wu, M.; Liang, N.; Zhang, L.; Pan, B. The opposite influences of Cu and Cd cation bridges on sulfamethoxazole sorption on humic acids in wetting-drying cycles. Sci. Total Environ. 2023, 898, 165547. [Google Scholar] [CrossRef]
- Strawn, D.G. Sorption mechanisms of chemicals in soils. Soil Syst. 2021, 5, 13. [Google Scholar] [CrossRef]
- Kang, S.; Xing, B. Adsorption of Dicarboxylic Acids by Clay Minerals as Examined by in Situ ATR-FTIR and ex Situ DRIFT. Langmuir 2007, 23, 7024–7031. [Google Scholar] [CrossRef]
- Hug, S.J. In SituFourier transform infrared measurements of sulfate adsorption on hematite in aqueous solutions. J. Colloid Interface Sci. 1997, 188, 415–422. [Google Scholar] [CrossRef]
- Wang, X.; Wang, Z.; Peak, D.; Tang, Y.; Feng, X.; Zhu, M. Quantification of coexisting inner-and outer-sphere complexation of sulfate on hematite surfaces. ACS Earth Space Chem. 2018, 2, 387–398. [Google Scholar] [CrossRef]
- Thrane, J.; Falholt Elvebakken, C.; Juelsholt, M.; Lindahl Christiansen, T.; Jensen, K.M.Ø.; Pilsgaard Hansen, L.; Fahl Lundegaard, L.; Vie Mentzel, U.; Thorhauge, M.; Degn Jensen, A.; et al. Highly stable apatite supported molybdenum oxide catalysts for selective oxidation of methanol to formaldehyde: Structure, activity and stability. Chemcatchem 2021, 13, 4054–4075. [Google Scholar]
- Das, S.; Hendry, M.J. Adsorption of molybdate by synthetic hematite under alkaline conditions: Effects of aging. Appl. Geochem. 2013, 28, 194–201. [Google Scholar] [CrossRef]
- Schwertmann, U.; Cornell, R.M. Iron Oxides in the Laboratory: Preparation and Characterization, 2nd ed.; VCH: Vancouver, BC, Canada, 2000. [Google Scholar]
- Parkhurst, D.L.; Appelo, C.A.J. User’s Guide to PHREEQC (Version 2)—A Computer Program for Speciation, Batch Reaction, One-Dimensional Transport, and Inverse Geochemical Calculations; Water-Resources Investigations Report; U.S. Geological Survey: Reston, VA, USA, 1999. [Google Scholar] [CrossRef]
- Botella, R.; Lefèvre, G. A deep look into the diverse surface speciation of the mono-molybdate/lepidocrocite system by ATR-IR and polarized ATR-IR spectroscopy. Colloid Surf. 2022, 647, 129065. [Google Scholar]
- Botella, R. Impact de l’Hydratation/Déshydratation sur la Spéciation de Surface d’Espèces Adsorbées. Ph.D. Thesis, Paris Sciences et Lettres University, Paris, France, 2020. [Google Scholar]
- Davantés, A.; Lefévre, G. In situ characterization of (poly)molybdate and (poly)tungstate ions sorbed onto iron (hydr)oxides by ATR-FTIR spectroscopy. Eur. Phys. J. Spec. Top. 2015, 224, 1977–1983. [Google Scholar] [CrossRef]
- Davantés, A.; Lefévre, G. In situ real time infrared spectroscopy of sorption of (poly) molybdate ions into layered double hydroxides. J. Phys. Chem. 2013, 117, 12922–12929. [Google Scholar] [CrossRef]
- Asay, D.B.; Kim, S.H. Evolution of the adsorbed water layer structure on silicon oxide at room temperature. J. Phys. Chem. 2005, 109, 16760–16763. [Google Scholar] [CrossRef]
- Rau, S.M.; Hirsch, R.J.; Junige, M.; Cavanagh, A.S.; Rotondaro, A.L.; Paddubrouskaya, H.; Abel, K.H.; George, S.M. Strongly and Weakly Adsorbed H2O Layer Thicknesses on Hydroxylated SiO2 Surfaces versus H2O Pressure at Various Substrate Temperatures. J. Phys. Chem. 2025, 129, 1666–1677. [Google Scholar] [CrossRef]
- Connor, P.A.; McQuillan, A.J. Phosphate Adsorption onto TiO2 from Aqueous Solutions: An in Situ Internal Reflection Infrared Spectroscopic Study. Langmuir 1999, 15, 2916–2921. [Google Scholar] [CrossRef]
- Nie, J.; Ren, Z.; Xu, L.; Lin, S.; Zhan, F.; Chen, X.; Wang, Z.L. Probing contact-electrification-induced electron and ion transfers at a liquid–solid interface. Adv. Mater. 2020, 32, 1905696. [Google Scholar] [CrossRef]
- Wu, C.H.; Kuo, C.Y.; Lin, C.F.; Lo, S.L. Modeling competitive adsorption of molybdate, sulfate, selenate, and selenite using a Freundlich-type multi-component isotherm. Chemosphere 2002, 47, 283–292. [Google Scholar] [CrossRef]
- Davantès, A.; Costa, D.; Lefèvre, G. Molybdenum(VI) Adsorption onto Lepidocrocite (γ-FeOOH): In Situ Vibrational Spectroscopy and DFT+U Theoretical Study. J. Phys. Chem. 2016, 120, 11871–11881. [Google Scholar] [CrossRef]
- Borowski, S.C.; Biswakarma, J.; Kang, K.; Schenkeveld, W.D.; Hering, J.G.; Kubicki, J.D.; Kraemer, S.M.; Hug, S.J. Structure and reactivity of oxalate surface complexes on lepidocrocite derived from infrared spectroscopy, DFT-calculations, adsorption, dissolution and photochemical experiments. Geochim. Cosmochim. Acta 2018, 226, 244–262. [Google Scholar] [CrossRef]
- Ritzhaupt, G.; Devlin, J.P. Infrared spectra of matrix isolated alkali metal perchlorate ion pairs. J. Chem. Phys. 1975, 62, 1982–1986. [Google Scholar] [CrossRef]
- Larmier, K.; Chizallet, C.; Cadran, N.; Maury, S.; Abboud, J.; Lamic-Humblot, A.F.; Marceau, E.; Lauron-Pernot, H. Mechanistic investigation of isopropanol conversion on alumina catalysts: Location of active sites for alkene/ether production. ACS Catal. 2015, 5, 4423–4437. [Google Scholar] [CrossRef]
- Vittadini, A.; Selloni, A.; Rotzinger, F.P.; Grätzel, M.J. Formic Acid Adsorption on Dry and Hydrated TiO2 Anatase (101) Surfaces by DFT Calculations. Phys. Chem. 2000, 104, 1300–1306. [Google Scholar] [CrossRef]
- Müller, K.; Lefèvre, G. Vibrational characteristics of outer-sphere surface complexes: Example of sulfate ions adsorbed onto metal (hydr) oxides. Langmuir 2011, 27, 6830–6835. [Google Scholar] [CrossRef]
- Wang, L.; Giammar, D.E. Effects of pH, dissolved oxygen, and aqueous ferrous iron on the adsorption of arsenic to lepidocrocite. J. Colloid Interface Sci. 2015, 448, 331–338. [Google Scholar] [CrossRef] [PubMed]
Disclaimer/Publisher’s Note: The statements, opinions and data contained in all publications are solely those of the individual author(s) and contributor(s) and not of MDPI and/or the editor(s). MDPI and/or the editor(s) disclaim responsibility for any injury to people or property resulting from any ideas, methods, instructions or products referred to in the content. |
© 2025 by the authors. Licensee MDPI, Basel, Switzerland. This article is an open access article distributed under the terms and conditions of the Creative Commons Attribution (CC BY) license (https://creativecommons.org/licenses/by/4.0/).