Article

Characterization of the Dissolution of Water Microdroplets in Oil

1
Department of Biological Physics, ELTE Eötvös Loránd University, 1117 Budapest, Hungary
2
Nanobiosensorics Laboratory, Centre for Energy Research, Institute of Technical Physics and Materials Science, 1121 Budapest, Hungary
3
CellSorter Company for Innovations, 1037 Budapest, Hungary
4
MTA-ELTE Statistical and Biological Physics Research Group, Eötvös Loránd Research Network (ELKH), 1117 Budapest, Hungary
*
Author to whom correspondence should be addressed.
Colloids Interfaces 2022, 6(1), 14; https://doi.org/10.3390/colloids6010014
Submission received: 30 December 2021 / Revised: 25 January 2022 / Accepted: 1 February 2022 / Published: 14 February 2022

Abstract

:
Water in oil emulsions have a wide range of applications from chemical technology to microfluidics, where the stability of water droplets is of paramount importance. Here, using an accessible and easily reproducible experimental setup we describe and characterize the dissolution of water in oil, which renders nanoliter-sized droplets unstable, resulting in their shrinkage and disappearance in a time scale of hours. This process has applicability in creating miniature reactors for crystallization. We test multiple oils and their combinations with surfactants exhibiting widely different rates of dissolution. We derived simple analytical equations to determine the product of the diffusion coefficient and the relative saturation density of water in oil from the measured dissolution data. By measuring the moisture content of mineral and silicone oils with Karl Fischer titration before and after saturating them with water, we calculated the diffusion coefficient of water in these two oils.

1. Introduction

Water in oil (w/o) emulsions consist of a continuous oil phase with dispersed water droplets. Such arrangements are common both in industrial and laboratory settings [1,2]. Droplet microfluidics uses w/o emulsions for containing reagents and chemical reactions such as polymerase chain reaction (PCR) and others for DNA/RNA sequencing [3,4]. The droplet-based approach has several advantages, mainly that the volume of the droplets not only matches the desirable size range for single-cell manipulations, but it also minimizes the amount of reagents needed. Such setups have been successfully commercialized and they proved to be a revolutionary tool in single-cell analysis [5] enabling the development of lab-on-a-chip devices [6] that are capable of integrating entire bioassay workflows on handheld microfluidic chips. Specifically, many systems use sessile aqueous droplets printed by microfluidic robots [7]. These applications center around the printing of aqueous droplets under oils for protein engineering [8], genome amplification by PCR [9] and transpriptomics [10].
Additive manufacturing, i.e., three dimensional printing of various materials has been gaining tremendous momentum in recent years. Regenerative medicine applying tissue engineering can greatly benefit from this revolution through technologies such as bioprinting of tissues or organs [11]. To achieve single cell resolution in bioprinting, several droplet printing solutions has been proposed with the ultimate goal of trapping single-cells inside subnanoliter sized droplets [12,13]. The time scale of keeping single cells in tiny droplets can vary from a few seconds to several hours or days in long term assays.
Once created, the volume of the droplets needs to stay constant for the entire duration of the workflow without merging or breaking up. If the volume were to change during an assay or experiment, the concentration of reagents in the droplet would be altered, thus, one of the fundamental functions of the carrier oil (volume conservation by impeding evaporation) would diminish.
Merging is an important issue in a dense emulsion, when the overall volume of the water is comparable to that of the oil [14,15]. In these systems there is a physical contact between the interfaces of the droplets that needs to be stabilized by the addition of surfactants [16]. These amphipathic substances associate on the oil/water interface and prevent the coalescence of droplets.
Without any protective oil layer, sessile droplets rapidly evaporate into the atmosphere. This process has been investigated in depth both theoretically [17] and experimentally [18,19]. In general, two modes of evaporation from a solid surface have been identified: in the so-called ’pinning’ mode the contact area of the droplet formed with the solid surface is constant, while the contact angle decreases, whereas in the ’shrinking’ mode, the contact area shrinks, while the contact angle remains unchanged. A mixed mode where both quantities are simultaneously diminishing has also been described and experimentally observed [19].
To stabilize the volume of droplets, cover oils can be used. Although water and oil molecules are immiscible due to their polar and apolar nature, a small degree of water dissolution does occur in oil. This phenomenon usually can be neglected for macroscopic droplets, however, micrometer scale droplets exhibit a gradual loss of volume over time in an unsaturated oil. Mass transfer of a liquid droplet into another miscible liquid has been modeled theoretically by Epstein and Plesset [20] inspiring several experimental studies [21,22]. Schmitt et al. considered the mass transfer of water droplets in an immiscible oil environment with added emulsifier (Span80) [23]. They found that the droplet surface exhibited spontaneous microstructure formation decreasing the volume and distorting the shape of the initially spherical droplets. In a study by Rodríguez-Ruiz et al. nanoliter sized droplets of NaCl solution under silicone oil were found to dissolve in a mixed mode [24].
While in most microfluidic devices the stability of the emulsion is needed, some applications require shrinking droplets, the volume of which decreases in a controlled manner. In such systems a high level of control over the dissolution rate of droplets is desirable. The theory behind the dissolution of microdroplets in various immiscible liquids has been established over the years [25]. When droplets under oil contain an aqueous solution, the loss of water through dissolution leads to increasing solute concentration and potentially to crystallization [26,27], although the concentration of the solute is known to modify the rate of shrinking [28,29]. Therefore, dissolving microdroplets show great promise in their applicability as miniature reactors for solvent-diffusion-driven crystallization to produce protein crystals or solid drug dosages [30,31]. Furthermore, diffusion of water into the surrounding oil phase on a microfluidic chip has been used to create hydrogel microparticles with a homogeneous and modifiable size distribution [32].
Regardless of the application, any oil used in microfluidics needs to comply with some basic requirements such as chemical inertness, biocompatibility, good optical qualities (transparency) and the existence of compatible surfactants. The most popular oils that fulfill the above requirements are mineral, silicone, and fluorinated oils [16].
In the present paper we investigate the long-term behavior of water droplets in sparse w/o emulsions. Emulsions in various oils were generated using a simple rotating fluid-based method. Subsequently, the droplets were imaged by time-lapse microscopy and a modified contact angle measurement setup to investigate the evolution of their shape descriptors. We provide a straightforward and easily reproducible workflow for the experimental characterization of sessile droplet dissolution. We show that when the droplets are hemispherical, the product of the diffusion coefficient and the saturation density can be analytically calculated.
By measuring the saturation density of the oils with Karl Fischer titration, we determined the diffusion coefficient of water in mineral and silicone oils. When both the diffusion coefficient and the saturation density are known, our method can predict the dissolution rate, which is useful in designing experiments with sessile droplets under cover oils. Our results can be exploited in droplet microfluidics, droplet printing, and to design well controlled, concentration-dependent reactions in nanoliter volumes, e.g., for solvent-diffusion-driven crystallization.

2. Materials and Methods

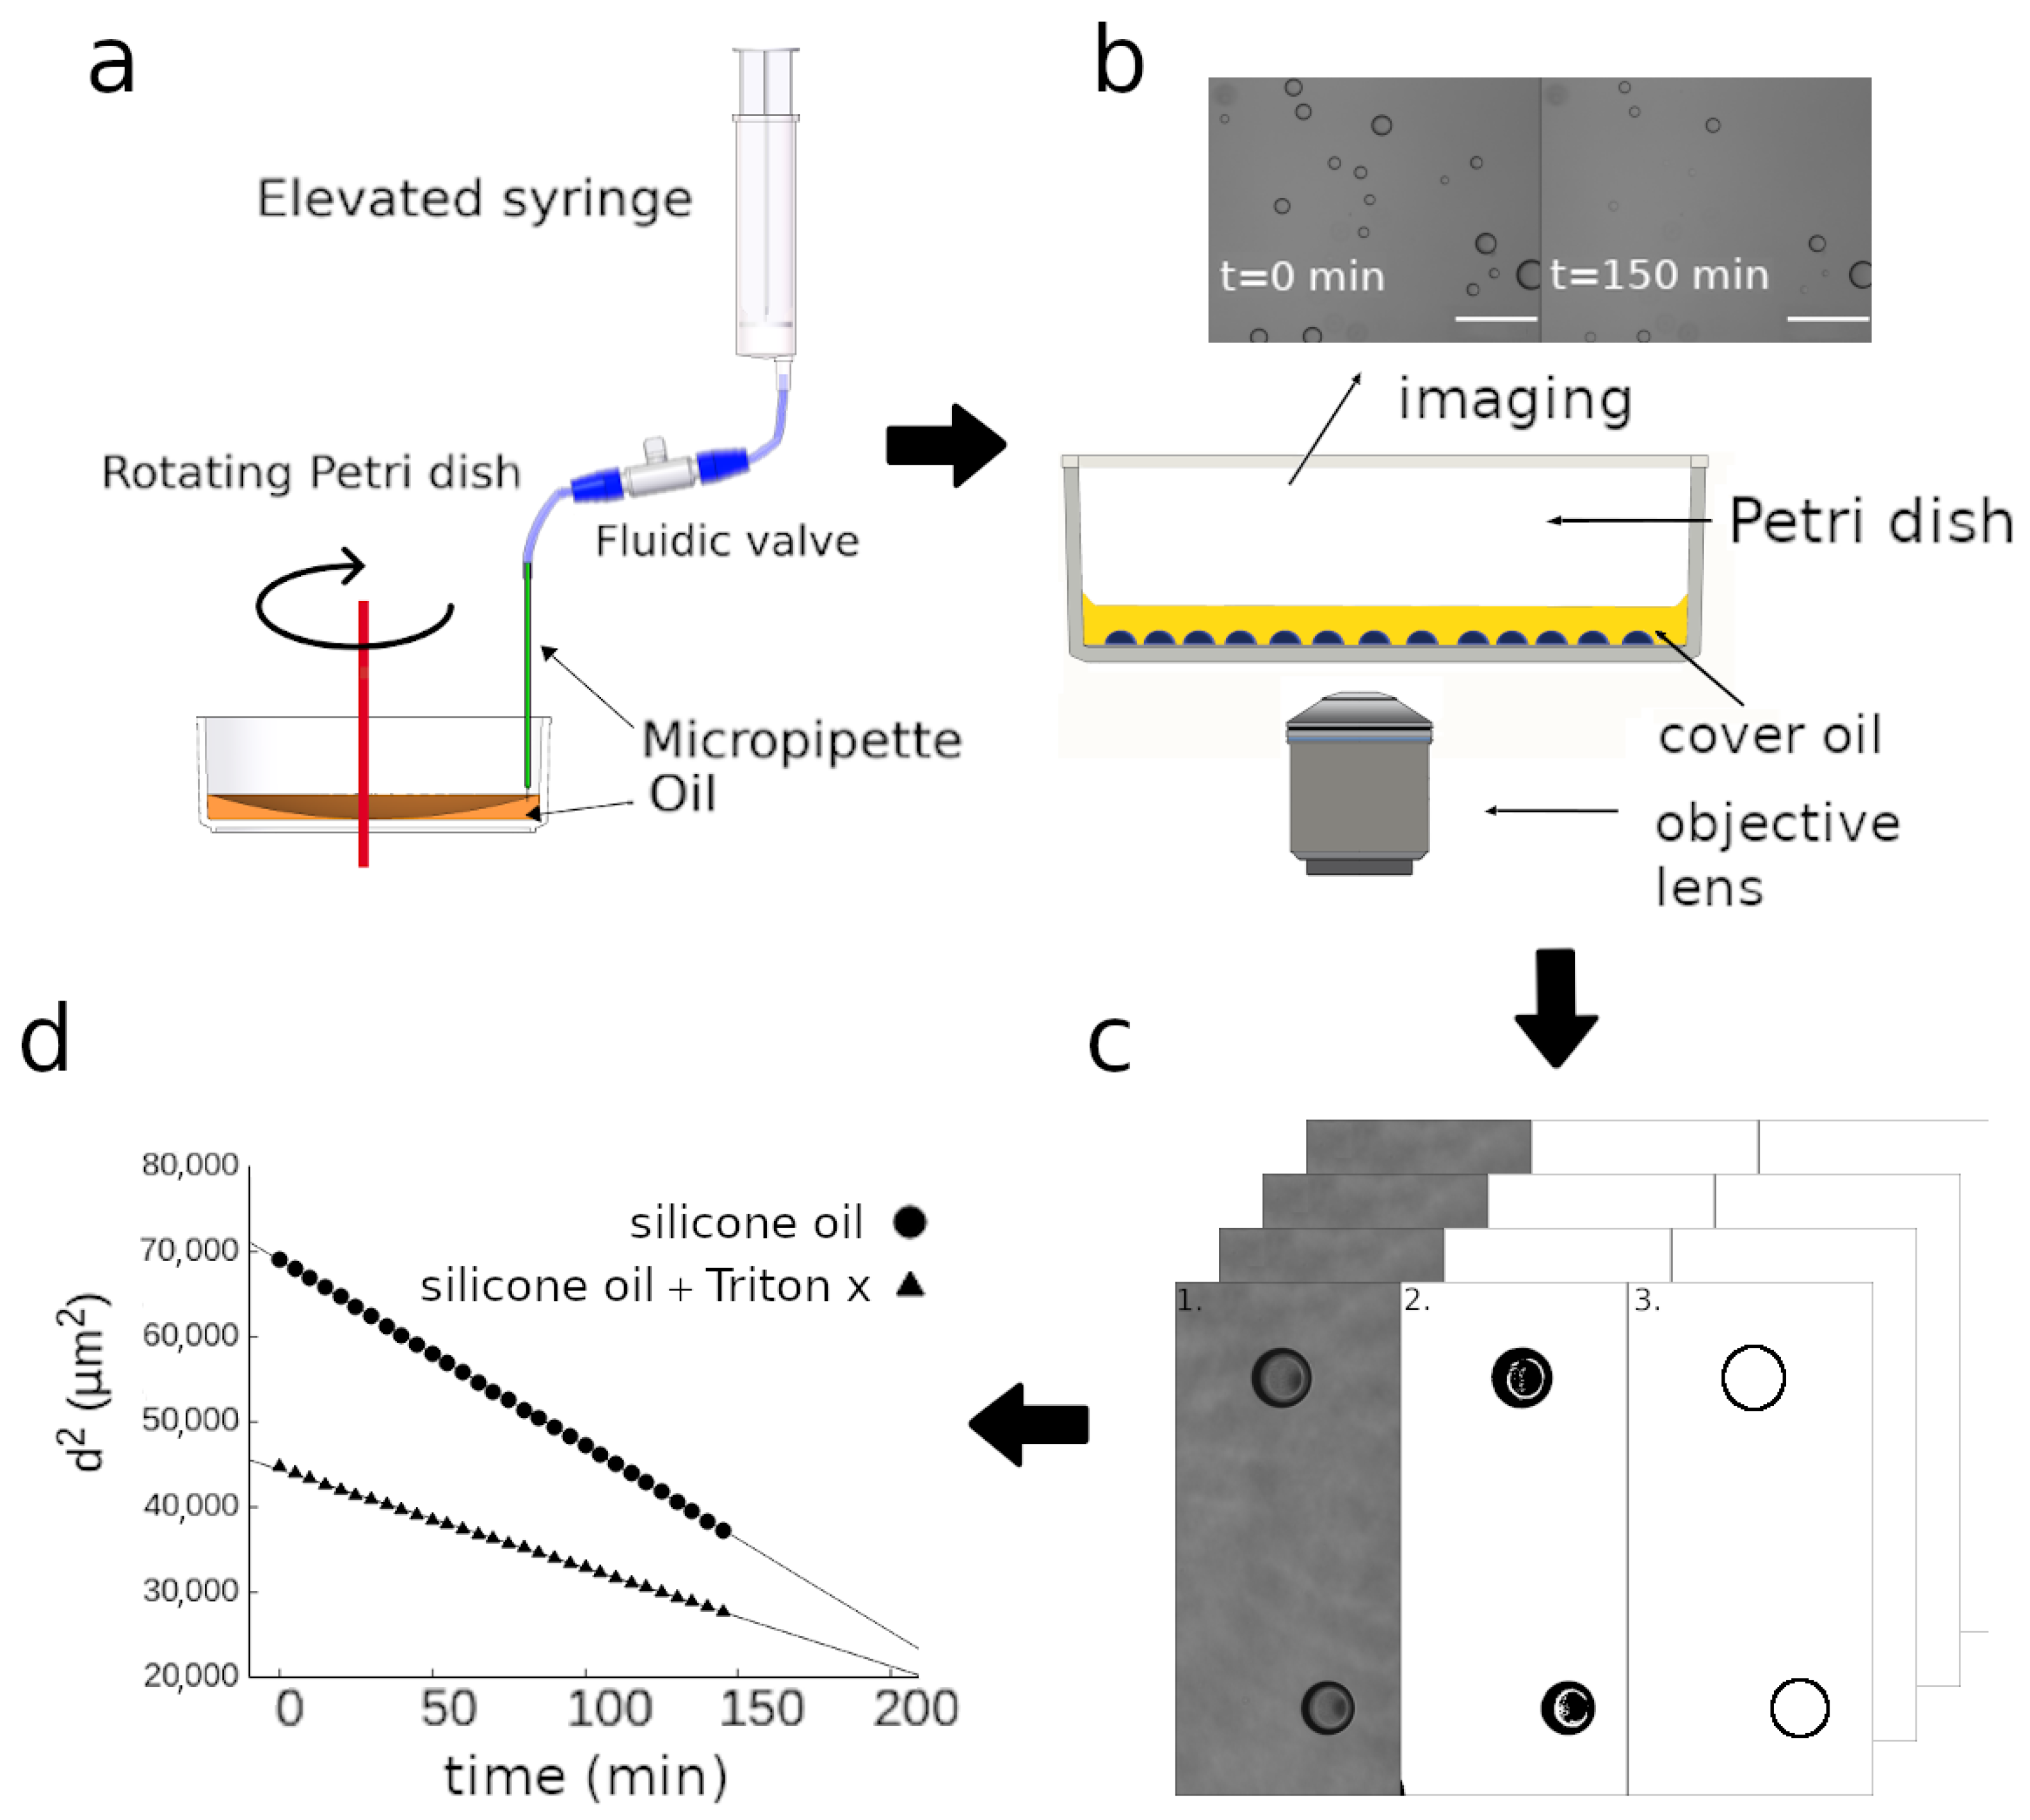
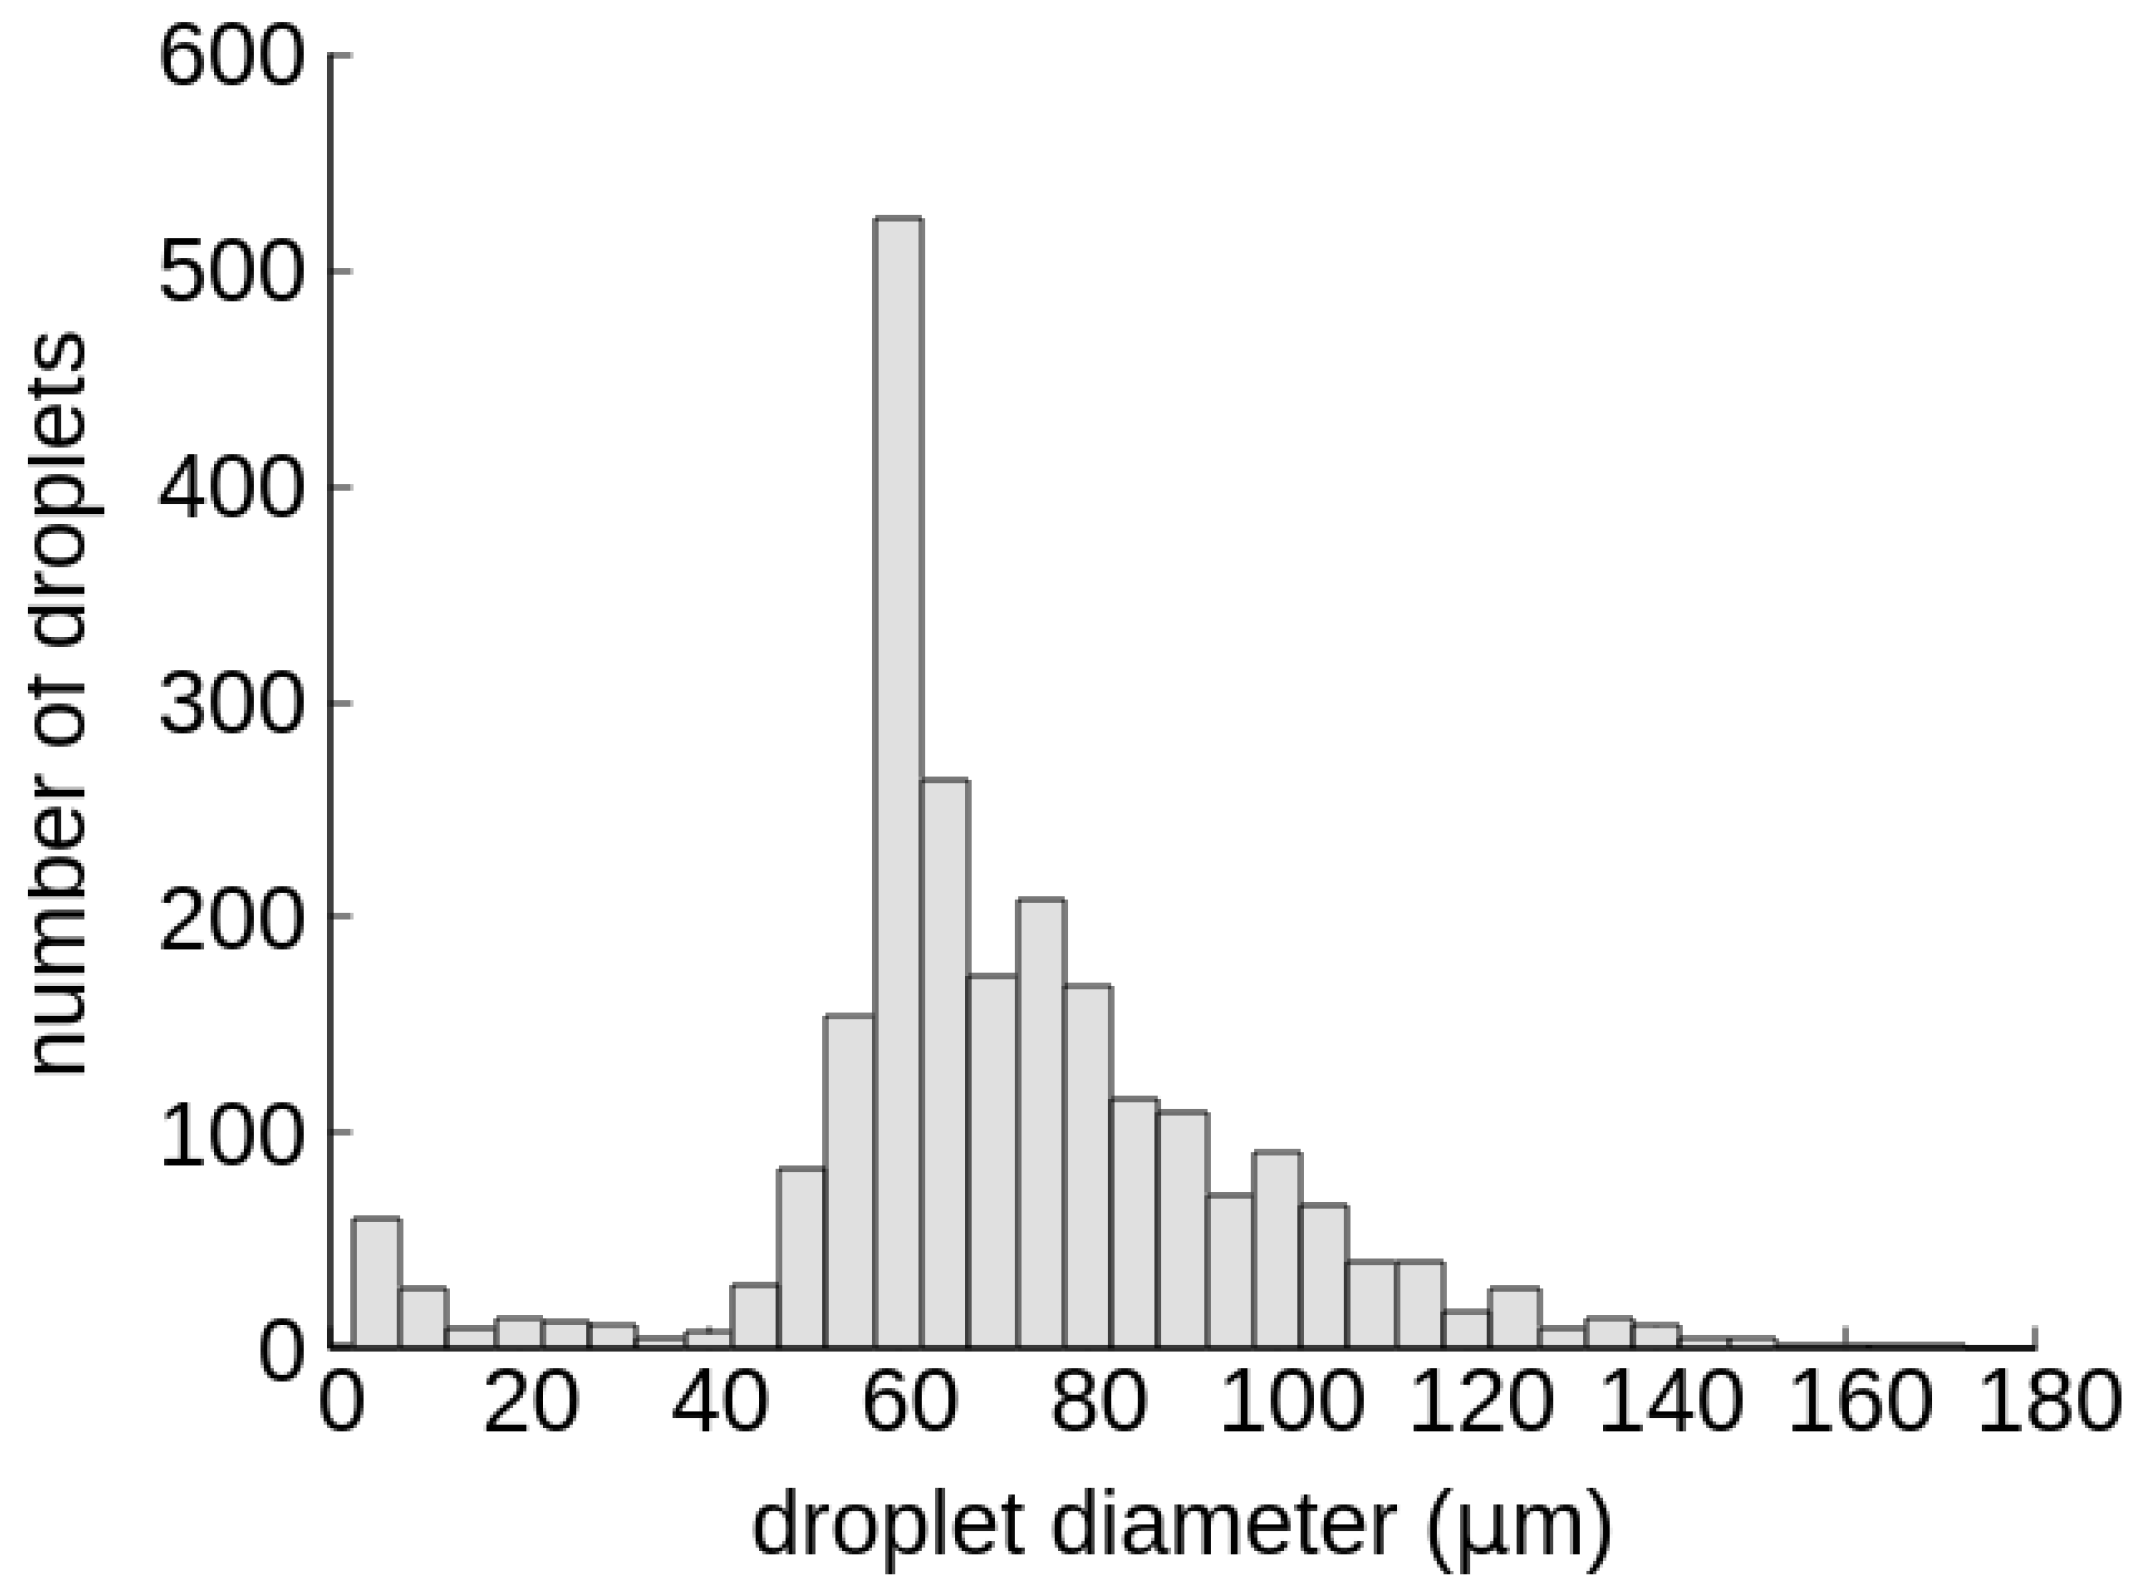
2.1. Droplet Generation

Water in oil emulsions were generated using a rotating fluid-based method (similar to [33]) illustrated in Figure 1a. We repeated each droplet generation experiment at least three times. A standard plastic, hydrophobic Petri dish (Greiner Bio-One, Mosonmagyaróvár, Hungary) with a diameter of 35   m m was placed onto a rotating platform, then filled with 1   m L oil using a handheld pipette. The following oils were investigated: mineral oil (Sigma M8410, density: 0.85 g/mL), mineral oil mixed with 0.5   ( vol % ) Span80, silicone oil (AR 20, density: 1.01 g/mL ) and silicone oil mixed with 0.2   ( vol % ) Triton X-100. We chose two widely used oils and those corresponding surfactants that are exploited frequently in microfluidic applications. The stabilizing properties of these non-ionic surfactants were investigated and compared in a water-in-diesel emulsion system [34]. All materials were purchased from Sigma-Aldrich, Hungary unless otherwise stated. The custom made platform was rotated by a PC fan (Coolink). Frequency of spinning was monitored by the tachometric output of the fan. We applied 360 rotations per minute (rpm) corresponding to a speed of 37   c m / s at the tip of the micropipette to achieve appropriate droplet size. The higher rotation speed resulted in smaller droplets.
Once the dish was spinning, a glass micropipette (inner diameter d = 50   μ m ) was immersed into the oil from above to a depth of max 1   m m and a distance from the axis of rotation of 1   c m . The other end of the micropipette was connected to an elevated plastic syringe through a PTFE tube with an inner diameter of 1 mm, interrupted by a normally closed valve. The entire fluidic system was filled with deionized water (Seralpur AP30, Seral). After immersing the tip of the micropipette in the oil, the valve was opened for one minute. During this time, a flow commenced through the micropipette due to the applied hydrostatic pressure of 2500   Pa . As the water entered the rotating oil from the micropipette, it was separated into nanoliter scale droplets by the shear force acting on its surface. After one minute, the micropipette was removed from the oil, the rotation was stopped, and the Petri dish with the droplets inside was placed onto the microscope for time-lapse analysis (Figure 1b).
The oil layer in the Petri dish was 1   m m thick with its top surface exposed to the room temperature (23 °C), unsaturated air. Using such a setup, water molecules can diffuse from the oil to the air. This condition ensures the permanent low concentration of dissolved water in oil at this surface. Using dry air or nitrogen above the dish can further improve the precision of the experiment.

2.2. Time-Lapse Analysis

To investigate the generality of our observations and identify any surfactant-induced effect, droplets under different oil mixtures were imaged in time-lapse mode on an inverted microscope. Time-lapse recordings of the droplets were executed using an inverted microscope (Zeiss Axio Observer) equipped with a 10× EC Plan Neofluar objective, CMOS camera (Andor Zyla 5.5) and motorized stage (Marzhauser). The Petri dish with the w/o emulsion inside was placed onto the sample holder. Subsequently, fields of view (FoVs) with surface attached drops were identified and time-lapse imaging was programmed using the CellSorter software. Each FoV was recorded in brightfield mode every 5 min for a period of time that varied by experiment. For each FoV we used an auto-focusing algorithm to follow the equator of the droplets moving out of the focal plane as they shrank. A z-stack of three images was captured with a distance of 5   μ m between the z-planes. Software chose the sharpest z-plane. The recorded images were stored for later analysis.
To determine the change of shape of the droplets from a side view, a custom developed contact angle measurement setup (Plósz Mérnökiroda Ltd, Budapest, Hungary) was used. A glass cuvette was filled with oil and a separated Petri dish bottom was placed into it. This was necessary in order to have the drops attach to the same surface as in the experiments with the inverted microscope described above. Water droplets were generated manually under the oil using a glass micropipette with an inner diameter of 50   μ m . Once a droplet with a size in the target range (≈ 500   μ m ) sedimented onto the surface, the magnifying optics was focused and the time-lapse imaging was started. Images were recorded every 15 min for a period of several days until the examined droplet completely disappeared.

2.3. Image Analysis

Time-lapse images were analyzed with the ImageJ software [35]. Using an inverted microscope we could measure the diameter of the droplets with a shape of a spherical cap from a bottom view. Every field of view was treated as an image sequence in which the changing diameter of the droplets needs to be determined on each frame. First, the region of interest (RoI) in a given FoV was cut out (Figure 1c, step 1). Afterwards, a threshold was applied to each image using the Triangle algorithm [36], which separated the droplets from the background resulting in a binary image (Figure 1c, step 2). Subsequently, the built-in particle analyzer algorithm of ImageJ was applied to identify the droplets (Figure 1c, step 3) and measure their diameter. The recorded values of diameter were then plotted against time and further analyzed (Figure 1d).
In case of the contact angle measurement, we used the DropSnake plugin [37] to analyze the side view images of the droplets (see Figure S1). Contact angles were extracted every 2.5   h . Around 8 points along the outline of the droplets were manually highlighted and then the edge was automatically fit by the algorithm. The contact diameter on the solid surface, the droplet diameter, and the left and right contact angles were calculated. The average of these two angles was accepted as the final contact angle value.

2.4. Moisture Determination of Oils

We determined the moisture content of the mineral and silicone oils both in their factory qualities and after saturation them with water. We saturated 20 mL of the oils by mixing them with deionized water with a magnetic stirrer (Biosan MSH 300) in a closed 50 mL upside down centrifuge tube at room temperature for more than 24 h. The water to oil ratio was 50% in the tube. We used the maximum 1250 RPM speed of the stirrer to achieve an oil droplet size smaller than 1 mm . We centrifuged the saturated oils 2 times at 300× g for 10 min to remove the remaining water droplets.
Moisture content of the oils was measured in a Kyoto MKS-500 Karl Fischer moisture titrator.

3. Results

3.1. Time-Lapse Analysis of Droplets

Generation of droplets was executed as described above. In a typical run 2000–5000 droplets were generated with a relatively narrow size distribution (Figure 2).
Then the hydrophobic Petri dish containing the w/o emulsion of thousands of droplets was placed onto an inverted microscope and let to sediment for 5   min . Time-lapse images were recorded to simultaneously observe multiple, similarly sized droplets under the same conditions. The change of the diameter of six individual water droplets under mineral oil can be seen in Figure 3a. Supplementary Video S1 shows the phenomenon in case of two droplets. A perfect immiscibility between water and oil would dictate a constant size, however, time-lapse recordings show a gradual dissolution of the droplets. As indicated by a representative curve, the decrease in the diameter d ( t ) of the droplets from a bottom view occurs in three distinct stages (labeled with numbers 1–3) beginning with a linear decrease, followed by a stagnating phase, and ending with a rapid decrease (Figure 3b). In order to better understand this phenomenon, we executed another type of experiment: a water droplet placed under mineral oil was imaged from side view using a contact angle measurement setup. In both experiments the droplets were deposited on a hydrophobic plastic Petri dish surface, exhibiting an initial contact angle higher than 90 . The change of the contact angle and the contact diameter imaged from a side view can be seen in Figure 4. It is apparent that the contact area between the droplet and the surface does not change in phases 1–2, but it quickly shrinks in the final phase 3 of droplet dissolution.
According to these results a model can be proposed for the dissolution of the droplets and the change of their shape descriptors. During the entire process, the droplet shape can be described as a spherical cap sitting on a flat surface. In phase 1 the radius of the droplet decreases gradually due to the loss of droplet volume. In this phase the contact angle decreases, as well. Since the contact area does not change (Figure 4.), this phase corresponds to the pinning mode of evaporation (Figure 5, phase 1). Phase 2 begins when the contact angle reaches 90 . At this point the droplet is a hemisphere. Then the contact angle and volume of the droplet keep decreasing but with a constant diameter of its vertical projection being equal to the contact diameter (Figure 5, phase 2). In phase 3, the contact surface area rapidly shrinks together with the contact angle until complete dissolution. Thus this phase corresponds to a mixed mode (Figure 5, phase 3), whereas phases 1 and 2 correspond to the pinning mode of dissolution.
According to the empirical theory proposed by Picknett [17] and Erbil [19] for spherical droplets, the two third power of the volume of the droplets ( V 2 / 3 ) should show a linear decrease in time. Thus, the square of the droplet diameter ( d 2 ) is also expected to show a linear decrease in phase 1. This behaviour has indeed been reproduced by our time-lapse measurements for all four oil mixtures we studied in depth as Figure 6 demonstrates. Droplets on a glass surface showed identical behaviour (Supplementary Video S3). In phase 1 both the volume and the contact angle of the droplets can be calculated from the measurements carried out on the inverted microscope (Figures S2–S4). However, the radius of the spherical cap in phase 2 and 3 cannot be easily measured using this setup. We could follow this radius until the end of the process using the contact angle measurement device. Interestingly, this quantity has a minimum when the shape of the droplet is a hemisphere (Figure S5).
It is apparent, that the droplet size decreased significantly faster in silicone oil than in mineral oil. The presence of surfactants did not impede dissolution. Amphiphilic molecules present in the oils are expected to form a monolayer on the oil-water interface but do not block water molecules to diffuse out of the droplet. However, according to our results their presence appears to affect the dissolution rate of the droplets providing an opportunity to fine-tune the process.
We observed spontaneous microstructure formation on the surface of the water droplets in oils containing surfactant (Figure S6). During the dissolution process the droplet surface became cloudy and dark, exhibiting a rough morphology resembling the observations by Schmitt et al. [23].

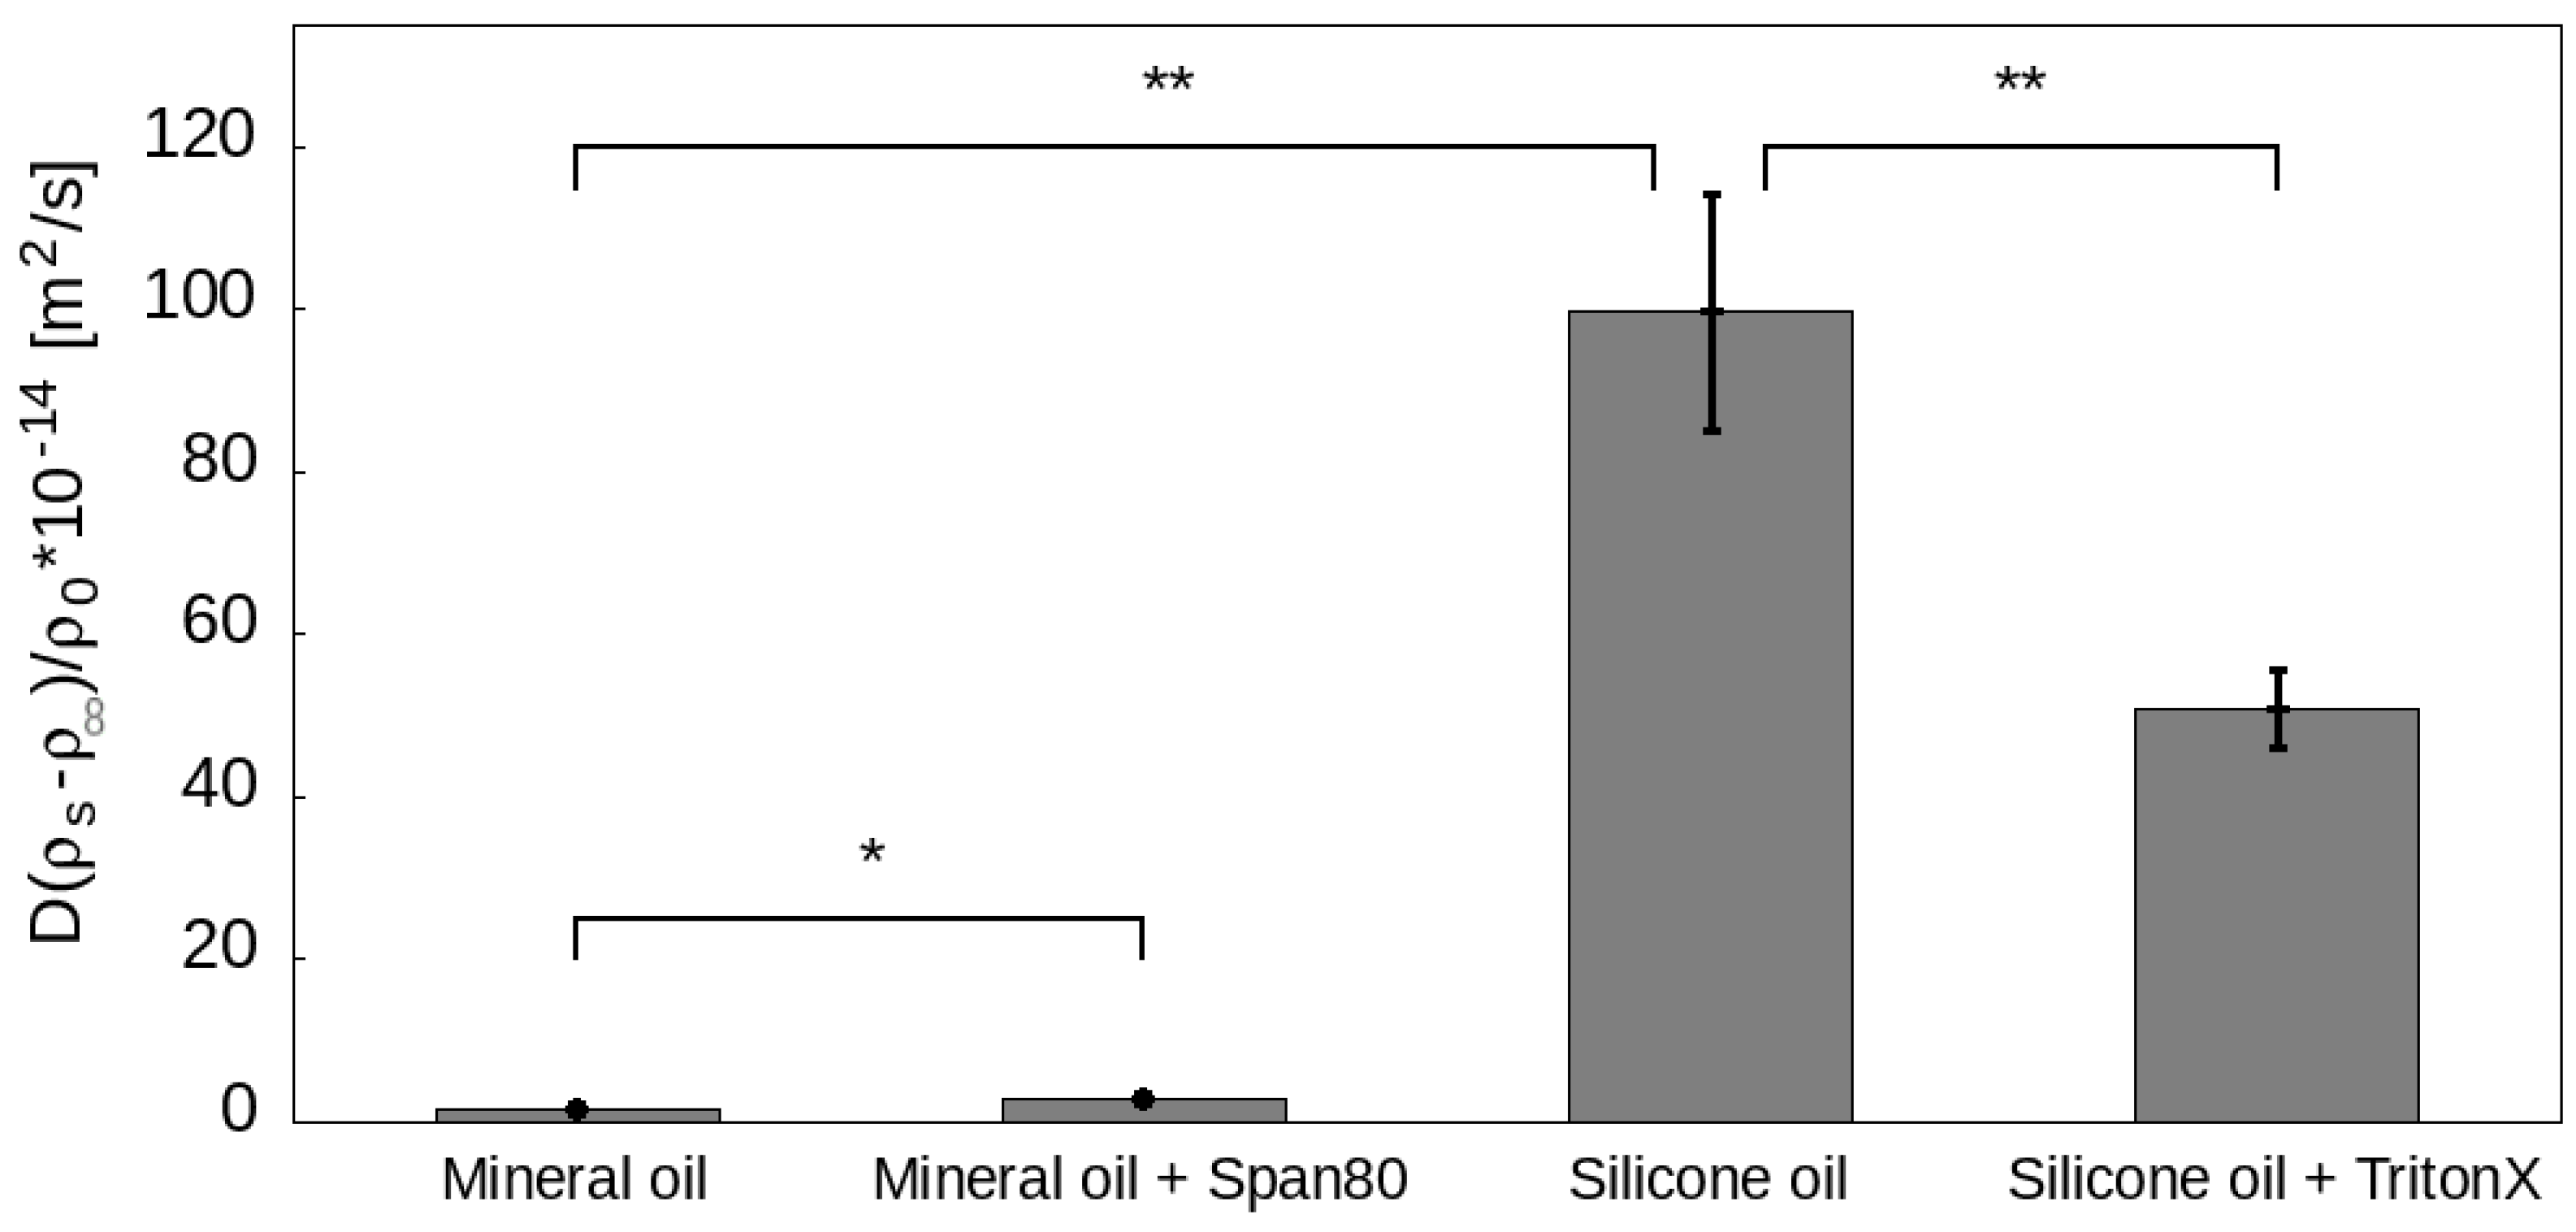
3.2. Calculation of the Diffusion Coefficient and Saturation Density

The measurements presented here allow us to calculate some of the physical parameters characterizing the diffusion and solubility of water in oil. Water diffusion can be described by the diffusion equation
ρ ( x , t ) t = D Δ ρ ( x , t ) ,
where ρ ( x , t ) denotes the mass density of water as a function of space ( x ) and time (t); and D is its diffusion coefficient. Assuming stationarity (which is a good approximation if the oil-water interface moves much slower than the speed of the diffusion over the length-scale of the droplet) the diffusion equation simplifies to Laplace’s equation:
Δ ρ ( x ) = 0 .
For a spherical droplet or, equivalently, when a hemispherical droplet is sitting on the side of a half-space (as is the case at the end of phase 1 in our experiments) the most suitable choice for the coordinate system is the spherical one. Denoting the radial coordinate by r, Laplace’s equation can be expressed as
1 r 2 r r 2 r ρ ( r ) = 0 .
Its solution that satisfies the boundary conditions ρ ( ) = ρ and ρ ( R ) = ρ s , where R is the radius of the droplet and ρ s is the saturation density of water is
ρ ( r ) = R ( ρ s ρ ) r + ρ .
The mass flux density from Fick’s first law can be determined as
j ( r ) = D r ρ ( r ) = D R ( ρ s ρ ) r 2 ,
which, at the droplet boundary becomes
j ( R ) = D ( ρ s ρ ) R .
Effect of capillary pressure on the saturation density can be neglected as the droplet size is orders of magnitude larger than the size of water molecules [38]. (For details see Section 5 in the Supplementary Materials.) This mass flux density can be directly determined from the time-lapse measurements. Close to the time point when the shape of the droplet is a hemisphere (which is equivalent to a sphere in the full space), the mass flux density is:
j ( R ) = ρ 0 1 A d V d t = ρ 0 2 π R 2   ·   2 π R 2 d R d t = ρ 0 d R d t
where ρ 0 10 3   k g / m 3 is the density of bulk water, and A and V denote the area and volume of the droplet of radius R, respectively. Plugging this expression into Equation (6) results in
2 D ρ s ρ ρ 0 = 2 R d R d t = d R 2 d t ,
which shows, in agreement with Figure 6, that R 2 decreases linearly with time at a rate of
2 D ρ s ρ ρ 0 .
Measuring this rate provides the values of D ( ρ s ρ ) / ρ 0 for the four different cover oils investigated (see Table 1). This quantity characterizes the stability of the water droplets through two fundamental physical parameters: the diffusion coefficient and the saturation density of water in the specific oil. The results presented in Figure 6 and summarized in Figure 7 show that different oils can exhibit significantly different dissolution characteristics. Interestingly, the presence of a surfactant can change droplet stability in contrasting ways. In case of mineral oil, the rate of dissolution was increased by the presence of the surfactant Span80, while for silicon oil, it was decreased by a factor of 2 by the surfactant Triton X-100.
We measured the moisture content of mineral and silicone oils with Karl Fischer titration before and after saturating them with water as shown in Table 2. We calculated the diffusion coefficient of water in these two oils on the basis of Equation (9) resulting in 2.8 and 8.6 × 10 10   m 2 / s for the mineral and silicone oil, respectively.

4. Discussion

In the current work, we focused on observing and interpreting the dissolution of aqueous droplets under oils that are widely used in droplet-based microfluidics. We generated nanoliter-sized water droplets dispersed in oil and observed that they gradually shrank and disappeared in a few hours. Using an easily reproducible and low-cost setup based on a spinning Petri dish to generate the nanoliter scale droplets and an inverted microscope to observe them, we monitored the contact radius and the volume of droplets, without the need for specialized droplet printing equipment. A handful of previous experiments examined the effect of soluble components in the aqueous droplets, which bears great importance for diffusion-driven crystallization applications [26,27]. As a complementary approach, we examined the effect of surfactants added to the oil phase. We chose the most widely used combinations, namely 0.5   ( vol % ) Span80 with mineral oil and 0.2   ( vol % ) Triton X-100 with silicone oil. We found that the addition of surfactants significantly changed the dissolution rate of droplets, however, the loss of volume was not impeded. The given dissolution rate values (Table 1) can help to choose the most suitable cover oil and surfactant for experimental designs with sessile droplets.
The presence of a surfactant could increase or decrease the dissolution rate. According to Equation (9) we explain the net effect of the surfactant by two parameters. It can modify both the diffusion coefficient and the saturation density of water in the oil phase. While the diffusion coefficient is expected to be lowered [39], saturation concentration may be increased.

5. Conclusions

Diffusion coefficient is a crucial parameter in surface and colloid sciences and corresponding applications. Determination of the diffusion coefficient of water in hydrophobic materials including oils can prove challenging and take several hundred hours [40]. Using such methods, diffusion coefficient of water in paraffin oil and in groundnut oil was found to be 8.5 × 10 10   m 2 / s and 2.5 × 10 10   m 2 / s at room temperature, respectively [40].
The dissolution of sessile droplets under cover oils has been the focus of theoretical [19] and experimental [21,22] research due to its importance in microfluidics [13], droplet printing [12] and diffusion-driven crystallization [31]. Experiments with paraffin oil showed that the dynamics of droplet dissolution under a cover oil is comparable to that of evaporation in atmospheric conditions [24].
We generated nanoliter scale aqueous droplets with a glass micropipette and rotating oil in a Petri dish to characterize the dissolution of the droplets on a microscope. Using this setup and a small volume of reagents, a two-hour observation period (Figure 6) is sufficient to determine the dissolution rate. Our simple mathematical model allows the analytical calculation of the product of the saturation density and the diffusion coefficient. By measuring the saturation density of the oils with Karl Fischer titration, we determined the diffusion coefficient of water in mineral ( 2.8 × 10 10   m 2 / s ) and silicone ( 8.6 × 10 10   m 2 / s ) oils. When both the diffusion coefficient and the saturation density are known, Equation (8) can predict the dissolution rate, which is useful in designing experiments with sessile droplets under cover oils.
Therefore, our results can be exploited in droplet microfluidics, nanoliter-to-picoliter-scale droplet printing, and to engineer well controlled, concentration-dependent reactions in tiny volumes, e.g., for solvent-diffusion-driven crystallization.

Supplementary Materials

The following supporting information can be downloaded at: https://www.mdpi.com/article/10.3390/colloids6010014/s1, Figure S1: Evaluation of contact angle measurements in three different images. Figure S2: Geometry of a sessile droplet on a hydrophobic surface. Figure S3: Volume of droplets as a function of time in phase 1. Figure S4: Contact angle of the droplets as a function of time. Figure S5: Droplet’s radius of curvature determined on the basis of side view imaging. Figure S6: Droplets with a foam-like morphology on their edge. Calculation to show that the effect of the capillary pressure was negligible. Supplementary Video S1: Time-lapse video showing the dissolution of two sessile droplets on a hydrophobic surface imaged on an inverted microscope. Supplementary Video S2: Dissolution of a sessile water droplet sitting on a hydrophobic surface observed from a side view. Supplementary Video S3: Dissolution of a sessile water droplet sitting on a hydrophilic surface observed from a side view.

Author Contributions

Conceptualization, T.G., R.H., I.D. and B.S.; methodology, T.G. and B.S.; investigation, T.G., R.U.-S. and A.S.; writing—original draft preparation, T.G.; writing—review and editing, I.D., R.H. and B.S.; visualization, T.G.; supervision, B.S.; funding acquisition, R.H. All authors have read and agreed to the published version of the manuscript.

Funding

This research was funded by the Hungarian National Research, Development and Innovation Office (grant numbers: PD 124559 for R.U.-S., KH-17, KKP 129936 and ERC-HU for R.H.), and the “Lendület” Program of the Hungarian Academy of Sciences for R.H.

Institutional Review Board Statement

Not applicable.

Informed Consent Statement

Not applicable.

Data Availability Statement

Not applicable.

Acknowledgments

We are grateful to Krisztián Gál (greenlab.hu) and Gyula Záray (ELTE) for completing the Karl Fischer titration.

Conflicts of Interest

The authors declare no conflict of interest.

References

  1. Griffiths, A.D.; Tawfik, D.S. Miniaturising the laboratory in emulsion droplets. Trends Biotechnol. 2006, 24, 395–402. [Google Scholar] [CrossRef]
  2. Tadros, T.F. Fundamental principles of emulsion rheology and their applications. Colloids Surf. A 1994, 91, 39–55. [Google Scholar] [CrossRef]
  3. Weitz, D.A. Perspective on droplet-based single-cell sequencing. Lab Chip 2017, 17, 2539. [Google Scholar] [CrossRef]
  4. Ding, Y.; Choo, J.; Demello, A.J. From single-molecule detection to next-generation sequencing: Microfluidic droplets for high-throughput nucleic acid analysis. Microfluid. Nanofluid. 2017, 21, 58. [Google Scholar] [CrossRef]
  5. Shembekar, N.; Chaipan, C.; Utharala, R.; Merten, C.A. Droplet-based microfluidics in drug discovery, transcriptomics and high-throughput molecular genetics. Lab Chip 2016, 16, 1314–1331. [Google Scholar] [CrossRef] [PubMed] [Green Version]
  6. Haeberle, S.; Zengerle, R. Microfluidic platforms for lab-on-a-chip applications. Lab Chip 2007, 7, 1094–1110. [Google Scholar] [CrossRef] [PubMed]
  7. Zhu, Y.; Zhang, Y.X.; Liu, W.W.; Ma, Y.; Fang, Q.; Yao, B. Printing 2-dimentional droplet array for single-cell reverse transcription quantitative PCR assay with a microfluidic robot. Sci. Rep. 2015, 5, 9551. [Google Scholar] [CrossRef] [PubMed] [Green Version]
  8. Zhu, Y.; Zhu, L.N.; Guo, R.; Cui, H.J.; Ye, S.; Fang, Q. Nanoliter-scale protein crystallization and screening with a microfluidic droplet robot. Sci. Rep. 2014, 4, 5046. [Google Scholar] [CrossRef] [PubMed]
  9. White, A.K.; VanInsberghe, M.; Petriv, I.; Hamidi, M.; Sikorski, D.; Marra, M.A.; Piret, J.; Aparicio, S.; Hansen, C.L. High-throughput microfluidic single-cell RT-qPCR. Proc. Natl. Acad. Sci. USA 2011, 108, 13999–14004. [Google Scholar] [CrossRef] [PubMed] [Green Version]
  10. Dalerba, P.; Kalisky, T.; Sahoo, D.; Rajendran, P.S.; Rothenberg, M.E.; Leyrat, A.A.; Sim, S.; Okamoto, J.; Johnston, D.M.; Qian, D.; et al. Single-cell dissection of transcriptional heterogeneity in human colon tumors. Nat. Biotechnol. 2011, 29, 1120–1127. [Google Scholar] [CrossRef] [PubMed]
  11. Murphy, S.V.; Atala, A. 3D bioprinting of tissues and organs. Nat. Biotechnol. 2014, 32, 773–785. [Google Scholar] [CrossRef] [PubMed]
  12. Francz, B.; Ungai-Salánki, R.; Sautner, É.; Horvath, R.; Szabó, B. Subnanoliter precision piezo pipette for single-cell isolation and droplet printing. Microfluid. Nanofluid. 2020, 24, 12. [Google Scholar] [CrossRef] [Green Version]
  13. Zhu, Y.; Zhang, Y.X.; Cai, L.F.; Fang, Q. Sequential operation droplet array: An automated microfluidic platform for picoliter-scale liquid handling, analysis, and screening. Anal. Chem. 2013, 85, 6723–6731. [Google Scholar] [CrossRef] [PubMed]
  14. Mazutis, L.; Gilbert, J.; Ung, W.L.; Weitz, D.A.; Griffiths, A.D.; Heyman, J.A. Single-cell analysis and sorting using droplet-based microfluidics. Nat. Protoc. 2013, 8, 870. [Google Scholar] [CrossRef]
  15. Shah, R.K.; Shum, H.C.; Rowat, A.C.; Lee, D.; Agresti, J.J.; Utada, A.S.; Chu, L.Y.; Kim, J.W.; Fernandez-Nieves, A.; Martinez, C.J.; et al. Designer emulsions using microfluidics. Mater. Today 2008, 11, 18–27. [Google Scholar] [CrossRef]
  16. Baret, J.C. Surfactants in droplet-based microfluidics. Lab Chip 2012, 12, 422–433. [Google Scholar] [CrossRef]
  17. Picknett, R.; Bexon, R. The evaporation of sessile or pendant drops in still air. J. Colloid Interface Sci. 1977, 61, 336–350. [Google Scholar] [CrossRef]
  18. Soolaman, D.M.; Yu, H.Z. Water microdroplets on molecularly tailored surfaces: Correlation between wetting hysteresis and evaporation mode switching. J. Phys. Chem. B 2005, 109, 17967–17973. [Google Scholar] [CrossRef]
  19. Erbil, H.Y.; McHale, G.; Newton, M. Drop evaporation on solid surfaces: Constant contact angle mode. Langmuir 2002, 18, 2636–2641. [Google Scholar] [CrossRef]
  20. Epstein, P.S.; Plesset, M.S. On the stability of gas bubbles in liquid-gas solutions. J. Chem. Phys. 1950, 18, 1505–1509. [Google Scholar] [CrossRef] [Green Version]
  21. Su, J.T.; Needham, D. Mass transfer in the dissolution of a multicomponent liquid droplet in an immiscible liquid environment. Langmuir 2013, 29, 13339–13345. [Google Scholar] [CrossRef] [PubMed] [Green Version]
  22. Duncan, P.B.; Needham, D. Microdroplet Dissolution into a Second-Phase Solvent Using a Micropipet Technique: Test of the Epstein- Plesset Model for an Aniline- Water System. Langmuir 2006, 22, 4190–4197. [Google Scholar] [CrossRef] [PubMed]
  23. Schmitt, M.; Toor, R.; Denoyel, R.; Antoni, M. Spontaneous Microstructure Formation at Water/Paraffin Oil Interfaces. Langmuir 2017, 33, 14011–14019. [Google Scholar] [CrossRef] [PubMed] [Green Version]
  24. Rodríguez-Ruiz, I.; Hammadi, Z.; Grossier, R.; Gomez-Morales, J.; Veesler, S. Monitoring picoliter sessile microdroplet dynamics shows that size does not matter. Langmuir 2013, 29, 12628–12632. [Google Scholar] [CrossRef] [PubMed]
  25. Zhang, X.; Wang, J.; Bao, L.; Dietrich, E.; van der Veen, R.C.; Peng, S.; Friend, J.; Zandvliet, H.J.; Yeo, L.; Lohse, D. Mixed mode of dissolving immersed nanodroplets at a solid–water interface. Soft Matter 2015, 11, 1889–1900. [Google Scholar] [CrossRef]
  26. Velazquez, J.; Hileman, O., Jr. Studies on nucleation from solution of some soluble inorganic salts. Can. J. Chem. 1970, 48, 2896–2899. [Google Scholar] [CrossRef]
  27. Grossier, R.; Magnaldo, A.; Veesler, S. Ultra-fast crystallization due to confinement. J. Cryst. Growth 2010, 312, 487–489. [Google Scholar] [CrossRef]
  28. Bitterfield, D.L.; Utoft, A.; Needham, D. An Activity-Based Dissolution Model for Solute-Containing Microdroplets. Langmuir 2016, 32, 12749–12759. [Google Scholar] [CrossRef]
  29. Utoft, A.; Kinoshita, K.; Bitterfield, D.L.; Needham, D. Manipulating Single Microdroplets of NaCl Solutions: Solvent Dissolution, Microcrystallization, and Crystal Morphology. Langmuir 2018, 34, 3626–3641. [Google Scholar] [CrossRef]
  30. Pal, K.; Ramkrishna, D.; Nagy, Z.K. Mathematical Modeling of Emulsion Solvent Diffusion for Spherical Crystallization: How To Deconvolute Primary Crystal Size Distribution from Agglomerate Size Distribution? Ind. Eng. Chem. Res. 2020, 59, 6288–6300. [Google Scholar] [CrossRef]
  31. Espitalier, F.; Biscans, B.; Laguerie, C.; Deleuil, M. Spherical crystallization: Modeling of the emulsion solvent diffusion technique. KONA Powder Part. J. 1997, 15, 159–169. [Google Scholar] [CrossRef] [Green Version]
  32. Pittermannova, A.; Ruberova, Z.; Zadražil, A.; Bremond, N.; Bibette, J.; Štěpánek, F. Microfluidic fabrication of composite hydrogel microparticles in the size range of blood cells. RSC Adv. 2016, 6, 103532–103540. [Google Scholar] [CrossRef] [Green Version]
  33. Umbanhowar, P.; Prasad, V.; Weitz, D.A. Monodisperse emulsion generation via drop break off in a coflowing stream. Langmuir 2000, 16, 347–351. [Google Scholar] [CrossRef]
  34. Mehta, R.; More, U.; Malek, N.; Chakraborty, M.; Parikh, P. Study of stability and thermodynamic properties of water-in-diesel nanoemulsion fuels with nano-Al additive. Appl. Nanosci. 2015, 5, 891–900. [Google Scholar] [CrossRef] [Green Version]
  35. Schindelin, J.; Arganda-Carreras, I.; Frise, E.; Kaynig, V.; Longair, M.; Pietzsch, T.; Preibisch, S.; Rueden, C.; Saalfeld, S.; Schmid, B.; et al. Fiji: An open-source platform for biological-image analysis. Nat. Methods 2012, 9, 676–682. [Google Scholar] [CrossRef] [PubMed] [Green Version]
  36. Zack, G.W.; Rogers, W.E.; Latt, S. Automatic measurement of sister chromatid exchange frequency. J. Histochem. Cytochem. 1977, 25, 741–753. [Google Scholar] [CrossRef]
  37. Stalder, A.F.; Kulik, G.; Sage, D.; Barbieri, L.; Hoffmann, P. A snake-based approach to accurate determination of both contact points and contact angles. Colloids Surf. A 2006, 286, 92–103. [Google Scholar] [CrossRef] [Green Version]
  38. Webster, A.; Cates, M. Stabilization of emulsions by trapped species. Langmuir 1998, 14, 2068–2079. [Google Scholar] [CrossRef]
  39. Nilsson, P.; Lindman, B. Water Self-Diff usion in Nonionic Surfactant Solutions. Hydration and Obstruction Effects. J. Phys. Chem. 1983, 87, 4756–4761. [Google Scholar] [CrossRef]
  40. Hilder, M.; van den Tempe, M. Diffusivity of water in groundnut oil and paraffi oil. J. Appl. Chem. Biotechnol. 1971, 21, 176–178. [Google Scholar] [CrossRef]
Figure 1. The workflow of droplet diameter measurements. (a): The droplets are generated by a water filled micropipette immersed in a rotating Petri dish containing oil. (b): The Petri dish with the w/o emulsion is placed on an inverted microscope and images are taken in time-lapse mode. Scale bars indicate 100   μ m . (c): Image stacks are segmented to detect and track the droplets. (d): Diameter of droplets is automatically measured to plot the curves of droplet dissolution.
Colloids 06 00014 g001
Figure 2. Distribution of droplet diameter in a typical droplet generation run. The number of droplets generated and represented here is 2397. In a typical run 2000–5000 droplets were created. The droplet generation method based on rotating fluid was chosen for its ability to create a large number of droplets directly in the Petri dish.
Colloids 06 00014 g002
Figure 3. (a) Data showing the change of the diameter of water droplets under mineral oil from a bottom view as observed by the objective lens of an inverted microscope. Different curves correspond to different droplets. (b) The three distinctive phases of a representative d ( t ) curve.
Colloids 06 00014 g003
Figure 4. The time evolution of shape descriptors of a droplet imaged from a side view. Vertical lines indicate the boundary between the three different phases. See also Supplementary Video S2.
Colloids 06 00014 g004
Figure 5. 3 phase model of sessile droplet dissolution under a cover oil on a hydrophobic surface. Phase 1: The contact angle decreases together with the droplet diameter, while the contact area remains unchanged. Phase 2: After the contact angle reaches 90°, it keeps decreasing together with the volume of the droplet but with a constant contact diameter. Phase 3: The contact diameter and the contact angle decrease at the same time until complete disappearance of the droplet.
Colloids 06 00014 g005
Figure 6. Square of the droplet diameter d 2 ( t ) as a function of time in phase 1 measured on an inverted microscope. (a) d 2 ( t ) curves for representative droplets in mineral oil and mineral oil mixed with surfactant (Span80). (b) d 2 ( t ) curves for representative droplets in silicone oil and silicone oil mixed with surfactant (Triton X-100). Data series were fit with a line. Relative standard error of the slope was <1% in all cases.
Colloids 06 00014 g006
Figure 7. Values of D ( ρ s ρ ) / ρ 0 of the four different oil mixtures we investigated in depth. For each material the data shown corresponds to a linear fit of five different droplets under the same conditions. Errors were calculated as the standard deviation of the five slopes. Significance levels: **: p < 0.01 % , *: p < 0.05 % . Values of D ( ρ s ρ ) / ρ 0 are the following. Mineral oil: ( 3.31 ± 1.28 ) × 10 14   m 2 / s ; mineral oil with 0.5   ( vol % ) Span80: ( 5.57 ± 1.41 ) × 10 14   m 2 / s ; silicone oil: ( 199.57 ± 29.14 ) × 10 14   m 2 / s ; silicone oil with 0.2   ( vol % ) Triton X-100: ( 101.75 ± 9.36 ) × 10 14   m 2 / s .
Colloids 06 00014 g007
Table 1. Values of D ( ρ s ρ ) / ρ 0 in units of 10 14   m 2 / s for the four different oils.
Mineral OilMineral Oil + Span80Silicone OilSilicone Oil + Triton X-100
3.31 ± 1.28 5.57 ± 1.41 199.57 ± 29.14 101.75 ± 9.36
Table 2. Values of the moisture content of oils in ppm as measured by Karl Fischer titration.
Mineral OilSaturated Mineral OilSilicone OilSaturated Silicone Oil
3414806092902
Publisher’s Note: MDPI stays neutral with regard to jurisdictional claims in published maps and institutional affiliations.

