Article

Surface Forces between Nanomagnetite and Silica in Aqueous Ca2+ Solutions Studied with AFM Colloidal Probe Method

1
Division of Materials Science, Luleå University of Technology, SE-971 87 Luleå, Sweden
2
Division of Chemical Engineering, Luleå University of Technology, SE-971 87 Luleå, Sweden
*
Authors to whom correspondence should be addressed.
Colloids Interfaces 2020, 4(3), 41; https://doi.org/10.3390/colloids4030041
Submission received: 6 July 2020 / Revised: 28 August 2020 / Accepted: 1 September 2020 / Published: 10 September 2020

Abstract

:
Dispersion and aggregation of nanomagnetite (Fe3O4) and silica (SiO2) particles are of high importance in various applications, such as biomedicine, nanoelectronics, drug delivery, flotation, and pelletization of iron ore. In directly probing nanomagnetite–silica interaction, atomic force microscopy (AFM) using the colloidal probe technique has proven to be a suitable tool. In this work, the interaction between nanomagnetite and silica particles was measured with AFM in aqueous Ca2+ solution at different pH levels. This study showed that the qualitative changes of the interaction forces with pH and Ca2+ concentrations were consistent with the results from zeta-potential measurements. The repulsion between nanomagnetite and silica was observed at alkaline pH and 1 mM Ca2+ concentration, but no repulsive forces were observed at 3 mM Ca2+ concentration. The interaction forces on approach were due to van der Waals and electrical double-layer forces. The good fitting of experimental data to the DLVO model and simulations supported this conclusion. However, contributions from non-DLVO forces should also be considered. It was shown that an increase of Ca2+ concentration from 1 to 3.3 mM led to a less pronounced decrease of adhesion force with increasing pH. A comparison of measured and calculated adhesion forces with a few contact mechanics models demonstrated an important impact of nanomagnetite layer nanoroughness.

1. Introduction

Atomic force microscopy (AFM) using the colloidal probe technique, introduced by Ducker et al. [1], has been proven to be a good technique for measuring interaction forces in aqueous medium for a variety of materials. The measurement of force interactions between particles in predefined conditions was shown to significantly contribute to particle dispersion and adhesion studies [2,3]. Knowledge about the forces acting between particles in aqueous solutions is of fundamental importance in various applications, such as mineral processing, biomedicine, nanoelectronics, and adhesives [4,5,6,7]. Iron oxide nanoparticles have attracted significant research interest due to their superparamagnetic properties [8] and high potential to be used in biomedicine [6]. Synthetic nanomagnetite (Fe3O4) particles with spherical shapes and known chemical composition can also be used to model natural magnetite when natural particles cannot be used due to their larger size (smaller surface area per gram) and complex chemical composition [4,5,9]. Interaction between natural magnetite and soluble silicate is of importance for mineral processing in processes such as flotation, dispersion, and agglomeration of iron ore concentrate. It is known that silicate anions adsorb onto magnetite even at alkaline solution (7 < pH < 9), although the magnetite surface is negatively charged, indicating a condensation reaction between silicate and magnetite [9,10]. A similar condensation reaction might also appear between magnetite and silica (SiO2) particles. However, the influence of calcium ions, commonly found in natural and process waters, on the interaction between magnetite and silica particles is scant in the literature, although it is well known that calcium ions can easily adsorb at negatively charged surface sites.
There are a few relevant studies on direct magnetite–silica interaction using AFM. Toikka et al. [10] studied the interaction between a microsized iron oxide probe and a silica surface in 10−5 M NaNO3 solution using AFM. A strong adhesion was measured at pH 3 and no adhesion at pH 7. These observations were in good correlation with measured electro-kinetic data, and the measured adhesion was compared with a calculated value. The force interaction between magnetite and a zero-valent iron particle measured in 100 mM of NaCl and CaCl2 as working solutions was reported by Pensini et al. [11]. The adhesive forces and forces on approach were investigated. The attractive forces at pH 4 and 5.5 were measured in Milli-Q water and were attributed to the van der Waals magnetic and electrostatic forces, while repulsion was observed at pH 8 and was attributed to hydration and electrostatic forces. The repulsion was replaced by attractive forces in 100 mM CaCl2 solution. The effect of Ca2+ concentration and pH on the interaction between natural magnetite and a natural magnetite probe as well as that between synthetic magnetite and a natural magnetite probe has been previously investigated [4]. A direct interaction between carbonyl iron particles (also nanosized iron) and silica surface was investigated with AFM in 100 mM NaCl and CaCl2 solutions [12]. The measured interaction was analyzed employing the extended DLVO (Derjaguin, Landau, Verwey, and Overbeek) model, taking into account the hydration forces. It was demonstrated that such model worked well in describing the interaction at separation distances equal or greater than 1.2 nm and 2.5 nm [12]. In another investigation at our laboratories, forces between synthetic magnetite and bentonite as well as silica probes were measured at pH 4, 6, and 8 with a working solution containing 1 mM CaCl2 (ionic strength 10 mM by means of NaCl) [5]. However, it became clear that a higher concentration of the divalent cation was necessary, as well as shorter steps between pH values, in order to get a clearer understanding of the interaction between silica and magnetite particles. Furthermore, the theory of interaction had to be utilized to a larger extent (e.g., the effect of surface roughness on the adhesion/repulsion of the materials). For this purpose, using a spherical silica probe allows the application of common theoretical models. The determination of interaction force, double-layer thickness, and surface charges is commonly carried out with the DLVO model [7,13,14]. The electrostatic part of the DLVO model is usually obtained by solving the Poisson–Boltzmann equation within boundary conditions, such as a constant surface potential or a constant surface charge on each boundary [15]. It was also shown in the literature that the charge regulation approach could be advantageous over the classical boundary conditions [15]. Specific ion effects and pH dependences can affect both long-range and especially short-range forces, and non-DLVO forces, such as hydrophobic and hydration forces, should be considered [12,16]. Moreover, the roughness has to be considered since the surface roughness can cause a dramatic effect on measured values and, therefore, on the evaluation of the adhesion [17] and affect the Hamaker constant [7,18,19].
The aim of this work was to show the effect of Ca2+ concentration and pH on the interaction between nanomagnetite and silica, as measured with AFM. Particle–particle dispersion and aggregation properties were studied by analyzing force curves on approach and retraction at various experimental conditions. The evaluation of measured surface forces at a sufficiently high divalent cation concentration and at a series of pH values was compared with zeta-potential measurements. Surface forces on approach were analyzed using the DLVO model, and the measured adhesion force was compared with adhesion calculated using the Johnson, Kendall, and Roberts (JKR) [20]; Rumpf [21]; and Rabinovich [17] models.

2. Materials and Methods

2.1. Materials and Reagents

Nanoparticles of magnetite (Fe3O4) with a spherical shape and sizes of 5–15 nm were synthesized and purified in accordance with a procedure described in Ref. [22]. To prevent the oxidization of the magnetite surface, the dispersion was stored in a refrigerator. To adjust the pH in working solutions, aqueous solutions of NaOH and HCl of analytical grade were used. Degassed distilled water, as electrolyte medium, and inorganic salts (NaCl and CaCl2 ·2H2O (Merck, Sweden)) of analytical grade were used in AFM and zeta-potential measurements. Water degasification was conducted using a standard vacuum degasification method.

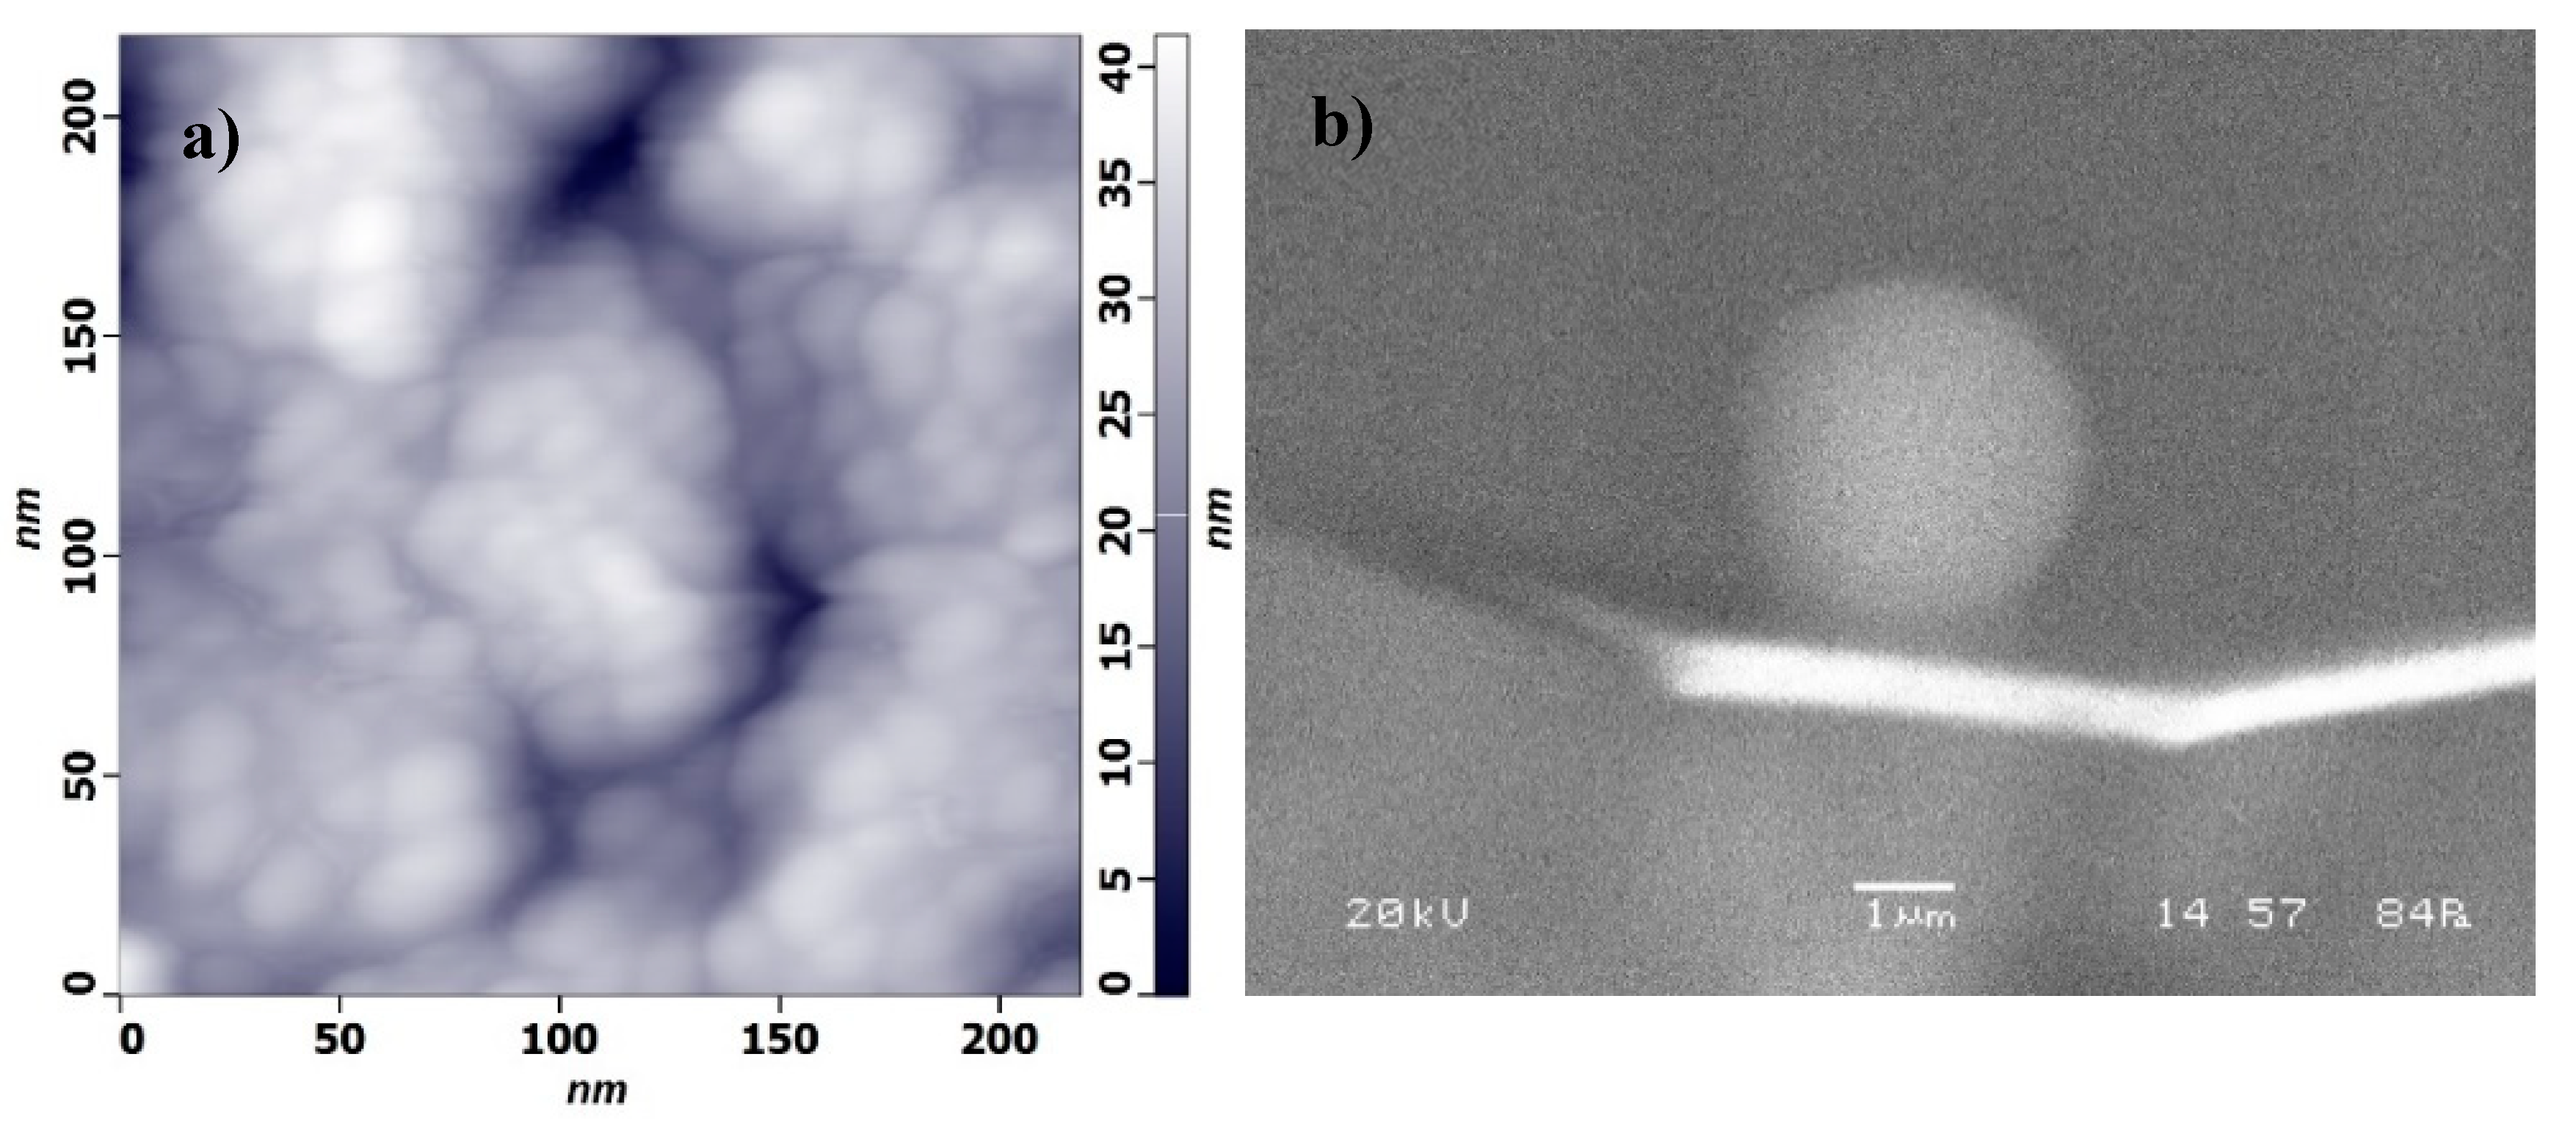
2.2. Substrate and Probe Preparation

The deposition of magnetite nanoparticles on a glass slide was performed using a dip-coating technique with a Nima DC-multi 8 dip-coater(Nima Technology Ltd., Coventry, UK). Prior to deposition, the glass slides were immersed and kept for 1 h in 0.1 M aqueous solution of HNO3 and afterwards washed with distilled water, acetone, and methanol to remove possible impurities. The dip-coating procedure was described in detail previously by Dobryden et al. [4]. The obtained nanomagnetite layers were characterized with AFM using the tapping mode probe NSG-01 (NT-MDT). A representative topography image of the obtained magnetite layer is shown in Figure 1a. The nanomagnetite layers were homogeneous and had an average surface roughness (Ra) of around 10 nm for areas of 1 µm2. AFM colloidal SiO2 probes were purchased from sQUBE (Germany). A spherical silica particle of 3.5 µm diameter was already preattached to the end of a tipless cantilever with a nominal force constant of 0.08 Nm−1. The colloidal probes were cleaned before use by immersing them into methanol, then ethanol, and then distilled water. The scanning electron microscopy (SEM, Jeol ldt., JSM-6460 LV, Japan) morphology image of the spherical SiO2 probe used for the force measurements is shown in Figure 1b.

2.3. Electrophoretic Mobility Measurement

Electrophoretic mobility measurements using a Malvern Zetasizer nano ZS instrument (Malvern, UK) were carried out to determine the zeta potential of silica and nanomagnetite particles. The electrophoretic mobility was recorded with Doppler velocimetry and then with the use of the Smoluchowski equation converted to the zeta potential. The aqueous medium used in the measurements contained 10 mM NaCl, or 1 mM CaCl2 and 7 mM NaCl, or 3.3 mM CaCl2, which means that the ionic strength was 10 mM in all three solutions. The zeta potential of silica was measured using aqueous suspensions of silica particles (Sigma-Aldrich) with an average size of 4 µm ± 0.3 µm. Measurements were performed in the range of 3.7 < pH < 10.

2.4. Force Measurements with AFM

Force measurements were conducted with an NTEGRA AFM (NT-MDT, Zelenograd, Russia) equipped with a liquid cell and a 14 µm equivalent closed-loop sample scanner. The force curves were acquired for nanomagnetite–silica interaction in the three solutions specified above and in the pH range from 3.7 to 10. An aqueous 10 mM NaCl medium was used as a reference to study the effect of Ca2+ on the interaction between magnetite and silica. The pH values were measured with a 744 pH meter (Metrohm AG, Herisau, Switzerland). A fresh silica probe and a newly prepared layer of magnetite were used upon changing the aqueous medium in order to prevent possible contamination, which could affect the AFM measurements. At each pH value, the system was equilibrated with a working solution for 15 min prior to measurement. The photodetector was calibrated prior to the measurements by collecting 30 force curves between the probe and the glass substrate placed in distilled water. The force curves were acquired at an approaching speed of around 100 nms−1, and this speed varied insignificantly between the measurements. All force curves were collected at the same surface spot to minimize a possible effect of the contact geometry on the measured forces due to the roughness of the magnetite layer. In each experiment, about 500 curves were collected to provide reliable statistical accuracy for evaluation of the forces.

2.5. Adhesion Force Evaluation and Calculation

To evaluate the adhesion force from the acquired force curves, the deflection signals were converted into force according to
F = k · Δ d e f l e c t i o n ,
where k is the cantilever spring constant and Δ d e f l e c t i o n   is the cantilever displacement.
The scanner displacement was converted to separation distance as described before [23]. An in-house code written in IGOR Pro 6.21 (Wavemetrics, Lake Oswego, OR) was used for automatic evaluation of adhesion forces from arrays of captured force curves on retract, as discussed earlier by Dobryden et al. [4]. To calculate the adhesion force, the following models were used: JKR, Rumpf, and Rabinovich. Equation (2) was used to calculate adhesion using the JKR model.
F J K R = 3 2 · π · R · W 12 ,
where R is the probe radius and W 12   is the work of adhesion.
The work of adhesion was calculated using provided Hamaker constants in Ref. [24] as
W 12 = A 12 12 · π · D 0 2 ,
where A 12   is the Hamaker constant of the magnetite–silica interaction in solution and D 0 is the “cut off” distance or minimum separation distance.
However, the JKR model does not include the effect of the surface roughness within the contact interface, which has been shown to have a significant impact on the adhesion in aqueous medium [25]. Rumpf suggested to take nanoscale roughness into account by introducing a single hemispherical asperity centered at the surface [21]. Equation (4) was used to calculate the adhesion force as proposed in Rumpf’s model. The adhesive force is then
F R = A 6 · D 0 2 [ r · R r + R + R ( 1 + r D 0 ) 2 ] ,
where r is the asperity radius.
A further improvement of Rumpf’s model was proposed by Rabinovich [17]. This model implies that the measured surface roughness on short and long peak-to-peak distances is accounted for. Equation (5) was used to calculate the adhesion force as follows:
F R b = A · R 6 · D 0 2 [ 1 1 + 58 · R · r m s 2 λ 2 2 + 1 1 + 58 · R · r m s 1 λ 1 2 · ( 1 + 1.82 · r m s 2 D 0 ) 2 ] ,
where r m s 2   is the roughness on the short peak-to-peak distance λ 2 and r m s 1   is the roughness on the long peak-to-peak distance   λ 1 .

3. Results and Discussion

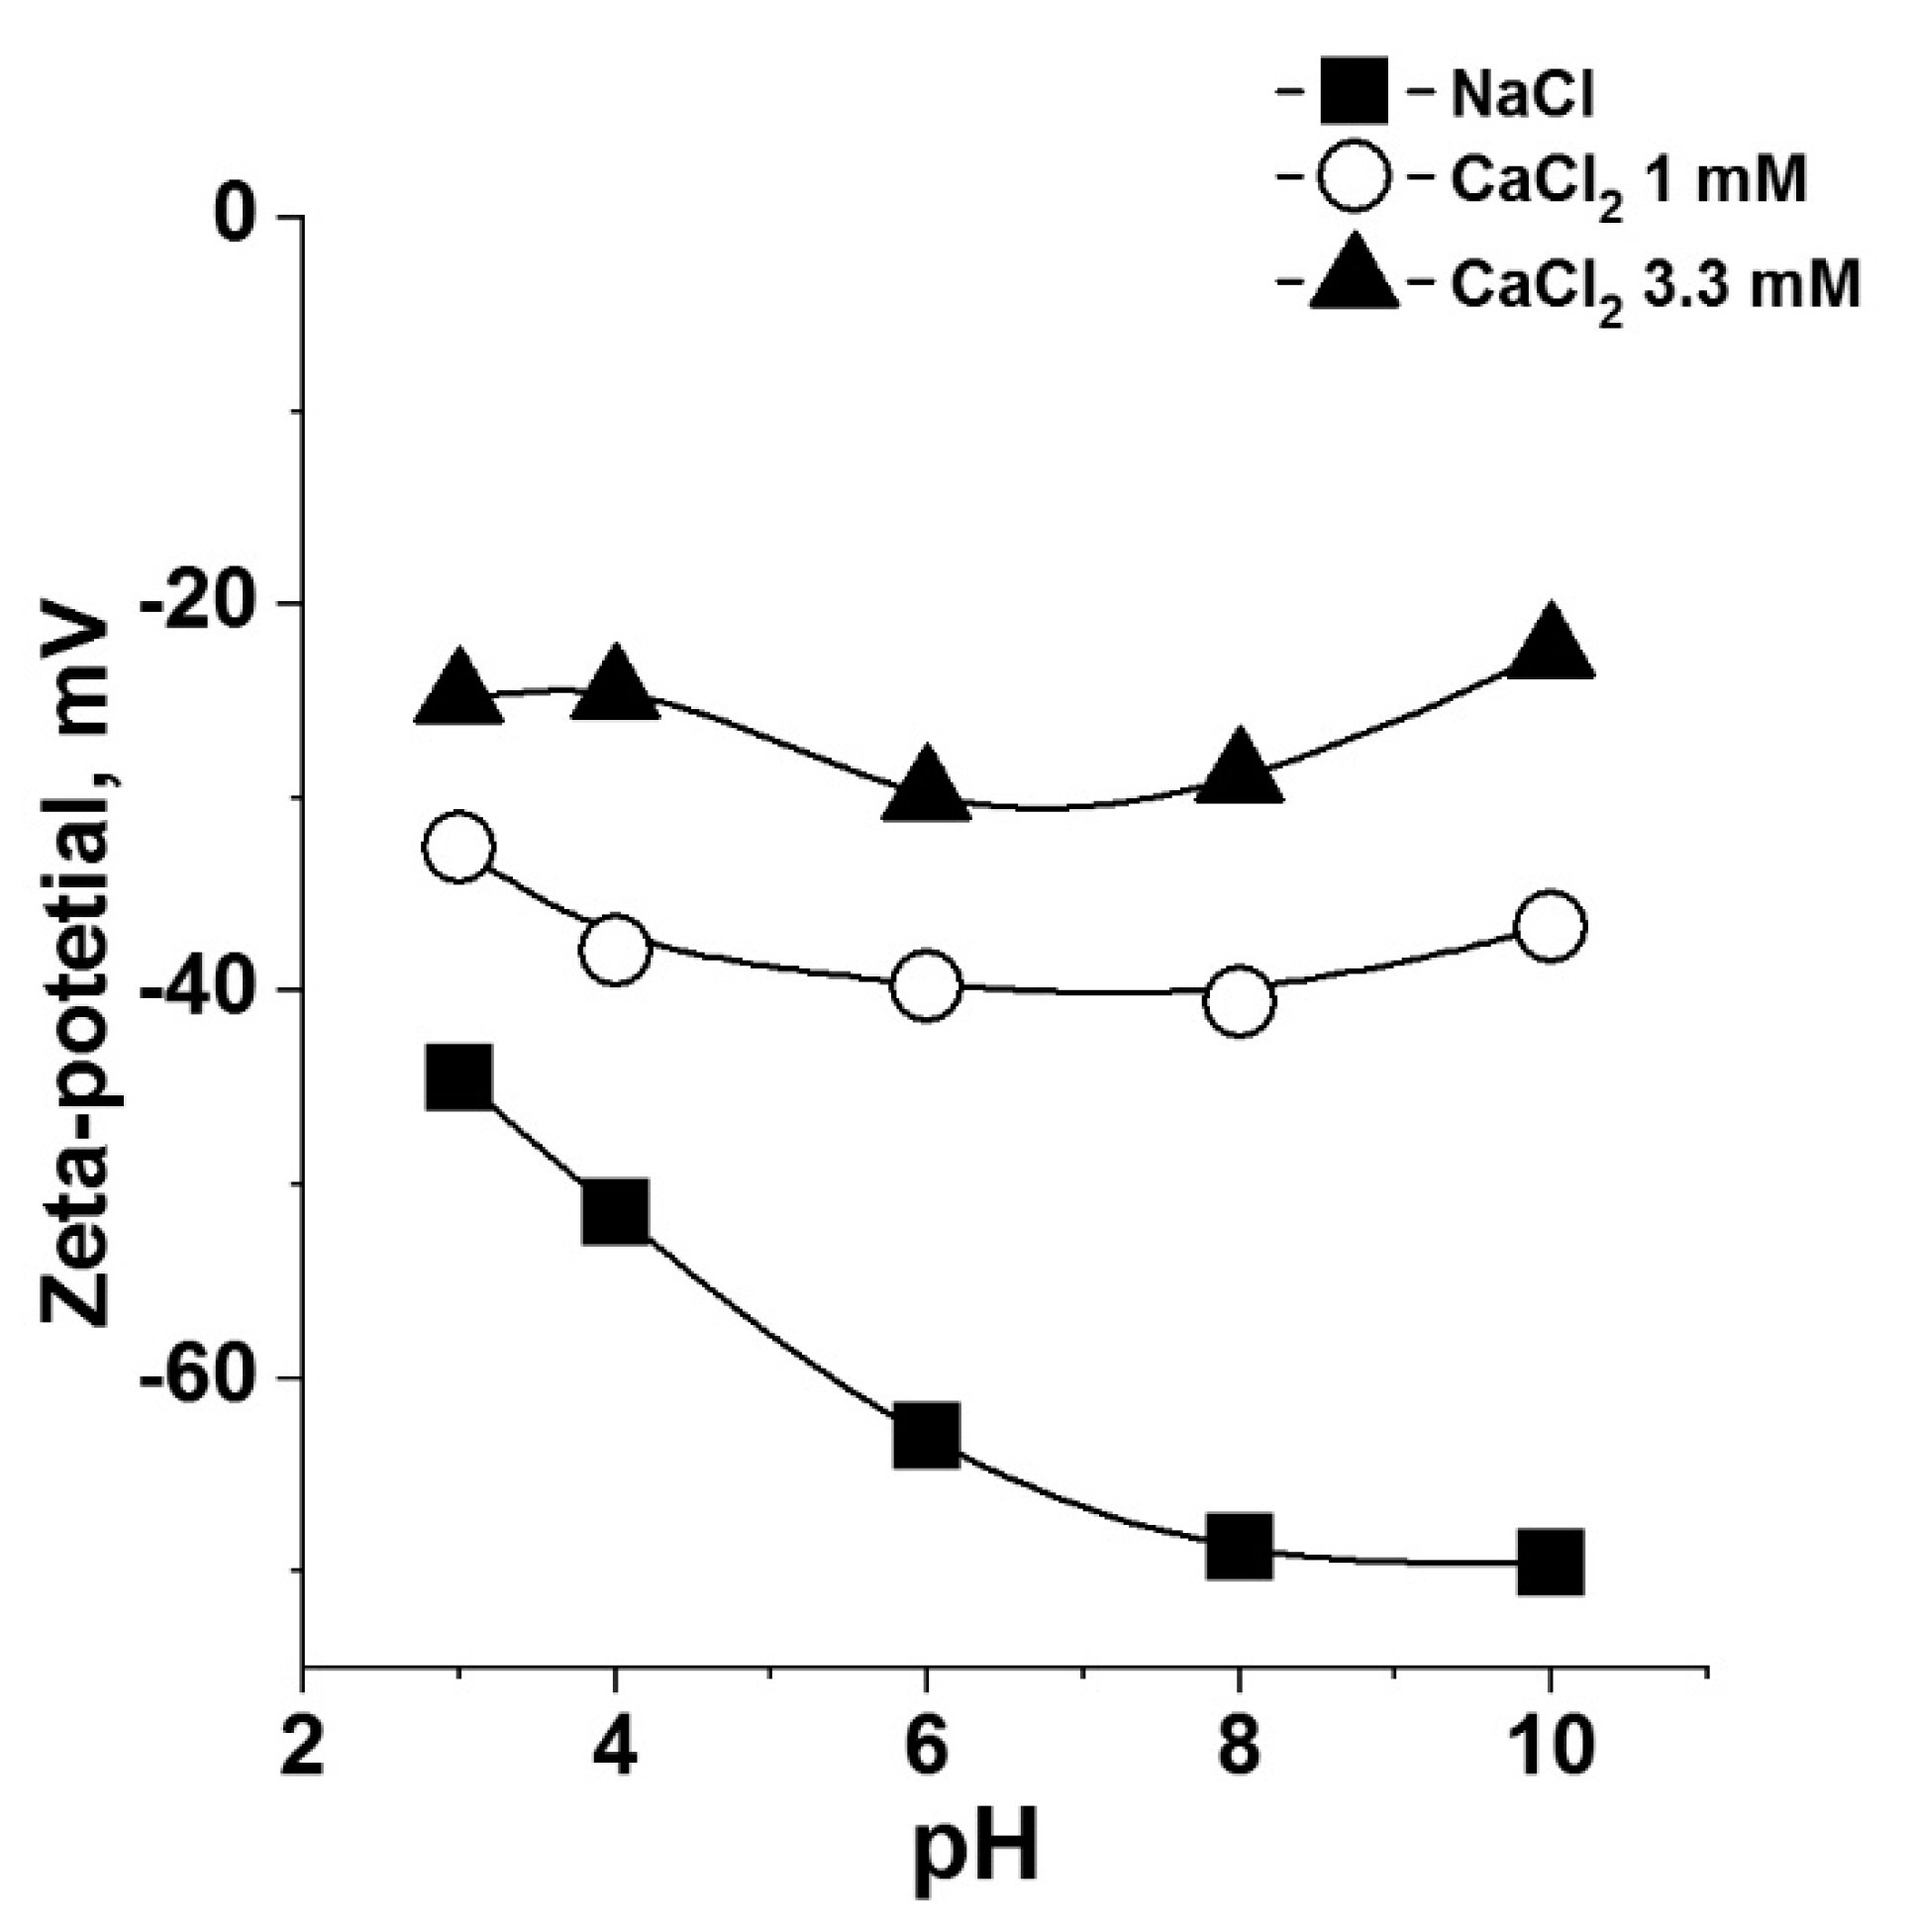
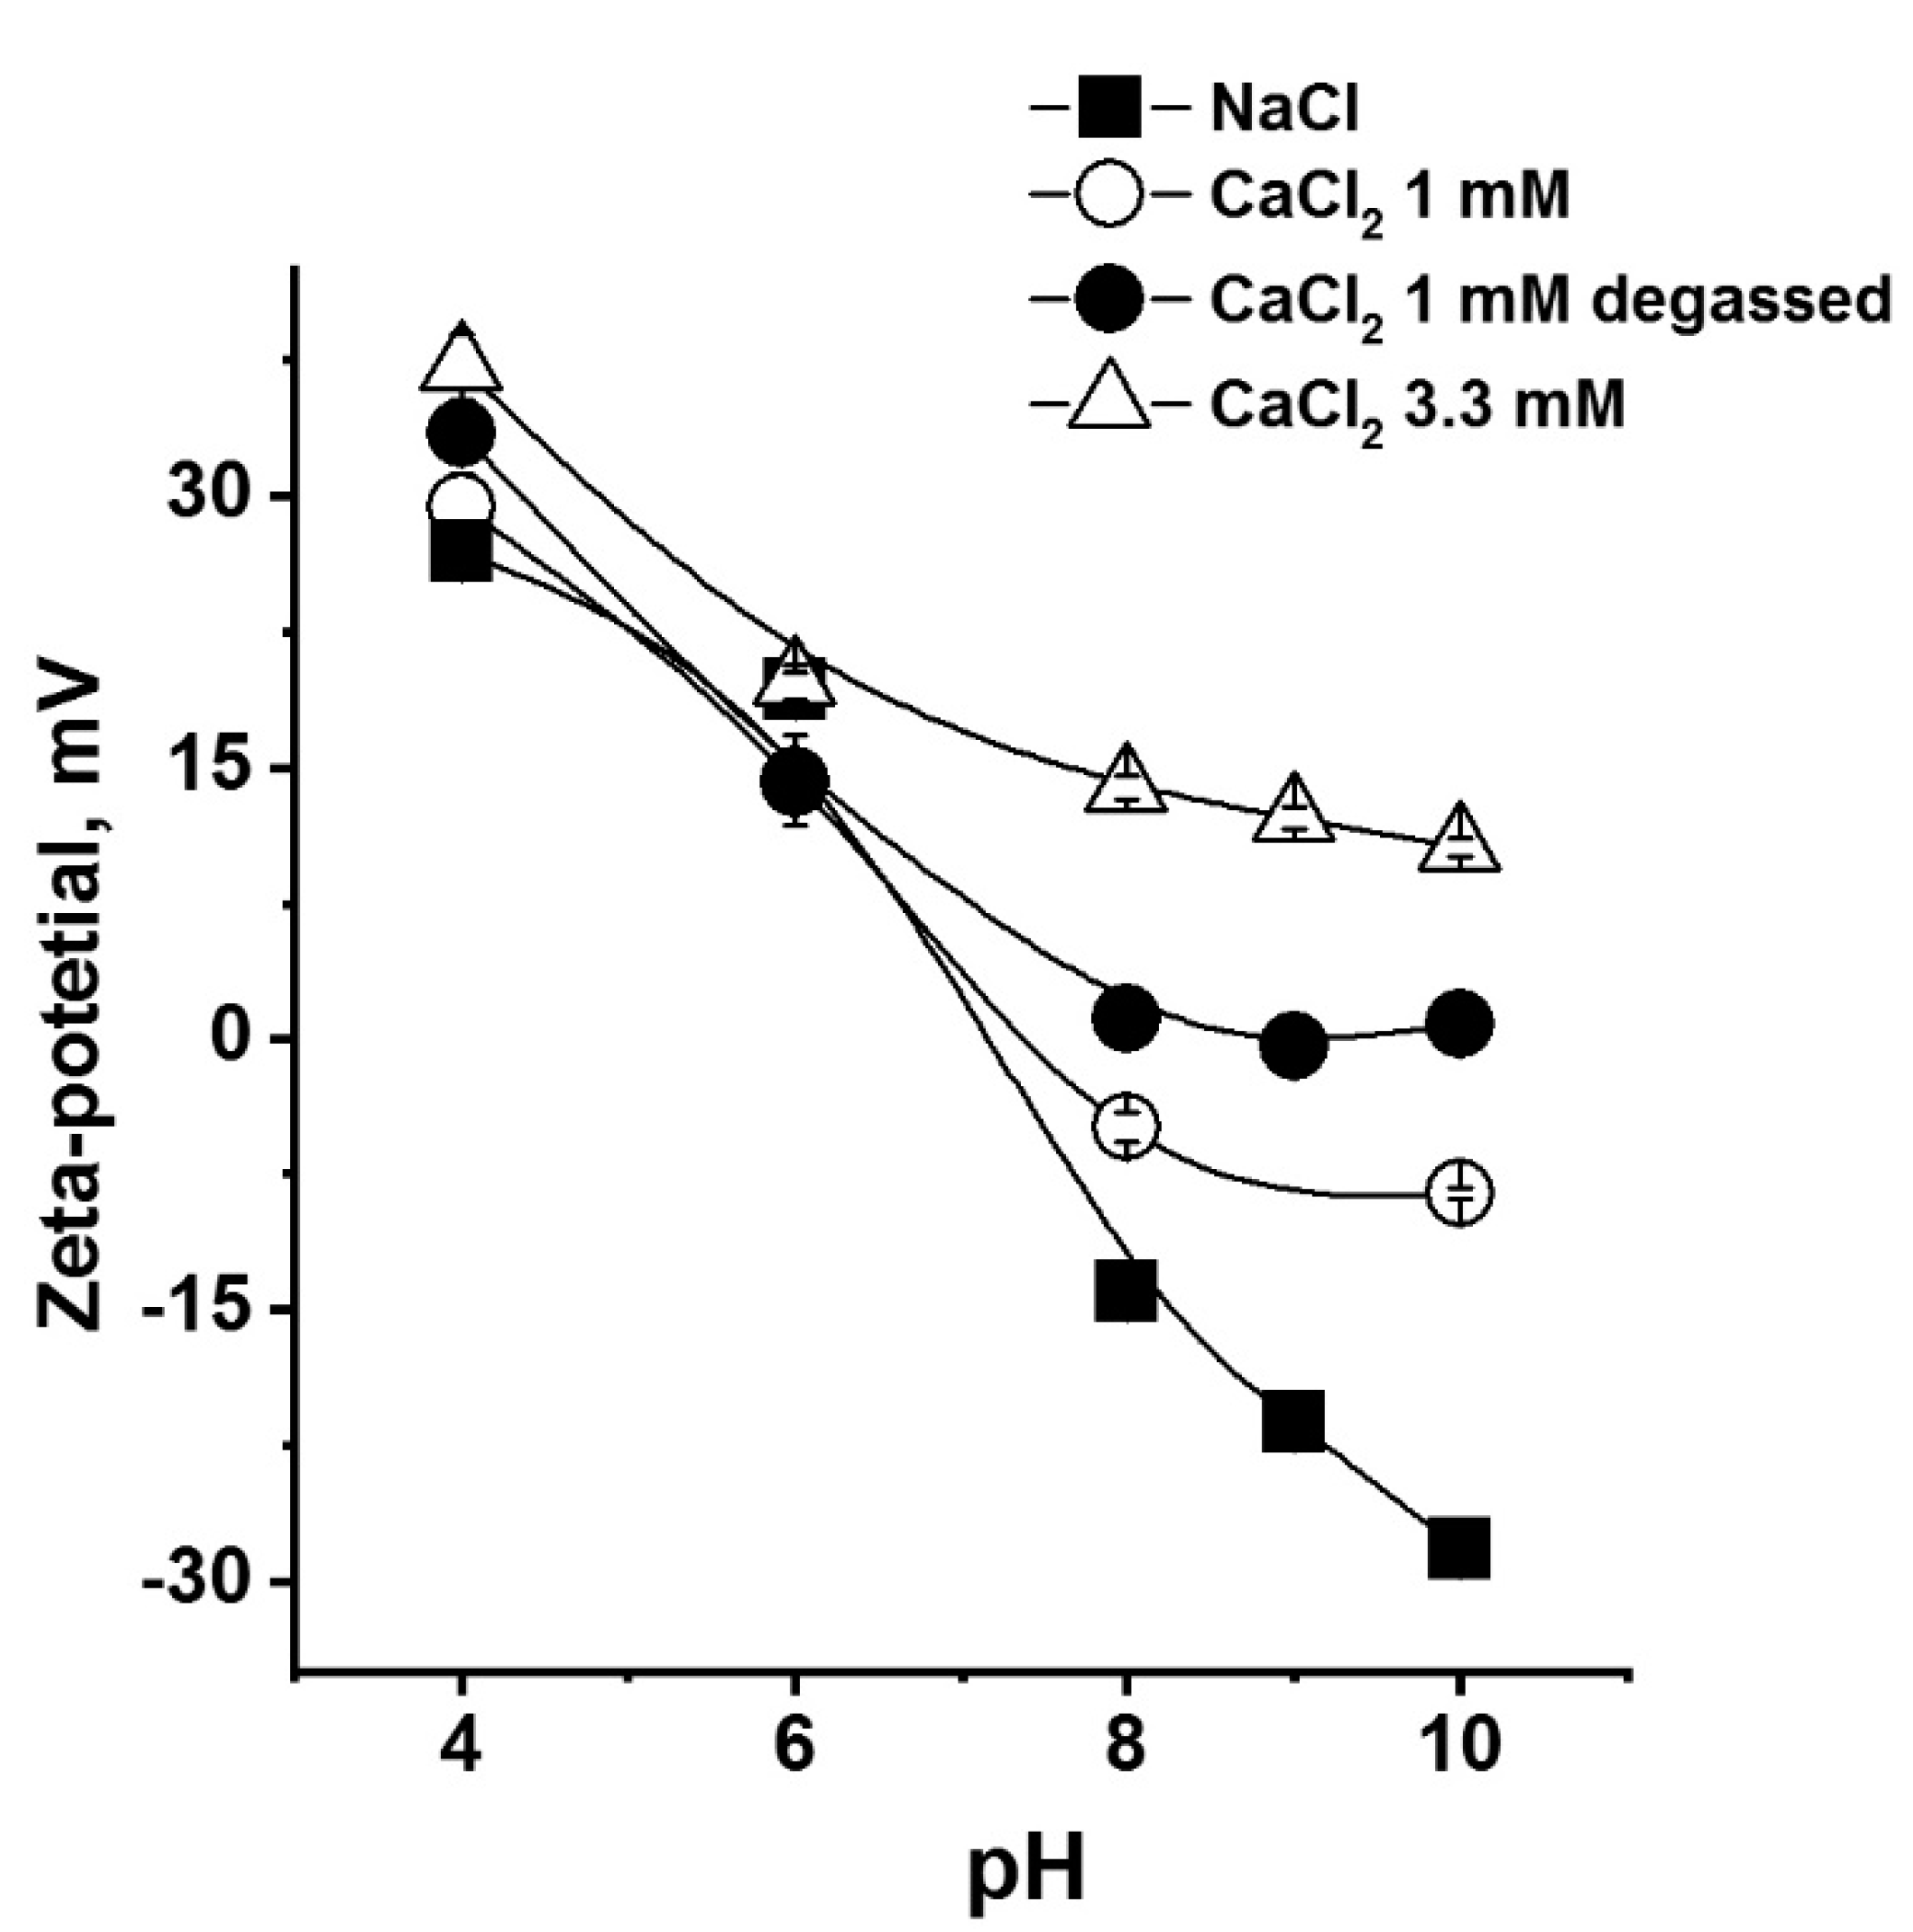
3.1. Effect of Calcium Concentration and pH on Zeta Potential

Determination of the zeta potential of the studied system is required for analysis of the measured force curves and for application of the DLVO model. The zeta potential of silica particles with an average diameter of 4 µm was measured in a 50 mgL−1 aqueous suspension containing inorganic salts and is shown in Figure 2.
In the pH range from 3 to 10, the zeta potential of silica particles was negative in both aqueous NaCl and CaCl2 solutions (Figure 2) and became less negative with increased concentration of calcium cations due to the electrostatic interaction between these ions and the negatively charged silica surface. It is known that Ca2+ can adsorb on the silica surface above its isoelectric point (IEP), reducing the negative charge of the silica surface [26,27]. However, this effect of CaCl2 concentration on the zeta potential of the silica particles may also imply that a lower silica concentration with a lower number of available surface sites is even more affected. If so, it might be of relevance for the interpretation of force measurements with a single silica particle used as the probe.
The measured values of the zeta potential of nanomagnetite in NaCl and CaCl2 solutions are shown in Figure 3.
The zeta potential of the synthetic nanomagnetite measured in a 7 mgL−1 aqueous dispersion containing 10 mM NaCl had an isoelectric point (IEP) of around pH 6, which is in good agreement with the reported values for the IEP found in the literature [22]. Addition of calcium ions resulted in a more positive zeta potential below the IEP and a significant increase in the zeta potential above the IEP. Depending on the concentration of calcium ions, the magnetite surface was rendered almost neutral at 1 mM Ca2+ and positive at 3.3 mM Ca2+ at pH 8–10, indicating a specific interaction between calcium ions and magnetite. A detailed discussion of the interaction between calcium ions and magnetite can be found in our previous work [28].
As mentioned previously, degassed distilled water was used in the AFM measurements. It is necessary for force measurements with AFM to reduce the amount of air in solution to minimize the effect of possible capillary forces and force disturbances. Another purpose of water degassing was to minimize the effect of carbon dioxide dissolved in water, which can affect the zeta-potential values and interaction forces [29]. To emphasize the importance of water degassing, the values of the zeta potential of magnetite in a non-degassed aqueous solution containing 1 mM CaCl2 and 7 mM NaCl are presented in Figure 3, along with the values obtained in a degassed solution with the same concentration of the salts. When non-degassed distilled water was used, more negative values of the zeta potential were obtained above the IEP due to the adsorption of negatively charged carbonate species on the magnetite surface as well as possible ion-pair formation with calcium cations at higher pH. Similar tendencies were reported previously for hematite particles in solutions containing calcium and carbonate ions [30]. This result suggests that the presence of dissolved carbon dioxide in water could have a considerable effect on the zeta potential of iron oxide particles and their electrostatic interaction with other particles in aqueous medium.

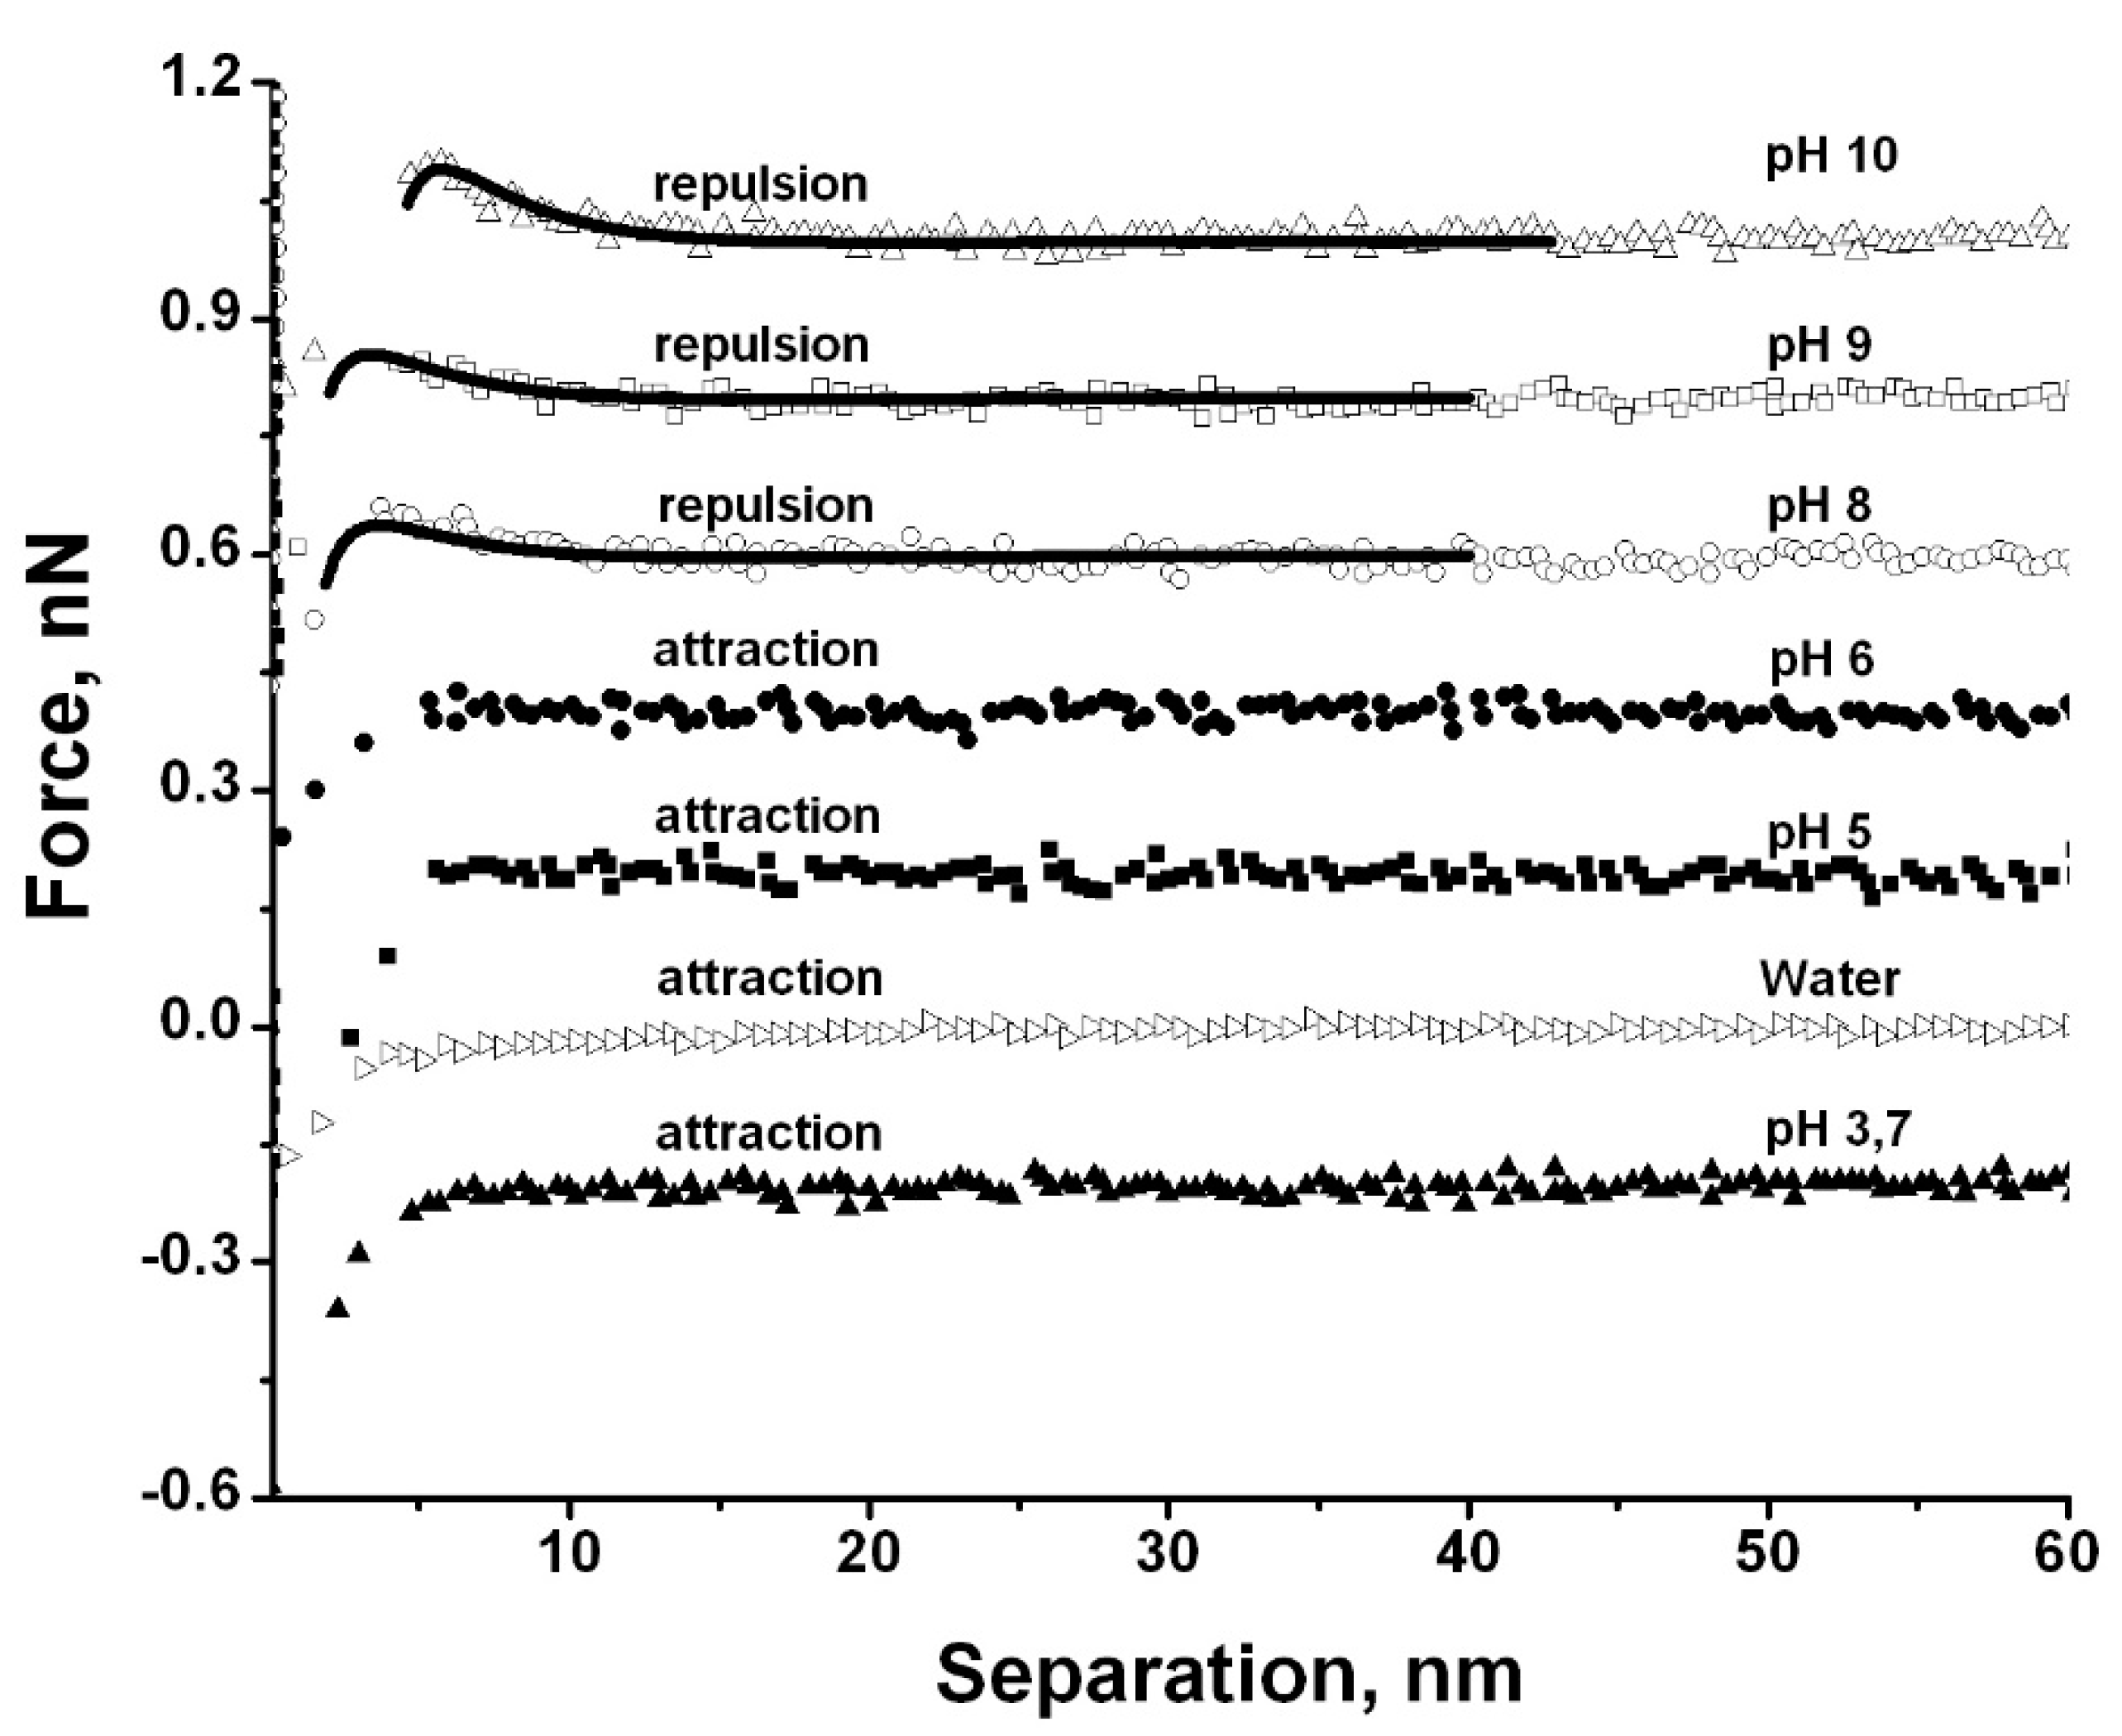
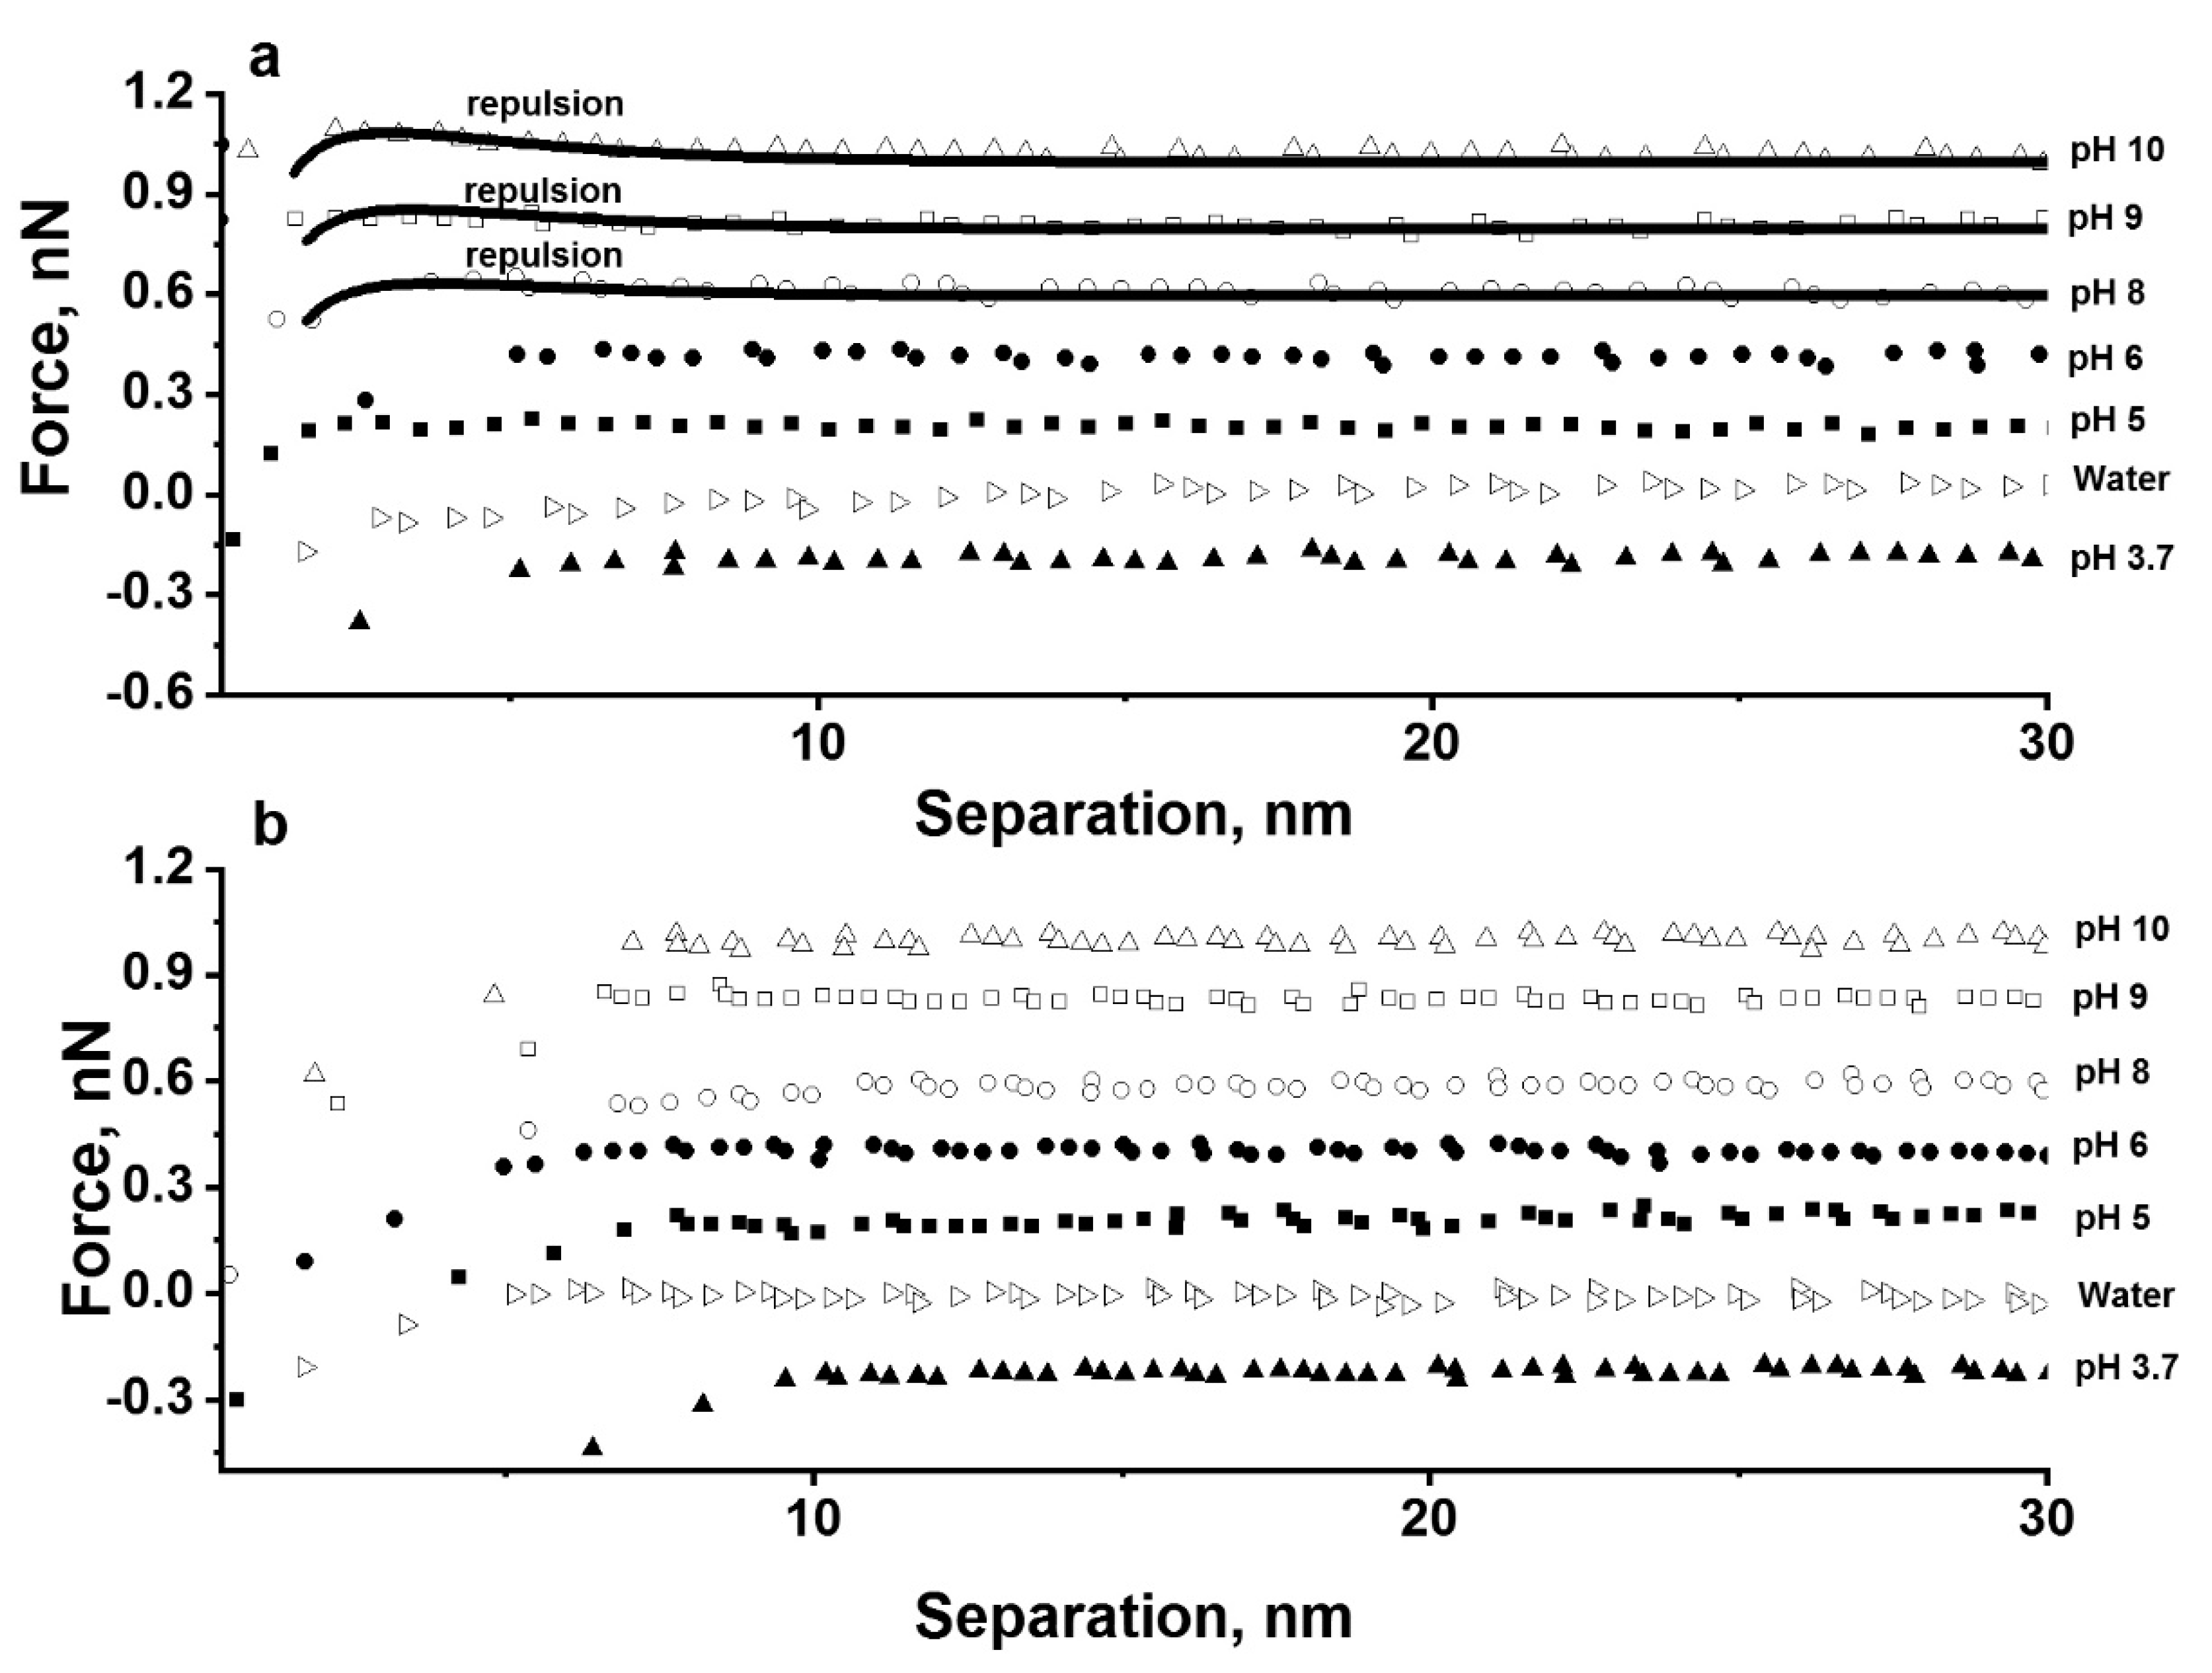
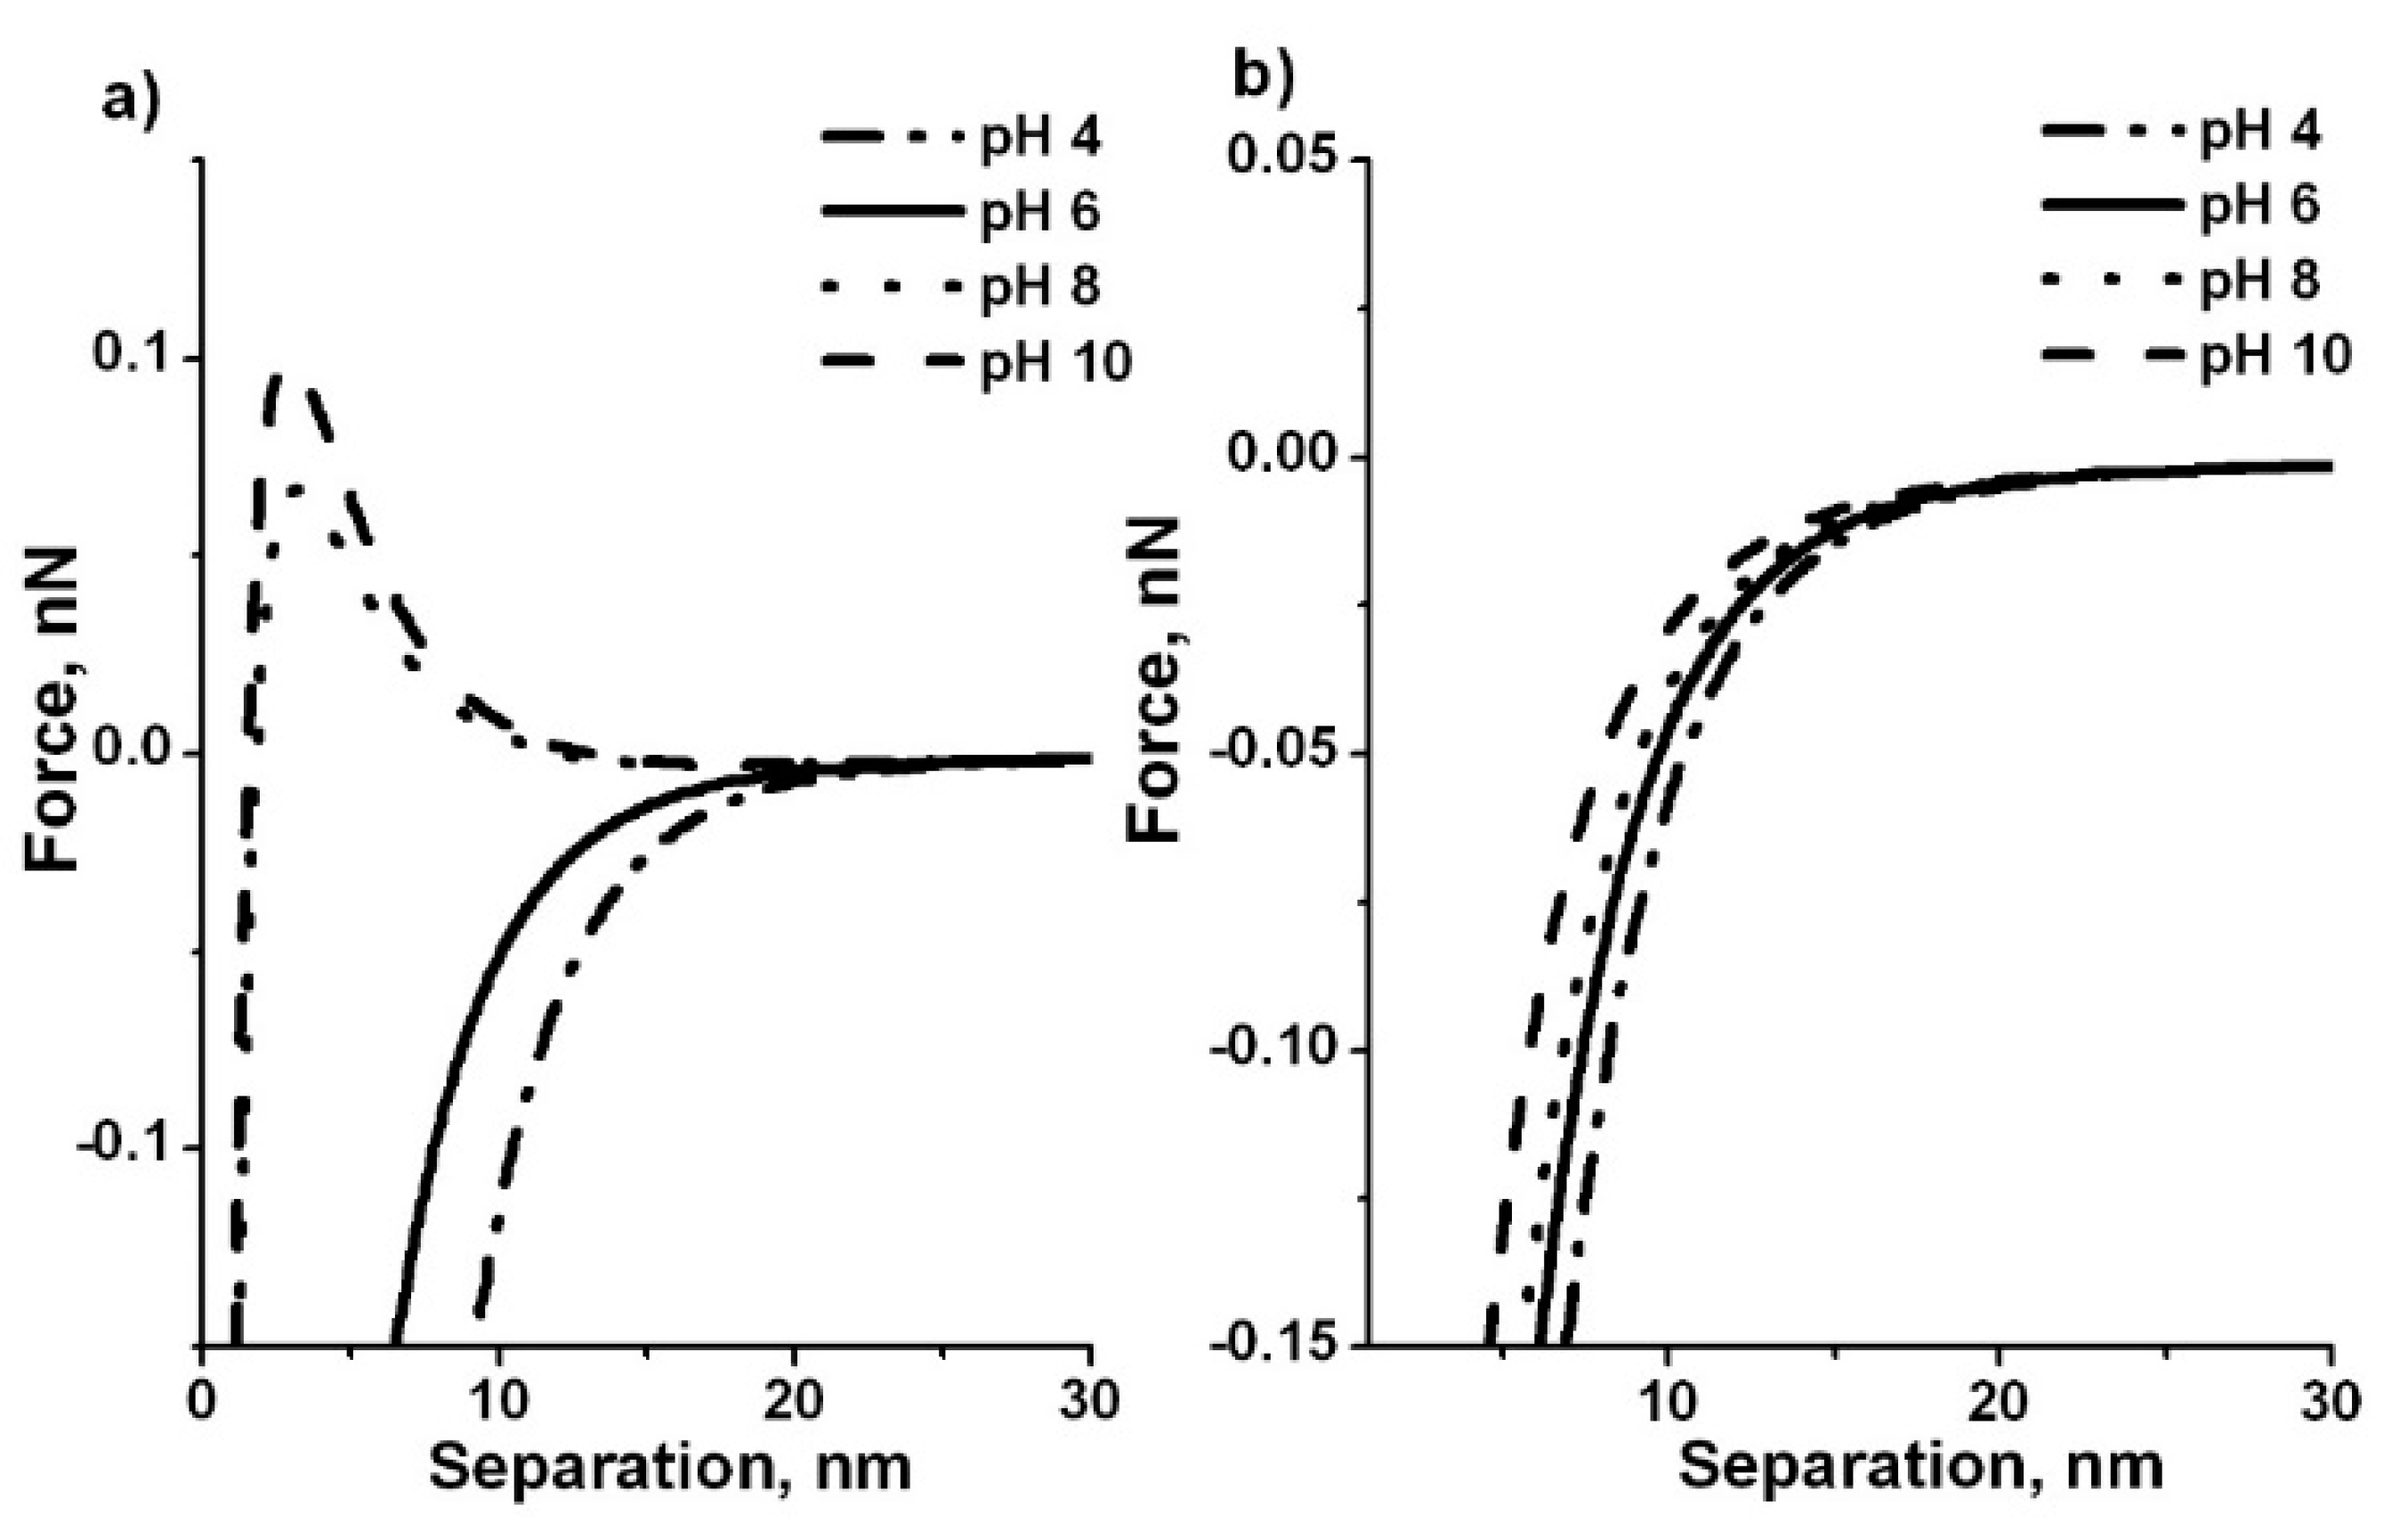
3.2. Effect of Ion Concentration and pH on Particle Interaction

The forces on approach were first measured in aqueous 10 mM NaCl and are shown in Figure 4.
The two surfaces (silica and magnetite) showed attraction at short distances for both pure water and the aqueous salt solution as media at low pH with a snap-in due to the higher gradient of attractive force than the spring constant of the cantilever. However, at pH 8, 9, and 10, the force was repulsive and stronger at pH 10 than at pH 8 and 9, but still with a snap-in, although at a shorter separation distance. The theoretical snap-in distance was calculated according to Equation (6) using a Hamaker constant of 5 × 10⁻²¹ J as obtained in Ref. [24]:
d s n a p = A · R 3 · k s 3 ,
where k s is the spring constant of the cantilever.
The calculated snap-in distance was 5.0 nm, which is in fairly good agreement with the experimentally observed snap-in distance at low pH, bearing in mind the accuracy of the nominal cantilever spring constant (some percent) [31]. Also, it should be noted that surface roughness can have an impact on the calculated Hamaker constant [7]. There are also other uncertainties and effects that can affect the evaluated Hamaker constant from the measured force-interaction curves [18,19]. The snap-in distance was estimated to be 3.4 nm due to the Coulombic repulsion between the two surfaces at higher pH. It should be noted that other non-DLVO forces can also affect the snap-in distance [12,16], and thus the provided values should be considered as an estimate.
The calculated attractive van der Waals force at a snap-in separation distance of 3.4 nm was 0.12 nN, as calculated for the case of a sphere approaching a flat surface as
F v d W = A · R 6 · D 2 ,
where D is the separation distance.
The observed qualitative changes in the interaction forces between magnetite and silica surfaces at different pH values of the aqueous NaCl solution were in reasonable agreement with the interaction trends expected from the measured zeta potentials, as shown in Figure 2 and Figure 3. The interaction is attractive from pH 3.7 to 6 (Figure 4). The change in the zeta potential of nanomagnetite and silica at pH 3.7 to 6 (compare Figure 2 and Figure 3) is expected to cause a small difference in the range of attractive interaction (Figure 4). However, contributions from varying surface roughnesses and undefined amounts of dissolved carbon dioxide in the solutions may also affect the range of the measured attraction and repulsion (Figure 4). The zeta potential of magnetite was positive in the pH range from 4 to 6 and negative above pH 6, while the zeta potential of silica remained negative in the whole investigated pH range from 3.7 to 10. Repulsive force was measured with AFM at a separation distance of around 10.2 nm at pH 8 and 9, while the repulsion at pH 10 was already measured at a slightly increased separation distance of around 12.8 nm. The observed repulsion should mainly be due to the electrical double-layer forces, which are dependent on the ionic strength of the solution. The calculated double-layer thickness (i.e., Debye length), using a common approach [3] was 3.03 nm for all the studied solutions because of the constant ionic strength. However, according to Figure 4, overlapping probably occurs even at a larger distance between magnetite and probe. An overlap of two electrical double layers during interaction can be measured with a sensitive cantilever and therefore can be expected at larger separation distances [32,33]. Accordingly, the calculated double-layer thickness may differ from the values measured with AFM. An exact value of the Debye length can be evaluated by fitting the DLVO model to the repulsive part of the force curves [34]. However, it was complicated to perform an accurate evaluation of the double-layer thickness from the model fitting presented in Figure 4 due to an occurred snap-in. In addition, the magnitude of repulsive forces can be reduced by the cantilever force instability at a short interaction distance due to the interplay between attractive and repulsive forces. The DLVO model, based on the linear approximation of the Poisson–Boltzmann equation with the constant surface potential boundary, was fitted to the force curves on approach at alkaline pH using calculated Debye length values; see the solid lines in Figure 4. Fitting to the force curves at pH 3.7, 5, and 6 was not done due to an early-occurred snap-in on all curves. A fitting of the DLVO model to experimental data required the use of the offset d 0 parameter, as proposed in Ref. [35]. This d 0   parameter is usually assumed as nanoroughness. The analytical Equation (8) was used to perform the fittings based on the DLVO model,
F D L V O = A · R 6 · ( d + d 0 ) 2 + 4 · π · ε · ε 0 · R · K d · φ 1 · φ 2 · e K d · ( d + d 0 ) .
In Equation (8), ε 0   is the permittivity of free space, ε is the permittivity of the medium, φ 1 and φ 2 are the surface potentials, K d 1 is the Debye length (i.e., double-layer thickness), R is the probe radius, d is the separation distance, d 0   is the “cut off” distance, and A is the Hamaker constant.
The d 0 parameter was set to 0.5–1 nm in the fittings. The magnitude of repulsion calculated this way corresponded to a measured repulsion maximum of around 0.1 nN, while the calculated repulsion at a “cut off” separation distance (i.e., the minimum interfacial distance between surfaces) of 0.165 nm [3] was much larger, viz., 1 nN. The discrepancy between the measured and theoretically calculated repulsion force possibly demonstrates the effect of the surface roughness in the study.
The typical force curves on approach between nanomagnetite and silica particles in aqueous solution containing 1 mM and 3.3 mM Ca2+ in the pH range from 3.7 to 10 are presented in Figure 5.
The repulsion is clearly observed at pH 8, 9, and 10 in aqueous 1 mM CaCl2 solution. A further increase of calcium ion concentration to 3.3 mM leads to a complete replacement of repulsive interaction by attractive forces. The attraction between magnetite and silica in 1 mM calcium solution was observed at pH 3.7, 5, and 6, while repulsion occurred at pH 8, 9, and 10. Snap-in at a very short separation distance occurred on the force curves after repulsion at alkaline pH, as previously discussed for the measurements conducted in aqueous NaCl solution as medium; see Figure 4. The repulsive interaction was detected at a distance of around 7.6 nm. The observed repulsive and attractive interaction was in good agreement with the interaction trends expected from the measured zeta potentials at the same conditions. The magnetite and silica particles had different signs of the charge at pH 3.7, 5, and 6, leading to attraction, while repulsion is expected to occur at pH 8, 9, and 10. The magnetite surface charge at alkaline pH should be positive or near neutral after degassing of the solution medium (Figure 3), while silica was negatively charged. However, the detected repulsion suggests that the magnetite surface was negatively charged. This indicates that some amount of carbon dioxide was dissolved in the aqueous solution during measurements due to an open type of liquid cell that had to be used for practical reasons. This indicates that the adsorption of carbon dioxide into alkaline solution may be a rather rapid process facilitated by the presence of calcium chloride. The DLVO model was fitted to the force curves at alkaline pH taking the measured zeta potentials and used as φ 1 and φ 2 in Equation (8). A good fit of the model to the experimental data suggests that interaction between magnetite and silica in 1 mM Ca2+ solution is mainly governed by the van der Waals attraction and double-layer repulsion. However, a possible contribution from hydrophobic and hydration non-DLVO forces should also be considered, as was demonstrated in [12,16], where short-range forces could be well described by an extended DLVO model [12]. In this study, such contributions were not evaluated due to possible complications from varying surface roughnesses, which can significantly affect the short-range forces, and due to an undefined amount of dissolved carbon dioxide in the solution due to an open AFM cell type.
The interaction between nanomagnetite and silica probe became attractive when the Ca2+ concentration was increased to 3.3 mM, as demonstrated in Figure 5b. The observed attraction agrees well with the measured zeta potentials shown in Figure 2 and Figure 3. The increase of the Ca2+ concentration to 3.3 mM resulted in an entirely positive surface charge on nanomagnetite, while silica surface was negatively charged. The force interactions measured with AFM at this Ca2+ concentration confirmed that the adsorbed Ca2+ rendered the magnetite surface charge positive at all studied pH levels. In the calculation of the adhesion forces using the JKR, Rumpf, and Rabinovich models, a theoretical Hamaker constant for Fe3O4–SiO2 interaction in water (5·10−21 J) was used [24].
The simulation using the DLVO model was performed for nanomagnetite and silica interaction in 1 mM and 3.3 mM calcium chloride solutions since the fitting of the DLVO model for attractive interaction was complicated due to the occurring snap-in. The simulated force interaction using the d 0   parameter (1 nm) for magnetite and silica is shown in Figure 6.
The simulated interaction in Figure 6a for the aqueous 1 mM Ca2+ system correlates well with the measured force curves presented in Figure 5a. Furthermore, the simulation demonstrates entirely attractive interaction for the magnetite and silica interaction in the aqueous 3 mM Ca2+ system; see Figure 6b. The magnitude of the attractive forces increased with the decrease of pH from 10 to 4. This is in good agreement with the measured force curves shown in Figure 5b. An established good correlation between the measured force curves and the simulated force curves using measured zeta potential confirmed that the main acting forces between nanomagnetite and silica are the van der Waals attraction and double-layer repulsion. The force at a very short separation distance of 1–2 nm was not investigated in this study due to the early snap-in on all the force curves.

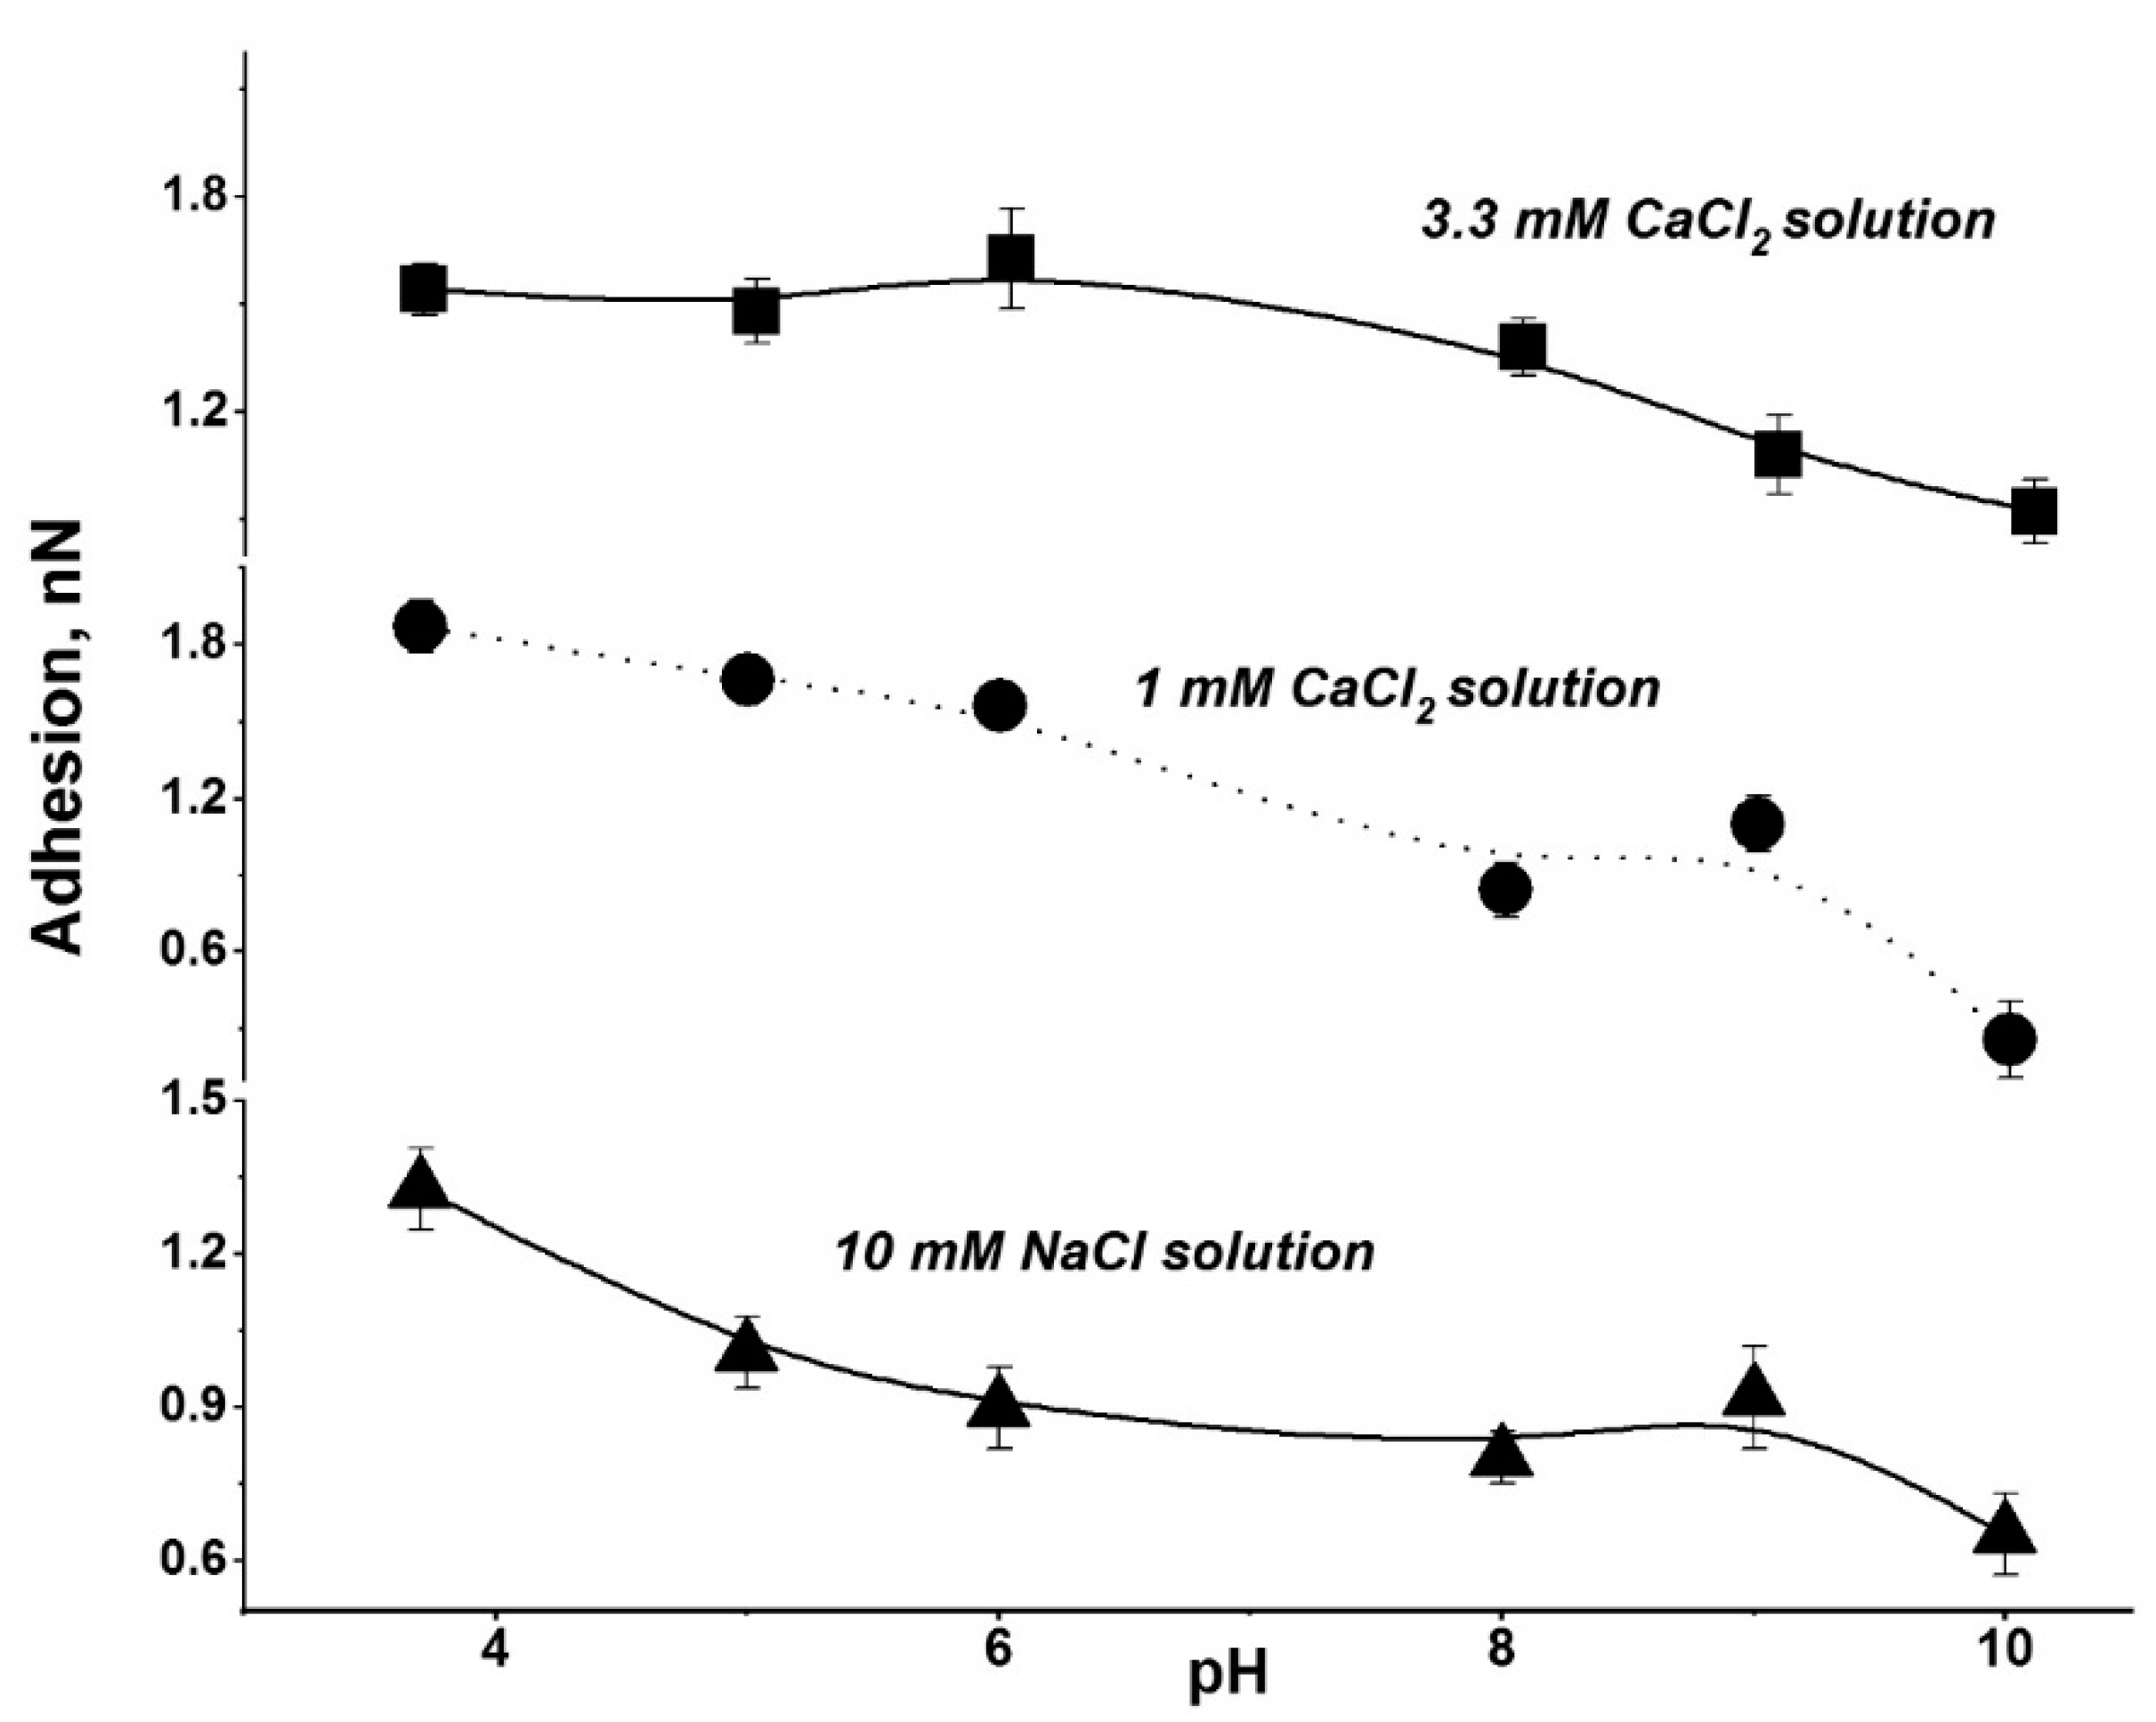
3.3. Adhesion Forces between Nanomagnetite and Silica

The variation of the measured adhesion forces versus pH is shown in Figure 7. The demonstrated adhesion forces may also be referred to as directly evaluated pull-off forces.
The pronounced decrease of the adhesion force from pH 3.7 to 6 is observed in 10 mM NaCl and 1 mM CaCl2 solutions. This is consistent with the measured zeta potentials that change from positive to neutral at around pH 6, whereas the silica probe surface remains negatively charged. Measured adhesion at pH 6 in 3.3 mM calcium solution as medium was similar to the measured values at pH 3.7 and 5. This was in accordance with a more detailed zeta potential vs. pH curve shown in Ref. [28], including a zeta-potential value also at pH 5. The adhesion force further decreased with increasing pH up to 10 for magnetite–silica interaction in 10 mM NaCl and 1 mM CaCl2 solutions, which was again consistent with the zeta-potential measurements. As discussed above, the comparison between calculated adhesion forces and zeta potentials at alkaline pH may suffer from the presence of dissolved carbon dioxide in AFM measurements, while dissolved carbon dioxide can easily be prohibited in zeta-potential measurements. However, this practical circumstance does not influence the obtained tendency of adhesion forces vs. pH. At alkaline pH, the aqueous 3.3 mM Ca2+ system showed decreased adhesion force with increasing pH up to 10. This was in good agreement with the zeta-potential measurements since the positive charge of the magnetite surface decreased slightly with increasing pH. However, nanomagnetite and silica particles tend to adhere stronger with an increase of Ca2+ concentration in the working solution at all pH values, which could affect the aggregation and dispersion of these particles in practical applications.
The measured adhesion forces in Figure 7 were compared with the adhesion forces calculated using the JKR, Rumpf, and Rabinovich models. This should only be considered as a qualitative comparison since a theoretical Hamaker constant was used and not the experimentally determined constant, taking into account surface charge changes. The adhesion force calculated using the theoretical Hamaker constant with the JKR model and Equation (2) was 40 nN, which is significantly larger in comparison with the measured adhesion. This overestimation is usually explained by the strong contact surface roughness and was previously reported and discussed in the literature [17,21,25]. The adhesion force using the Rumpf model and Equation (4) was calculated with an assumed surface spherical asperity radius of 1 nm, as previously determined and used in the DLVO model simulation and fitting with the d 0   parameter. The calculated adhesion force was 1.11 nN. It demonstrated much better correlation between the measured and the calculated adhesion. The improved correlation indicates the importance of the contact surface roughness effect. Surface roughness and peak-to-peak distances at short and long ranges were experimentally determined with AFM for a deposited nanomagnetite layer. The result was   r m s 2   = 1.19 nm for the short peak-to-peak distance λ 2 = 40 nm and r m s 1   = 9.94 nm for the long peak-to-peak distance λ 1   = 670 nm. These roughness values were used in the Rabinovich model (Equation (5)) to calculate the adhesion force, which was found to be 0.82 nN. This approach is the most experimentally valid in comparison with the JKR and Rumpf approaches. The adhesion force calculated using the Rabinovich model was smaller in comparison with the measured adhesion and the adhesion evaluated using the Rumpf model but in fairly good correlation with the magnitude of the measured adhesion. On the other hand, there are still some complications in applying the Rabinovich model due to unknown actual contact roughness, unless the deposited layer is very homogeneous and flat. The observed better correlation between the calculated and measured adhesion forces using the Rumpf and Rabinovich models compared with the JKR model indicates the importance of the nanoroughness effect. The validity of the adhesion models proposed by Rumpf and Rabinovich and a clear nanoroughness effect have also been demonstrated in AFM measurements on alumina substrates [36].

4. Conclusions

Force measurements between a layer of nanomagnetite particles and the spherical silica probe were conducted with AFM. The effect of Ca2+ on the surface properties of the nanomagnetite surface was studied. Zeta-potential measurements have shown that Ca2+ at a concentration of 1 mM rendered the magnetite surface negatively charged above the IEP due to dissolved carbon dioxide, whereas an increase of Ca2+ concentration to 3.3 mM led to a positively charged surface in the entire pH range between 3.7 and 10. The presence of dissolved carbon dioxide in working solution was important for the interpretation of the force measurements. The interaction between silica and nanomagnetite is attractive in 10 mM NaCl solution at pH 3.7, 5, and 6, while electrostatic repulsion was observed at pH 8, 9, and 10. Similar force dependencies are observed for the silica and nanomagnetite interaction in aqueous 1 mM CaCl2 with the same ionic strength (10 mM), but the repulsion at alkaline pH is less pronounced. Further increase of the calcium ion concentration to 3.3 mM caused the magnetite to be positively charged in the entire pH range from 3.7 to 10, resulting in a purely attractive interaction between silica and nanomagnetite. The qualitative changes of the interaction forces with pH were consistent with the zeta-potential measurement. The interaction forces measured on approach were probably mainly due to van der Waals forces and electrical double-layer forces, as supported by good fitting of the DLVO model to the experimental data. The contributions from non-DLVO forces should also be considered for such interaction system. However, the short-range forces were not studied in detail in this study due to nanomagnetite film roughness effect. The discrepancy between the measured magnitude of the adhesion forces and the calculated adhesion forces using the JKR, Rumpf, and Rabinovich models was attributed to the effect of the surface nanoroughness. These results can be of importance for a broad range of applications where iron oxide and silica surface properties and their interaction, as well as the effect of calcium ion concentration, are essential.

Author Contributions

I.D.: Conceptualization, Methodology, Investigation, AFM data acquisition, Formal analysis, Writing—original draft. E.M.: Investigation, Synthesis, Formal analysis, Review & Editing. A.H.: Conceptualization, Supervision, Validation, Writing—review & editing. N.A.: Conceptualization, Supervision, Validation, Writing—review & editing. All authors have read and agreed to the published version of the manuscript.

Funding

This research received no external funding.

Acknowledgments

The Kempe Foundations, SMK-2546 and SMK-1734, is acknowledged for funding the AFM equipment. This is a contribution of the Centre of Advanced Mining and Metallurgy (CAMM) at Luleå University of Technology. We also thank Johnny Grahn for the help with the SEM measurements and Hans Weber for valuable discussions.

Conflicts of Interest

The authors declare no conflict of interest.

References

  1. Ducker, W.A.; Senden, T.J.; Pashley, R.M. Direct measurement of colloidal forces using an atomic force microscope. Nature 1991, 353, 239–241. [Google Scholar] [CrossRef]
  2. Kappl, M.; Butt, H.-J. The Colloidal Probe Technique and its Application to Adhesion Force Measurements. Part. Part. Syst. Charact. 2002, 19, 129–143. [Google Scholar] [CrossRef]
  3. Israelachvili, J. Intermolecular and Surface Forces, 3rd ed.; Academic Press: Cambridge, MA, USA, 2011. [Google Scholar]
  4. Dobryden, I.; Yang, X.; Almqvist, N.; Holmgren, A.; Weber, H. An atomic force microscopy study of the interaction between magnetite particles: The effect of Ca2+ ions and pH. Powder Technol. 2013, 233. [Google Scholar] [CrossRef]
  5. Dobryden, I.; Potapova, E.; Holmgren, A.; Weber, H.; Hedlund, J.; Almqvist, N. Force interactions between magnetite silica. and bentonite studied with atomic force microscopy. Phys. Chem. Miner. 2015, 42. [Google Scholar] [CrossRef]
  6. Champagne, P.-O.; Westwick, H.; Bouthillier, A.; Sawan, M. Colloidal stability of superparamagnetic iron oxide nanoparticles in the central nervous system: A review. Nanomedicine 2018, 13, 1385–1400. [Google Scholar] [CrossRef]
  7. Stevenson, M.C.; Beaudoin, S.P.; Corti, D.S. Toward an Improved Method for Determining the Hamaker Constant of Solid Materials Using Atomic Force Microscopy. I. Quasi-Static Analysis for Arbitrary Surface Roughness. J. Phys. Chem. C 2020, 124, 3014–3027. [Google Scholar] [CrossRef]
  8. Voogt, F.C.; Palstra, T.T.M.; Niesen, L.; Rogojanu, O.C.; James, M.A.; Hibma, T. Superparamagnetic behavior of structural domains in epitaxial ultrathin magnetite films. Phys. Rev. B 1998, 57, R8107–R8110. [Google Scholar] [CrossRef] [Green Version]
  9. Potapova, E.; Yang, X.; Westerstrand, M.; Grahn, M.; Holmgren, A.; Hedlund, J. Interfacial properties of natural magnetite particles compared with their synthetic analogue. Miner. Eng. 2012, 36–38, 187–194. [Google Scholar] [CrossRef] [Green Version]
  10. Toikka, G.; Hayes, R.A.; Ralston, J.C. Adhesion of Iron Oxide to Silica Studied by Atomic Force Microscopy. J. Colloid Interface Sci. 1996, 180, 329–338. [Google Scholar] [CrossRef]
  11. Pensini, E.; Sleep, B.E.; Yip, C.M.; O’Carroll, D.M. Forces of interaction between fresh iron particles and iron oxide (magnetite): Effect of water chemistry and polymer coatings. Colloids Surf. A Physicochem. Eng. Asp. 2013, 433, 104–110. [Google Scholar] [CrossRef]
  12. Pensini, E.; Sleep, B.E.; Yip, C.M.; O’Carroll, D.M. Forces of Interactions between Bare and Polymer-Coated Iron and Silica: Effect of pH. Ionic Strength. and Humic Acids. Environ. Sci. Technol. 2012, 46, 13401–13408. [Google Scholar] [CrossRef]
  13. Christenson, H.K. DLVO (Derjaguin–Landau–Verwey–Overbeek) theory and solvation forces between mica surfaces in polar and hydrogen-bonding liquids. J. Chem. Soc. Faraday Trans. 1 Phys. Chem. Condens. Phases 1984, 80, 1933–1946. [Google Scholar] [CrossRef]
  14. Butt, H.-J.; Cappella, B.; Kappl, M. Force measurements with the atomic force microscope: Technique. interpretation and applications. Surf. Sci. Rep. 2005, 59, 1–152. [Google Scholar] [CrossRef] [Green Version]
  15. Trefalt, G.; Behrens, S.H.; Borkovec, M. Charge Regulation in the Electrical Double Layer: Ion Adsorption and Surface Interactions. Langmuir 2016, 32, 380–400. [Google Scholar] [CrossRef] [PubMed]
  16. Ruiz-Cabello, F.J.M.; Oncsik, T.; Rodriguez-Valverde, M.A.; Maroni, P.; Cabrerizo-Vilchez, M. Specific Ion Effects and pH Dependence on the Interaction Forces between Polystyrene Particles. Langmuir 2016, 32, 11918–11927. [Google Scholar] [CrossRef] [PubMed]
  17. Rabinovich, Y.I.; Adler, J.J.; Ata, A.; Singh, R.K.; Moudgil, B.M. Adhesion between Nanoscale Rough Surfaces: II. Measurement and Comparison with Theory. J. Colloid Interface Sci. 2000, 232, 17–24. [Google Scholar] [CrossRef] [PubMed]
  18. Luo, Y.; Gao, X.; Tian, R.; Li, H. Approach to Estimation of Hamaker Constant as Taking Hofmeister Effects into Account. J. Phys. Chem. C 2018, 122, 9432–9440. [Google Scholar] [CrossRef]
  19. Weimer, J.J. An uncertainty budget analysis on the Hamaker constant determined when fitting force-distance curves for a sphere-plate system. Measurement 2018, 118, 120–134. [Google Scholar] [CrossRef]
  20. Johnson, K.L.; Kendall, K.; Roberts, A.D. Surface energy and the contact of elastic solids. Proc. R Soc. Lond. A Math. Phys. Sci. 1971, 324, 301–313. [Google Scholar] [CrossRef] [Green Version]
  21. Rumpf, H. Particle Technology; Chapman and Hall: London, UK, 1990. [Google Scholar]
  22. Potapova, E.; Grahn, M.; Holmgren, A.; Hedlund, J. The effect of calcium ions and sodium silicate on the adsorption of a model anionic flotation collector on magnetite studied by ATR-FTIR spectroscopy. J. Colloid Interface Sci. 2010, 345, 96–102. [Google Scholar] [CrossRef]
  23. Senden, T.J. Force microscopy and surface interactions. Curr. Opin. Colloid Interface Sci. 2001, 6, 95–101. [Google Scholar] [CrossRef]
  24. Faure, B.; Salazar-Alvarez, G.; Bergström, L. Hamaker Constants of Iron Oxide Nanoparticles. Langmuir 2011, 27, 8659–8664. [Google Scholar] [CrossRef]
  25. Cappella, B.; Dietler, G. Force-distance curves by atomic force microscopy. Surf. Sci. Rep. 1999, 34, 1–104. [Google Scholar] [CrossRef] [Green Version]
  26. Janusz, W.; Patkowski, J.; Chibowski, S. Competitive adsorption of Ca2+ and Zn(II) ions at monodispersed SiO2/electrolyte solution interface. J. Colloid Interface Sci. 2003, 266, 259–268. [Google Scholar] [CrossRef]
  27. Liu, J.; Xu, Z.; Masliyah, J. Studies on Bitumen−Silica Interaction in Aqueous Solutions by Atomic Force Microscopy. Langmuir 2003, 19, 3911–3920. [Google Scholar] [CrossRef]
  28. Potapova, E.; Yang, X.; Grahn, M.; Holmgren, A.; Forsmo, S.; Fredriksson, A.; Hedlund, J. The effect of calcium ions. sodium silicate and surfactant on charge and wettability of magnetite. Colloids Surf. A Physicochem. Eng. Asp. 2011, 386, 79–86. [Google Scholar] [CrossRef]
  29. Zeltner, W.A.; Anderson, M.A. Surface charge development at the goethite/aqueous solution interface: Effects of CO2 adsorption. Langmuir 1988, 4, 469–474. [Google Scholar] [CrossRef]
  30. Potapova, E.; Jolsterå, R.; Holmgren, A.; Grahn, M. In-situ spectroscopic study of surfactant adsorption onto hematite from binary mixtures and the effect of inorganic ions. Surf. Interface Anal. 2014, 46, 1110–1114. [Google Scholar] [CrossRef]
  31. Burnham, N.A.; Chen, X.; Hodges, C.S.; Matei, G.A.; Thoreson, E.; Roberts, C.J.; Davies, M.C.; Tendler, S.J.B. Comparison of calibration methods for atomic-force microscopy cantilevers. Nanotechnology 2002, 14, 1–6. [Google Scholar] [CrossRef]
  32. Liang, Y.; Hilal, N.; Langston, P.; Starov, V. Interaction forces between colloidal particles in liquid: Theory and experiment. Adv. Colloid Interface Sci. 2007, 134–135, 151–166. [Google Scholar] [CrossRef]
  33. Baldessari, F. Electrokinetics in nanochannels: Part I. Electric double layer overlap and channel-to-well equilibrium. J. Colloid Interface Sci. 2008, 325, 526–538. [Google Scholar] [CrossRef] [PubMed]
  34. Lin, X.Y.; Creuzet, F.; Arribart, H. Atomic force microscopy for local characterization of surface acid-base properties. J. Phys. Chem. 1993, 97, 7272–7276. [Google Scholar] [CrossRef]
  35. Sokolov, I.Y.; Ong, Q.K.; Shodiev, H.; Chechik, N.; James, D.; Oliver, M. AFM study of forces between silica. silicon nitride and polyurethane pads. J. Colloid Interface Sci. 2006, 300, 475–481. [Google Scholar] [CrossRef] [PubMed]
  36. Laitinen, O.; Bauer, K.; Niinimaki, J.; Peuker, U.A. Validity of the Rumpf and the Rabinovich adhesion force models for alumina substrates with nanoscale roughness. Powder Technol. 2013, 246, 545–552. [Google Scholar] [CrossRef]
Figure 1. A typical height image of nanomagnetite layer on the glass substrate acquired with AFM (a). The SEM image (b) recorded in low-vacuum conditions showing a spherical silica particle of 3.5 µm size.
Colloids 04 00041 g001
Figure 2. Zeta potential of silica particles as a function of pH in 10 mM aqueous NaCl, 7 mM NaCl + 1 mM CaCl2, and 3.3 mM CaCl2, measured for suspensions with a silica concentration of 50 mgL−1. The ionic strength is constant at 10 mM.
Colloids 04 00041 g002
Figure 3. Zeta potential of nanomagnetite particles as a function of pH in 10 mM NaCl, 1 mM CaCl2 and 7 mM NaCl, degassed and non-degassed, and 3.3 mM CaCl2 solutions.
Colloids 04 00041 g003
Figure 4. The typical force curves on approach between spherical silica probe and nanomagnetite layer measured in 10 mM NaCl solution. Repulsive interaction is clearly observed at pH 8, 9, and 10, while attractive forces are measured at pH 3.7, 5, and 6 and in distilled water. The solid line is the DLVO model fit. The curves are equally separated along the force axis for clarity.
Colloids 04 00041 g004
Figure 5. The typical force curves on approach between spherical silica probe and nanomagnetite layer measured in aqueous 1 mM CaCl2 solution as medium (a) and in 3.3 mM CaCl2 solution as medium (b). The solid line is the DLVO model fit. The curves are equally separated along the force axis for clarity.
Colloids 04 00041 g005
Figure 6. Simulated interaction between spherical silica probe and nanomagnetite at pH 4, 6, 8, and 10 in 1 mM CaCl2 solution (a) and 3.3 mM CaCl2 solution (b) using the DLVO model. The simulation was performed by Equation (8).
Colloids 04 00041 g006
Figure 7. The figure shows the dependence of the adhesion force between silica probe and nanomagnetite versus pH in aqueous 10 mM NaCl, 1 mM CaCl2 together with 7 mM NaCl, and 3.3 mM CaCl2 solutions. It is clear that the adhesion force decreases with increasing pH in all solutions studied.
Colloids 04 00041 g007

