Abstract
The deposition of layers of different polycations (synthetic or derived from natural, renewable resources) onto oppositely charged surfaces has been studied using ellipsometry and quartz crystal microbalance with dissipation monitoring (QCM-D). Information about the thickness of the deposited layers and their water content was ascertained. The adsorption of the different polycations onto negatively charged surfaces was found to be a complex process, which is influenced by the chemical nature of the polymer chains, ionic strength, polymer concentration and the addition of additives such as surfactants. The experimental picture shows a good agreement with theoretical calculations performed using the Self-Consistent Mean Field (SCF) approach. The results show that the electrostatically-driven deposition can be tuned by modifying the physico-chemical properties of the solutions and the chemical nature of the adsorbed polymer. This versatile approach is a big step forward in aiding the design of new polymers for many industrial applications and, in particular, the design of sustainable washing formulations for cosmetic applications.
1. Introduction
Polyelectrolyte coatings are important in many technological applications, such as the stabilization of colloidal dispersions, the fabrication of antifouling coatings, the performance of shampoos and conditioning formulations in cosmetics, or the modification of the wettability of separation membranes [1,2,3,4]. This widespread use of polyelectrolyte coatings or layers in science and technology is due to the ability of most charged polymers to modify the surface properties of the substrates, such as the wettability, lubrication, adhesion or biological resistance [5,6]. The relevance and impact of polyelectrolyte layers has fostered extensive research, both experimental [7,8,9] and theoretical [10,11,12,13], for disentangling the driving forces governing the deposition process and their effects on the physico-chemical properties and structure of the surfaces [14,15,16,17].
The adsorption of polyelectrolytes onto oppositely charged surfaces is a very complex process, which is affected by any variable affecting the balance of interactions occurring in the solution, and that between the solution and the solid surface [9,18,19,20,21,22]. These variables may be tuned by changing the different physico-chemical parameters of the solution, including pH, ionic strength or temperature, that independently affect the solubility of the polyelectrolyte [14,23,24,25,26]. Other parameters, such as the chemical nature of the polyelectrolytes, the chain flexibility and molecular weight, solution concentration and the presence of surfactants, are very important for controlling the adsorption of polyelectrolytes onto oppositely charged surfaces [14,24,27,28,29]. Therefore, a detailed understanding of the impact of polyelectrolyte charge density (polymer cationicity), concentration, the ionic strengths of the polyelectrolyte solutions and the addition of surfactants into the adsorption process is essential for designing polyelectrolyte coatings with controlled structures and physico-chemical properties [18,19,30].
A detailed understanding of the physico-chemical parameters controlling polyelectrolyte deposition is important in many industrial fields, and particularly in cosmetics, wherein the current focus is on designing and developing eco-friendly and biodegradable polymers, preferably from renewable, natural resources [31]. Today, there is an undeniable worldwide need to design and develop sustainable materials. Over the last few decades, scientists have created and developed many high performing, unsustainable materials for many applications. The challenge today is to improve on the sustainability of these materials whilst maintaining or improving the performance. To meet this challenge, a deeper understanding of the mechanism of action of sustainable materials is needed. This is particularly the case with polyelectrolytes, particularly cationic polymers, which are notoriously poor on any sustainability scale.
The above discussion suggests that any variable modifying the ionic equilibrium of polyelectrolyte solutions can ultimately affect the process of deposition onto solid surfaces. For example, a reduction in the effective charge density of a polyelectrolyte drives the polymer chains into a coiled conformation, as a result of the hindering of the intra- and inter-chain electrostatic repulsions. As a consequence, the polymer deposits as thick layers, containing many loops and tails protruding into the solution (fuzzy layers). On the contrary, an increase in the effective charge density of the polymers drives the polymer chains into a more extended conformation, and consequently they attach onto the surface in such an extended conformation, resulting in the formation of thin layers [20,32,33,34]. The architecture of the deposited layer is expected to modify the properties of the layers, including the hydration and mechanical properties.
This work analyzes the effect of the polyelectrolyte concentration, ionic strength and the addition of an oppositely charged surfactant into the deposition of several polycations onto negatively charged surfaces. The present study analyzes the adsorption behavior of a widely used synthetic polycation, poly (diallyldimethylammonium chloride), and two polymers with a polysaccharide backbone, onto negatively charged, modified gold or silica surfaces. The two polymers with a polysaccharide backbone come from natural, renewable sources, and have different degrees of permanent or pH-dependent positive charges essential to understanding the impact of the nature of the polymer on the deposition behavior. Quartz crystal microbalance with dissipation monitoring (QCM-D) and ellipsometry have been used to determine layer thickness in the wet and dry state respectively, and thus allow a calculation of the water content of the adsorbed layer. With the predictions for the adsorption process obtained by theoretical calculations performed using the Self-Consistent Mean Field theory, these studies provide important information concerning the impact of the chemical nature of the polymer, ionic strength, polymer concentration and addition of additives such as surfactants into the adsorption processes, and help in understanding the mechanism of film formation in natural (or from natural resources) polymers. This study demonstrates the potential of such an approach in the design of new polymers for industrial products and, in particular, the design of sustainable polymers for cosmetic formulations.
2. Materials and Methods
2.1. Materials
Poly (diallyldimethylammonium chloride) (PDADMAC), with a molecular weight in the 100–150 kDa range, and chitosan (CHI), with a molecular weight in the 50–80 kDa range and a degree of deacetylation of 85%, were purchased from Sigma-Aldrich (Saint Louis, MO, USA). Hydroxyethylcellulose quaternized with 2,3-epoxypropyltrimethylammonium chloride (JR400) with a molecular weight in the 400–500 kDa range was purchased from the Solvay Group (Brussels, Belgium). Figure 1 shows the molecular structures of the different polymers used in this study. CHI is derived from the deacetylation (enzymatic or chemical) of naturally sourced chitin, which is poly (N-acetyl-d-glucosamine). Deacetylation leads to CHI with different ratios and substitution patterns of the monomers of N-acetyl-d-glucosamine and d-glucosamine. Hydroxyethylcellulose quaternized with 2,3-epoxypropyltrimethylammonium chloride (JR400) is derived from the transformation of readily bio-sourced cellulose creating a non-crystalline water-soluble polycation with improved sustainability over traditional polycations such as PDADMAC. Polymers were used as received and without further purification.
Figure 1.
Molecular structures of the three polymers used in this study.
Sodium Laureth Sulfate (SLES), with 2 oxyethylene groups, was purchased from Kao Chemical Europe S.L. (Barcelona, Spain) and was purified by recrystallization from ethanol.
Glacial acetic acid with a purity > 99.99%, and NaOH, both purchased from Sigma-Aldrich, were used for adjusting the pH of the solutions, and NaCl (Sigma-Aldrich, purity > 99.9%) was used for controlling the ionic strength of the solutions.
Ultrapure deionized water used for cleaning and solution preparation was obtained by a multicartridge purification system AquaMAXTM-Ultra 370 Series. (Young Lin Instrument Co., Ltd., Gyeonggi-do, Korea), presenting a resistivity higher than 18 MΩ∙cm, and a total organic content lower than 6 ppm.
The solutions were prepared in water and the pH was fixed using glacial acetic acid at 4.8 for CHI solutions and at 5.6 for those of PDADMAC and JR400. The choice of different pH values for the CHI solutions and those of PDADMAC and JR400 is required in order to maximize the number of charged monomers in the CHI chains. This is because CHI is a weak polyelectrolyte with a charge density highly sensitive to the pH, whereas JR400 and PDADMAC are strong polyelectrolytes, with a charge density that remains almost unaffected by the change of pH of the solutions.
2.2. Study of the Adsorption onto Solid Surfaces
The adsorption experiments were performed under static conditions. Firstly, the Teflon measurement chamber was flushed with an aqueous solution containing the same pH and ionic strength as the polymer/polyelectrolyte solution to be studied. This enables a stable baseline that was used as reference for the measurement of the adsorption process. Afterwards, the solution containing the polyelectrolyte (or its mixture with the surfactant) is injected into the chamber and the adsorption proceeds until the steady stationary state is reached. The last step includes the rinsing of the cell with a solution containing the same pH and NaCl concentration as that used for the deposition of the polyelectrolyte layer.
The adsorption was performed using two complementary techniques: (i) quartz crystal microbalance with dissipation monitoring (QCM-D), and (ii) ellipsometry. A QCM-D from KSV (Model QCM Z-500, Espoo, Finland) fitted with gold coated AT-cut quartz crystals was used. These crystals were cleaned with piranha solution (70% sulfuric acid/30% hydrogen peroxide) over 30 min, and then thoroughly rinsed with pure water. Negatively charged thiol-decorated gold substrates, obtained by the deposition and covalent reaction of a self-assembled monolayer of the sodium salt of 3-mercapto-1-propanesulfonic acid (hereafter thiol) onto the electrode surface, were used as surfaces for studying the adsorption of the polyelectrolytes and their mixtures with surfactants in QCM-D experiments. These surfaces are known to be a good representation of the negatively charged cysteinate-rich surface of weathered, damaged human hair. QCM-D measures the impedance spectra of a quartz crystal for the fundamental frequency (f = 5 MHz) and for the odd overtones up to the 11th. The impedance spectra were analyzed using a single layer model following the procedure described by Voinova et al. [35], which provides the effective acoustic thickness or hydrodynamic thickness of the adsorbed layer, hac. This allows one to relate the changes in the resonant frequency Δf and dissipation factor ΔD of the different overtones (note that fundamental frequency is not considered for data analysis due to the noisy character of its signal) to the physical parameters of the layers (thickness hj, density ρj, elasticity μj and viscosity ηj) using the following set of equations:
and
where ρ0 = 2.65 g/cm3 and h0 = 14 mm are the density of the quartz crystal and its thickness, respectively. η and δ = (2η/ρ)0.5 are the viscosity of the bulk liquid (which was about 0.890 mPa·s) and the viscous penetration depth of the shear wave in the bulk liquid, respectively, with ρ = 0.997 g/cm3 being the density of the bulk liquid. ω = 2πf is the angular frequency of the oscillation. Equations (1) and (2) were used for modeling the experimental data, using a Simplex algorithm to find the values of the physical properties of the layers that minimize the differences between the experimental values of Δf and ΔD, and those calculated. In this study, ρj was fixed at a value of 1.1 g/cm3, whereas μj and ηj were obtained together with the layer thickness from the analysis of the experimental changes in frequency and dissipation obtained from the experiments. μj and ηj were found to have values in the ranges 103–106 Pa and 10−3–0.1 Pa·s, respectively. It is worth mentioning that the change of the values used for the densities and viscosities in Equations (1) and (2) within a physical reliable range does not impact significantly on the obtained result.
An imaging null-ellipsometer from Nanofilm (Model EP3, Gottingen, Germany) was also used to determine the amount of material adsorbed onto the solid surfaces as the optical thickness, hop. Ellipsometry experiments were carried out using a solid–liquid cell at a fixed angle of 60° using silica plates as substrate (Siltronix, Archamps, France). These substrates were treated with piranha solution for 30 min to create a surface with similar charge and water contact angle to those of the thiol-decorated gold surfaces, which allows the performing of a quantitative comparison between the results obtained by QCM-D and ellipsometry. The validity of this approach was proven in our previous work, where the adsorption of charged polyelectrolytes onto thiol-decorated gold electrodes, and electrodes coated with a silica layer similar to that of the plates used in ellipsometry, was found to be similar [9]. The experimental variables measured in ellipsometry are the ellipsometric angles, Δ and Ψ, which are related to the ratio between the reflection coefficients for the parallel (rp) and normal (rs) components of the magnetic field derived by Fresnel, i.e., to the ellipticity ρe [36,37]
The determination of the thickness and the refractive index from the experimental measurements requires the assumption of a slab model enabling a description of the experimental configuration. In our work, a slab containing four different layers was assumed: the first layer corresponds to the silicon substrate, with a refractive index n = 4.1653 − 0.049i, the second layer is the native oxide layer, with a refractive index n = 1.4653 and a thickness obtained from the analysis of the measurements performed for the bare silicon wafer in water. The outermost layer of the model (fourth layer) was the solution, which was assumed to have a constant refractive index equal to that of the polymer solution (n ~ 1.33). The third layer of the model corresponds to the adsorption layer. Once the slab is defined, the thickness and the refractive index are obtained as the pair of values that minimize the differences between the experimental values of the ellipsometric angles and those obtained solving the Fresnel’s equation using the four-layer model [37,38].
It is worth noting that neither hac or hop should not be considered as absolute thicknesses due to the heterogeneity of most of the polyelectrolyte layers, thus the discussion contained in this work considers hac and hop as effective thicknesses, which provides different information about the adsorbed amount within the layer [8,27]. The combination of ellipsometry and QCM-D is important due to the different sensitivities of these techniques to the water associated with the adsorbed layer. QCM-D provides information regarding the mass of the layer formed by polymer, surfactant or both, and the water associated with this layer, whereas ellipsometry, which is based in the differences between the refractive indexes of the layer and the medium, only gives information of the amount of polymer (surfactant or both) adsorbed on the layer. This difference leads to hop ≤ hac, and allows one to estimate the water content of the layers xw as [39,40].
2.3. Self-Consistent Field Calculations
Self-Consistent Mean Field Calculations (SCF) are an efficient alternative to atomistic simulations for capturing the relevant features of the thermodynamics and structures of polyelectrolytes and polyelectrolyte–surfactant mixtures at equilibrium. This theoretical approach, based on the minimization of the mean-field free-energy functional, has the advantage of including chemical structures of the species, whereas atomistic details are not considered, and allows one to obtain a semi-quantitative prediction of the most probable structures of complex mixtures in the bulk and upon adsorption onto solid surfaces. In our previous papers [13,28,41,42], the SCF method was successfully applied in order to understand the interactions occurring between polyelectrolytes and surfactants in aqueous medium, and their application onto hair-like model surfaces. These papers are referenced to give specific details about the methodology.
The SCF approach parametrizes the interacting molecular species in terms of the solvent-mediated Flory–Huggins (FH) parameters, χ, the dielectric medium, ε, and the valence, ν, of the chemical species (see Table 1). The model introduces water hydrogen-bonding ability, using a 5-sites description of water molecules and negative FH parameters that ensure the solubility of the species. All the charged groups use such 5-sites representation. Because SCF calculations require a discretization of the molecules, a reference segment size of 0.3 nm was used [41,42]. From mean-field free-energy functional minimization (which depends on the molecule’s density), one obtains the equilibrium density profiles of the simulation cell of all species. Further details on the procedure can be found in the literature [43,44,45,46,47].

Table 1.
Flory–Huggins interaction parameters, χ, between various pairs of segments, relative dielectric constant, ε, and valence, ν, of the segment types as used in SCF calculations. Segment types X, Z and G denote the deprotonated segment of carboxylic group, and the amine group of chitosan and saccharide pseudo-rings, respectively, and Si denotes the surface.
Finally, SCF requires a description of the polymer chains in terms of molecular segment types. The discretization scheme is not unique, but the parametrization shown in Table 1 reflects the adaptation of the parameters with respect to the structures such that both physics and chemistry are fulfilled; the first by cross-checking that titration, solubility and film thickness behave like the experimental observations, and the second by verifying that the parameters make sense with regard to chemical rules. With such constraints, we write polymer chains in terms of SMILES (Simplified Molecular Input Line Entry Specification) [48,49], which gives:
- Chitosan:(C)(((G)2[(C)(OH)][(OH)](G)[(O)][(Z)2[(Z)][(Z)](Z)](C)(O))n((G)2[(C)(OH)](G)[(OH)(C)[O](C)][(O)](C)(O))m)p(C)
- JR400:(C)(((G)2[(C)][(C)(O)(C)2(OH)](G)[(C)(OH)][(O)](C)(O)1((G)2[(C)(O)((C)2(O))2(C)2[(OH)](C)(N)2[(N)][(N)](N)][(C)](G)[(O)][(OH)](C)(O))1)k(C)
- PDADMAC: ((C)(N)2[(N)][(N)](N)(C))l
- SLES: (C)12((O)(C)2)2(S)2[(S)[(S)](S)
- Acetic Acid: (C)(C)[(OH)](X)2[(X)][(X)](X)
3. Results and Discussion
3.1. Effect of the Ionic Strength, Polymer Cationicity and Polymer Concentration on the Deposition of Polyelectrolytes
Understanding the deposition of polyelectrolyte layers requires an appreciation of the reversibility of the adsorption process (i.e., desorption). Desorption is studied during a rinsing process with an aqueous solution containing the same NaCl concentration. It is generally assumed that the adsorption of polyelectrolytes onto a negatively charged surface is an almost irreversible process. This irreversibility is explained in terms of the dynamics of the formation/breaking of the bonds between the adsorbent and adsorbate. Thus, the complete desorption of a polymer chain requires that all the bonding segments be desorbed simultaneously from the surface. However, the desorption process of the initially attached segments requires a certain amount time, which may allow the attachment of new segments to the surface, and this usually prevents the desorption process. Figure 2a,b show the dependence of the hydrodynamic thickness, hac, of CHI layers, as deposited and after a rinsing process, on the NaCl concentration (cNaCl). It is worth noting that CHI containing primary amino groups is a weak (poly) base with a pKa ≈ 6.5, such that in acid solutions the primary amines are protonated and CHI is positively charged.
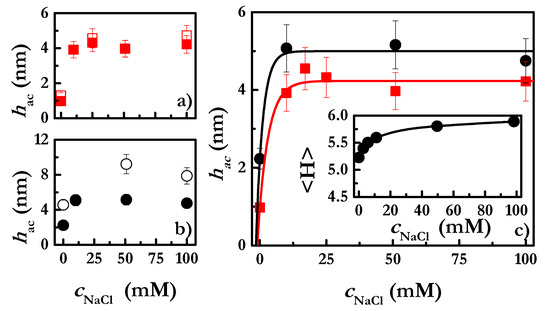
Figure 2.
(a) Hydrodynamic thickness of polyelectrolyte layers obtained from the deposition of solutions with a polymer concentration of 2 g/L and different ionic strengths: before rinsing (□) and after rinsing (■). Notice that rinsing was performed with aqueous solutions with the same NaCl concentration contained in the polymer solutions used for the deposition. (b) Hydrodynamic thickness of polyelectrolyte layers obtained from the deposition of solutions with a polymer concentration of 5 g/L and different ionic strengths: before rinsing (○) and after rinsing (●). Notice that rinsing was performed with aqueous solutions with the same NaCl concentration contained in the polymer solutions used for the deposition. (c) Dependence of the hydrodynamic thickness of polyelectrolyte layers present on a negatively charged surface on the NaCl for the adsorption of CHI solutions with two different concentrations: 2 g/L (■) and 5 g/L (●). The inset corresponds to the results obtained from the SCF for the NaCl concentration-dependence of the average film thickness of CHI layers deposited from solutions with a concentration of polymer equivalent to 5 g/L. The lines are guides for the eyes. Notice that the reported thicknesses correspond to those obtained after the rinsing of the adsorbed layers with aqueous solutions with the same NaCl concentration as that contained in the polymer solutions used for the deposition.
The irreversibility of the adsorption of CHI is observed throughout the entire range of ionic strength for layers deposited from CHI solutions with a concentration 2 g/L, for which no significant change of the layer thickness after rinsing was observed (see Figure 2a). However, the increase of the polymer concentration up to a value of 5 g/L leads to a decrease in the hydrodynamic thickness of the layers upon rinsing (see Figure 2b). This unexpected finding can be explained by considering the competition between differently charged monomers belonging to different polyelectrolyte chains for the binding sites of the surface. Thus, considering that the adsorption of each polymer chain at such high solution concentration is expected to occur through a reduced number of monomers, it would be possible that some chains can be completely unbound from the surface during the rinsing process, whereas additional segments of other chains attach to the surface. This results in a reduction of the fuzziness of the adsorbed layers, and consequently of their hydrodynamic thickness. It should be noted that the final thickness of the layers after rinsing is rather similar for both CHI concentrations (2 g/L and 5 g/L). This may be explained by considering that the adsorption of CHI layers from 5 g/L solutions results in a supersaturation of the binding sites of the surface, and consequently the rinsing process favors the depletion of many polymer chains from the surface.
The adsorption of a polyelectrolyte onto a negatively charged surface is expected to depend on both the nature of the chains and the properties of the solution [50]. Figure 2c shows the dependence of the hydrodynamic thickness of the CHI layers on the NaCl concentration (cNaCl) obtained for the deposition of CHI solutions with two different polymer concentrations. The results show the effects of two different parameters on the deposition of CHI onto negatively charged surfaces: (i) Ionic strength, and (ii) polymer concentration. The increase in any of them leads to an increase in the polyelectrolyte adsorbed amount. The increase in the concentration of NaCl leads to an increase in the hydrodynamic thickness, which is explained by considering the role of the salt in the screening of the electrostatic interactions. Therefore, an increase in the ionic strength is expected to reduce the strength of the electrostatic interactions, including both the repulsive inter- and intra-chain ones, and those of attractive character between the positively charged monomers and the negatively charged surfaces [51]. The screening or shielding of the CHI charges due to the salt ions drives the transition of the polymer conformation from a rod-like conformation to a more coiled one, and worsens the quality of the water as solvent for the polyelectrolyte. This favors the depletion of the polyelectrolyte chains from the solution, enhancing their deposition onto the solid surfaces, which results in the increase in the layer thickness. Furthermore, the conformational transition occurring in the polymer chains results in the deposition of layers with more loops and tails protruding into the solution, which is a further contribution to the increase in the layer thickness with the increase in ionic strength [52]. It is worth mentioning that the shielding of the charges at the surface, which generally results in a worsening of the adsorption process, is rather limited at the salt concentrations studied.
SCF calculations were used to deepen our understanding of the physico-chemical process determining the salt concentration-dependence of the deposition of chitosan. The inset in Figure 2c shows the NaCl concentration-dependence of layer thickness using SCF calculations (Equation (5))
with φ and r being the density profile of the layer in the direction perpendicular to the surface, and the direction perpendicular to the surface, respectively. The comparison of the experimental results for the thickness obtained by QCM-D, and the predictions provided by the SCF calculations, show a good semi-quantitative agreement, which demonstrates that the SCF calculations can be a powerful tool in understanding the adsorption process of polyelectrolytes onto solid surfaces.
The increase of the polymer concentration in the solution leads, as well, to an increase in the hydrodynamic thickness of the layers. This is explained by the fact that the increase of the polymer concentration leads to an increase in the number of charged groups, i.e., the number of points through which the polyelectrolyte can interact with the negatively charged surface. This results in the greater competition of polymer chains for adsorption sites on the solid surface. Therefore, the adsorption of the chains leads to layers with more loops and tails protruding into the solution, resulting in thicker layers. Similar results have been found for the dependency of hydrodynamic thickness on the polymer concentration, at a fixed value of ionic strength, for the adsorption of other polyelectrolytes onto negatively charged surfaces. Figure 3a shows the dependency of hydrodynamic thickness on the polymer concentration, cpol, for layers of different polyelectrolytes.
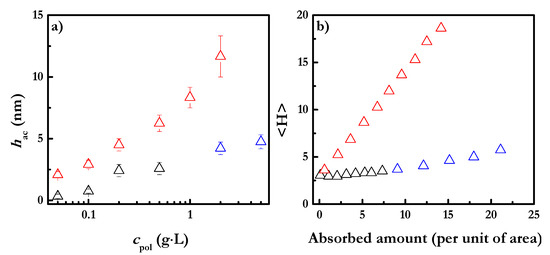
Figure 3.
(a) Relationship between the hydrodynamic thicknesses of polyelectrolyte layers (PDADMAC, JR400 and CHI) deposited onto a negatively charged surface and polymer concentration (PDADMAC (Δ), JR400 (Δ) and CHI (Δ)). (b) Relationship between <H> and adsorbed amount (i.e., concentration in the solution) of the average film thickness obtained from SCF calculations for polyelectrolyte layers (PDADMAC (Δ), JR400 (Δ) and CHI (Δ)) deposited onto a negatively charged surface. Experiments and calculations were performed using solutions with a NaCl concentration of 100 mM. Note that the reported thicknesses correspond to those obtained after rinsing of the adsorbed layers with aqueous solutions with the same NaCl concentration contained in the polymer solutions used for the deposition.
The differences in the hydrodynamic thicknesses obtained for the layers of the different polyelectrolytes may be mainly ascribable to the differences in the number of charged monomers present in each polymer. Furthermore, the possible impact of the molecular weight of the polymer chains and the size of the monomers cannot be neglected [17]. JR400 is an alternate copolymer containing two different monomers—a cationic one and a neutral one. JR400 will only attach to the surface by the cationic sites, which limits the number of adsorption sites, and hence it is expected that the adsorbed layer can have a fuzzy structure, with many loops protruding into the solution. This results in a thicker adsorbed layer. On the other hand, PDADMAC is a strong polyelectrolyte with all its monomers bearing a positive charge. This suggests that the contribution of the electrostatic repulsions may result in the formation of layers with the polymer chains adsorbed parallel to the surface in an extended conformation, and consequently a lower thicknesses should be expected. The position of the CHI layers is intermediate between PDADMAC and JR400 because CHI is a random copolymer in which only 85% of the CHI monomers are cationic. Figure 3b shows the dependence of the thickness of the adsorbed layers on the polymer concentration obtained by SCF calculations for the three polymers above mentioned. The good agreement between the experimental results and those obtained using SCF calculations evidences again the power of the SCF calculations as a predictive tool for obtaining information concerning the adsorption process of polyelectrolyte layers, and the dependence of this process on the specific characteristic of the adsorbed polymer (see Figure 3b).
The above discussion shows that SCF calculations provide a good prediction of the amount of polymer adsorbed onto the solid surface, and thus it is expected that SCF calculations can also help in the understanding of the organization of the polymer chains within the film. Information about the organization of the polymer layers can be obtained from the analysis of the polymer density profiles analyzed perpendicularly to the surface. The results for JR400 and CHI are shown in Figure 4.
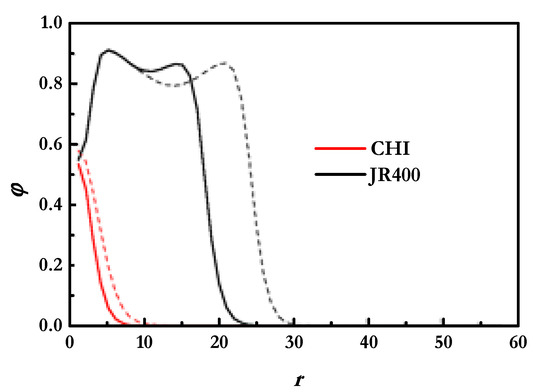
Figure 4.
Polymer density profiles analyzed perpendicularly to the surface for CHI and JR400 layers deposited from solutions with a NaCl concentration of 100 mM. The profiles were obtained at two different polymer concentrations. Continuous lines correspond to the profiles of layers deposited from solutions with the lowest concentration, and dashed lines correspond to the profiles of layers deposited from solutions with the highest concentration.
The density profiles confirm the picture inferred from the results of the adsorbed amounts. An increase in the concentration of both polymers results in the formation of layers, which protrude into the aqueous medium to greater degree. However, the qualitative features of the density profiles, when a fixed polymer is considered, evidence the limited dependence of both of the two polymers on the concentration of the solutions. On the other hand, the comparison of the features of the density profiles for CHI and JR400 shows clear differences. CHI layers present profiles characterized by a sharp decrease in the polymer density with their separation from the surface, i.e., the density decreases fast from the vicinity of the surface to the solution. This suggests that the chitosan chains adsorb with many segments in direct contact with the surface, which is reasonable considering its relatively high charge density. Thus, the adsorption of CHI results in the formation of flat layers, with a reduced number of loops and tails protruding into the aqueous medium. On the other hand, the density profiles obtained for the JR400 layers present two well-differentiated regions. The region closer to the surface can be associated with the segments of the polymer directly bound to the surface, whereas the most external region is understood in the context of the presence of loops and tails protruding into the solution. It is worth mentioning that the average densities of both regions appear to be relatively similar. This is probably related to the fuzziness of the adsorbed layers of J400, wherein only a half of the monomers are bound to the surface. The differences in the density profiles obtained for both polymers confirm the different structures of the adsorbed layers as a function of the chemical nature of the polymers.
The above discussion was concerned with the dependences of the hydrodynamic thicknesses of the deposited layers, which provide information concerning the deposited polymer layer and the hydration level. The separation of both contributions can be done by independent ellipsometry measurements, which provide an estimation of the true polymer amount deposited within the layer, represented as the optical thickness, hop. Figure 5a shows a comparison between the hydrodynamic and optical thicknesses of the CHI layers deposited from solutions with polymer concentrations of 5 g/L and different ionic strengths.
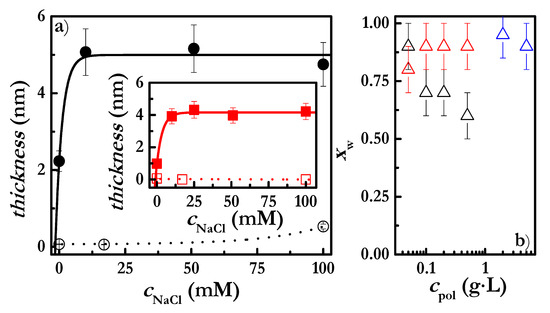
Figure 5.
(a) NaCl concentration-dependence of the hydrodynamic (solid symbols) and optical thicknesses (open symbols) of CHI layers deposited onto a negatively charged surface from a polymer solution with concentration 5 g/L. The inset corresponds to the same data shown in the main panel for CHI solutions with concentrations of 2 g/L. Note that the reported thicknesses correspond to those obtained after rinsing of the adsorbed layers with aqueous solutions with the same NaCl concentration as that contained in the polymer solutions used for the deposition. (b) Dependence of the water content on the polymer concentration for polyelectrolyte layers deposited onto a negatively charged surface: PDADMAC (Δ), JR400 (Δ) and CHI (Δ).
The experimental results clearly show the difference in sensitivity between QCM-D and ellipsometry; the hydrodynamic thickness being almost one order of magnitude higher than the acoustic one. As such, the amount of CHI contained in the layers is relatively low, with the water incorporated into the adsorbed layers, calculated according to Equation (4), corresponding to about 90% of the total weight fraction of the layer (see Figure 5b). This high water content cannot be explained only by the water contained between the loops and the tails that exist in the layer. It is reasonable to state that the adsorbed polymer layers present a rather heterogeneous structure, with the polymer chains being distributed on the surface as isolated coil-like pancakes. This is the result of electrostatic repulsions between the deposited chains [8,12]. The water fraction contained in the JR400 layers was found to be similar to that of the CHI layers, whereas PDADMAC layers present lower hydration (see Figure 5b). These hydration differences are due to the above-discussed differences in the conformation of the adsorbed chains. The most extended conformation is achieved with PDADMAC chains, which lead to a denser layer on the surface due to a reduction in the contribution of loops and tails, and ultimately to hydration.
3.2. Effect of the Addition of an Oppositely Charged Surfactant on the Deposition of Polyelectrolyte Layers
It is accepted that the interaction of polyelectrolytes with oppositely charged surfactants in solution results in a binding of the surfactant molecules to the polyelectrolyte chains through electrostatic interactions, which leads to the formation of polyelectrolyte–surfactant complexes [53,54,55,56]. These complexes modify the adsorption process in relation to what happens when the adsorption of the polyelectrolyte alone is considered [27,57,58,59,60]. Below is a discussion of the impact of polyelectrolyte–surfactant complexation on the adsorption of polyelectrolytes onto solid surfaces. Figure 6 shows the dependence of hydrodynamic thickness on salt concentration for CHI and CHI-SLES.
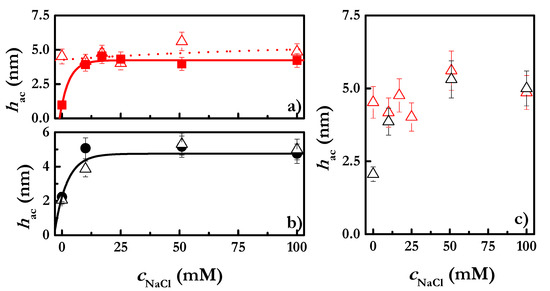
Figure 6.
(a) NaCl concentration-dependence of the hydrodynamic thickness of CHI (■) and CHI-SLES (Δ) layers obtained from solutions with polymer concentration of 2 g/L. The concentration of SLES in the mixed solutions was constant, at 0.1 mM. (b) NaCl concentration-dependence of the hydrodynamic thickness of CHI (●) and CHI-SLES (Δ) layers obtained from solutions with polymer concentration of 5 g/L. The concentration of SLES in the mixed solutions was constant, at 0.1 mM. (c) NaCl-concentration dependence of the hydrodynamic thicknesses of CHI-SLES layers obtained from solutions with two different polymer concentrations: 2 g/L (Δ) and 5 g/L (Δ). The concentration of SLES in the solutions was constant, at 0.1 mM. Note that the reported thicknesses in the three panels correspond to those obtained after rinsing of the adsorbed layers with aqueous solutions with the same NaCl concentration as that contained in the polymer solutions used for the deposition.
The results show the clear dependence of the polymer concentration on the presence of surfactant. The addition of SLES into CHI solutions at the lowest concentration (2 g/L) leads to an increase in the layer thickness. On the other hand, the layers obtained after adsorption of CHI solutions at 5 g/L in the presence of SLES do not show any change in thickness. These findings can be explained by considering the ratio between the concentration of surfactant molecules and that of charged monomers in solution (Z ratio). This simple calculation results in values of 0.01 and 0.004, for solutions of CHI with concentrations 2 g/L and 5 g/L, respectively. Thus, considering that the polyelectrolyte–surfactant association leads to the binding of all the surfactant molecules to the polyelectrolyte chains, it will feasible to assume a different reduction in the number of available charges in the polyelectrolyte chains upon the binding of the SLES, as a function of polymer concentration. The lower the CHI concentration, the higher the reduction in the polymer charge, thus leading to a decrease in the solubility of the polyelectrolyte and, consequently, to an enhanced deposition. However, an increase in the polymer concentration leads to a situation in which the addition of surfactant to the CHI solution does not modify significantly the solubility of the polymer chains, and consequently there is no any significant change in the deposition of CHI in the presence of a surfactant. The enhanced deposition of CHI in the presence of SLES, for solutions with a concentration of 2 g/L, is clearer using ellipsometry (Figure 7a), wherein the dependences of the CHI and CHI-SLES layers’ hydrodynamic and optical thicknesses on ionic strength are shown.
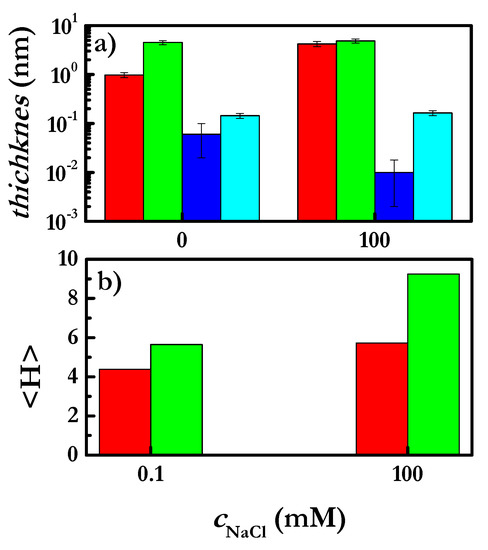
Figure 7.
(a) Effect of ionic strength on the hydrodynamic and optical thicknesses of CHI and CHI-SLES layers obtained via the deposition of layers from solutions with a polymer concentration of 2 g/L. The concentration of SLES in the mixed solutions was constant, at 0.1 mM. Each set of colored bars correspond to a specific set of data: hac for CHI (■) and CHI-SLES (■) layers, and hop for CHI (■) and CHI+SLES (■) layers. Note that the reported thicknesses in the three panels correspond to those obtained after the rinsing of the adsorbed layers with aqueous solutions with the same NaCl concentration as that contained in the solutions used for the layer deposition. (b) Average thickness for CHI (■) and CHI-SLES (■) layers at different salt concentrations obtained from SCF calculations.
Figure 7a shows that the adsorption of the complexes is higher than that of the polymers alone, which is also confirmed by the SCF calculations performed for the CHI layers (see Figure 7b). This effect is clearer at the highest NaCl concentration. Despite the fact that at 100 mM, hac does not change, hop is significantly higher for the mixture than for the polymer alone.
It was discussed above that the chemical nature of the polymer impacts decisively on its deposition. The specificity of the chemical nature of the polymer also affects the complexation process of polyelectrolytes with oppositely charged surfactants, and ultimately the adsorption of such complexes onto a negatively charged surface. Figure 8a shows the hydrodynamic and optical thicknesses of the layers of CHI-SLES and PDADMAC-SLES mixtures.
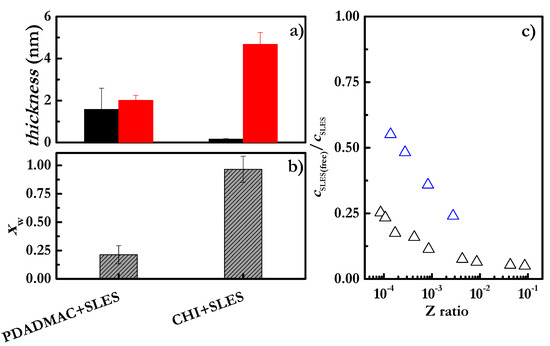
Figure 8.
Effect of the polymer’s nature on: (a) The optical (■) and hydrodynamic (■) thicknesses of layers formed by the deposition of polyelectrolyte–SLES mixtures, with polymer concentration of 2 g/L, SLES concentration 0.1 mM and NaCl concentration of 100 mM. Note that the reported thicknesses in the three panels correspond to those obtained after the rinsing of the adsorbed layers with aqueous solutions with the same NaCl concentration as that contained in the solutions used for the layer deposition. (b) The water content of layers formed by the deposition of polyelectrolyte–SLES mixtures, with polymer concentration of 2 g/L, SLES concentration 0.1 mM and NaCl concentration of 100 mM. (c) Z ratio dependences of the ratio between the concentration of free SLES molecules remaining in the solution, as was obtained from potentiometric titration (cSLES(free)), and the total SLES concentration (cSLES) for CHI-SLES (Δ) and PDADMAC-SLES (Δ) mixtures. Note that the concentration of NaCl was fixed at 100 mM.
The differences in the CHI and PDADMAC results are stark. CHI-SLES results in the enhanced deposition of the complex compared to CHI alone, as shown by the formation of denser layers (lower water content, see Figure 8b). This can be explained by the different binding abilities of the CHI and PDADMAC chains for SLES, as was obtained using a potentiometric titration with anionic surfactant-selective electrodes according to the method described in our previous publications [61]. Figure 8c shows the ratio between the concentration of free SLES molecules remaining in the solution (as was obtained from potentiometric titration (cSLES(free))) and the total SLES concentration (cSLES) as a function of the Z ratio.
The results in Figure 8c show that the same value of the Z ratio for different mixtures does not necessarily involve the same neutralization of the charged monomers. Thus, the observation of highest degree of neutralization of the charges of PDADMAC due to the binding of the SLES suggests a more important contribution of the surfactant to the worsening of the polymer solubility, which favors its deposition. Furthermore, the less effective charge of the PDADMAC complexes should lead to the formation of more compact aggregates, which reduces the amount of water associated with the adsorbed layer.
The differences in the adsorbed layers between polymers and polymer–surfactant mixtures can also be confirmed via the SCF density profiles shown in Figure 9. The results show that the addition of the surfactant leads to an extension of the layer to a greater size than when only the adsorption of the polymer is considered. This is compatible with the above-discussed increase in the thickness. Furthermore, a slight increase in the density of the layer is also found as a result of the surfactant.
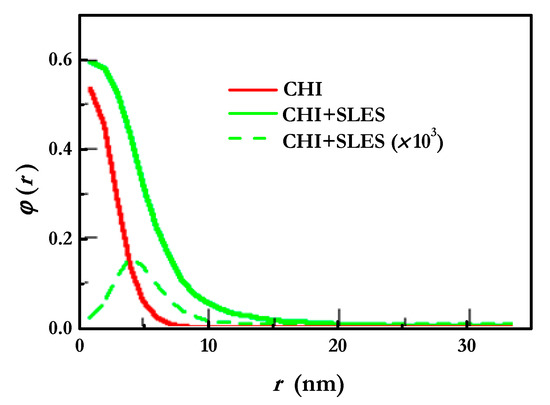
Figure 9.
Density profiles analyzed perpendicularly to the surface for CHI and CHI-SLES layers, at the same concentration and ionic strength. The SLES concentration was 0.1 mM.
4. Conclusions
The adsorption of three different polycations onto negatively charged surfaces has been studied using QCM-D and ellipsometry. The effects of the polymer concentration, charge density, chemical nature, ionic strength of the solution and the addition of a surfactant have been discussed. The results show that, contrary to the common belief that the adsorption process of polyelectrolytes onto oppositely charged surfaces is an almost irreversible process, the reversibility can be modified by changing the physico-chemical characteristics of the system. In this way, a certain degree of reversibility was found for layers deposited from concentrated polymer solutions due to the large number of polymer segments protruding into the solution from the deposited layer. During rinsing, the protruding segments can attach to the surface, replacing previously bound segments that were initially favorable during deposition.
Furthermore, it was found that an increase in the ionic strength and in the polymer concentration results in an enhanced deposition, due the formation of layers with an increased number of loops and tails protruding into the solution. Despite the noticeable impact of the polymer concentration and the ionic strength of the solutions on the adsorbed amount, it is clear that the chemical specificity of the polymer is the most critical parameter controlling the deposition process, with the number of charged monomers (charge density) affecting decisively the adsorbed amount. This is especially important when trying to replace the common, petroleum-based strong polyelectrolytes used in cosmetics with less cationic and more complex, more branched and more natural (or renewably resourced) polymers with expectably better biodegradability, sustainability and performance.
Using the complementary experimental techniques of QCM-D and ellipsometry along with theoretical SCF calculations has broadened our knowledge of the deposition of polysaccharides onto surfaces, and particularly the hydration levels in adsorbed layers, which were found to be relatively high. This may be a consequence of the structural heterogeneity of the adsorbed layers. Furthermore, this approach has broadened our knowledge of the formation and deposition of polyelectrolyte–surfactant complexes, which reduce the effective charge density of the polymer chains and worsen the aqueous solubility. This favors the deposition of the polymer onto the solid surface. Finally, the approach demonstrates the power of SCF calculations in the semi-quantitative prediction of the adsorption of polyelectrolyte layers, which can open important perspectives concerning the application of in silico approaches in order to help the design of eco-friendlier polymers in consumer products, e.g., shampoos and conditioners. To conclude, the future is extremely bright. There is a significant opportunity to transform biopolymers, such as CHI and cellulose, by changing the molecular weights, molecular distributions, functional groups (including counter-ions), and so on. Such diversity means the powerful tools and methodologies presented above are extremely important in guiding chemists in designing and developing new, better-performing and more sustainable polymers.
Author Contributions
Conceptualization, L.F.-P., E.G. and R.G.R.; methodology, M.H.-R., L.F.-P., E.G., A.A. and F.L.; software, M.H.-R., L.F.-P., E.G., A.A. and F.L.; validation, E.G., G.S.L. and R.G.R.; formal analysis, M.H.-R., L.F.-P., E.G., A.A. and F.L.; investigation, M.H.-R., L.F.-P., E.G., A.A., A.G., F.L., G.S.L., F.O. and R.G.R.; resources, G.S.L., F.O. and R.G.R.; data curation, L.F.P., E.G. and F.L.; writing—original draft preparation, E.G., A.G., and F.L.; writing—review and editing, M.H.-R., L.F.-P., E.G., A.A., G.S.L., F.L., A.G., F.O. and R.G.R.; visualization, M.H.-R., L.F.-P., F.L. and E.G.; supervision, L.F.-P., E.G., G.S.L., F.O. and R.G.R.; project administration, G.S.L. and R.G.R.; funding acquisition, E.G., G.S.L., F.O. and R.G.R. All authors have read and agreed to the published version of the manuscript.
Funding
This work was funded by MINECO (Spain) under grants CTQ2016-78895-R and PID2019-106557GB-C21, by Banco Santander-Universidad Complutense grant PR87/19-22513 (Spain) and by E.U. on the framework of the European Innovative Training Network-Marie Sklodowska-Curie Action NanoPaint (grant agreement 955612). Authors also acknowledge the financial support received from L’Oreal (France).
Acknowledgments
The Unidad de Espectroscopia y Correlacion of the Universidad Complutense de Madrid is acknowledged for its availability in the use of its facilities.
Conflicts of Interest
G.S.L., A.G. and F.L. are employed by L’Oreal (France). The rest of the authors declare no conflict of interest.
References
- Llamas, S.; Guzmán, E.; Ortega, F.; Baghdadli, N.; Cazeneuve, C.; Rubio, R.G.; Luengo, G.S. Adsorption of polyelectrolytes and polyelectrolytes-surfactant mixtures at surfaces: A physico-chemical approach to a cosmetic challenge. Adv. Colloid Interface Sci. 2015, 222, 461–487. [Google Scholar] [CrossRef]
- Zhu, X.; Jańczewski, D.; Lee, S.; Teo, S.; Vancso, G. Cross-linked polyelectrolyte multi layers for marine antifouling applications. ACS Appl. Mat. Interfaces 2013, 5, 5961–5968. [Google Scholar] [CrossRef] [PubMed]
- Zhang, W.; Ji, X.; Ma, N.; Kong, L.; Ran, F. Wettability improvement of vanadium nitride/carbon electrode nanomaterial by electrostatic absorption of hydrophilic poly (allylamine hydrochloride). Appl. Surface Sci. 2020, 525, 146619. [Google Scholar] [CrossRef]
- Guo, J.-W.; Wang, C.-F.; Chen, S.-H.; Lai, J.-Y.; Lu, C.-H.; Chen, J.-K. Highly efficient self-cleaning of heavy polyelectrolyte coated electrospun polyacrylonitrile nanofibrous membrane for separation of oil/water emulsions with intermittent pressure. Sep. Purif. Technol. 2020, 234, 116106. [Google Scholar] [CrossRef]
- Claesson, P.M.; Dedinaite, A.; Rojas, O.J. Polyelectrolytes as adhesion modifiers. Adv. Colloid Interface Sci. 2003, 104, 53–74. [Google Scholar] [CrossRef]
- Elżbieciak-Wodka, M.; Kolasińska-Sojka, M.; Wodka, D.; Nowak, P.; Warszyński, P. Transfer of electroactive agents of different molecular size through the polyelectrolyte membranes. J. Electroanal. Chem. 2011, 661, 162–170. [Google Scholar] [CrossRef]
- Enarsson, L.-E.; Wågberg, L. Adsorption kinetics of cationic polyelectrolytes studied with stagnation point adsorption reflectometry and quartz crystal microgravimetry. Langmuir 2008, 24, 7329–7337. [Google Scholar] [CrossRef]
- Guzmán, E.; Ortega, F.; Baghdadli, N.; Luengo, G.S.; Rubio, R.G. Effect of the molecular structure on the adsorption of conditioning polyelectrolytes on solid substrates. Colloids Surf. A 2011, 375, 209–218. [Google Scholar] [CrossRef]
- Guzmán, E.; Ortega, F.; Baghdadli, N.; Cazeneuve, C.; Luengo, G.S.; Rubio, R.G. Adsorption of conditioning polymers on solid substrates with different charge density. ACS Appl. Mat. Interfaces 2011, 3, 3181–3188. [Google Scholar] [CrossRef]
- Panja, D.; Barkema, G.T.; Kolomeisky, A.B. Non-equilibrium dynamics of single polymer adsorption to solid surfaces. J. Phys. Cond. Matt. 2009, 21, 242101. [Google Scholar] [CrossRef]
- Netz, R.R.; Andelman, D. Neutral and charged polymers at interfaces. Phys. Rep. 2003, 380, 1–95. [Google Scholar] [CrossRef]
- Linse, P.; Källrot, N. Polymer adsorption from bulk solution onto planar surfaces: Effect of polymer flexibility and surface attraction in good solvent. Macromolecules 2010, 43, 2054–2068. [Google Scholar] [CrossRef]
- Guzmán, E.; Fernández-Peña, L.; Luengo, G.S.; Rubio, A.M.; Rey, A.; Léonforte, F. Self-consistent mean field calculations of polyelectrolyte-surfactant mixtures in solution and upon adsorption onto negatively charged surfaces. Polymers 2020, 12, 624. [Google Scholar] [CrossRef] [PubMed]
- Porus, M.; Maroni, P.; Borkovec, M. Structure of adsorbed polyelectrolyte monolayers investigated by combining optical reflectometry and piezoelectric techniques. Langmuir 2012, 28, 5642–5651. [Google Scholar] [CrossRef] [PubMed]
- Mészáros, R.; Varga, I.; Gilányi, T. Adsorption of poly(ethyleneimine) on silica surfaces:effect of pH on the reversibility of adsorption. Langmuir 2004, 20, 5026–5029. [Google Scholar] [CrossRef] [PubMed]
- Ballauff, M. Spherical polyelectrolyte brushes. Prog. Polym. Sci. 2007, 32, 1135–1151. [Google Scholar] [CrossRef]
- Szilagyi, I.; Trefalt, G.; Tiraferri, A.; Maroni, P.; Borkovec, M. Polyelectrolyte adsorption, interparticle forces, and colloidal aggregation. Soft Matter 2014, 10, 2479–2502. [Google Scholar] [CrossRef]
- Terada, E.; Samoshina, Y.; Nylander, T.; Lindman, B. Adsorption of cationic cellulose derivative/anionic surfactant complexes onto solid surfaces. II. Hydrophobized silica surfaces. Langmuir 2004, 20, 6692–6701. [Google Scholar] [CrossRef]
- Terada, E.; Samoshina, Y.; Nylander, T.; Lindman, B. Adsorption of cationic cellulose derivatives/anionic surfactant complexes onto solid surfaces. I. Silica surfaces. Langmuir 2004, 20, 1753–1762. [Google Scholar] [CrossRef]
- Guzmán, E.; San Miguel, V.; Peinado, C.; Ortega, F.; Rubio, R.G. Polyelectrolyte multilayers containing triblock copolymers of different charge ratio. Langmuir 2010, 26, 11494–11502. [Google Scholar] [CrossRef]
- Steitz, R.; Jaeger, W.; von Klitzing, R. Influence of charge density and ionic strength on the multilayer formation of strong polyelectrolytes. Langmuir 2001, 17, 4471–4474. [Google Scholar] [CrossRef]
- Schoeler, B.; Kumaraswamy, G.; Caruso, F. Investigation of the influence of polyelectrolyte charge density on the growth of multilayer thin films prepared by the layer-by-layer technique. Macromolecules 2002, 35, 889–897. [Google Scholar] [CrossRef]
- Zhang, X.; Sun, Y.; Gao, M.; Kong, X.; Shen, J. Effects of pH on the supramolecular structure of polymeric molecular deposition films. Macromol. Chem. Phys. 1996, 197, 509–515. [Google Scholar] [CrossRef]
- Saarinen, T.; Österberg, M.; Laine, J. Adsorption of polyelectrolyte multilayers and complexes on silica and cellulose surfaces studied by QCM-D. Colloids Surf. A 2008, 330, 134–142. [Google Scholar] [CrossRef]
- Schlenoff, J.B.; Dubas, S.T. Mechanism of polyelectrolyte multilayer growth: Charge overcompensation and distribution. Macromolecules 2001, 34, 592–598. [Google Scholar] [CrossRef]
- Hansupalak, N.; Santore, M.M. Sharp Polyelectrolyte adsorption cutoff induced by a monovalent salt. Langmuir 2003, 19, 7423–7426. [Google Scholar] [CrossRef]
- Guzmán, E.; Llamas, S.; Fernández-Peña, L.; Léonforte, F.; Baghdadli, N.; Cazeneuve, C.; Ortega, F.; Rubio, R.G.; Luengo, G.S. Effect of a natural amphoteric surfactant in the bulk and adsorption behavior of polyelectrolyte-surfactant mixtures. Colloids Surf. A 2020, 585, 124178. [Google Scholar] [CrossRef]
- Fernández-Peña, L.; Guzmán, E.; Leonforte, F.; Serrano-Pueyo, A.; Regulski, K.; Tournier-Couturier, L.; Ortega, F.; Rubio, R.G.; Luengo, G.S. Effect of molecular structure of eco-friendly glycolipid biosurfactants on the adsorption of hair-care conditioning polymers. Colloids Surf. B 2020, 185, 110578. [Google Scholar] [CrossRef]
- Nylander, T.; Samoshina, Y.; Lindman, B. Formation of polyelectrolyte–surfactant complexes on surfaces. Adv. Colloid Interface Sci. 2006, 123–126, 105–123. [Google Scholar] [CrossRef]
- von Klitzing, R. Internal structure of polyelectrolyte multilayer assemblies. Phys. Chem. Chem. Phys. 2006, 8, 5012–5033. [Google Scholar] [CrossRef]
- L’Haridon, J.; Martz, P.; Chenéble, J.C.; Campion, J.F.; Colombe, L. Ecodesign of cosmetic formulae: Methodology and application. Int. J. Cosmetic Sci. 2018, 40, 165–177. [Google Scholar] [CrossRef] [PubMed]
- Dobrynin, A.; Rubinstein, M. Theory of polyelectrolytes in solutions and at surfaces. Prog. Polym. Sci. 2005, 30, 1049–1118. [Google Scholar] [CrossRef]
- Samoshina, Y.; Nylander, T.; Claesson, P.; Schillén, K.; Iliopoulos, I.; Lindman, B. Adsorption and aggregation of cationic amphiphilic polyelectrolytes on silica. Langmuir 2005, 21, 2855–2864. [Google Scholar] [CrossRef] [PubMed]
- Cahill, B.P.; Papastavrou, G.; Koper, G.J.M.; Borkovec, M. Adsorption of poly(amido amine) (PAMAM) dendrimers on silica: importance of electrostatic three-body attraction. Langmuir 2008, 24, 465–473. [Google Scholar] [CrossRef]
- Voinova, M.V.; Rodahl, M.; Jonson, M.; Kasemo, B. Viscoelastic acoustic response of layered polymer films at fluid-solid interfaces: Continuum mechanics approach. Phys. Scr. 1999, 59, 391–396. [Google Scholar] [CrossRef]
- Azzam, R.M.A.; Bashara, N.M. Ellipsometry and Polarized Light; North-Holland Pub. Co.: Amsterdam, The Netherlands, 1977. [Google Scholar]
- Nestler, P.; Helm, C.A. Determination of refractive index and layer thickness of nm-thin films via ellipsometry. Opt. Expr. 2017, 25, 27077–27085. [Google Scholar] [CrossRef]
- Palik, E.D. Handbook of Optical Constant of Solid; Academic Press, Inc.: New York, NY, USA, 1985. [Google Scholar]
- Vörös, J. The density and refractive index of adsorbing protein layers. Biophys. J. 2004, 87, 553–561. [Google Scholar] [CrossRef]
- Halthur, T.J.; Elofsson, U. Multilayers of charged polypeptides as studied by in situ ellipsometry and quartz crystal microbalance with dissipation. Langmuir 2004, 20, 1739–1745. [Google Scholar] [CrossRef]
- Banerjee, S.; Cazeneuve, C.; Baghdadli, N.; Ringeissen, S.; Leermakers, F.A.M.; Luengo, G.S. Surfactant-polymer interactions: Molecular architecture does matter. Soft Matter. 2015, 11, 2504–2511. [Google Scholar] [CrossRef]
- Banerjee, S.; Cazeneuve, C.; Baghdadli, N.; Ringeissen, S.; Lénforte, F.; Leermakers, F.A.M.; Luengo, G.S. Modeling of polyelectrolyte adsorption from micellar solutions onto biomimetic substrates. J. Phys. Chem. B 2017, 121, 8638–8651. [Google Scholar] [CrossRef]
- Scheujtens, J.M.H.M.; Fleer, G.J. Statistical theory of the adsorption of interacting chain molecules. 1. Partition function, segment density distribution, and adsorption isotherms. J. Phys. Chem. 1979, 83, 1619–1635. [Google Scholar] [CrossRef]
- Scheutjens, J.M.H.M.; Fleer, G.J. Statistical theory of the adsorption of interacting chain molecules. 2. Train, loop, and tail size distribution. J. Phys. Chem. 1980, 84, 178–190. [Google Scholar] [CrossRef]
- Fleer, G.; Cohen-Stuart, M.A.; Scheutjens, J.; Crosgrove, T.; Vincent, B. Polymer at Interfaces; Chapman and Hall: London, UK, 1993. [Google Scholar]
- Leermakers, F.A.M.; Scheutjens, J.M.H.M. Statistical thermodynamics of association colloids: V. critical micelle concentration, micellar size and shape. J. Colloid Interface Sci. 1990, 136, 231–241. [Google Scholar] [CrossRef]
- Weininger, D. SMILES, a chemical language and information system. 1. Introduction to methodology and encoding rules. J. Chem. Inf. Comput. Sci. 1988, 28, 31–36. [Google Scholar] [CrossRef]
- Weininger, D.; Weininger, A.; Weininger, J.L. SMILES. 2. Algorithm for generation of unique SMILES notation. J. Chem. Inf. Comput. Sci. 1989, 29, 97–101. [Google Scholar] [CrossRef]
- Postmus, B.R.; Leermakers, F.A.M.; Stuart, M.A.C. Self-consistent field modeling of non-ionic surfactants at the silica−water interface: Incorporating molecular detail. Langmuir 2008, 24, 3960–3969. [Google Scholar] [CrossRef]
- Holmberg, K.; Jönsson, B.; Kronberg, B.; Lindman, B. Surfactants and Polymers in Aqueous Solution; John Wiley & Sons: Chichester, UK, 2002. [Google Scholar]
- Dobrynin, A.V.; Rubinstein, M. Effect of short-range interactions on polyelectrolyte adsorption at charged surfaces†. J. Phys. Chem. B 2003, 107, 8260–8269. [Google Scholar] [CrossRef]
- Adamczyk, Z.; Zembala, M.; Michna, A. Polyelectrolyte adsorption layers studied by streaming potential and particle deposition. J. Colloid Interface Sci. 2006, 303, 353–364. [Google Scholar] [CrossRef]
- Khan, N.; Brettmann, B. Intermolecular interactions in polyelectrolyte and surfactant complexes in solution. Polymers 2018, 11, 51. [Google Scholar] [CrossRef]
- Svensson, A.; Piculell, L.; Cabane, B.; Ilekti, P. A new approach to the phase behavior of oppositely charged polymers and surfactants. J. Phys. Chem. B 2002, 106, 1013–1018. [Google Scholar] [CrossRef]
- Varga, I.; Campbell, R.A. General physical description of the behavior of oppositely charged polyelectrolyte/surfactant mixtures at the air/water interface. Langmuir 2017, 33, 5915–5924. [Google Scholar] [CrossRef] [PubMed]
- Guzmán, E.; Fernández-Peña, L.; Ortega, F.; Rubio, R.G. Equilibrium and kinetically trapped aggregates in polyelectrolyte–oppositely charged surfactant mixtures. Curr. Opin. Colloid Interface Sci. 2020, 48, 91–108. [Google Scholar] [CrossRef]
- Llamas, S.; Guzmán, E.; Baghdadli, N.; Ortega, F.; Cazeneuve, C.; Rubio, R.G.; Luengo, G.S. Adsorption of poly(diallyldimethylammonium chloride)—sodium methyl-cocoyl-taurate complexes onto solid surfaces. Colloids Surf. A 2016, 505, 150–157. [Google Scholar] [CrossRef]
- Svensson, A.V.; Huang, L.; Johnson, E.S.; Nylander, T.; Piculell, L. Surface deposition and phase behavior of oppositely charged polyion/surfactant ion complexes. 1. Cationic guar versus cationic hydroxyethylcellulose in mixtures with anionic surfactants. ACS Appl. Mat. Interfaces 2009, 1, 2431–2442. [Google Scholar] [CrossRef]
- Clauzel, M.; Johnson, E.S.; Nylander, T.; Panandiker, R.K.; Sivik, M.R.; Piculell, L. Surface deposition and phase behavior of oppositely charged polyion–surfactant ion complexes. Delivery of silicone oil emulsions to hydrophobic and hydrophilic surfaces. ACS Appl. Mat. Interfaces 2011, 3, 2451–2462. [Google Scholar] [CrossRef]
- Santos, O.; Johnson, E.S.; Nylander, T.; Panandiker, R.K.; Sivik, M.R.; Piculell, L. Surface adsorption and phase separation of oppositely charged polyion−surfactant ion complexes: 3. Effects of polyion hydrophobicity. Langmuir 2010, 26, 9357–9367. [Google Scholar] [CrossRef]
- Llamas, S.; Fernández-Peña, L.; Akanno, A.; Guzmán, E.; Ortega, V.; Ortega, F.; Csaky, A.G.; Campbell, R.A.; Rubio, R.G. Towards understanding the behavior of polyelectrolyte–surfactant mixtures at the water/vapor interface closer to technologically-relevant conditions. Phys. Chem. Chem. Phys. 2018, 20, 1395–1407. [Google Scholar] [CrossRef]
© 2020 by the authors. Licensee MDPI, Basel, Switzerland. This article is an open access article distributed under the terms and conditions of the Creative Commons Attribution (CC BY) license (http://creativecommons.org/licenses/by/4.0/).