Article

Role of the Counterions in the Surface Tension of Aqueous Surfactant Solutions. A Computer Simulation Study of Alkali Dodecyl Sulfate Systems

1
Department of Chemistry, Eszterházy Károly University, Leányka utca 6, H-3300 Eger, Hungary
2
Institute of Physics and Materials Science, University of Natural Resources and Life Sciences, Peter Jordan Straße 82, A-1190 Vienna, Austria
3
Faculty of Physics, University of Vienna, Sensengasse 8/9, A-1090 Vienna, Austria
4
Forschungszentrum Jülich GmbH, Helmholtz Institute Erlangen-Nürnberg for Renewable Energy (IEK-11), Fürther Straße 248, D-90429 Nürnberg, Germany
5
Department of Inorganic and Analytical Chemistry, Budapest University of Technology and Economics, Szt. Gellért tér 4, H-1111 Budapest, Hungary
*
Author to whom correspondence should be addressed.
Colloids Interfaces 2020, 4(2), 15; https://doi.org/10.3390/colloids4020015
Submission received: 4 April 2020 / Revised: 16 April 2020 / Accepted: 17 April 2020 / Published: 21 April 2020

Abstract

:
We have investigated the surface tension contributions of the counterions, surfactant headgroups and tails, and water molecules in aqueous alkali dodecyl sulfate (DS) solutions close to the saturated surface concentration by analyzing the lateral pressure profile contribution of these components using molecular dynamics simulations. For this purpose, we have used the combination of two popular force fields, namely KBFF for the counterions and GROMOS96 for the surfactant, which are both parameterized for the SPC/E water model. Except for the system containing Na+ counterions, the surface tension of the surfactant solutions has turned out to be larger rather than smaller than that of neat water, showing a severe shortcoming of the combination of the two force fields. We have traced back this failure of the potential model combination to the unphysically strong attraction of the KBFF counterions, except for Na+, to the anionic head of the surfactants. Despite this failure of the model, we have observed a clear relation between the soft/hard character (in the sense of the Hofmeister series) and the surface tension contribution of the counterions, which, given the above limitations of the model, can only be regarded as an indicative result. We emphasize that the obtained results, although in a twisted way, clearly stress the crucial role the counterions of ionic surfactants play in determining the surface tension of the aqueous surfactant solutions.

1. Introduction

Surface tension, the intensive counterpart of the surface area of a given phase, is a physical quantity of key importance both in pure interfacial science [1] and in its numerous industrial applications. Surface tension is related to the force that contracts the surface area of condensed phases and originates from the fact that, due to the lack or loss of interactions with the opposite phase, molecules experience an energetically less favorable environment at the vicinity of the surface than in the bulk phase. The fact that surface tension can thus be related to the properties (i.e., energy loss) of the individual molecules naturally gives rise to the question of how the individual molecules contribute to it [2].
A particularly interesting question in this respect is that of how the surface tension is distributed between the different molecules and moieties at the surface of aqueous surfactant solutions. Clearly, surfactant molecules adsorbed at an aqueous surface reduce the surface tension very efficiently; however, it is not clear how the residual surface tension is contributed by the water molecules as well as by the apolar tails and polar or ionic headgroups of the surfactant molecules and, in the case of ionic surfactants, also by the counterions. Computer simulation methods seem to be very suitable to study this problem, as in such studies an appropriately chosen model of the system of interest is seen at atomistic resolution [3]. On the other hand, the validity of the chosen model always has to be checked by comparing its relevant, measurable properties with existing experimental data. However, while numerous properties of the surface of aqueous solutions of a number of different surfactant molecules have been investigated in detail both by experimental [4,5,6,7,8,9,10,11,12,13,14,15,16,17,18,19,20,21,22,23,24,25,26] and computer simulation [27,28,29,30,31,32,33,34,35,36,37,38,39,40,41,42,43,44,45,46,47,48,49,50,51,52,53,54,55,56] methods in the past decades, the question of how different molecules contribute to the surface tension has scarcely been studied both for surfactant solutions [56] and for other systems [2,57].
In a recent study, we addressed this question for various surfactants at several surface densities and obtained the rather surprising result that, in the case of ionic surfactants, the counterions play a key role in this respect [56]. Even more strikingly, counterions were found to play opposing roles in the cases of two surfactants considered. More specifically, considering a saturated aqueous surface, the Na+ counterion of the dodecyl sulfate (DS) anionic surfactant contributed 760%, while the Cl counterion of the dodecyl trimethyl ammonium (DTA+) surfactant cation contributed −240% to the surface tension of the corresponding system. These huge contributions were found to be partly compensated by those of the water molecules and surfactant heads, indicating that in the former and latter systems, water molecules and Cl counterions, respectively, experience a much more favorable environment at the vicinity of the surface than in the bulk liquid phase [56].
This rather unexpected result can be explained using several different assumptions. One possible explanation is related to the asymmetry of the positively and negatively charged counterions, caused by the geometric asymmetry of the charge distribution of the water molecules. An alternative explanation assumes that the exact role of the counterions in this respect is related to their “soft/hard” character according to the Hofmeister series [58]. Thus, “hard” ions or “kosmotropes”, i.e., small ions of high charge density and low polarizability, are very strongly attached to the water molecules of their first hydration shell, and hence they are effectively repelled from the aqueous surface [59,60,61,62,63,64,65]. On the other hand, larger “soft” ions of higher polarizability, also referred to as “chaotropes” are less strongly bound to their hydration shell. As a consequence, losing a part of this shell, occurring when the ion approaches the surface of the aqueous phase, corresponds to a smaller energy cost, and hence such ions are less strongly repelled from or even effectively attracted to the liquid surface [59,60,61,62,63,64,65]. In other words, hard counterions, forced to stay close to the surface by the oppositely charged layer of the surfactant heads, have to pay a large energetic penalty and hence give a huge contribution to the surface tension. On the other hand, this energetic penalty is smaller for softer counterions and might even be overcompensated by the energetic gain coming from the vicinity of the layer of oppositely charged surfactant headgroups. This explanation is certainly supported by the fact that Na+ is clearly a harder ion than Cl [59,60,62]; however, its verification requires a systematic study in which only the soft/hard character of the counterion is varied, while all other properties of the system are kept unchanged.
In this paper, we intend to investigate the validity of the second assumption, namely that the surface tension contribution of the counterions is related to their soft/hard character. For this purpose, here we report a set of computer simulations of the liquid–vapor interface of the aqueous solutions of alkali dodecyl sulfate at saturated surface density, in which the alkali counterion is systematically varied from Li+ to Cs+. This way, the soft/hard character of the counterions is systematically changed from the hardest Li+ to the softest Cs+, while all other characteristics of the system are left unchanged. Our above explanation predicts that upon going to larger and softer counterions, the counterion contribution to the surface tension decreases and might even turn to negative values.
The paper is organized as follows. In Section 2 it is explained how the contribution of the different particles to the total surface tension of the system can be estimated from the lateral pressure profile along the surface normal. Details of the simulations performed are given in Section 3, while in Section 4 the obtained results are presented and discussed in detail. Finally, the main conclusions of this study are summarized in Section 5.

2. Calculation of the Surface Tension Contribution of the Molecules through the Lateral Pressure

Surface tension (γ) can be calculated as an integral of the imbalance between the lateral and normal pressure components (pL and pN, respectively) along the surface normal axis, denoted here by X, i.e., for a single interface [1],
γ = ( p N p L ( X ) ) d X
It should be noted that while pL varies along the surface normal axis, the normal component of the pressure has to be constant along X due to the requirement of the mechanical stability of the system, and hence it is also equal to the (scalar) pressure of the two bulk phases. Therefore, the profile of pL is directly related to that of the surface tension, and in cases when the scalar pressure of the system is negligible compared to the values of the lateral pressure component at the vicinity of the surface, such as in the case of aqueous systems being in equilibrium with the saturated vapor at ambient temperature, it differs from the surface tension profile only in its sign.
The elements of the pressure tensor can be calculated as:
p α β = 1 V ( i m i v i α v i β + i j f i j α C i j δ ( r s ) d s β )
where the first term accounts for the kinetics, while the second one accounts for the virial contribution to the pressure. In this equation, indices i and j run over the particles, while α and β run over the three spatial directions (or, in the case of calculating lateral pressure components, only over the two spatial directions laying in the surface plane); m, v, and f are the mass and velocity of the corresponding particle and the force acting between the corresponding particles, respectively; V is the volume of the system, δ is the Dirac distribution, Cij represents an open path connecting the two particles i and j, parametrized by the vector s, and the brackets <…> denote ensemble averaging. As is evident, the value resulting from Equation (2) depends on the particular choice of the integration path, Cij [66]. Fortunately, it has been shown that the use of several reasonably chosen integration contours, such as the Irving–Kirkwood [67] or the Harasima path [68], result in comparable lateral pressure profiles [69]. Among these paths, the use of the Harasima contour, connecting the interacting particles by lines parallel with the space-fixed axes, has several important advantages. Thus, this way the lateral component of the pressure can also be calculated in cases where the force is not pairwise additive [69]. The importance of this point becomes apparent considering that when the long range part of the electrostatic interaction is calculated by an Ewald summation-based method, its reciprocal space term is not pairwise additive either. The other important advantage is that this way the lateral pressure contribution coming from the interaction of a given particle pair is distributed evenly between the two particles [57]. As a consequence, lateral pressure can be treated as if it was an additive property of the individual atoms, and hence the contribution of an appropriately chosen group of atoms to the lateral pressure and, through Equation (1), the surface tension can be meaningfully discussed.

3. Computational Details

Molecular dynamics simulations of the liquid–vapor interface of five aqueous alkali dodecyl sulfate solutions, containing Li+, Na+, K+, Rb+, and Cs+ counterions, were performed on the canonical (N, V, T) ensemble at the temperature T = 298 K. The X, Y, and Z edges of the basic simulation box were 265, 62.82, and 62.82 Å, respectively, with X being the surface normal axis. The basic box has contained 8000 water molecules, 192 DS ions, and 192 alkali counterions in every case. Considering that practically all DS ions were attached to the liquid surface during the entire course of the simulations, this composition corresponds to the surface density of 4 μmol/m2, representing saturated surface coverage.
The DS ions, alkali counterions, and water molecules were described by the GROMOS96 [70,71] and KBFF [72] force fields and by the rigid, three-site SPC/E potential [73], respectively. The choice of the KBFF model of the counterions instead of GROMOS96, used in our previous publication [56], is dictated by the fact that, unlike GROMOS96, KBFF parameters are available for the full set of the alkali cations [72]. CH2 and CH3 groups of the DS ions were treated as united atoms. According to these models, the total energy of the system was calculated as the sum of the interaction energy of the particle pairs and the intramolecular energy of the DS ions, the former being the sum of the Lennard-Jones and Coulomb contributions of all atom pairs, and the latter consisting of angle bending and torsional terms. All interactions were truncated to zero beyond the group-based cut-off distance of 15.0 Å; the long-range part of the electrostatic interaction was taken into account using Ewald summation in its smooth particle mesh implementation (sPME) [74]. The geometry of the water molecules as well as the bond lengths of the DS ions were kept unchanged by means of the SHAKE algorithm [75].
The simulations were performed using an in-house modified version [76] of the GROMACS 5.1 package [77], which allowed us to calculate the lateral pressure contribution of the individual atoms and hence also the lateral pressure profile as well as the contributions of the various molecules and moieties to it. These lateral pressure contributions, including the terms corresponding to the sPME correction of the electrostatic interaction, were calculated employing the Harasima path as described in our previous publication [78]. We recall here that using the Harasima path allows us to account for the lateral pressure contribution corresponding to the sPME correction [69], and it enables us to distribute the lateral pressure contributions among the individual atoms [57]. Equations of motion were solved using integration time steps of 2 fs. The temperature of the systems was kept constant by means of the Nosé–Hoover algorithm [79,80], using a time constant of 1 ps.
Simulations were started from the final configuration of the simulation of the Na+DS solution reported in our previous paper [56]. The systems were further equilibrated for 10 ns. Density and lateral pressure profiles were then calculated, averaging also over the two liquid surfaces present in the basic box, using 5 × 10⁴ equilibrium configurations, separated by 0.4 ps long trajectories each, which resulted from a subsequent, 20 ns long production run. Equilibrium snapshots of the surface portion of the systems consisting of Na+ and Cs+ counterions are shown in Figure 1a,b, respectively, as taken from our simulations.

4. Results and Discussion

4.1. Surface Tension and Radial Distribution Functions

The density profiles of the systems simulated along the macroscopic surface normal axis, X, as well as the contributions coming from the water molecules, sulfate headgroups and dodecyl tails of the DS ions, and counterions to these profiles are shown in Figure 2, while the surface tension values obtained in the five systems simulated are collected in Table 1. For reference, the surface tension value corresponding to neat SPC/E water [81] is also included in Table 1. It should be noted that it is rather difficult to compare these surface tension values with experimental data corresponding to the same systems because, due to the small size of the systems simulated, practically no surfactant ion has penetrated into the bulk aqueous phase; instead, they are all attached to the liquid surface. As a consequence, the bulk phase concentration of the surfactant cannot be meaningfully defined in our simulations. Nevertheless, it is clear that aqueous dodecyl sulfate solutions corresponding to the more or less saturated surface concentration of the DS ions of 4 μmol/m2 must have considerably lower surface tension than neat water. Thus, it is rather striking that, in our simulations, even this qualitative trend is only reproduced when using Na+ counterions, while in the presence of all the other counterions considered here the surface tension of the surfactant solution turns out to be considerably higher than that of neat water. It should be emphasized that the KBFF model of alkali cations was developed by testing the properties of aqueous alkali halide solutions using the SPC/E model of water, but it has not been tested in the presence of anionic surfactants [72,82]. Although the GROMOS96 force field, used here to describe the DS ions, is supposed to be compatible also with the SPC/E water model, our results clearly point out that the KBFF model of the alkali ions is incompatible with the GROMOS96 + SPC/E force field combination.
To understand the reasons of the apparent and striking failure of this model combination, we have calculated the radial distribution functions between the cations and the water oxygen atoms, sulfate S atoms, and sulfate O atoms (referred to here as g+Ow(r), g+S(r), and g+Os(r), respectively). The obtained radial distributions are plotted in Figure 3. As seen in the figure, the g+Os(r) functions of all cations, with the exception of Na+, exhibit a huge peak between about 2 and 2.5 Å, indicating the very strong tendency of these cations to form contact pairs with the sulfate group of the DS ions. A similar picture is seen for the g+S(r) functions, with the only differences being that (i) here the first peak appears at 1–1.5 Å greater distances than in the g+Os(r) functions, reflecting the trivial fact that the O atoms rather than the central S atom of the sulfate group is directly accessible for the counterions, and that (ii) the first peak of g+S(r), with the exception of the case of Li+, is split due to the presence of two O atoms of different constitutional positions in the sulfate group. In the case of both of these radial distribution functions, the results corresponding to the Na+ ion exhibit a markedly different behavior, as here the amplitude of the first peak is at least an order of magnitude smaller than for all other alkali counterions. This finding indicates the much weaker tendency of Na+ than all the other alkali cations, as described by the KBFF force field, to form contact pairs with the negatively charged group of the DS ions. Correspondingly, the first peak of the g+Ow(r) function is an order of magnitude higher in the case of Na+ than for the larger alkali ions (i.e., K+, Rb+, and Cs+). More importantly, the first peak of g+Ow(r) of all cations, with the exception of Na+, is an order of magnitude lower than that of g+Os(r), occurring at the same position, while for Na+ the opposite relation is observed. This result indicates that while the Na+ ion is typically fully surrounded by water molecules and prefers, as expected, to form solvent separated pairs with the DS headgroups, all other alkali counterions described by the KBFF force field strongly prefer to form contact pairs with the DS headgroups, or, in other words, they are simply stuck to them. This unphysical behavior of the counterions is clearly seen in the example of Cs+ in the snapshot of Figure 1b. This finding is also reflected in the density profiles (see Figure 2). Indeed, the density peaks of the headgroups and counterions occur in the same position along the interface normal axis for all counterions but Na+, in the case of which these two peaks are separated by about 2.7 Å, i.e., roughly the size of a water molecule. The observed unphysical attachment of the counterions to the DS headgroups is related to the inconsistency of the surfactant (GROMOS) and counterion (KBFF) force field parameters and leads to the unphysical increase of the surface tension of the system in the presence of the alkali dodecyl sulfate surfactant.

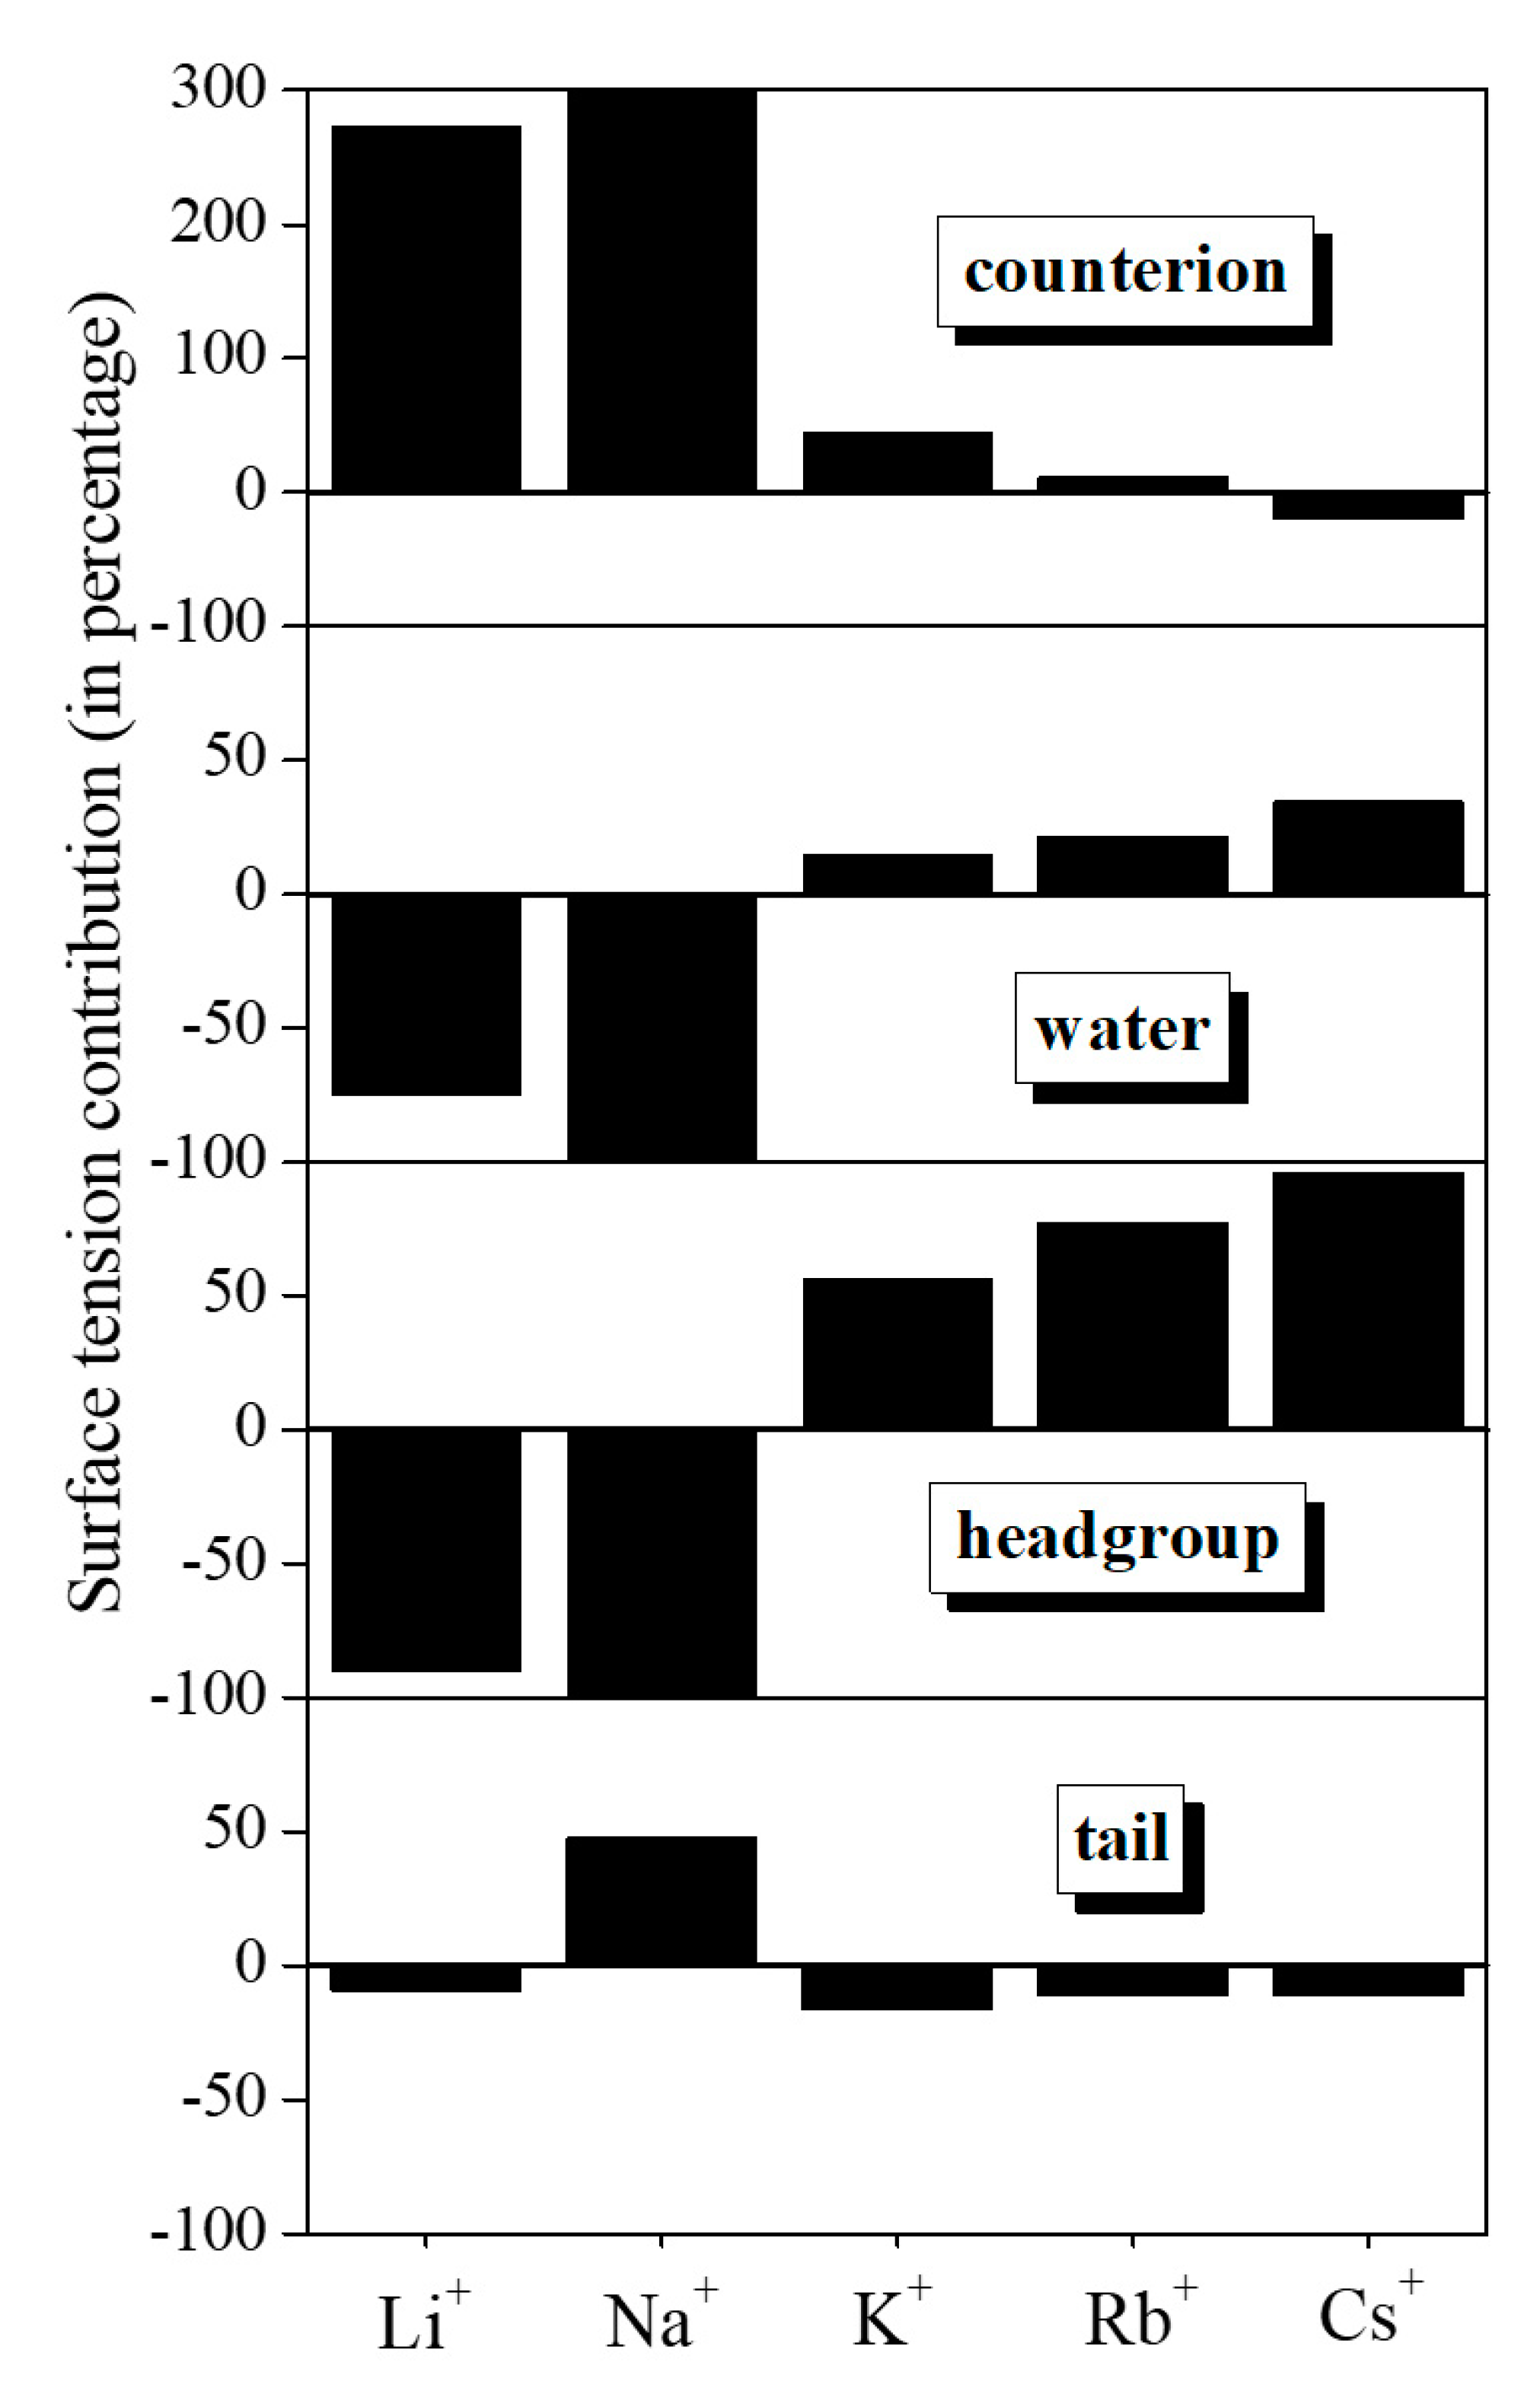
4.2. Lateral Pressure Profiles and Surface Tension Contributions

Despite the apparent failure of the combination of the KBFF and GROMOS96 force fields in properly describing the behavior of the alkali DS solutions, we have calculated the lateral pressure profiles and surface tension contributions of the different molecules and moieties in these systems. The main reason for this is that, regardless of the unphysical attachment of the oppositely charged ions, the qualitative trend of the surface tension contributions of the counterions of different “hardness” might still be reproduced. In this case, the present results can still be indicative (although by no means decisive) of whether the soft/hard character of the counterions might possibly be related to their surprisingly large surface tension contribution. It should be emphasized that in our previous publication, only the Na+ counterion was studied in the systems containing the DS surfactant ion; furthermore, besides KBFF, the GROMOS96 model of Na+ was also considered, and both models led to a proper decrease of the surface tension [56]. Thus, the failure of the KBFF cation model in this respect, reported here, does not invalidate our previous findings at all.
The obtained lateral pressure profile and surface tension contributions of the various molecules and moieties are shown in Figure 4 and Figure 5, respectively; the surface tension contribution values are also collected in Table 2. The marked oscillation of the headgroup and counterion lateral pressure profiles in the cases of K+, Rb+, and Cs+ is probably a consequence of the ordering effect of the observed unphysically strong ion pairing involving these large counterions. Therefore, here we refrain from interpreting this feature.
Nevertheless, it is clear that the amplitude of the lateral pressure profile of the counterions decreases gradually and even changes sign by increasing size (and, hence, softness) of the counterion. This trend is accompanied by an opposite change of the lateral pressure profiles of the headgroups. Figure 5 and Table 2 show that the surface tension contribution of the alkali counterions gradually decreases from about 200 mN/m (in the case of the hardest Li+ and Na+ ions) to almost zero, even indicating a negative contribution in the case of the softest counterion (i.e., Cs+). At the same time, the opposite trend is seen for the surface tension contributions of the headgroups and, to a smaller extent, also for those of the water molecules. It also turns out that in the presence of the softest counterion, i.e., Cs+, the system behaves qualitatively in the same way (i.e., positive surface tension contributions of the headgroups and water molecules, negative contribution of the counterions) as was previously observed for DTA+Cl, i.e., a positively charged surfactant and a negatively charged counterion (see Figure 9 of [56]). It should be emphasized that the system consisting of Na+ counterions, which behaves in a qualitatively different (i.e., correct) way than the others, does not deviate substantially from these trends, suggesting that the failure of the model in reproducing the surface tension of the system might indeed not substantially affect the relation of the soft/hard character of the counterions and the surface tension contribution of the different molecules and moieties. The only exception in this respect is the relatively large positive contribution of the dodecyl tails to the surface tension in the presence of Na+. Nevertheless, due to the failure of the model discussed above, the present findings cannot be regarded more than being only qualitative results and need to be confirmed later by using a more reliable potential model that can, at least qualitatively, reproduce the decrease of the surface tension in the presence of surfactants.

5. Conclusions

In this paper, the relation of the surface tension contribution of the various molecules and moieties with the soft/hard character of the counterions has been intended to be investigated by computer simulations of the liquid–vapor interface of various aqueous alkali dodecyl sulfate solutions. The main and unexpected result of this study is, however, the striking failure of the used model combination of GROMOS96 surfactant ions, KBFF counterions, and SPC/E water in reproducing, at least qualitatively, the decrease of the surface tension in the presence of the ionic surfactant. In this respect, only the system consisting of Na+ counterions has been found to behave in a physically reasonable way. It should be emphasized that, ironically, exactly the observed failure of the model combination used for all alkali counterions but Na+ clearly proves the extremely important role of the counterions in determining the surface tension of the aqueous solutions of ionic surfactants. The reason for the observed failure has been traced back to the unphysically strong contact pair formation (i.e., attachment) of the counterions and the negatively charged sulfate groups of the surfactants.
The evaluation of the surface tension contribution of the different molecules and moieties has shown a clear trend between these contributions and the soft/hard character of the counterions. More specifically, with increasing size and, hence, softness of the alkali counterions, the surface tension contributions of the counterions gradually decreases, while those of the surfactant headgroups and water molecules increase and even change sign. Thus, in respect to the surface tension contributions, the system consisting of Cs+DS has been found to behave qualitatively in the same way as was found earlier for the cationic surfactant DTA+Cl [56]. The fact that these trends are more or less followed in the presence of the Na+ counterion, i.e., the only one that does not behave in an unphysical way, suggests that the observed trend might not be strongly affected by the aforementioned failure of the model. Nevertheless, the present findings need to be confirmed by additional simulations, performed with potential models that are able to describe the qualitative behavior of the surface tension of the system upon addition of surfactants. This work might well involve various all-atom [83] and united atom [84] force fields of the DS ion as well as of the alkali counterions [85,86]. Work in this direction is currently in progress.

Author Contributions

Conceptualization, G.H. (George Horvai) and P.J.; methodology, M.S.; software, M.S.; formal analysis, G.H. (György Hantal); investigation, G.H. (György Hantal) and P.J.; data curation, G.H. (György Hantal); writing—original draft preparation, P.J.; writing—review and editing, P.J.; project administration, P.J. All authors have read and agreed to the published version of the manuscript.

Funding

This work has been supported by the Hungarian NKFIH Foundation under Project Nos. 119732, 120075 and 134596, and by the EFOP project “Complex Development of Research Capacities and Services at the Eszterhazy Karoly University” under project No. EFOP-3.6.1-16-2016-00001.

Conflicts of Interest

The authors declare no conflict of interest.

References

  1. Rowlinson, J.S.; Widom, B. Molecular Theory of Capillarity, 1st ed.; Clarendon Press: Oxford, UK, 1982. [Google Scholar]
  2. Sega, M.; Fábián, B.; Horvai, G.; Jedlovszky, P. How Is the Surface Tension of Various Liquids Distributed along the Interface Normal? J. Phys. Chem. C 2016, 120, 27468–27477. [Google Scholar] [CrossRef] [Green Version]
  3. Allen, M.P.; Tildesley, D.J. Computer Simulation of Liquids, 1st ed.; Clarendon Press: Oxford, UK, 1987. [Google Scholar]
  4. Hua, X.Y.; Rosen, M.J. Dynamic Surface Tension of Aqueous Surfactant Solutions. I. Basic Parameters. J. Coll. Interface Sci. 1988, 124, 652–659. [Google Scholar]
  5. Lu, J.R.; Simister, E.A.; Lee, E.M.; Thomas, R.K.; Rennie, A.R.; Penfold, J. Direct Determination by Neutron Reflection of the Penetration of Water into Surfactant Layers at the Air/Water Interface. Langmuir 1992, 8, 1837–1844. [Google Scholar] [CrossRef]
  6. Lu, J.R.; Simister, E.A.; Thomas, R.K.; Penfold, J. Structure of an Octadecyltrimethylammonium Bromide Layer at the Air/Water Interface Determined by Neutron Reflection: Systematic Errors in Reflectivity Measurements. J. Phys. Chem. 1993, 97, 6024–6602. [Google Scholar] [CrossRef]
  7. Messmer, M.C.; Conboy, J.C.; Richmond, G.L. Observation of Molecular Ordering at the Liquid-Liquid Interface by Resonant Sum Frequency Generation. J. Am. Chem. Soc. 1995, 117, 8039–8040. [Google Scholar] [CrossRef]
  8. Conboy, J.C.; Messmer, M.C.; Richmond, G.L. Investigation of Surfactant Conformation and Order at the Liquid–Liquid Interface by Total Internal Reflection Sum-Frequency Vibrational Spectroscopy. J. Phys. Chem. 1996, 100, 7617–7622. [Google Scholar] [CrossRef]
  9. Gragson, D.E.; McCarty, B.M.; Richmond, G.L. Surfactant/Water Interactions at the Air/Water Interface Probed by Vibrational Sum Frequency Generation. J. Phys. Chem. 1996, 100, 14272–14275. [Google Scholar] [CrossRef]
  10. Bain, C.D. Studies of Adsorption at Interfaces by Optical Techniques: Ellipsometry, Second Harmonic Generation and Sum-Frequency Generation. Curr. Opin. Colloid Interface Sci. 1998, 3, 287–292. [Google Scholar] [CrossRef]
  11. Li, Z.X.; Dong, C.C.; Thomas, R.K. Neutron Reflectivity Studies of the Surface Excess of Gemini Surfactants at the Air–Water Interface. Langmuir 1999, 15, 4392–4396. [Google Scholar] [CrossRef]
  12. Stubenrauch, C.; Albouy, P.A.; von Klitzing, R.; Langevin, D. Polymer/Surfactant Complexes at the Water/Air Interface: A Surface Tension and X-ray Reflectivity Study. Langmuir 2000, 16, 3206–3213. [Google Scholar] [CrossRef]
  13. Lu, J.R.; Thomas, R.K.; Penfold, J. Surfactant Layers at the Air/Water Interface: Structure and Composition. Adv. Coll. Interface Sci. 2000, 84, 143–304. [Google Scholar] [CrossRef]
  14. Benderskii, A.V.; Eisenthal, K.B. Aqueous Solvation Dynamics at the Anionic urfactant Air/Water Interface. J. Phys. Chem. B 2001, 105, 6698–6703. [Google Scholar] [CrossRef] [Green Version]
  15. Gilányi, T.; Varga, I.; Mészáros, R. Specific Counterion Effect on the Adsorption of Alkali Decyl Sulfate Surfactants at Air/Solution Interface. Phys. Chem. Chem. Phys. 2004, 6, 4348–4346. [Google Scholar] [CrossRef]
  16. Ma, G.; Allen, H.C. Real-Time Investigation of Lung Surfactant Respreading with Surface Vibrational Spectroscopy. Langmuir 2006, 22, 11267–11274. [Google Scholar] [CrossRef]
  17. Kirsch, M.J.; D’Auria, R.; Brown, M.A.; Tobias, D.J.; Hemminger, J.C.; Ammann, M.; Starr, D.E.; Bluhm, H. The Effect of an Organic Surfactant on the Liquid-Vapor Interface of an Electrolyte Solution. J. Phys. Chem. C 2007, 111, 13497–13509. [Google Scholar] [CrossRef]
  18. Sloutskin, E.; Sapir, Z.; Bain, C.D.; Lei, Q.; Wilkinson, K.M.; Tamam, L.; Deutsch, M.; Ocko, B.M. Wetting, Mixing, and Phase Transitions in Langmuir-Gibbs Films. Phys. Rev. Lett. 2007, 99, 136102. [Google Scholar] [CrossRef] [Green Version]
  19. Zhang, Z.; Zheng, D.; Guo, Y.; Wang, H. Water Penetration/Accommodation and Phase Behaviour of the Neutral Langmuir Monolayer at the Air/Water Interface Probed with Sum Frequency Generation Vibrational Spectroscopy (SFG-VS). Phys. Chem. Chem. Phys. 2009, 11, 991–1002. [Google Scholar] [CrossRef]
  20. de Aguiar, H.B.; Scheu, R.; Jena, K.C.; de Beer, A.G.F.; Roke, S. Comparison of Scattering and Reflection SFG: A Question of Phase-Matching. Phys. Chem. Chem. Phys. 2012, 14, 6826–6832. [Google Scholar] [CrossRef]
  21. Angus-Smyth, A.; Campbell, R.A.; Bain, C.D. Dynamic Adsorption of Weakly Interacting Polymer/Surfactant Mixtures at the Air/Water Interface. Langmuir 2012, 28, 12479–12492. [Google Scholar] [CrossRef]
  22. Gong, H.; Xu, G.; Liu, T.; Xu, L.; Zhai, X.; Zhang, J.; Lv, X. Aggregation Behaviors of PEO-PPO-ph-PPO-PEO and PPO-PEO-ph-PEO-PPO at an Air/Water Interface: Experimental Study and Molecular Dynamics Simulation. Langmuir 2012, 28, 13590–13600. [Google Scholar] [CrossRef]
  23. Scheu, R.; Chen, Y.; de Aguiar, H.B.; Rankin, B.M.; Ben-Amotz, D.; Roke, S. Specific Ion Effects in Amphiphile Hydration and Interface Stabilization. J. Am. Chem. Soc. 2014, 136, 2040–2047. [Google Scholar] [CrossRef] [PubMed]
  24. Phan, C.M.; Nguyen, C.V.; Yusa, S.; Yamada, N.L. Synergistic Adsorption of MIBC/CTAB Mixture at the Air/Water Interface and Applicability of Gibbs Adsorption Equation. Langmuir 2014, 30, 5790–5796. [Google Scholar] [CrossRef] [PubMed]
  25. Shahir, A.A.; Arabadzhieva, D.; Petkova, H.; Karakashev, S.I.; Nguyen, A.V.; Mileva, E. Effect of Under-Monolayer Adsorption on Foamability, Rheological Characteristics, and Dynamic Behavior of Fluid Interfaces: Experimental Evidence for the Guggenheim Extended Interface Model. J. Phys. Chem. C 2017, 121, 11472–11487. [Google Scholar] [CrossRef]
  26. Shahir, A.A.; Nguyen, K.T.; Nguyen, A.V. A Sum-Frequency Generation Spectroscopic Study of the Gibbs Analysis Paradox: Monolayer or Sub-Monolayer Adsorption? Phys. Chem. Chem. Phys. 2016, 18, 8794–8805. [Google Scholar] [CrossRef] [PubMed]
  27. Böcker, J.; Schlenkirch, M.; Bopp, P.; Brickmann, J. Molecular Dynamics Simulation of a n-Hexadecyltrimethylammonium Chloride Monolayer. J. Phys. Chem. 1992, 96, 9915–9922. [Google Scholar] [CrossRef]
  28. Tarek, M.; Tobias, D.J.; Klein, M.L. Molecular Dynamics Simulation of Tetradecyltrimethylammonium Bromide Monolayers at the Air/Water Interface. J. Phys. Chem. 1995, 99, 1393–1402. [Google Scholar] [CrossRef]
  29. Schweighofer, K.; Essman, U.; Berkowitz, M. Simulation of Sodium Dodecyl Sulfate at the Water-Vapor and Water-Carbon Tetrachloride Interfaces at Low Surface Coverage. J. Phys. Chem. B 1997, 101, 3793–3799. [Google Scholar] [CrossRef]
  30. Schweighofer, K.; Essman, U.; Berkowitz, M. Structure and Dynamics of Water in the Presence of Charged Surfactant Monolayers at the Water-CCl4 Interface. A Molecular Dynamics Study. J. Phys. Chem. B 1997, 101, 10775–10780. [Google Scholar] [CrossRef]
  31. Schweighofer, K.; Benjamin, I. Transfer of a Tetramethylammonium Ion across the Water–Nitrobenzene Interface: Potential of Mean Force and Nonequilibrium Dynamics. J. Phys. Chem. A 1999, 103, 10274–10279. [Google Scholar] [CrossRef]
  32. Domínguez, H.; Berkowitz, M. Computer Simulations of Sodium Dodecyl Sulfate at Liquid/Liquid and Liquid/Vapor Interfaces. J. Phys. Chem. B 2000, 104, 5302–5308. [Google Scholar] [CrossRef]
  33. Domínguez, H. Computer Simulations of Surfactant Mixtures at the Liquid/Liquid Interface. J. Phys. Chem. B 2002, 106, 5915–5924. [Google Scholar] [CrossRef]
  34. Jedlovszky, P.; Varga, I.; Gilányi, T. Adsorption of 1-Octanol at the Free Water Surface as Studied By Monte Carlo Simulation. J. Chem. Phys. 2004, 120, 11839–11851. [Google Scholar] [CrossRef] [PubMed]
  35. Domínguez, H. Computer Simulation Studies of Surfactant Monolayer Mixtures at the Water/Oil Interface: Charge Distribution Effects. J. Colloid Interface Sci. 2004, 274, 665–672. [Google Scholar] [CrossRef] [PubMed]
  36. Paszternák, A.; Kiss, É.; Jedlovszky, P. Structure of the nonionic Surfactant Triethoxy Monooctylether C8E3 Adsorbed at the Free Water Surface, As Seen from Surface Tension Measurements and Monte Carlo Simulations. J. Chem. Phys. 2005, 122, 124704. [Google Scholar] [CrossRef] [PubMed]
  37. Domínguez, H.; Rivera, M. Mixtures of Sodium Dodecyl Sulfate/Dodecanol at the Air/Water Interface by Computer Simulations. Langmuir 2005, 21, 7257–7262. [Google Scholar] [CrossRef] [PubMed]
  38. Rodriguez, J.; Clavero, E.; Laria, D. Computer Simulations of Catanionic Surfactants Adsorbed at Air/Water Interfaces. J. Phys. Chem. B 2005, 109, 24427–24433. [Google Scholar] [CrossRef] [PubMed]
  39. Chanda, J.; Bandyopadhyay, S. Molecular Dynamics Study of Surfactant Monolayers Adsorbed at the Oil/Water and Air/Water Interfaces. J. Phys. Chem. B 2006, 110, 23482–23488. [Google Scholar] [CrossRef]
  40. Hantal, G.; Pártay, L.B.; Varga, I.; Jedlovszky, P.; Gilányi, T. Counterion and Surface Density Dependence of the Adsorption Layer of Ionic Surfactants at the Vapor-Aqueous Solution Interface: A Computer Simulation Study. J. Phys. Chem. B 2007, 111, 1769–1774. [Google Scholar] [CrossRef]
  41. Darvas, M.; Gilányi, T.; Jedlovszky, P. Adsorption of Poly(ethylene oxide) at the Free Water Surface. A Computer Simulation Study. J. Phys. Chem. B 2010, 114, 10995–11001. [Google Scholar] [CrossRef]
  42. Martínez, H.; Chacón, E.; Tarazona, P.; Bresme, F. The Intrinsic Interfacial Structure of Ionic Surfactant Monolayers at Water-Oil and Water-Vapour Interfaces. Proc. R. Soc. A 2011, 467, 1939–1958. [Google Scholar] [CrossRef]
  43. Bresme, F.; Chacón, E.; Martínez, H.; Tarazona, P. Adhesive Transitions in Newton Black Films: A Computer Simulation Study. J. Chem. Phys. 2011, 134, 214701. [Google Scholar] [CrossRef] [Green Version]
  44. Darvas, M.; Gilányi, T.; Jedlovszky, P. Competitive Adsorption of Surfactants and Polymers at the Free Water Surface. A Computer Simulation Study of the Sodium Dodecyl Sulfate-Poly(ethylene oxide) System. J. Phys. Chem. B 2011, 115, 933–944. [Google Scholar] [CrossRef] [PubMed]
  45. Pang, J.; Wang, Y.; Xu, G.; Han, T. Molecular Dynamics Simulation of SDS, DTAB, and C12E8 Monolayers Adsorbed at the Air/Water Surface in the Presence of DSEP. J. Phys. Chem. B 2011, 115, 2518–2526. [Google Scholar] [CrossRef] [PubMed]
  46. Rideg, N.A.; Darvas, M.; Varga, I.; Jedlovszky, P. Lateral Dynamics of Surfactants at the Free Water Surface. A Computer Simulation Study. Langmuir 2012, 28, 14944–14953. [Google Scholar] [CrossRef] [PubMed]
  47. Vacha, R.; Roke, S. Sodium Dodecyl Sulfate at Water–Hydrophobic Interfaces: A Simulation Study. J. Phys. Chem. B 2012, 116, 11936–11942. [Google Scholar] [CrossRef] [PubMed]
  48. Abrankó-Rideg, N.; Darvas, M.; Horvai, G.; Jedlovszky, P. Immersion Depth of Surfactants at the Free Water Surface: A Computer Simulation and ITIM Analysis Study. J. Phys. Chem. B 2013, 117, 8733–8746. [Google Scholar] [CrossRef] [PubMed]
  49. Chen, M.; Lu, X.; Liu, X.; Hou, Q.; Zhu, Y.; Zhou, H. Specific Counterion Effects on the Atomistic Structure and Capillary-Waves Fluctuation of the Water/Vapor Interface Covered by Sodium Dodecyl Sulfate. J. Phys. Chem. C 2014, 118, 19205–19213. [Google Scholar] [CrossRef]
  50. Chen, M.; Lu, X.; Liu, X.; Hou, Q.; Zhu, Y.; Zhou, H. Temperature-Dependent Phase Transition and Desorption Free Energy of Sodium Dodecyl Sulfate at the Water/Vapor Interface: Approaches from Molecular Dynamics Simulations. Langmuir 2014, 30, 10600–10607. [Google Scholar] [CrossRef]
  51. Tesei, G.; Paradossi, G.; Chiessi, E. Influence of Surface Concentration on Poly(vinyl alcohol) Behavior at the Water–Vacuum Interface: A Molecular Dynamics Simulation Study. J. Phys. Chem. B 2014, 118, 6946–6955. [Google Scholar] [CrossRef]
  52. Bernardino, K.; de Moura, A.F. Surface Electrostatic Potential and Water Orientation in the presence of Sodium Octanoate Dilute Monolayers Studied by Means of Molecular Dynamics Simulations. Langmuir 2015, 31, 10995–11004. [Google Scholar] [CrossRef]
  53. Abrankó-Rideg, N.; Horvai, G.; Jedlovszky, P. Structure of the Adsorption Layer of Various Ionic and Non-Ionic Surfactants at the Free Water Surface, As Seen from Computer Simulation and ITIM Analysis. J. Mol. Liq. 2015, 205, 9–15. [Google Scholar] [CrossRef] [Green Version]
  54. Chong, L.; Lai, Y.; Gray, M.; Soong, Y.; Shi, F.; Duan, Y. Molecular Dynamics Study of the Bulk and Interface Properties of Frother and Oil with Saltwater and Air. J. Phys. Chem. B 2017, 121, 2788–2796. [Google Scholar] [CrossRef]
  55. Sresht, V.; Lewandowski, E.P.; Blankschtein, D.; Jusufi, A. Combined Molecular Dynamics Simulation–Molecular-Thermodynamic Theory Framework for Predicting Surface Tensions. Langmuir 2017, 33, 8319–8329. [Google Scholar] [CrossRef]
  56. Hantal, G.; Sega, M.; Horvai, G.; Jedlovszky, P. Contribution of Different Molecules and Moieties to the Surface Tension in Aqueous Surfactant Solutions. J. Phys. Chem. C 2019, 123, 16660–16670. [Google Scholar] [CrossRef]
  57. Sega, M.; Fábián, B.; Jedlovszky, P. Layer-by-Layer and Intrinsic Analysis of Molecular and Thermodynamic Properties across Soft Interfaces. J. Chem. Phys. 2015, 143, 114709. [Google Scholar] [CrossRef] [PubMed] [Green Version]
  58. Hofmeister, F. Zur Lehre von der Wirkung der Salze. Archiv Experiment. Pathol. Pharmakol. 1888, 24, 247–260. [Google Scholar] [CrossRef] [Green Version]
  59. Jungwirth, P.; Tobias, D.J. Molecular Structure of Salt Solutions: A New View of the Interface with Implications for Heterogeneous Atmospheric Chemistry. J. Phys. Chem. B 2001, 105, 10468–10472. [Google Scholar] [CrossRef]
  60. Vrbka, L.; Mucha, M.; Minofar, B.; Jungwirth, P.; Brown, E.C.; Tobias, D.J. Propensity of Soft Ions for the Air/Water Interface. Curr. Opin. Coll. Interface Sci. 2004, 9, 67–73. [Google Scholar] [CrossRef]
  61. Boström, M.; Kunz, W.; Ninham, B.W. Hofmeister Effects in Surface Tension of Aqueous Electrolyte Solution. Langmuir 2005, 21, 2619–2623. [Google Scholar] [CrossRef] [PubMed]
  62. Jungwirth, P.; Tobias, D.J. Specific Ion Effects at the Air/Water Interface. Chem. Rev. 2006, 106, 1259–1281. [Google Scholar] [CrossRef]
  63. Pegram, L.M.; Record, M.T., Jr. Hofmeister Salt Effects on Surface Tension Arise from Partitioning of Anions and Cations between Bulk Water and the Air-Water Interface. J. Phys. Chem. B 2007, 111, 5411–5417. [Google Scholar] [CrossRef]
  64. dos Santos, A.P.; Diehl, A.; Levin, Y. Surface Tensions, Surface Potentials, and the Hofmeister Series of Electrolyte Solutions. Langmuir 2010, 26, 10778–10783. [Google Scholar] [CrossRef] [Green Version]
  65. dos Santos, A.P.; Levin, Y. Surface and Interfacial Tensions of Hofmeister Electrolytes. Faraday Discuss. 2013, 160, 75–87. [Google Scholar] [CrossRef] [Green Version]
  66. Schofield, P.; Henderson, J.R. Statistical Mechanics of Inhomogeneous Fluids. Proc. R. Soc. Lond. A 1982, 379, 231–246. [Google Scholar]
  67. Irving, J.H.; Kirkwood, J.G. The Statistical Mechanical Theory of Transport Processes. IV. The Equations of Hydrodynamics. J. Chem. Phys. 1950, 18, 817–829. [Google Scholar] [CrossRef]
  68. Harasima, A. Molecular Theory of Surface Tension. Adv. Chem. Phys. 1958, 1, 203–237. [Google Scholar]
  69. Sonne, J.; Hansen, F.Y.; Peters, G.H. Methodological Problems in Pressure Profile Calculations for Lipid Bilayers. J. Chem. Phys. 2005, 122, 124903. [Google Scholar] [CrossRef] [PubMed] [Green Version]
  70. Schuler, L.D.; Daura, X.; van Gunsteren, W.F. An Improved GROMOS96 Force Field for Aliphatic Hydrocarbons in the Condensed Phase. J. Comp. Chem. 2001, 22, 1205–1218. [Google Scholar] [CrossRef]
  71. van Gunsteren, W.F.; Billeter, S.R.; Eising, A.A.; Hünenberger, P.H.; Krüger, P.; Mark, A.E.; Scott, W.R.P.; Tironi, I.G. Biomolecular Simulation: The GROMOS96 Manual and User Guide; Vdf Hochschulverlag AG an der ETH Zürich: Zürich, Switzerland, 1996; pp. 1–1042. [Google Scholar]
  72. Gee, M.B.; Cox, N.R.; Jiao, Y.; Bentenitis, N.; Weerasinghe, S.; Smith, P.E. A Kirkwood-Buff Derived Force Field for Aqueous Alkali Halides. J. Chem. Theory Comput. 2011, 7, 1369–1380. [Google Scholar] [CrossRef] [Green Version]
  73. Berendsen, H.J.C.; Grigera, J.R.; Straatsma, T. The Missing Term in Effective pair Potentials. J. Phys. Chem. 1987, 91, 6269–6271. [Google Scholar] [CrossRef]
  74. Essman, U.; Perera, L.; Berkowitz, M.L.; Darden, T.; Lee, H.; Pedersen, L.G. A Smooth Particle Mesh Ewald Method. J. Chem. Phys. 1995, 103, 8577–8594. [Google Scholar] [CrossRef] [Green Version]
  75. Ryckaert, J.P.; Ciccotti, G.; Berendsen, H.J.C. Numerical Integration of the Cartesian Equations of Motion of a System with Constraints; Molecular Dynamics of n-Alkanes. J. Comp. Phys. 1977, 23, 327–341. [Google Scholar] [CrossRef] [Green Version]
  76. GitHub–Marcello Sega. Available online: https://github.com/Marcello-Sega/gromacs/tree/virial/ (accessed on 25 March 2019). The code is freely available.
  77. Pronk, S.; Páll, S.; Schulz, R.; Larsson, P.; Bjelkmar, P.; Apostolov, R.; Shirts, M.R.; Smith, J.C.; Kasson, P.M.; van der Spoel, D.; et al. GROMACS 4.5: A High-Throughput and Highly Parallel Open Source Molecular Simulation Toolkit. Bioinformatics 2013, 29, 845–854. [Google Scholar] [CrossRef] [PubMed]
  78. Sega, M.; Fábián, B.; Jedlovszky, P. Pressure Profile Calculation with Particle Mesh Ewald Methods. J. Chem. Theory Comput. 2016, 12, 4509–4515. [Google Scholar] [CrossRef] [PubMed] [Green Version]
  79. Nosé, S. A Molecular Dynamics Method for Simulations in the Canonical Ensemble. Mol. Phys. 1984, 52, 255–268. [Google Scholar] [CrossRef]
  80. Hoover, W.G. Canonical Dynamics: Equilibrium Phase-Space Distributions. Phys. Rev. A 1985, 31, 1695–1697. [Google Scholar] [CrossRef] [Green Version]
  81. Sega, M.; Dellago, C. Long-Range Dispersion Effects on the Water/Vapor Interface Simulated Using the Most Common Models. J. Phys. Chem. B 2017, 121, 3798–3803. [Google Scholar] [CrossRef] [Green Version]
  82. Weerasinghe, S.; Smith, P.E. A Kirkwood–Buff Derived Force Field for Sodium Chloride in Water. J. Chem. Phys. 2003, 119, 11342–11349. [Google Scholar] [CrossRef]
  83. Klauda, J.B.; Venable, R.M.; Freites, J.A.; O’Connor, J.W.; Tobias, D.J.; Mondragon-Ramirez, C.; Vorobyov, I.; MacKerrell, A.D., Jr.; Pastor, R.W. Update of the CHARMM All-Atom Additive Force Field for Lipids: Validation on Six Lipid Types. J. Phys. Chem. B 2010, 114, 7830–7843. [Google Scholar] [CrossRef] [Green Version]
  84. Ríos-López, M.; Mendez-Bermúdez, J.G.; Domínguez, H. New Force Field Parameters for the Sodium Dodecyl Sulfate and Alpha Olefin Sulfonate Anionic Surfactants. J. Phys. Chem. B 2018, 122, 4558–4565. [Google Scholar]
  85. Joung, I.S.; Cheatham, T.E., III. Determination of Alkali and Halide Monovalent Ion Parameters for Use in Explicitly Solvated Biomolecular Simulations. J. Phys. Chem. B 2008, 112, 9020–9041. [Google Scholar] [CrossRef] [PubMed] [Green Version]
  86. Deublein, S.; Vrabec, J.; Hasse, H. A Set of Molecular Models for Alkali and Halide Ions in Aqueous Solution. J. Chem. Phys. 2012, 136, 084501. [Google Scholar] [CrossRef] [PubMed]
Figure 1. Equilibrium snapshot of the surface portion of the systems consisting of (a) Na+ and (b) Cs+ counterions, as taken from our simulations. The Na+ and Cs+ ions as well as the C, S, O, and H atoms are marked by brown, purple, blue, yellow, red, and white colors, respectively. Water molecules are represented by sticks, while H atoms of the DS ions are omitted from the snapshots for clarity.
Colloids 04 00015 g001
Figure 2. Mass density profile of the systems simulated along the macroscopic surface normal axis, X (black solid curves), as well as the contributions coming from the water molecules (blue dashed curves), alkali counterions (orange dotted curves), as well as from the sulfate headgroups (green dash-dotted curves) and dodecyl tails (red dash-dot-dotted curves) of the DS ions to these profiles, as obtained in the systems consisting of Li+ (top panel), Na+ (second panel), K+ (third panel), Rb+ (fourth panel), and Cs+ (bottom panel) counterions. All profiles shown are symmetrized over the two liquid surfaces present in the basic box. Scales at the right side of the figure refer to the counterion density, while those at the left side refer to all other densities.
Colloids 04 00015 g002
Figure 3. Radial distribution functions between the alkali counterions and the sulfate S atoms (top panel), sulfate O atoms (middle panel), and water oxygen atoms (bottom panel), as obtained in the systems consisting of Li+ (black solid curves), Na+ (red dashed curves), K+ (green dotted curves), Rb+ (blue dash-dotted curves), and Cs+ (orange dash-dot-dotted curves) counterions.
Colloids 04 00015 g003
Figure 4. Lateral pressure profile in the systems simulated along the macroscopic surface normal axis, X (black solid curves), as well as the contributions coming from the water molecules (blue dashed curves), alkali counterions (orange dotted curves), as well as from the sulfate headgroups (green dash-dotted curves) and dodecyl tails (red dash-dot-dotted curves) of the DS ions to these profiles, as obtained in the systems consisting of Li+ (top panel), Na+ (second panel), K+ (third panel), Rb+ (fourth panel), and Cs+ (bottom panel) counterions. All profiles shown are symmetrized over the two liquid surfaces present in the basic box.
Colloids 04 00015 g004
Figure 5. Surface tension contributions (in percentage) of the counterions (top panel), water molecules (second panel), as well as the DS headgroups (third panel) and tails (bottom panel), as obtained from our simulations with different alkali counterions.
Colloids 04 00015 g005
Table 1. Surface tension of the five alkali dodecyl sulfate solutions, as obtained from our simulations. The value obtained for neat water is also included for comparison. All values are in mN/m units.
Neat WaterLi+DSNa+DSK+DSRb+DSCs+DS
59.068.3 ± 0.636.7 ± 0.271.1 ± 1.068.3 ± 1.076.4 ± 1.5
Table 2. Contribution of the different molecules and moieties to the surface tension in the five alkali dodecyl sulfate solutions simulated (in mN/m units).
CounterionWaterHeadgroupTail
Li+DS187.0−51.3−61.4−6
Na+DS233.6−129.4−84.917.4
K+DS31.810.639.9−11.2
Rb+DS7.914.852.7−7.1
Cs+DS−15.426.573.5−8.2

