Article

An Innovative Miniature Pulsating Emulsification Device: Flow Characterization and Measurement of Emulsion Stability

by
Angeliki P. Chondrou
,
Sotiris P. Evgenidis
,
Margaritis Kostoglou
* and
Thodoris D. Karapantsios
*
Department of Chemical Technology, School of Chemistry, Aristotle University of Thessaloniki, University Box 116, 541 24 Thessaloniki, Greece
*
Authors to whom correspondence should be addressed.
Colloids Interfaces 2020, 4(1), 7; https://doi.org/10.3390/colloids4010007
Submission received: 29 November 2019 / Revised: 28 January 2020 / Accepted: 29 January 2020 / Published: 31 January 2020
(This article belongs to the Special Issue Emulsion Applications)

Abstract

:
The aim of this study is the development of an emulsification device for two immiscible liquids with a total volume of approximately 3 mL. The heart of the device is a piston, with an aluminum plate fixed at its tip, which moves periodically up and down inside a rectangular cell. The plate geometry (uniform or non-uniform height) affects significantly both the emulsions stability and the size of the droplets of the prepared emulsions. Five parameters are examined during testing (surfactant type, surfactant concentration, proportion of immiscible liquids, piston stroke frequency, duration of emulsification) and all of them appear to have an important role in the resulting droplet size distribution. A macroscopic theoretical model is developed for the determination of the main hydrodynamic parameters of the innovative device. It is shown that the non-uniform height plate achieves higher shear rates when compared to the uniform height plate because of the smaller gap between the plate and the cell walls. However, the benefits of the higher shear rate are overturned by the larger effective breakage time encountered in the uniform height plate resulting from the larger surface area of its sides. The results of the emulsification experiments are analyzed using the parameter values derived by the developed model.

Graphical Abstract

1. Introduction

Emulsions constitute a topic of great interest in the scientific literature because of their significance in a multitude of industrial applications. Emulsions are widely applied in foods, cosmetics, pharmaceuticals, agriculture, oil and petroleum industry, etc., [1]. They are heterogeneous systems consisting of two immiscible liquids, where droplets of the first liquid (dispersed phase) are dispersed inside the second liquid (continuous phase) [2,3,4,5]. Two immiscible liquids in agitation form an unstable system because of the unfavorable contact between the organic and the aqueous phase. Therefore, it is of great importance that a third component, the emulsifier, is present in the system. Emulsifier molecules stabilize the system by forming a protective layer at the surface of droplets [6,7]. Surfactants, polymers, solid particles, and blends can be used as emulsifiers [8,9]. Many different destabilization processes may take place during emulsion storage, with sedimentation, flocculation, coalescence, phase inversion, and Ostwald ripening of dispersed droplets being the most important among them [10]. Totally unstable emulsions eventually separate into the two immiscible bulk liquids. Several parameters like the volume of the dispersed phase, the droplet size distribution, the surfactant concentration, and the continuous phase viscosity have been found to play an important role on emulsions stability [11,12,13].
The majority of emulsions are not formed spontaneously. In direct emulsification, the emulsifier is dissolved into the phase where it is most soluble, while the second phase is added and finally the two phases are mixed vigorously together [14]. For the preparation of emulsions, a high amount of energy is required to create an appropriate droplet size distribution of the dispersed phase. High-pressure homogenizers, ultrasound generators, membranes, and microchannels are mainly used in combination with the suitable type and concentration of surfactant(s) for the production of droplets dispersion [15]. Up to date, the most common way of producing emulsions is by using rotor-stator devices for high shear mixing of the two phases, (Moinard-Checot et al. [16], Toledano et al. [17], Williams et al. [18], Bhardwaj et al. [19], Cabrera-Trujillo et al. [20], Salerni et al. [21]). The key features of this emulsification technique are the following: a) Large liquid volumes are used, b) emulsification vessels have mainly cylindrical shape which does not give easy access to optical observation, and c) the definitive factor affecting droplet size is the rotation speed (rpm).
In this study, an innovative miniature emulsification device is developed where shear is generated by the linear periodic movement of a piston up and down inside a rectangular cell with flat glass walls, allowing thereby a high speed video camera to obtain optical recording of droplets’ breakage. The piston movement is controlled with accuracy by custom software. The total volume of the two immiscible liquids is approximately 3 mL, and only a small amount of surfactant(s) is needed. This renders the device suitable when using essential oils or for medicines production where components are hard to get or expensive.
The structure of the present work is the following: In the next section the device and the experimental procedure are presented in detail. Next, experimental results are presented with emphasis on their dependence from the examined experimental parameters. Then, a model is developed for the characterization of the device conditions that lead to breakage of the organic phase. Finally, the experimental data are discussed and evaluated.

2. Materials and Methods

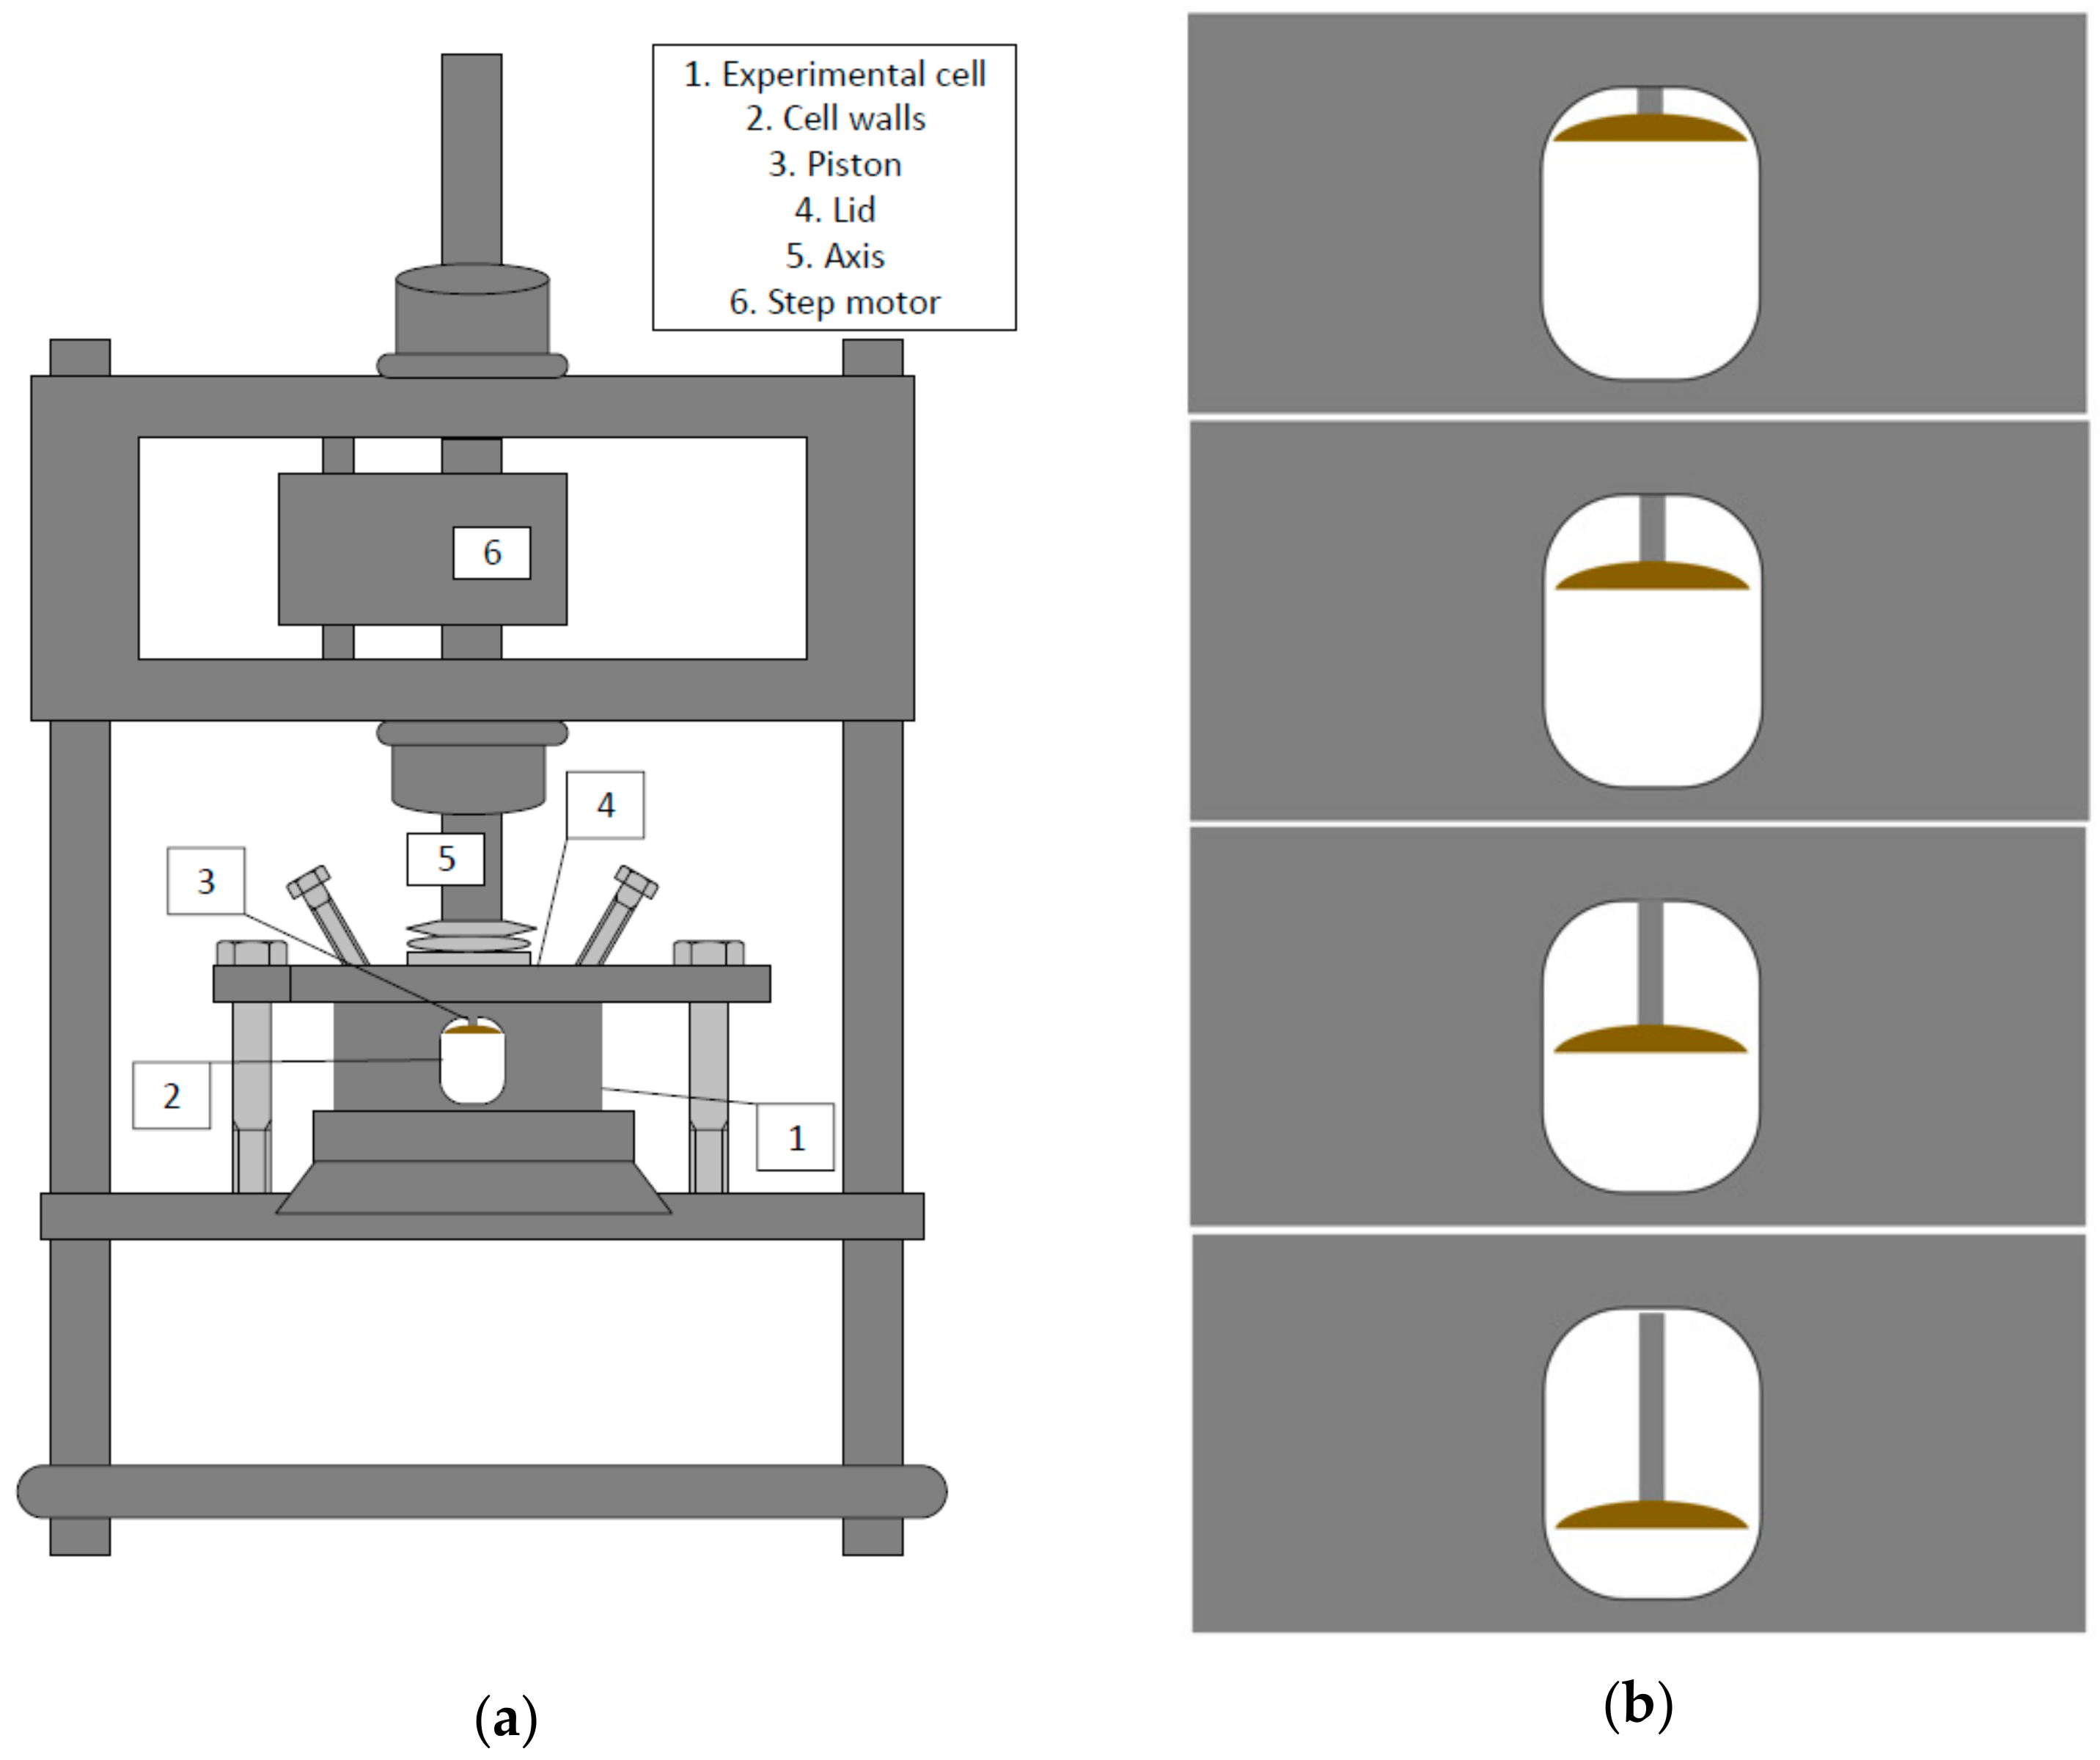
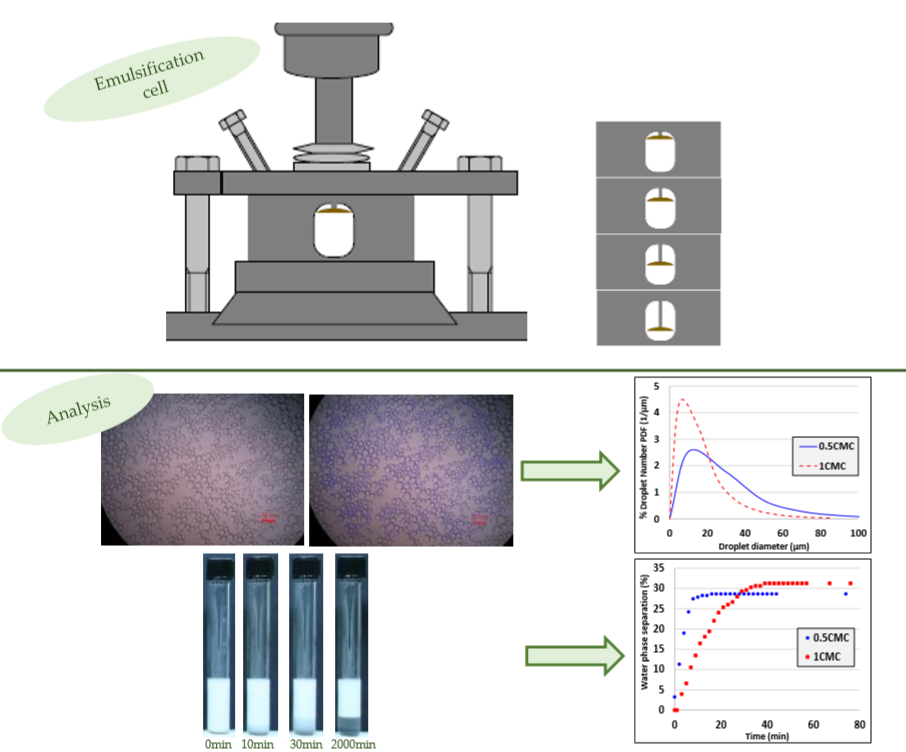
2.1. Miniature Pulsating Emulsification Device

A schematic representation of the emulsification device is illustrated in Figure 1. The most important part of the device is the emulsification cell with a cylindrical piston inside. The emulsification cell is rectangular and has dimensions 13.6 × 13.6 × 24 mm3. However, the volume available for the two immiscible liquids inside the cell is a bit less than 3.5 mL because the lid of the cell protrudes into the cell to provide leakproof conditions and so it occupies part of the cell volume. This also results in a piston travel of only 11 mm although the cell height is 24 mm. The main body of the cell is made of aluminum but there are four glass ports, one at each side of the cell, that allow optical recordings and lighting. The glass thickness is 1 mm. The cylindrical piston is integrated into the lid of the cell. A thin aluminum plate is fixed at the tip of the piston. Almost the entire cross-section of the cell is scavenged by the plate of the piston as it moves periodically up and down inside the cell. At the two extreme top and bottom positions of the piston the aluminum plate leaves a gap of 0.1mm from the cell walls. The piston movement is guided by a stepper motor. A rack-pinion gear is used for converting the rotary motion of the stepper motor into the linear motion of the piston. The motor is controlled through a computer using the custom software Mach3. The two parameters controlled by the software are the stroke frequency (f) and the duration of pulsation which represents the nominal emulsification time (tn).
Two different pistons (Piston 1 and Piston 2) are constructed, Figure 2, since the plate geometry has a significant effect on the droplet size distribution of the produced emulsions. In Piston 1 the sides of the plate have a curved shape of non-uniform height. The maximum height of the plate is 1.8 mm at the center of the curve and the minimum height is 0.1 mm at the two edges of the plate leaving a 0.25 mm gap between the plate and the cell walls. The plate in Piston 2 has sides of orthogonal shape with a uniform height of 1.8 mm from one edge to another, leaving a 0.6 mm gap between the plate and cell walls. With Piston 1, the total volume of the immiscible liquids in the emulsification cell is 3.4 mL, whereas with Piston 2 it is 3.1 mL. The stroke frequency for the emulsification device can be adjusted up to 20 Hz because for higher frequencies mechanical friction of moving parts creates problems in the smooth operation of pulsation. Regarding the duration of pulsation (nominal emulsification time) there is no limitation whatsoever.

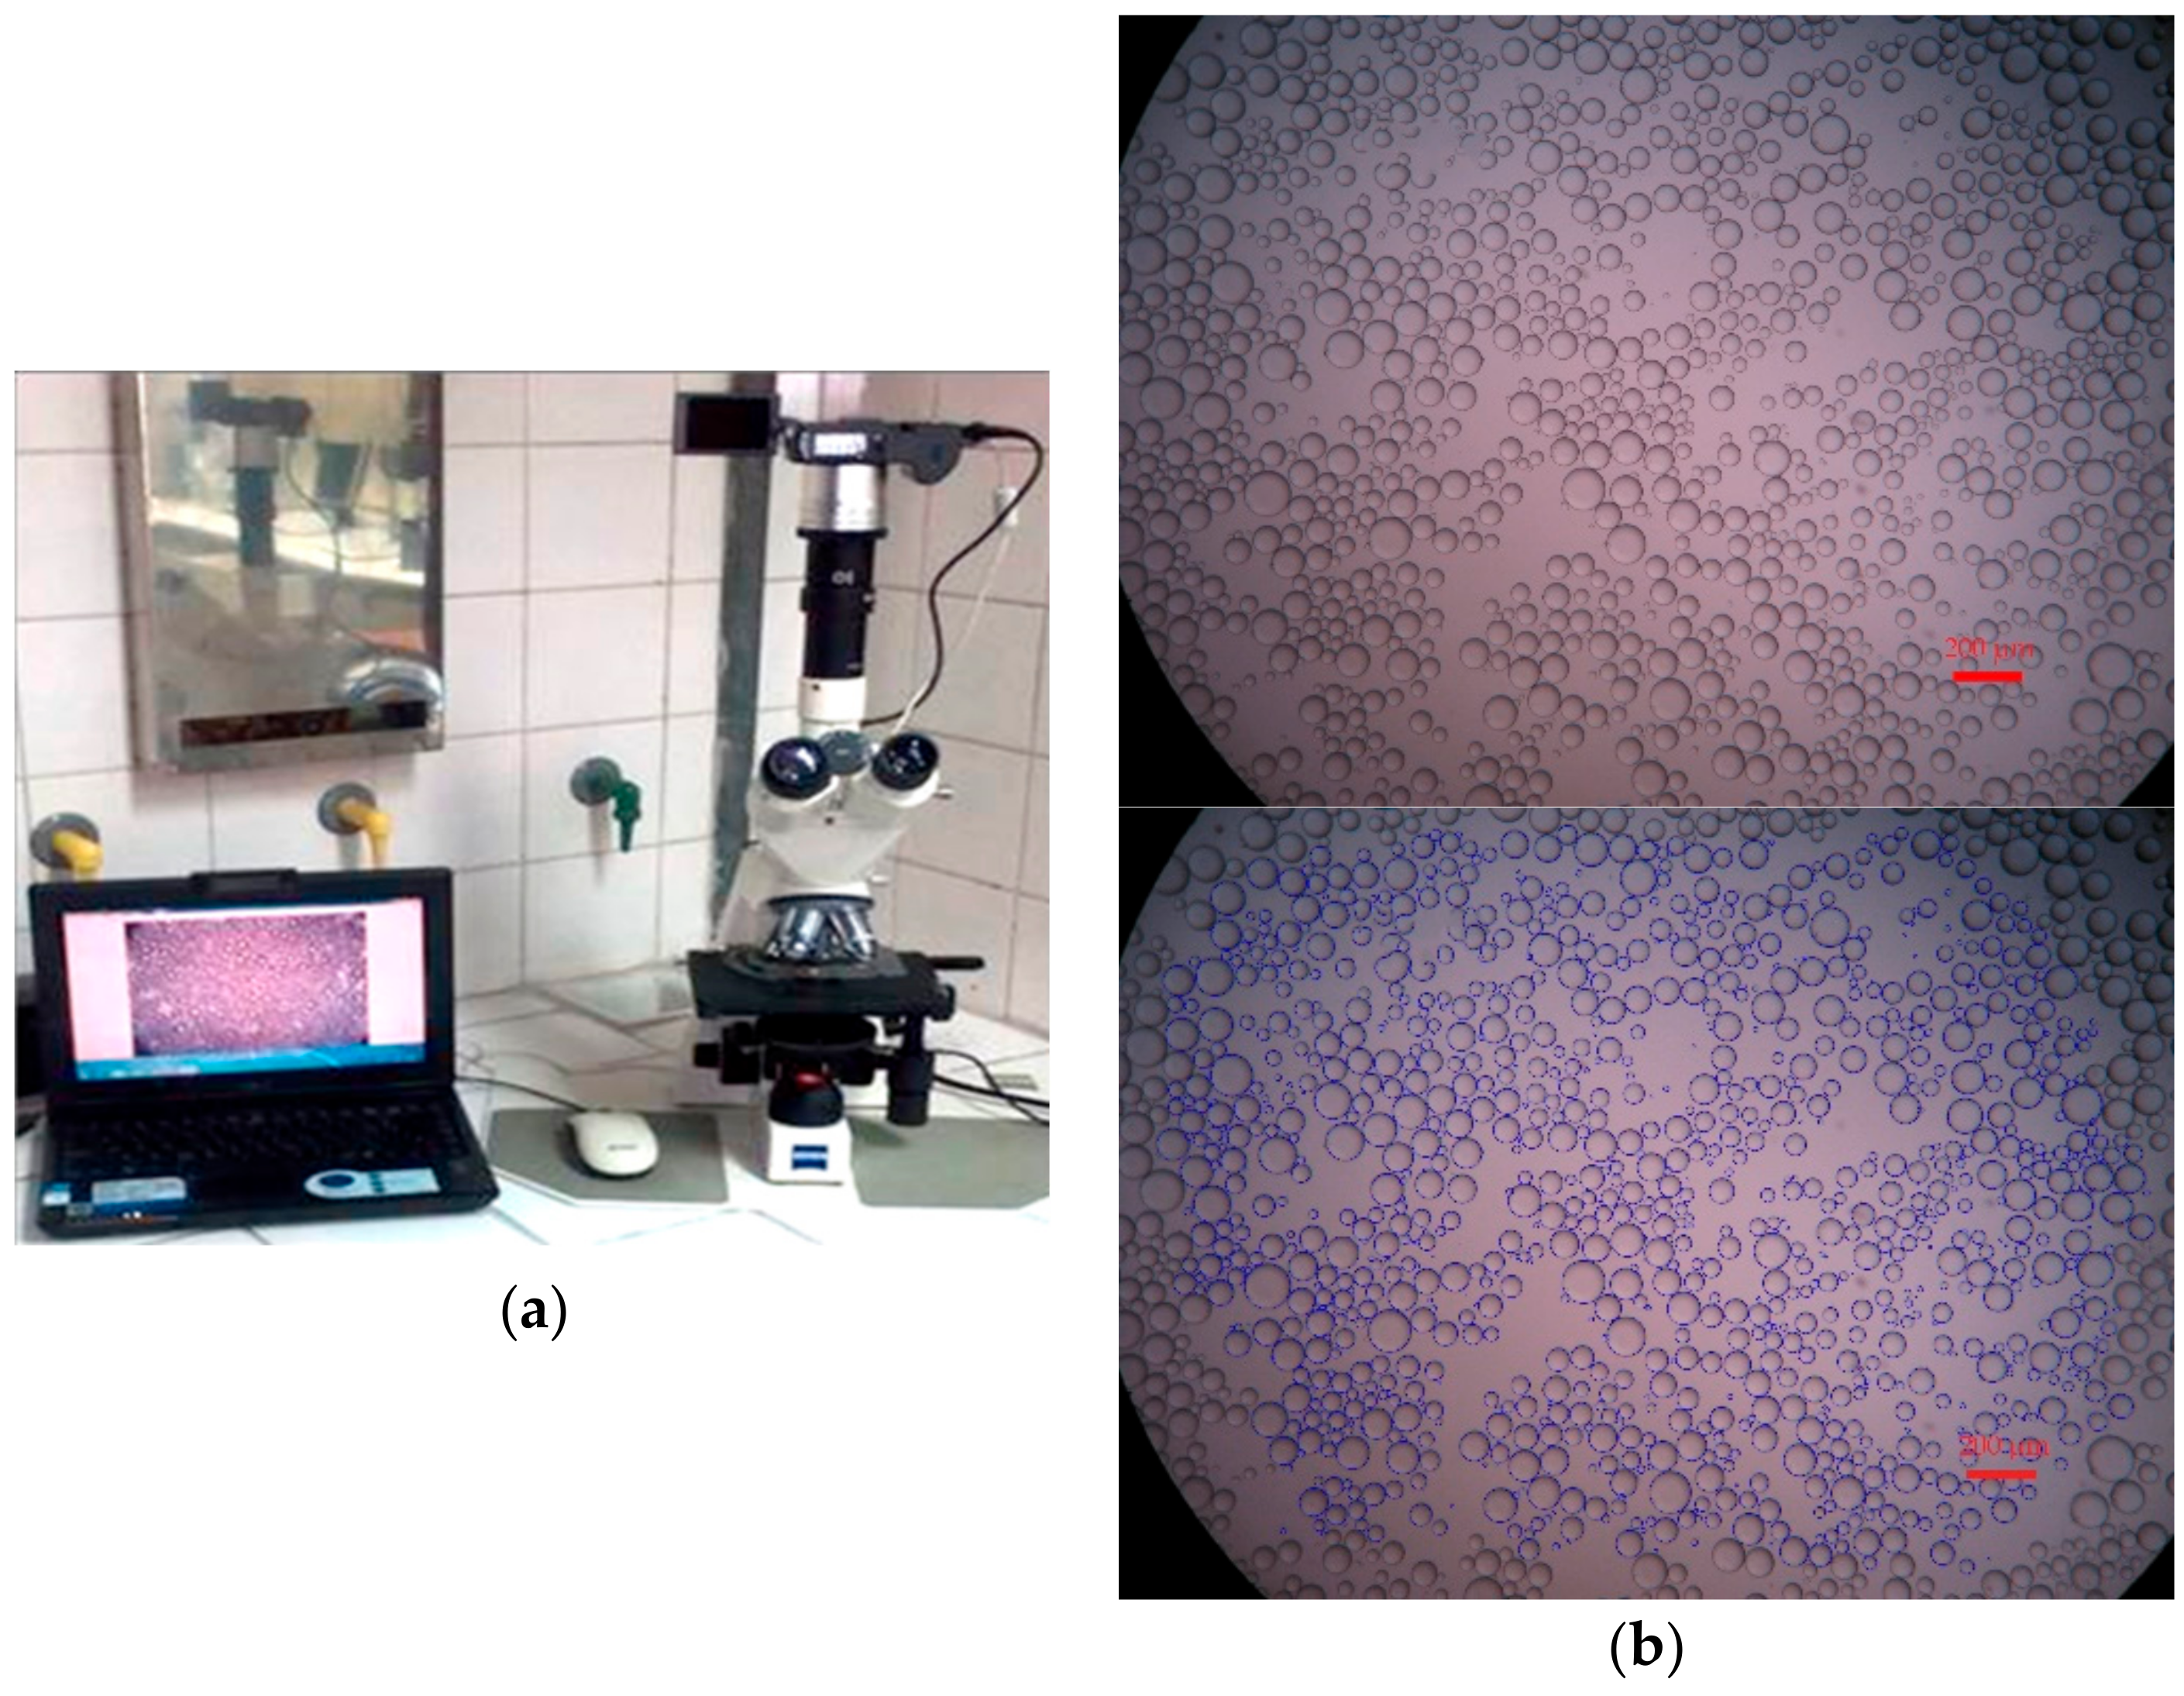
2.2. Experimental Procedure

Millipore water (density: 0.997 g/cm3, viscosity: 0.89 mPa s) and dodecane (density: 0.75 g/cm3, viscosity: 1.34 mPa s) are used as the main components for the preparation of emulsions. In most runs, the surfactant used as emulsifier is sodium dodecyl sulfate (SDS; Sigma-Aldrich, purity ≥ 98.5%). SDS is an odorless anionic surfactant in the form of a white powder. The critical micellar concentration (CMC) of SDS is 2.5 g/L [22]. Beside the main experiments with SDS, Ethylan 1008 (AkzoNobel, 100%) is also examined in a few runs as an alternative emulsifier. Ethylan 1008 is soluble in water, intended for use in low foaming systems, as emulsifier, wetting agent, and defoamer. The critical micellar concentration of Ethylan 1008 is 2 g/L [23].
The emulsification process is kept the same for all the experiments. It starts with mixing the surfactant with Millipore water, using a magnetic stirrer, to produce an aqueous solution 5% w/w of SDS. The mixing takes 30 min at 300 rpm and ambient temperature (25 °C). Proper dilutions with Millipore water follow to produce aqueous solutions with different surfactant concentration. Then an aqueous solution is added to the experimental cell. The organic phase, dodecane, is added next into the cell. Subsequently, the lid of the cell (with the piston on it) is used to seal the cell, offering only two small tubes as communication ports with the outside. One of the ports is used to slowly top-up the cell with dodecane and so get rid of gas pockets in the cell through the other port. At the end, both ports are closed by vanes and the cell interior is isolated from the surroundings. At this stage the cell is ready for pulsation of the piston.
Emulsion stability is registered by two methods. Immediately after the end of the emulsification process (designated as t = 0 min) the emulsion is transferred into a vertical glass tube to allow direct visual observations of the instantaneous height of the creamy phase and of the aqueous phase inside the tube. In fact, at every instant each of the two phases constitute typically an emulsion since they both contain water and oil but at different proportions. Photographs of the tube are taken with a camera (Sony a6300) at different time intervals for several hours/days (Figure 3). The distance of the camera from the glass tube is 40 cm, in order that several tubes (repeatability tests but also different emulsions) can be photographed from the camera at the same time. The camera is configured to automatically take one picture per minute for the first two hours and then one picture per hour until the end of observation. In parallel, a sample of approximately 0.2 mL is taken and placed on microscope slides. A Zeiss, Axiostar plus microscope combined with a Canon, Power Shot A640 video camera is used to capture photographs of oil droplets with high resolution (10 megapixels). The employed eyepiece magnification is x10 and the objective lens is x10. So the total magnification is x100. Several images of each emulsion are analyzed with BubblesEdit® a custom made software [24] capable of determining size distributions of even strongly overlapping droplets using a template-matching technique (Figure 4). The estimation can be obtained either manually or automatically [24]. In this study, the manual approach is preferred for greater accuracy and a population of at least 1500 droplets is measured from each run, so as to ensure statistical significance in the determination of droplet size distributions. Generally as many pictures as needed are analyzed for a population of 1500 droplets to be obtained. The droplets are circled one by one manually for greater accuracy. The radius of the measured droplets is exported from the software and after some mathematical calculations the droplet size distribution is obtained. According to the recommendations of [25,26,27], there is a critical number of droplets that must be measured to ensure statistical accuracy. This number is typically of order of some thousands. Following the analysis of Paine it is computed that the maximum sampling error regarding median droplet diameter in the present data is 3.5%. The smallest droplet that can be measured by this technique is 0.7 μm. Experiments are made in triplicate to check for repeatability.

2.3. Experimental Conditions

Experiments are conducted using both Piston 1 and Piston 2. Four different stroke frequencies (5, 10, 15, 20 Hz) are employed during the experiments. Two different oil:water ratios are examined with both pistons (50:50, 20:80), as well as three different surfactant concentrations (0.5, 1, 10 CMC). The nominal emulsification time is selected to range from 0.25 to 10 min. All the above are parameters expected to result in different droplet size distributions. The employed experimental conditions are summarized in Table 1 (for Piston 1) and Table 2 (for Piston 2).

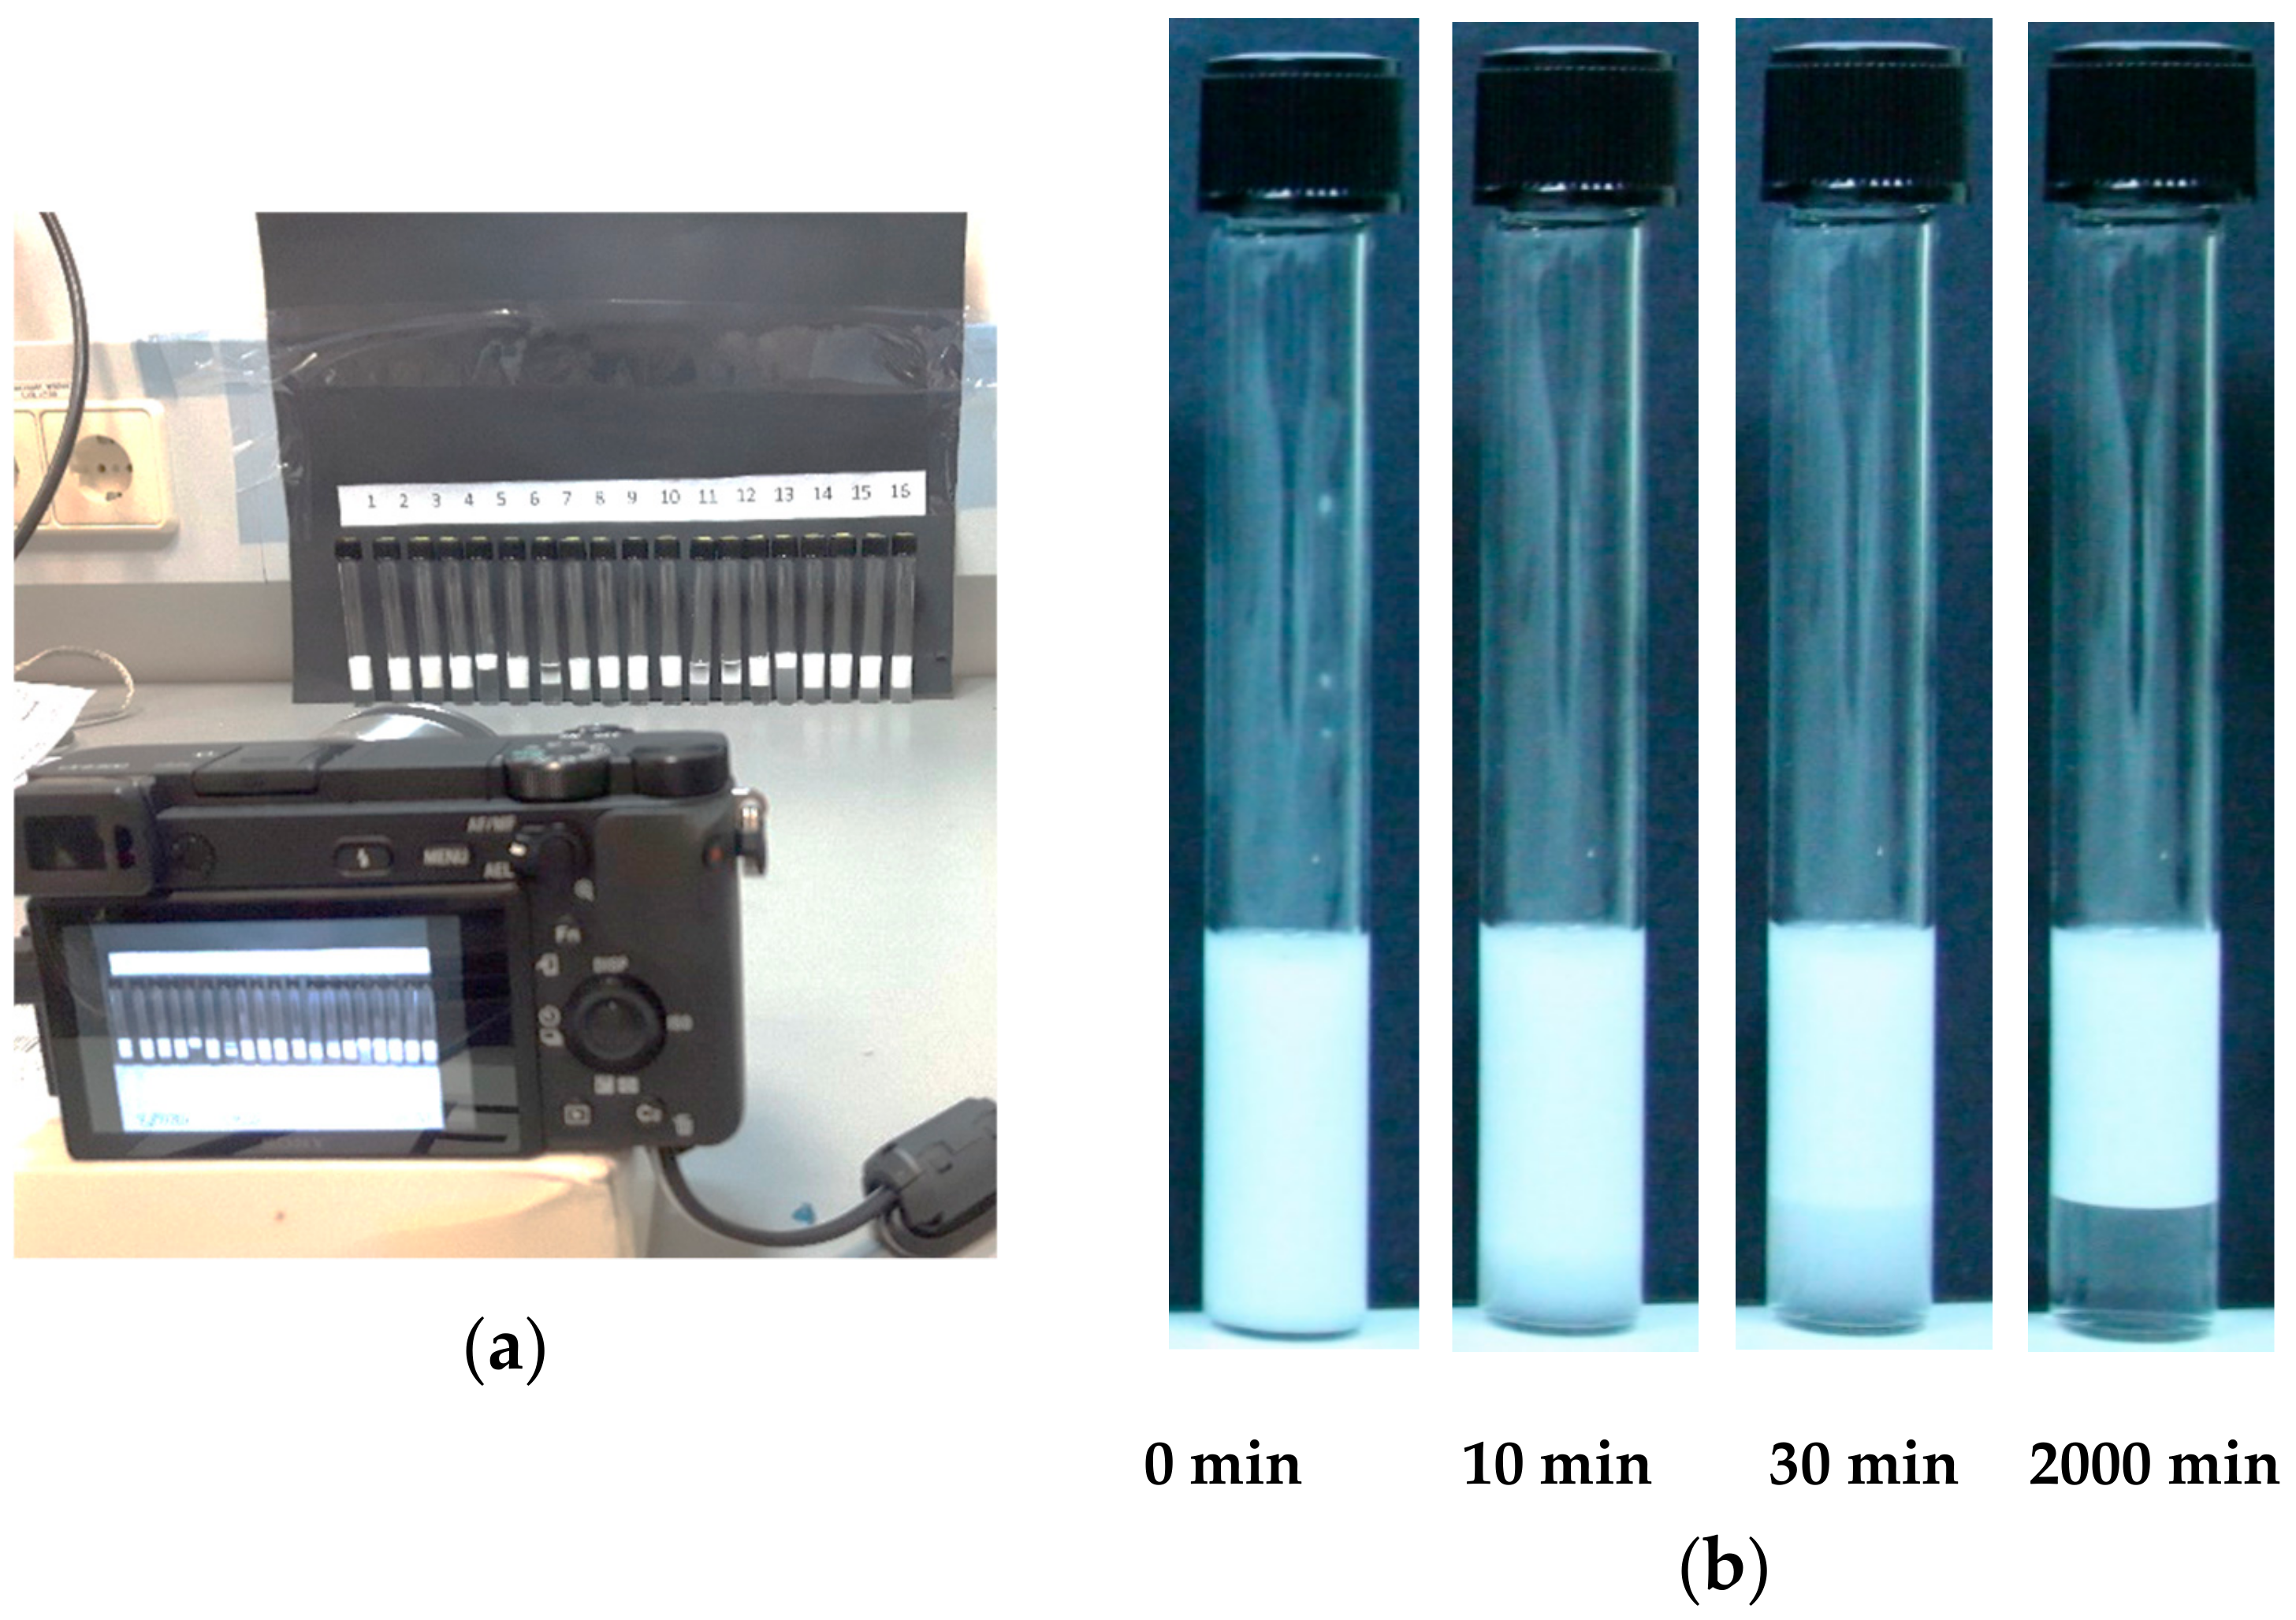
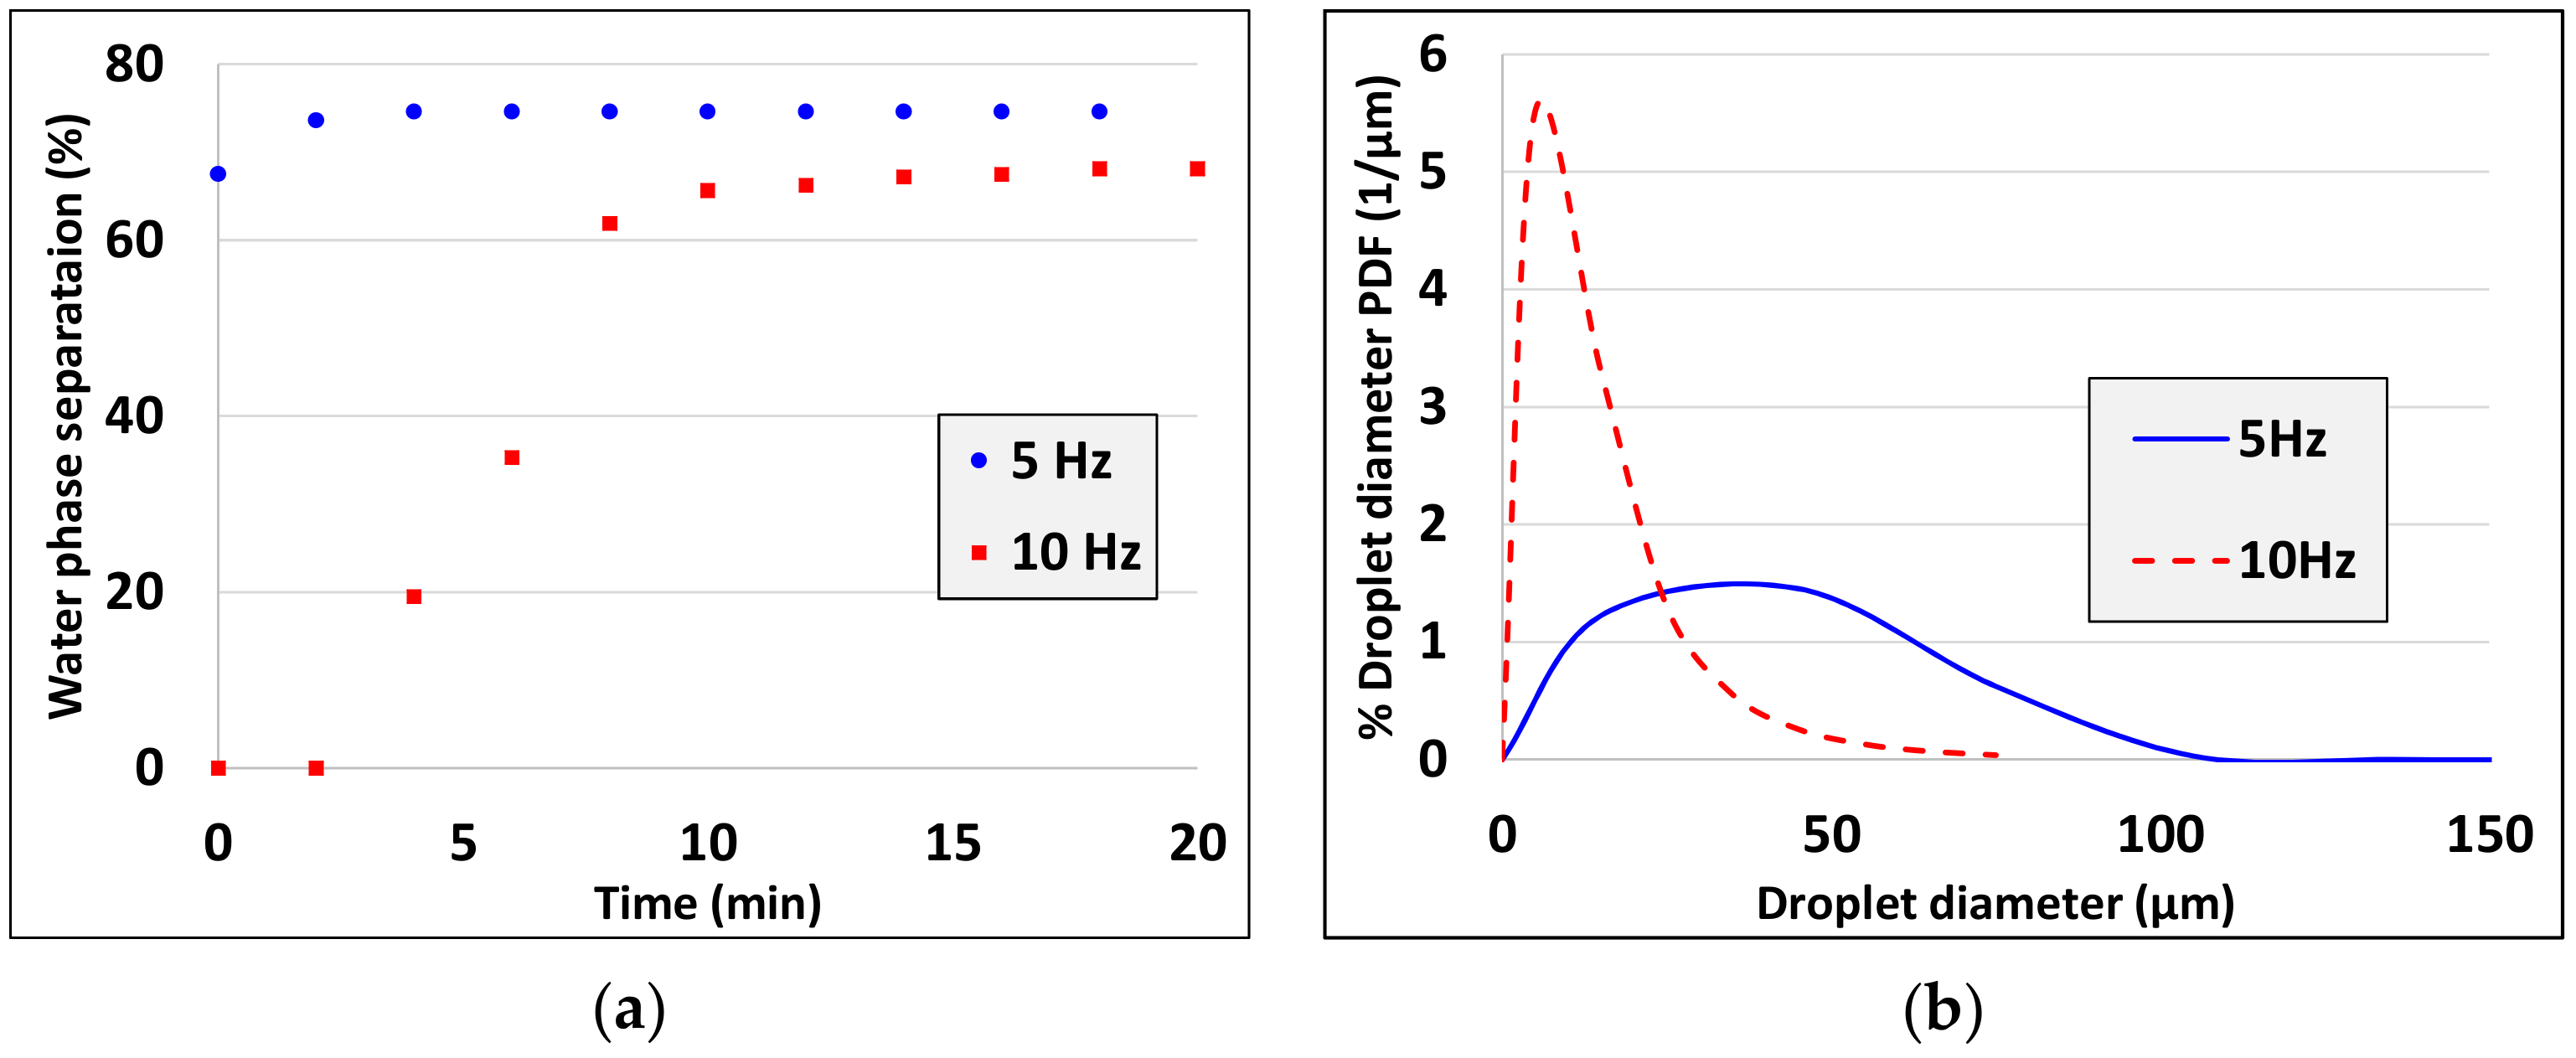
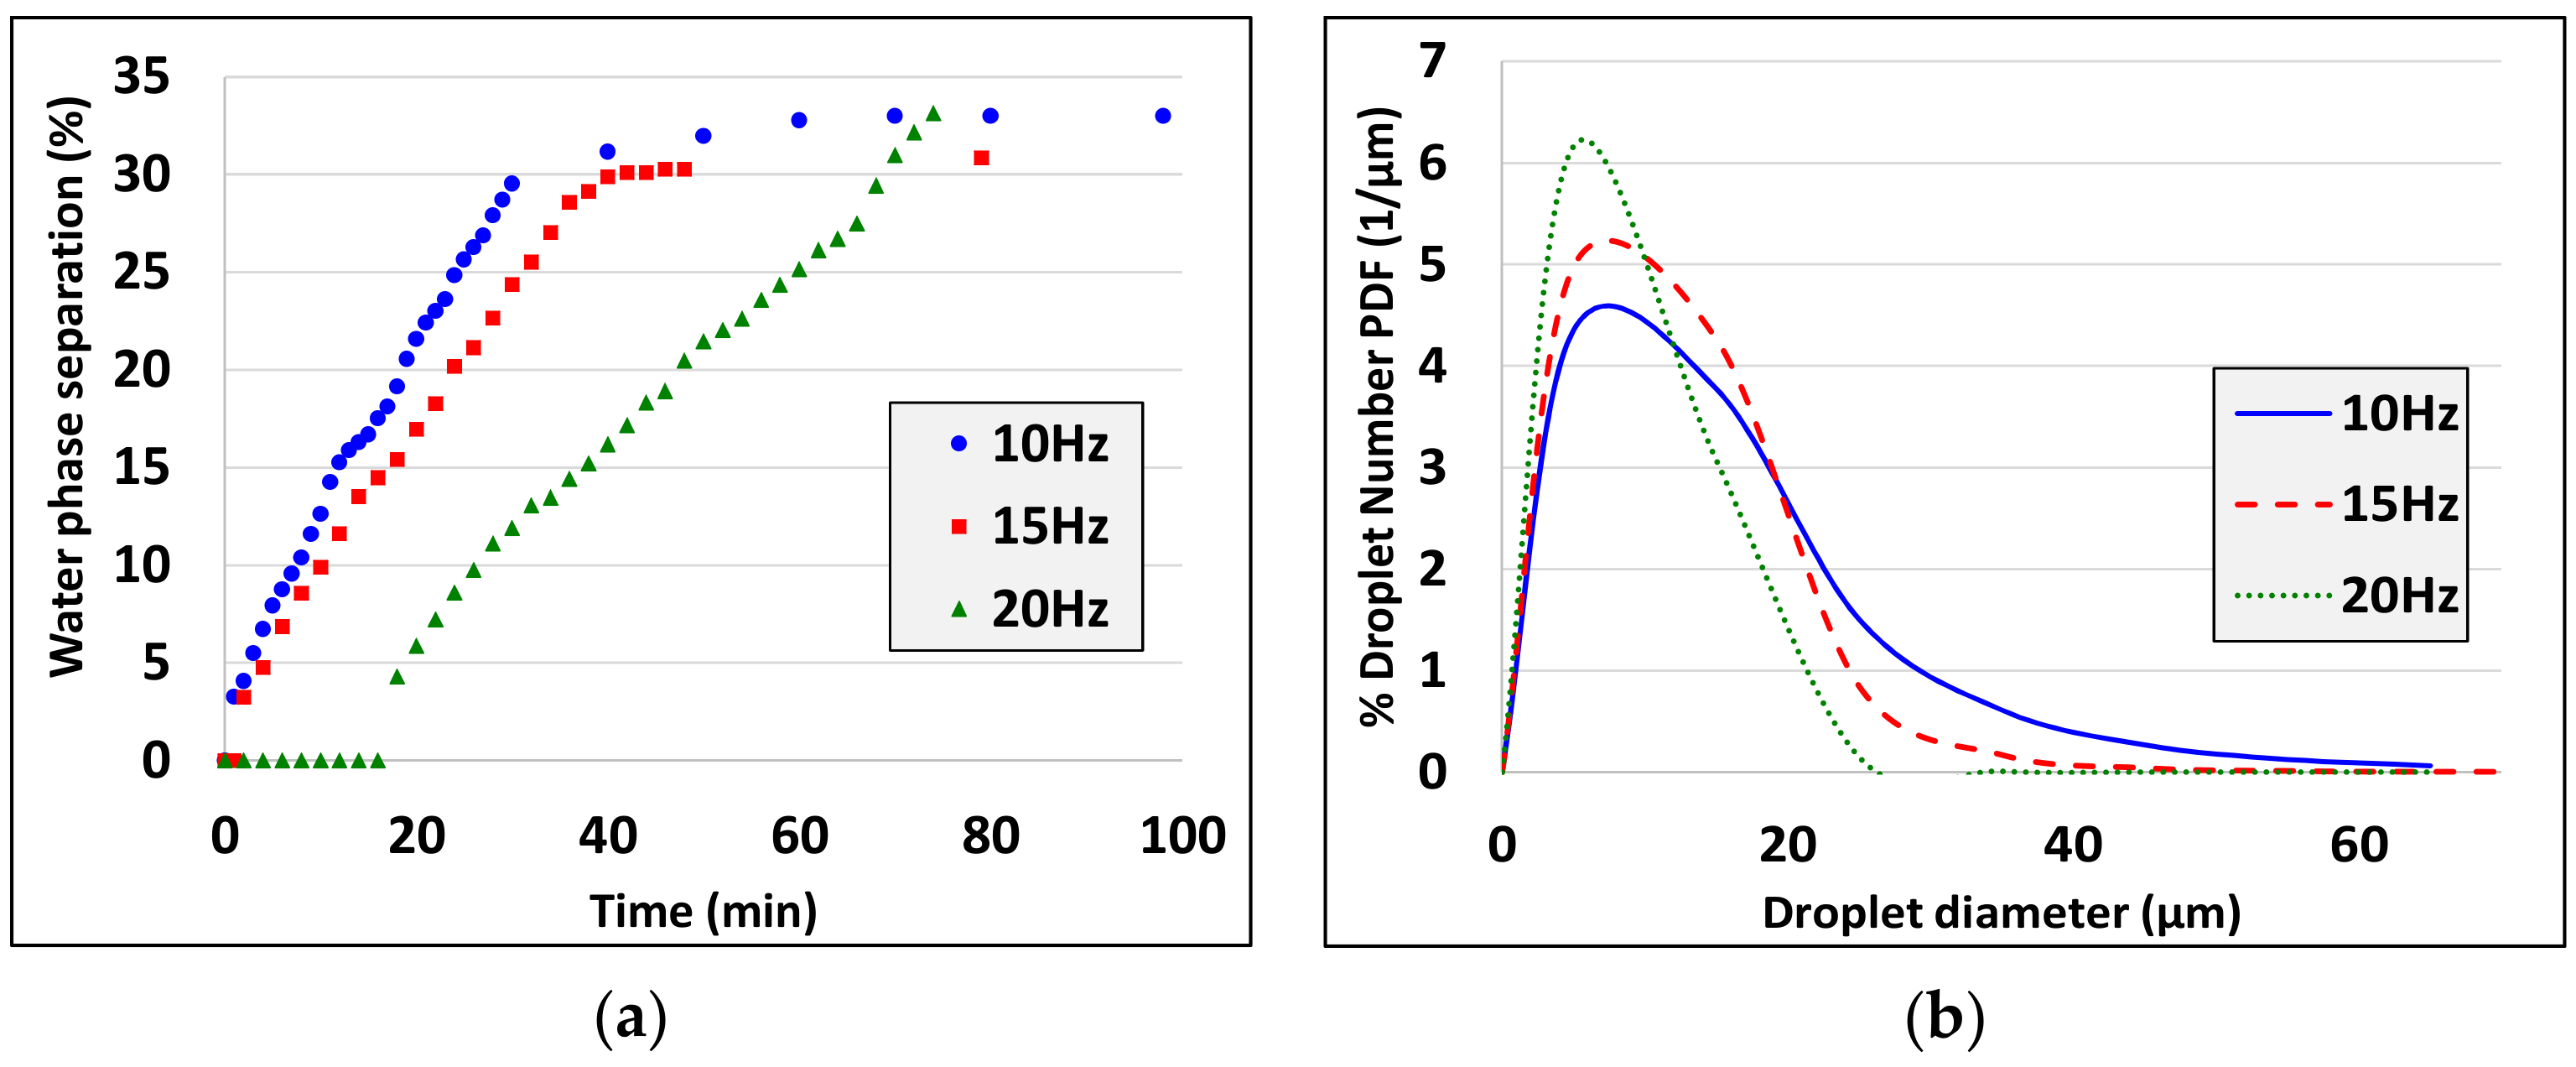
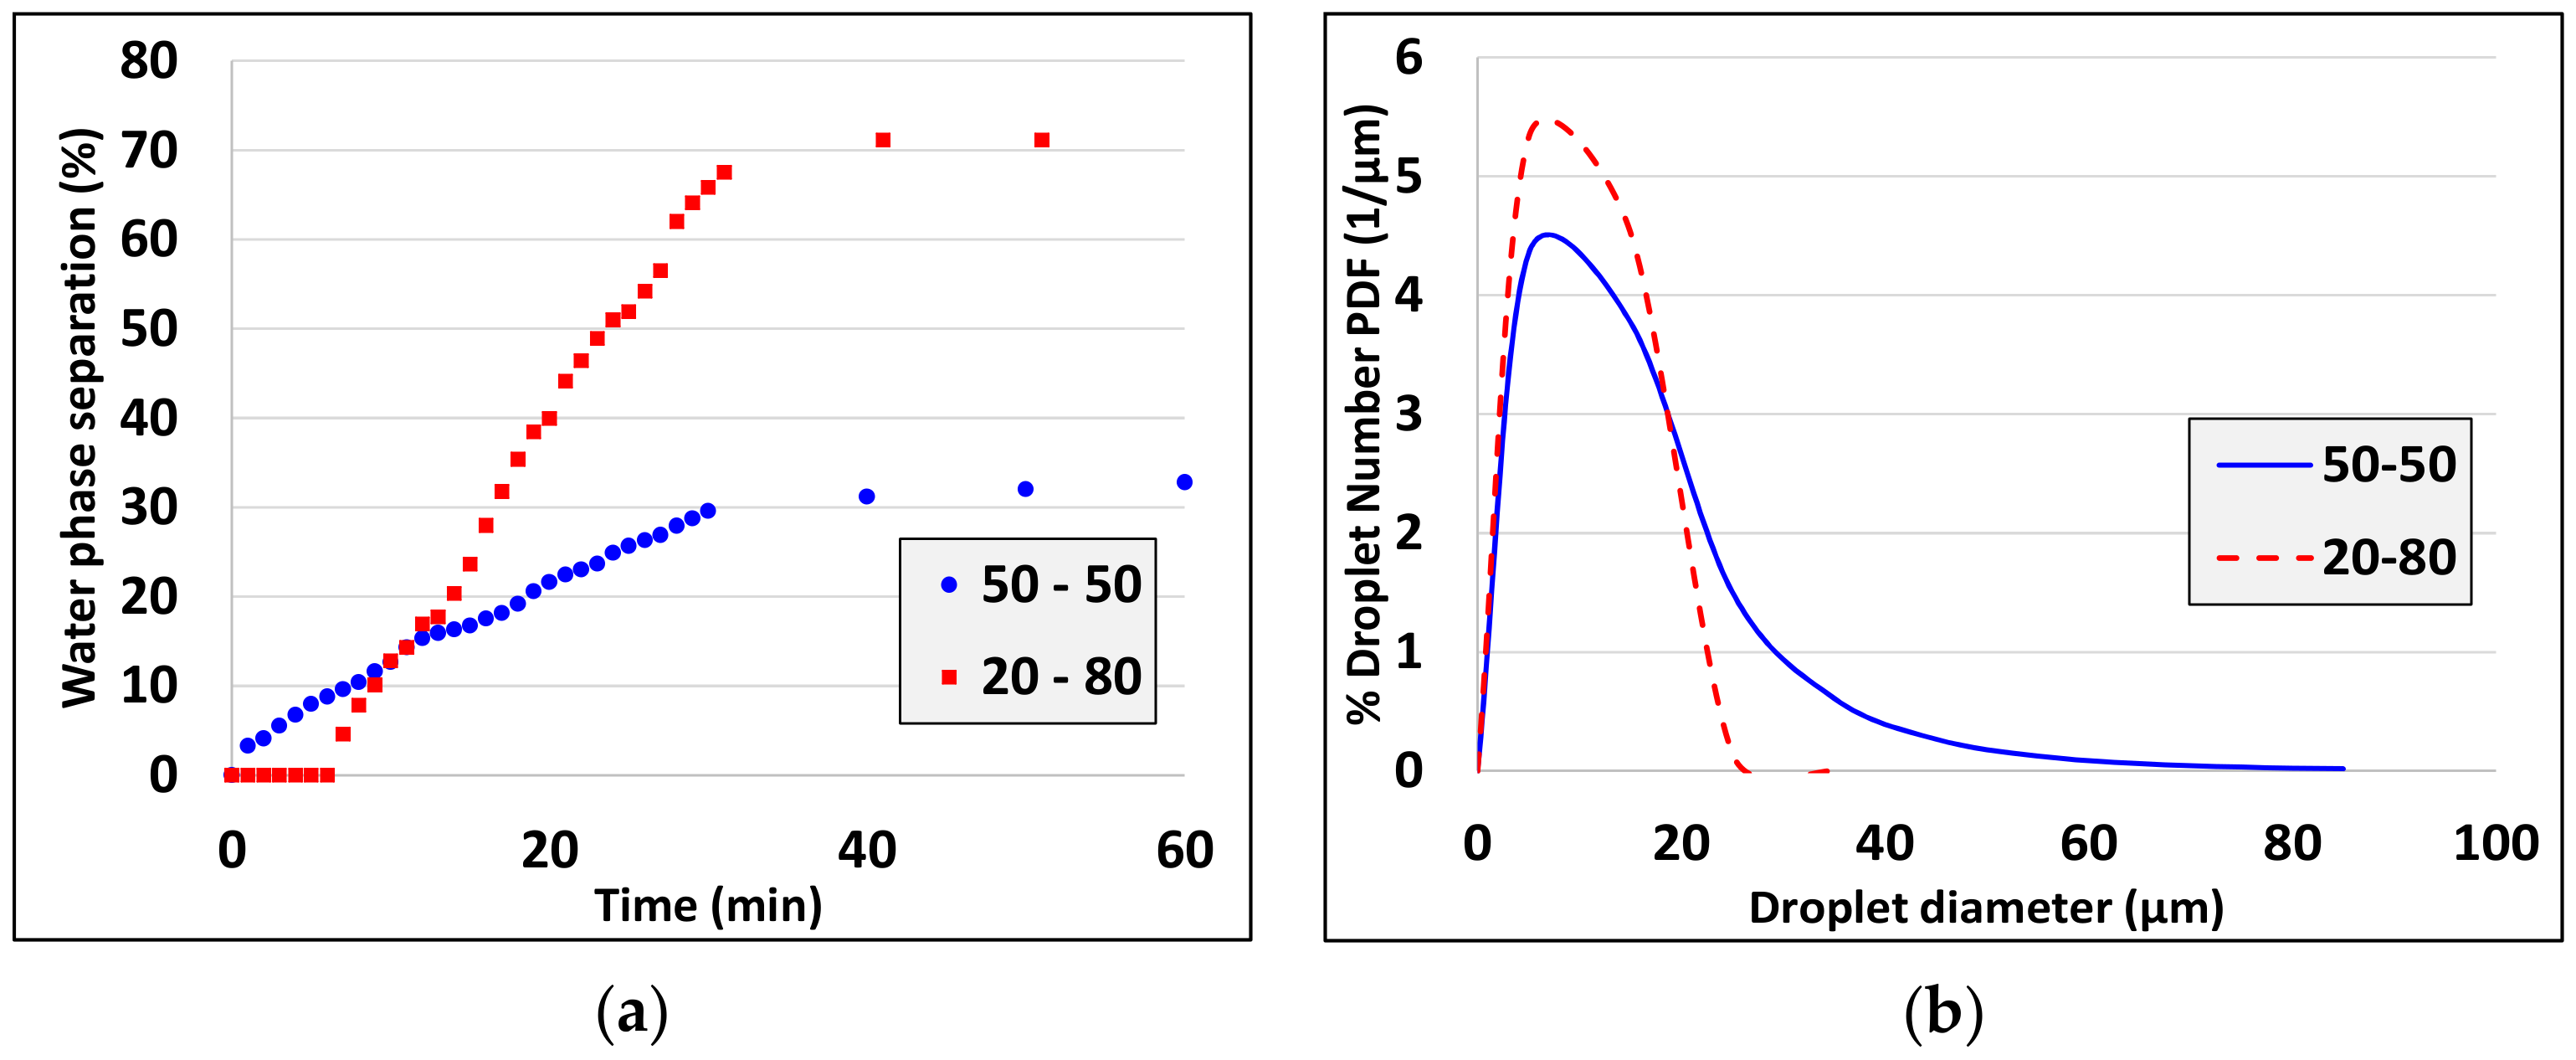
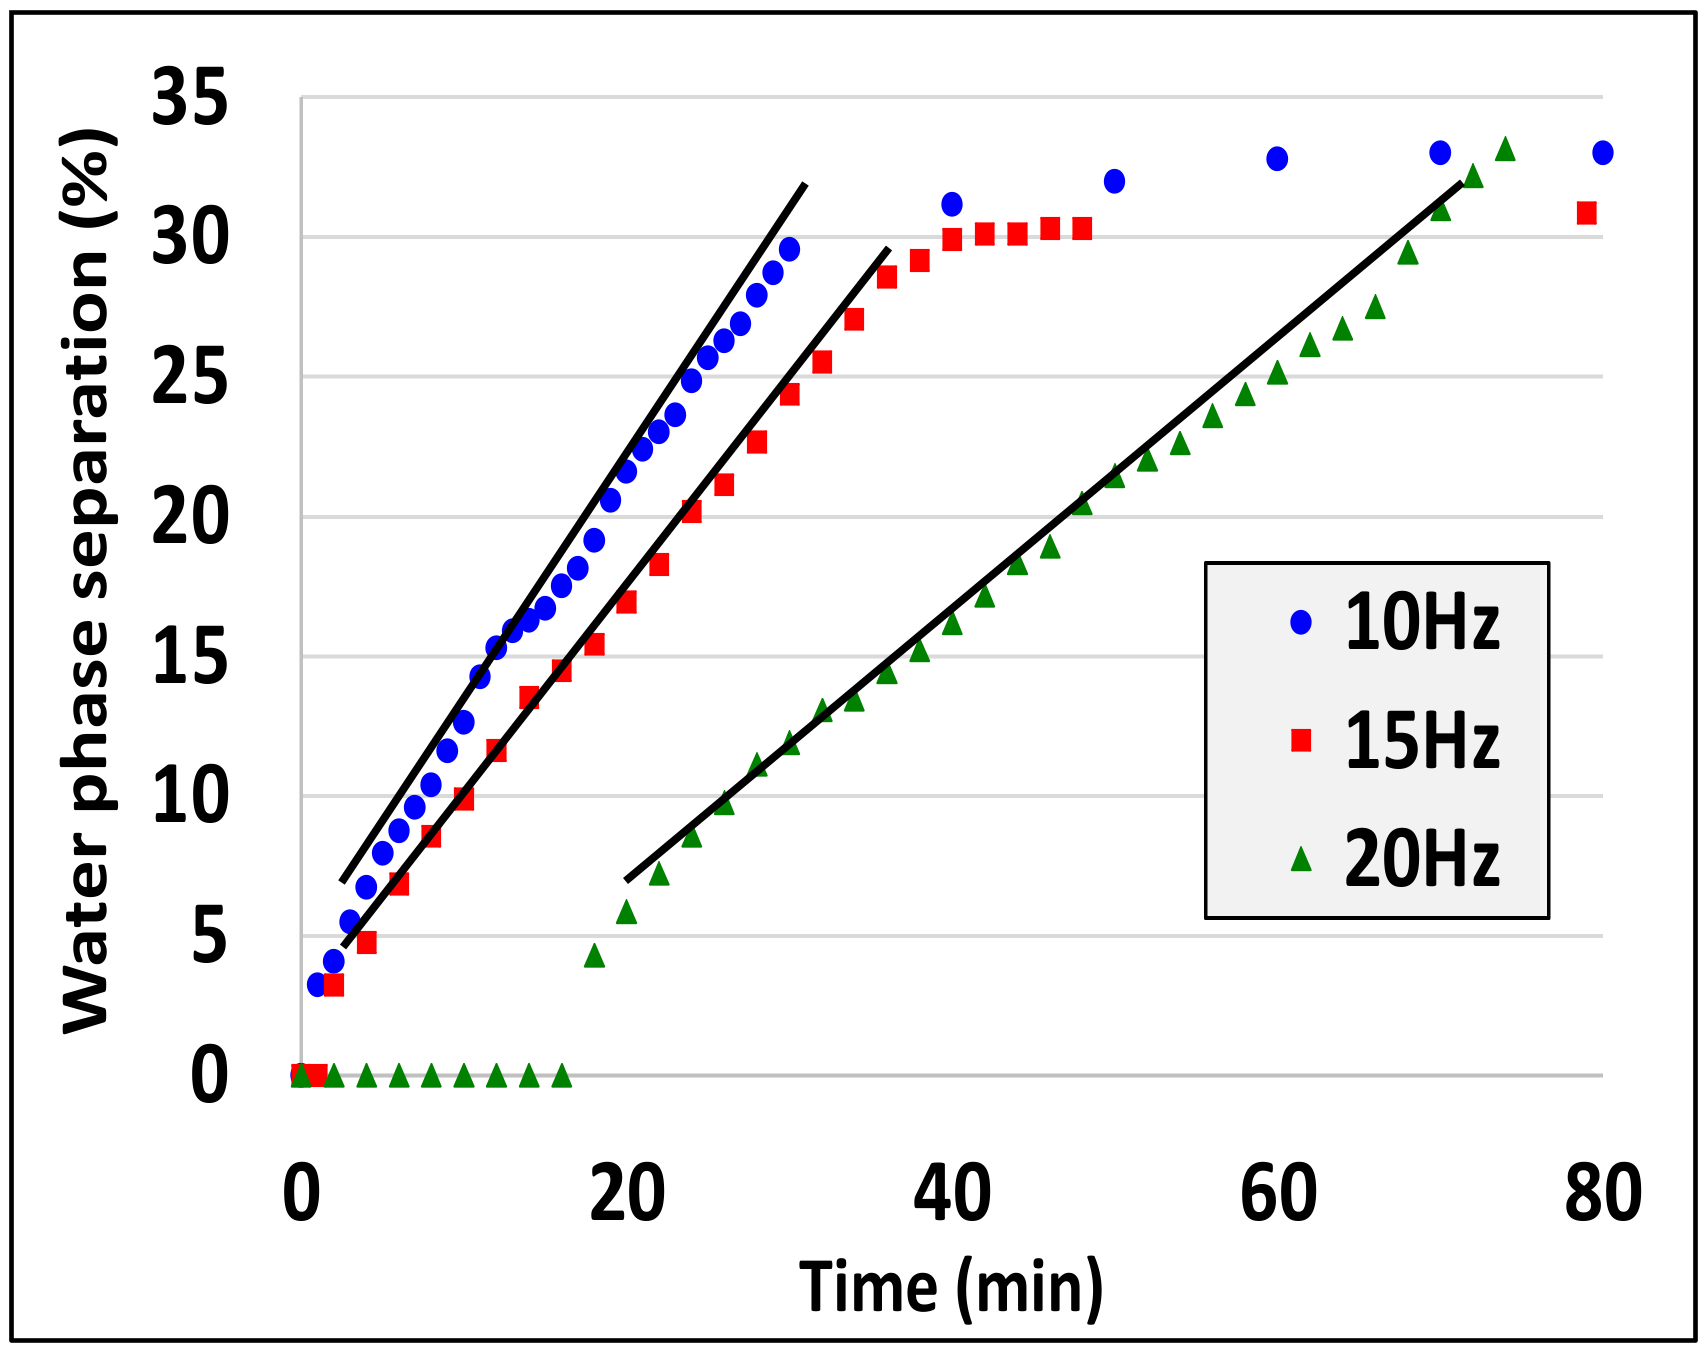
3. Experimental Results

This section presents the effect of emulsification parameters and composition on emulsions stability and in particular on its droplet size distribution and phases separation evolution. It is expected that in an emulsion (of a given oil to water ratio) with smaller droplets (more stable) the water phase separates slower than in an emulsion with larger droplets (less stable) [28]. It is worthy to mention that during water phase separation there is no sharp interface between the creamy phase (more oil) from the aqueous phase (more water), indicative of a broad droplet size distribution in the emulsion. In fact, the aqueous phase is everywhere turbid, although less and less with time. As already said, both phases are emulsions but their oil to water fraction differs. Despite the not sharp interface, it is still possible to determine the position of the boundary with the highest contrast between the two phases. The position of this boundary is denoted henceforth, e.g., in the figures, as the percentage of water phase separation. The water phase separation in the vertical axis of the Figure 5, Figure 6, Figure 7, Figure 8, Figure 9, Figure 10, Figure 11, Figure 12, Figure 13 and Figure 14a refers to the volume (or, equivalently, column height) percentage of the aqueous rich phase (the emulsion at the bottom part of the tube having the smaller oil proportion) with respect to the whole liquid volume (or column height). As far as the droplet size distribution is concerned, graphs of the % droplet number probability density function (PDF) versus droplet diameter are constructed. It is noted that PDF is a density function, it has inverse length units and it has to be integrated among two droplet sizes to give the percentage of the droplets having size between the particular values. The measured PDF is approximated by a log normal function. The following curve is fitted to the data:
PDF ( d ) = 100 2 π σ 1 d exp ( 1 2 σ ln 2 ( d d * ) )
where d is the droplet diameter and σ and d* are the fitting parameters. The log-normal approximation appears in the following experimental results when it represents accurately the data. Otherwise, the original results appear in the figure. In particular the droplet size distributions of the experiments 5, 7, and 16, (Table 1 and Table 2) cannot be reasonably fitted by log-normal distributions. Taking the above into consideration the original distribution for these cases is presented.
Figure 5 presents indicative results of repeatability check. It is apparent that the water phase separates in both cases at similar rates; a fast rate initially until t = 30 min up to 32% of separation being followed by a very slow rate there after (almost a plateau in the plotted time frame, Figure 5a). It must be noted that in the occasion of a very unstable emulsion the two phases (oil and water) would separate completely to reach the initial phase proportion: 50% water 50% oil. The plateau in Figure 5a does not reach 50%, as it is the initial proportion of oil and water, because at the examined time scale no full phases separation has occurred. As it is seen, only about 32% of the water phase has separated in the examined 80 min and there is another 18% remaining between oil droplets in the creamy phase. It must be also stressed that when mentioning water phase separation, this refers to the separation between the phase with the smallest oil proportion (water phase) and the phase with the highest oil proportion. It does not refer to pure oil and water. In addition, in all the examined cases no continuous layer of oil is observed at the top of the liquid column. This is evidence that the phenomenon of coalescence between oil droplets is absent. Small differences between the two runs may be attributed to the experimental uncertainty to identify the interface position between the creamy phase and the water phase as explained above. The size of oil droplets (Figure 5b) ranges from ~2.78 to ~60 μm in both repetitions. The number average diameter is 14.4 μm and 16.2 μm for the first and second repetition, respectively. In this way it is confirmed that there is a correspondence between repeatability of separation behavior and repeatability of droplet size distributions. The triplicate experiments mentioned in the text are only for the separation behavior. The separation velocity (slope of the fitting line in the phase separation curves) does not differ more than 5% among the triplicate experiments. The particular run with the velocity in between the other two runs is selected to be shown. This approach is preferred against artificially averaging the data. Taking all the above into account, repeatability is considered satisfactory.
Experimental results obtained with Piston 1 are presented first. The influence of SDS concentration is demonstrated in Figure 6. It is noticed that separation of the water phase (Figure 6a) in the 0.5 CMC emulsion is observed directly after the end of pulsation (t = 0min), in contrast to the 1 CMC emulsion in which phase separation is initially observed three minutes later (t = 3 min). In the 0.5 CMC emulsion the initial fast separation takes place faster than in the 1 CMC emulsion and reaches a plateau at t = 10 min, whereas in the 1 CMC emulsion the initial fast separation reaches a plateau at t = 30 min. The size range of droplets (Figure 6b) of the 0.5 CMC emulsion is ~1.7-100 μm with a number average diameter of 23.3 μm, whereas in the 1 CMC emulsion it is ~1.7-60 μm with a number average diameter of 13.5 μm. All the above manifest that in the examined range of concentrations the 1 CMC emulsion is more stable than the 0.5 CMC emulsion.
The next examined parameter is the nominal emulsification time tn. Three different emulsification times are employed, 0.5, 2, and 10 min, and the results are presented in Figure 7. The separation (Figure 7a) is fast for emulsions with lower tn, but slower for emulsions with higher tn. In particular, for the emulsions with 0.5, 2, and 10 min emulsification time, separation is observed to begin at t = 0, 3, 20 min and reach a plateau at t = 20, 30, 60 min, respectively. This is in agreement with the observed droplet size distributions of the generated emulsions (Figure 7b); the size range is ~1.7–38, ~1.7–45, and ~1.7–100 μm and the number average diameter is 16.2, 13.5, and 8.1 μm for the three emulsions, respectively. Therefore, in the examined range of emulsification times the longer the emulsification time the more stable the produced emulsion.
The effect of stroke (pulsation) frequency on water phase separation and droplet size distribution of the produced emulsions is examined next. Two stroke frequencies are compared, 5 and 10 Hz, for emulsions produced with emulsification time of 0.5 min (Figure 8) and 2 min (Figure 9). For both emulsification times, the water phase separation (Figure 8a and Figure 9a), when a 5 Hz frequency is used, reaches a plateau almost right after the end of the emulsification process (t = 0 min). On the contrary, for emulsions produced with 10 Hz stroke frequency, separation reaches a plateau at about t = 10 min. Also, the droplet size (Figure 8b and Figure 9b) differs significantly between the emulsions produced with 5 and 10 Hz stroke frequency. The droplet size spans the range ~1.7–50 μm for the 5 Hz emulsion and ~0.82–150 μm for the 10 Hz emulsion in both occasions. The number average diameter is 45 μm and 14.6 μm for the 5 Hz and 10 Hz emulsions of Figure 8. The number average diameter is 39.4 μm and 10.9 μm for the 5 Hz and 10 Hz emulsion of Figure 9. Thus, in the examined range of stroke frequencies as stroke frequency increases the stability of the produced emulsions increases too.
The effect of surfactant type is examined next using Piston 1 for emulsification. The water phase separation and the droplet size distribution are presented in Figure 10. The water phase separates faster for the SDS emulsion than the Ethylan 1008 emulsion (Figure 10a). Separation starts at t = 0 min for both type of surfactants and reaches a plateau at t = 10 min and t = 20 min for SDS and Ethylan 1008, respectively. In line with the above, the droplet size range is ~1.7-65 μm (number average diameter 23.3 μm) and ~1.7-100 μm, (number average diameter 15.4 μm) for the SDS and Ethylan 1008 emulsion, respectively (Figure 10b). All in all, Ethylan1008 emulsions are more stable than SDS emulsions at the examined conditions.
In the following, experimental results obtained using Piston 2 for emulsification are presented. The effect of SDS concentration is displayed in Figure 11. As the concentration of SDS increases the separation of the water phase progresses faster (Figure 11a). Contrary to what is observed for the emulsions produced using Piston 1 (Figure 6a), for the emulsions produced using Piston 2 the water separation does not reach a plateau in the examined range of time. This is because water separation occurs slower in emulsions produced using Piston 2. For all three surfactant concentrations, the droplet size range is ~2.78–60 μm (Figure 11b). Nevertheless, the number average diameter decreases as the concentration of the surfactant increases. In particular, the number average diameter is 17.3, 14.4, and 11.3 μm for the 0.5 CMC, 1 CMC, and 10 CMC emulsion, respectively. Comparison with Figure 6b shows that emulsions produced using Piston 2 have smaller size droplets than those produced using Piston 1 and this justifies the observation that water separates slower in the Piston 2 emulsions.
The next examined parameter is the nominal emulsification time. Two different emulsification times are tested, namely 0.25 and 2 min, and the results are presented in Figure 12. As emulsification time increases water separation occurs slower in the produced emulsions (Figure 12a). This is qualitatively in line with the emulsions produced using Piston 1 (Figure 7a). It seems that there is a significant difference between them. For the emulsion with longer emulsification time (tn = 2 min) the separation is initially observed at t = 0 min and reaches a plateau at approximately t = 35 min. This is in accordance with the smaller droplet sizes (Figure 12b) of this emulsion. The droplet size range is ~2.78–60 μm (number average diameter 14.4 μm) and ~2.78–150 μm (number average diameter 29.2 μm) for the 2 and 0.25 min emulsion, respectively. Therefore, alike with Piston 1, in the examined range of emulsification times, the produced emulsion is more stable as the emulsification time increases.
The effect of stroke frequency on emulsion characteristics produced with Piston 2 is presented in Figure 13. In the examined range of frequencies, as the stroke frequency increases water separation is slower and droplet sizes are a bit smaller. This is in line with the observations for Piston 1 in Figure 9 although the surfactant concentration and the ratio of oil to water are different there. So, as the stroke frequency increases the produced emulsion is more stable.
Finally, the effect of oil to water ratio φ is examined using Piston 2. The droplet size distribution and the water phase separation rate are presented in Figure 14. Water phase separation in the 50:50 emulsion is initially observed at t = 3 min and reaches a plateau at t = 35 min (Figure 14a). Water separation in the 0.2 emulsion is initially observed at t = 7 min and reaches a plateau at t = 38 min. Comparing the slopes of the two data sets versus time indicates that the separation takes place slower in the emulsion with 50:50 oil to water ratio. This implies that the droplets size should be smaller in the 0.5 emulsion than in the emulsion with 0.2 oil fraction. However, the range of droplet size (Figure 14b) is ~2.78–60 μm (number average diameter 14.4 μm) and ~2.78–25 μm (number average diameter 10.1 μm) for the 0.5 and 0.2 emulsion, respectively. This inconsistency between droplet sizes and water separation velocities are analyzed in a following section.

4. Characterization of Flow Field in the New Emulsification Device

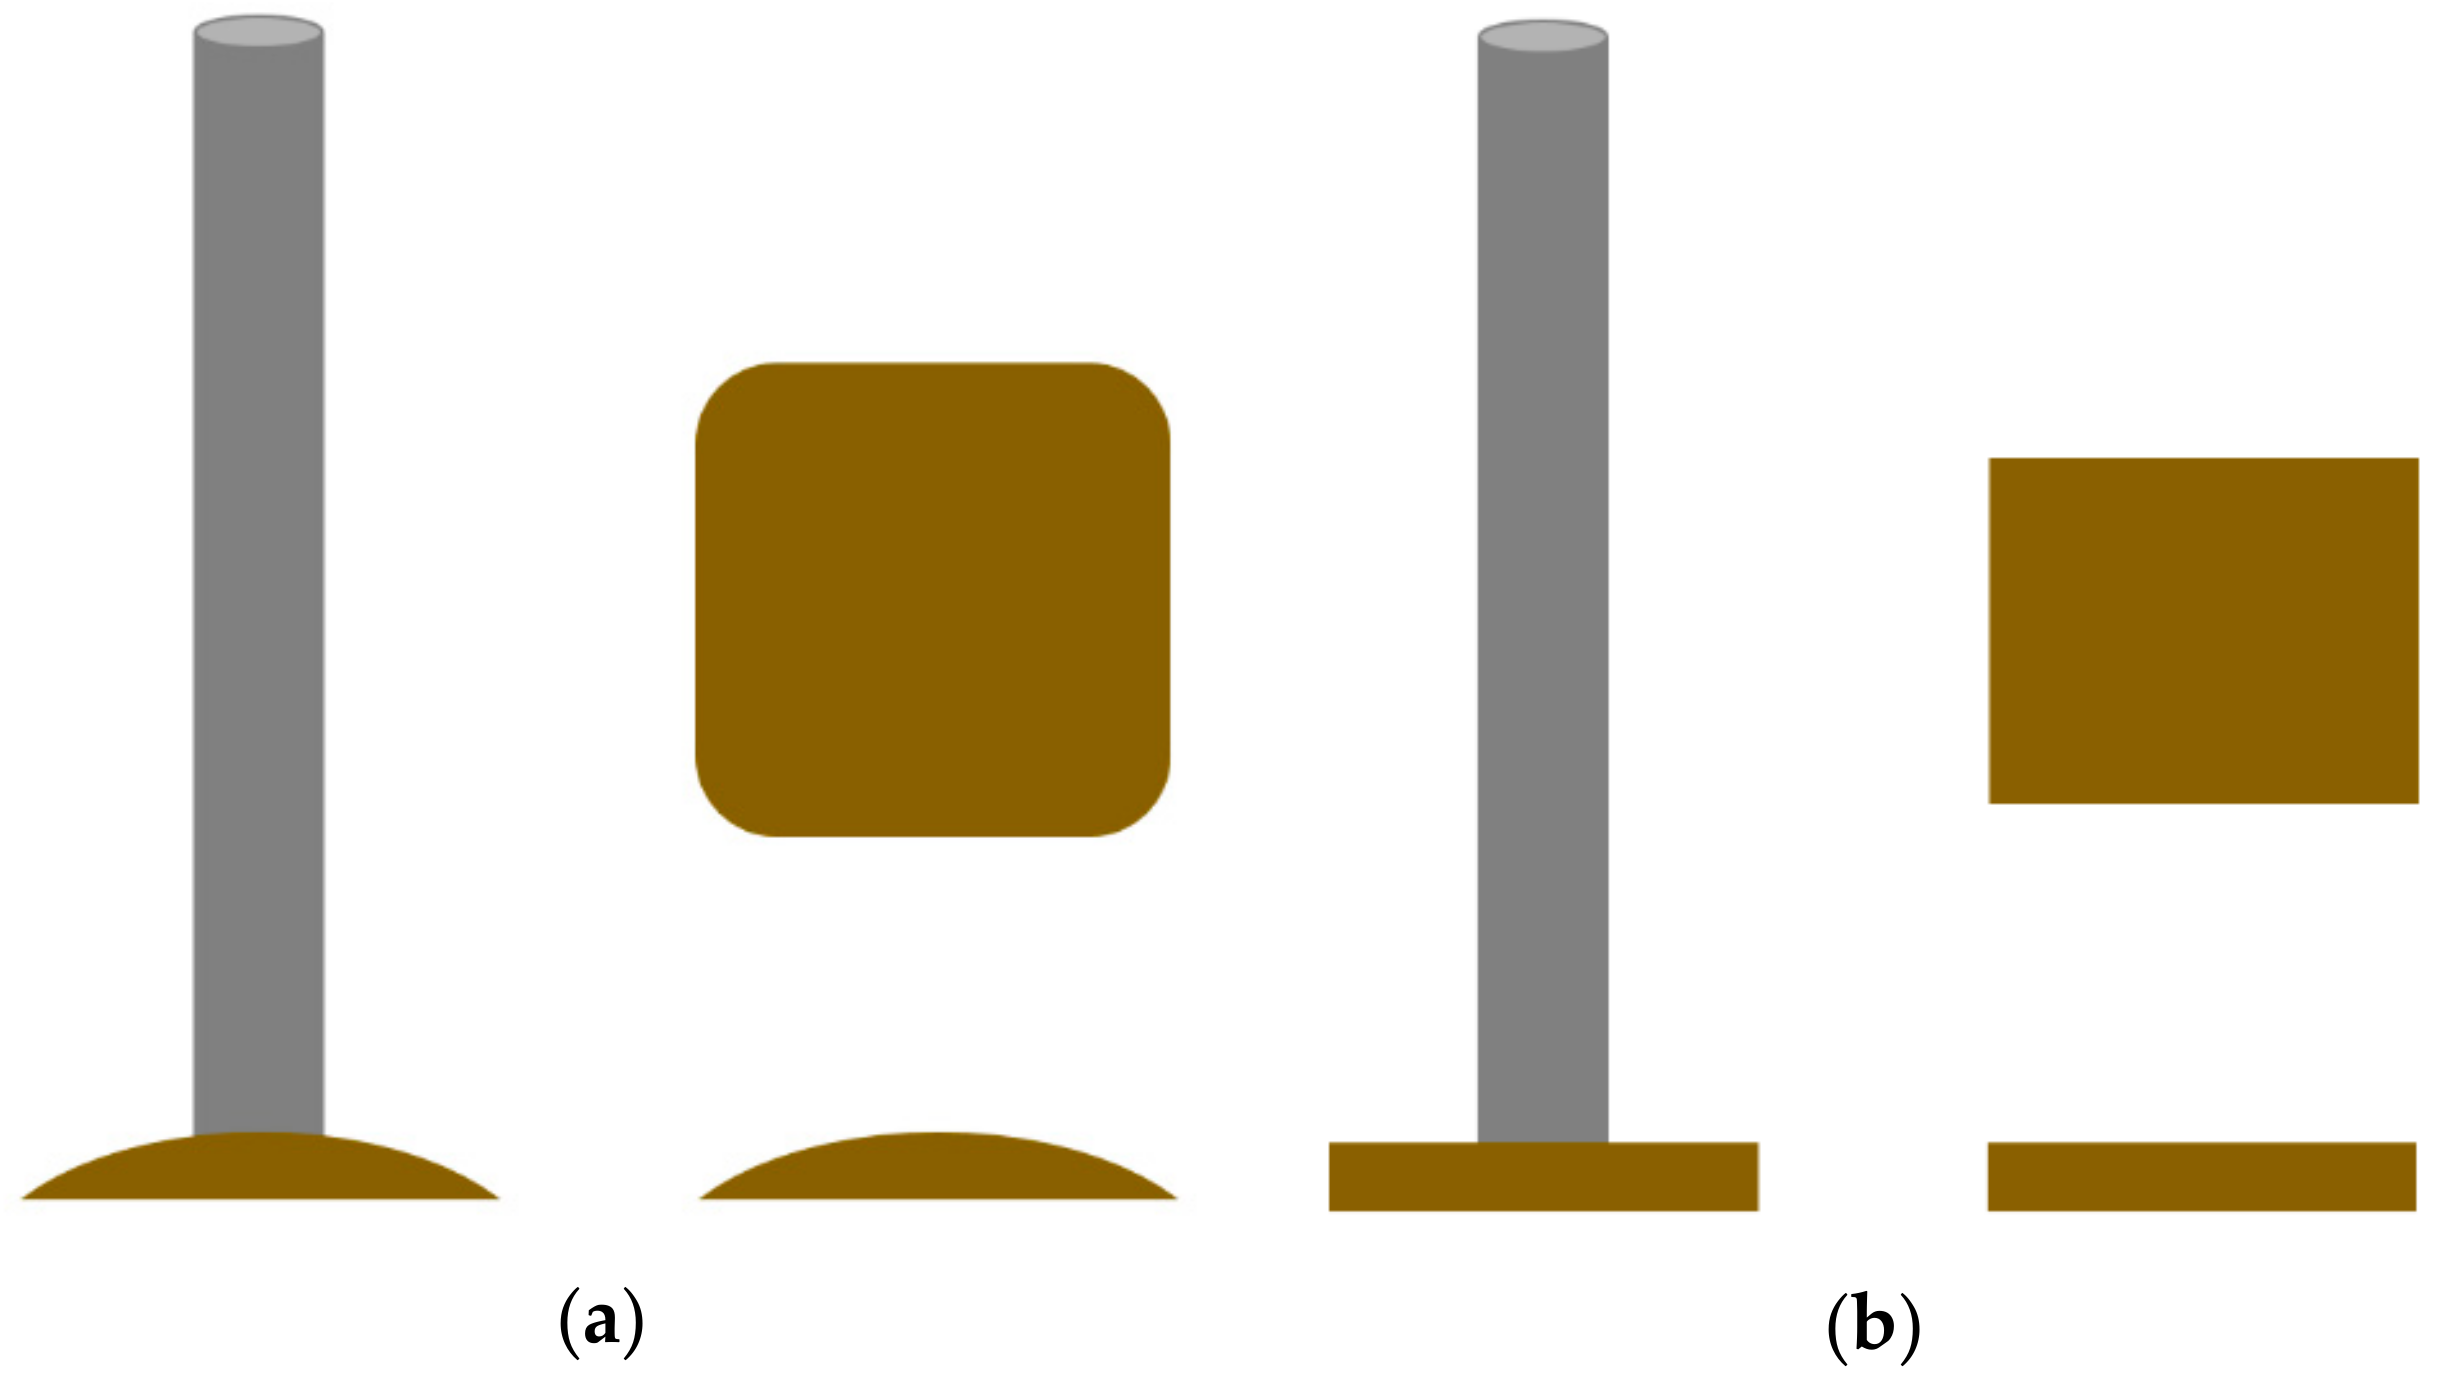
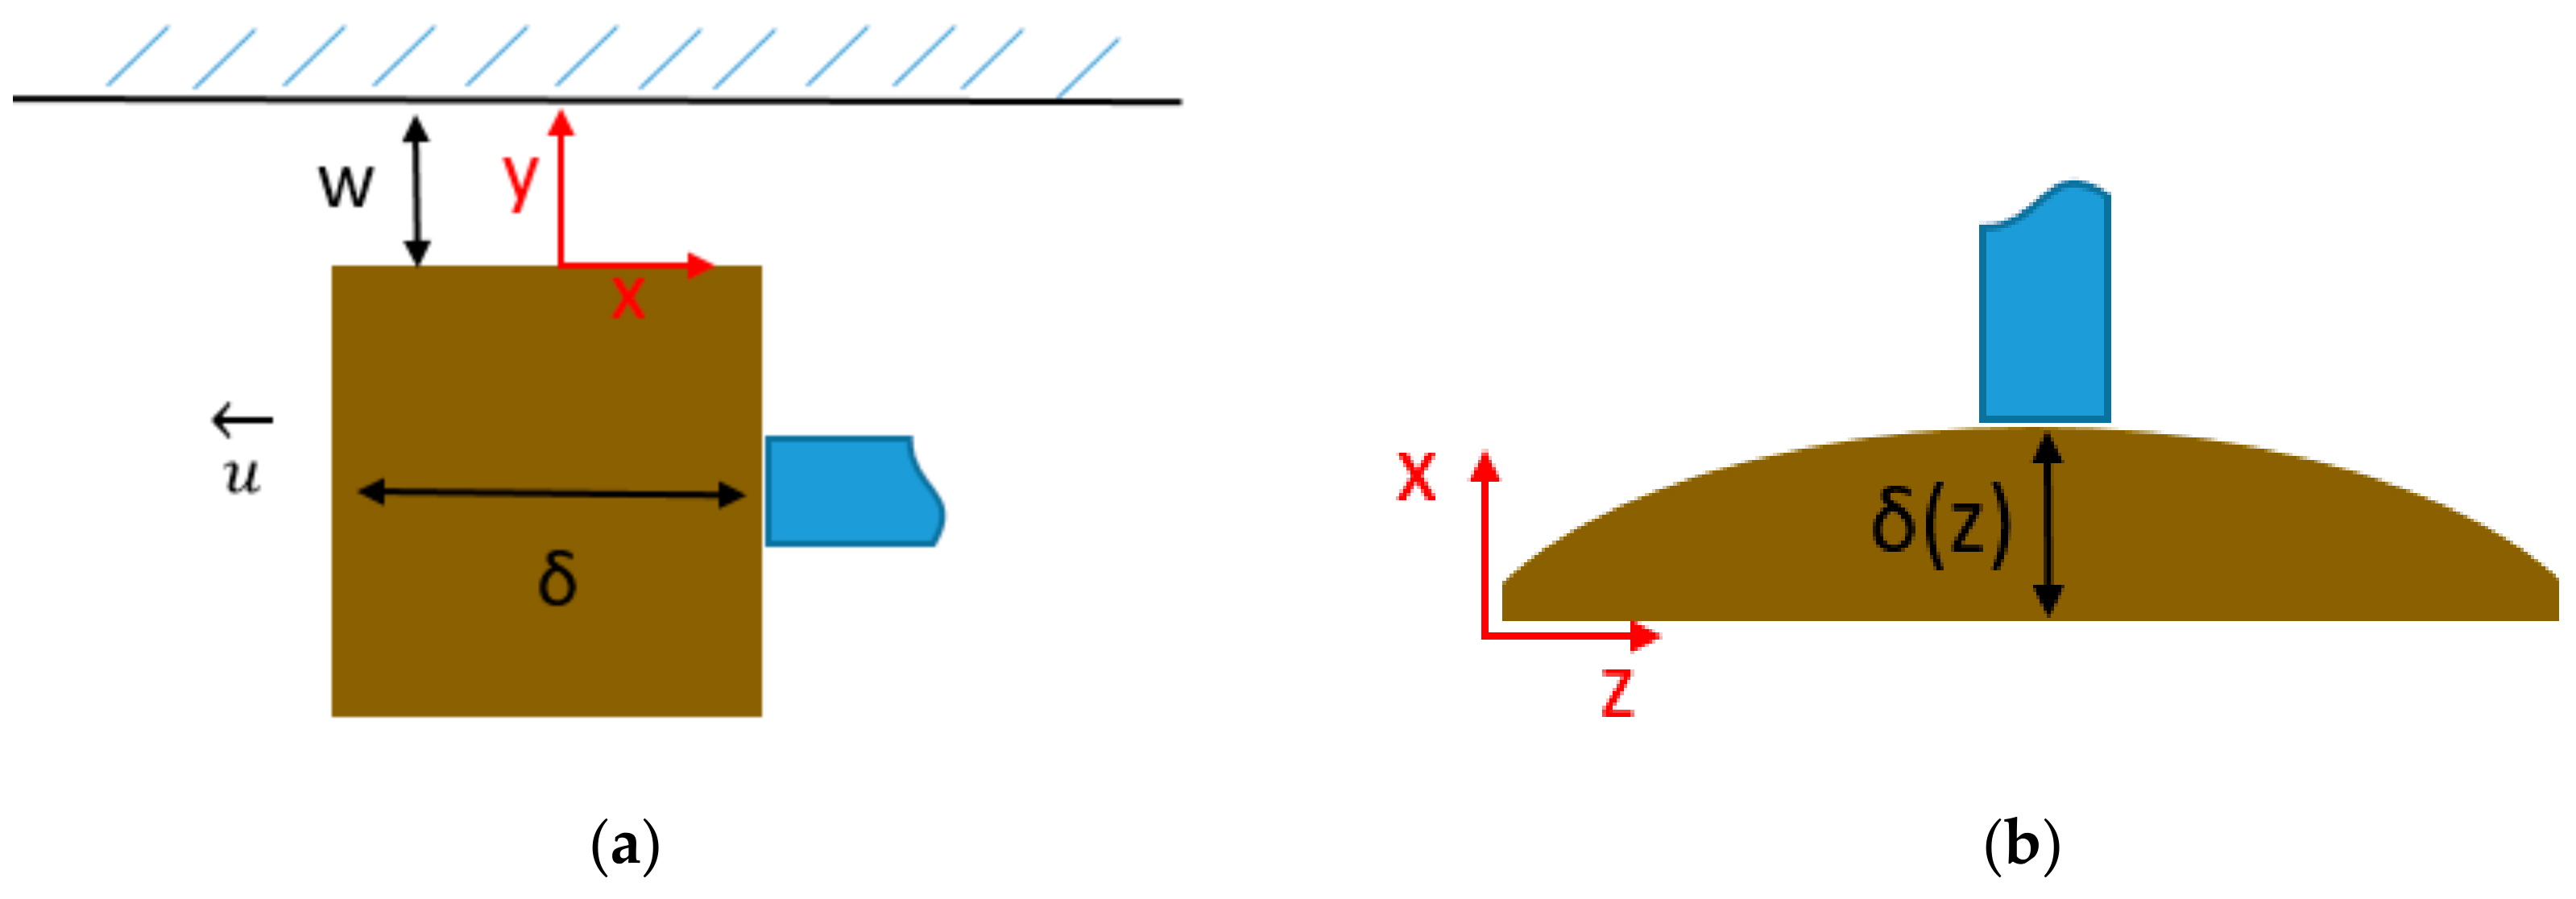
4.1. Piston Plate of Uniform Height

The emulsification device is composed of a piston moving up and down inside a test cell with high frequency. For a piston plate of uniform height, the narrow gap between the plate and the walls of the test cell has correspondingly uniform height. The flow field in the gap is transient and quite complex but here an attempt is made to simplify it by decomposition into its constituents. The analysis here starts from a gap of uniform height (parallel to the cell wall) whereas the thickness of the gap, that is the distance between the plate and the wall, is constant. This allows the problem to become two-dimensional. The parameters and the coordinate systems employed for the 2D case analysis appears in Figure 15a. The gap thickness is denoted as w and the plate height as δ. Let us say that the (constant) velocity of the piston is U (computed as 2fD where f is the oscillation frequency and 2D is the running distance during a single oscillation). An important parameter is the ratio of cross-sectional areas of the cell to that of the gap, denoted as s. It is evident that the location of highest shear rates (thus the most important in the context of emulsification) is the one inside the gap so the focus is there. As a first order approximation a shear flow is assumed in the gap. However, only detailed CFD simulations can completely reveal the detailed flow in the device. At a first approximation the inertia and acceleration contributions are neglected and the flow is assumed to be laminar in the gap. Assuming a coordination system that moves with the piston the governing equation for the flow field in the gap takes the form:
μ 2 u y 2 = dp dx
with boundary conditions u = 0 for y = 0 (plate wall) and u = U for y = w (test cell wall). The most important issue is that the motion of the piston in the restricted space of the cell forces the liquid to pass through the gap with a flow rate (two dimensional) q = w U s which is imposed by the continuity equation. For clarity of presentation let us denote (dp/dx)/μ as K. Integrating twice Equation (2) with respect to y and applying boundary conditions leads to the following velocity profile across the gap:
u = K ( y 2 wy ) + Uy / w
The total flow rate through the gap is q = 0 w udy . Replacing the velocity profile and the relation for q in the integral leads after some algebra to the following equations for the pressure drop and for the velocity profile:
dp dx = 6 U μ w 2 ( s 1 / 2 )
u / U = 6 ( s 1 / 2 ) ( y w y w 2 ) + y w
The above profile is a combination of Couette and Poiseulle flow profiles. Interestingly enough, for ratio s much larger than unity (as is the case for the new device) the Poiseulle mode dominates and characterizes the flow field leading to much larger shear rates than those corresponding to the Couette mode. The relevant Reynolds number is s U w/v (where v is the kinematic viscosity of the droplet dispersion) for the present experiments is below 2000, in particular up to 750, making the laminar flow assumption reasonable.
Having found the velocity profile in the gap the next step is to compute the average shear rate. It is well understood that the meaningful average for such a computation is the mixing-cup one i.e., the local shear rate must be weighted with respect to the local flow rate. The mixing-cup average shear rate, G, is computed as follows:
G = 1 Uws 0 w u du dy dy
It is noted that for droplets of size comparable to the gap thickness (let us say with radius r) the integration limits should change from r to w-r. However here the interest is at the final result of the emulsification process when the droplet size is much smaller than the gap thickness so its influence on the relevant shear rate can be ignored.
Replacing the velocity profile from Equation (5) in Equation (6) and introducing the new dimensionless integration variable θ = y/w leads to the following equation:
G = U ws 0 1 [ 6 ( θ θ 2 ) ( s 1 / 2 ) + θ ] 6 ( s 1 / 2 ) ( 1 2 θ ) + 1 d θ
The direct computation of the above integral is not straightforward because of the appearance of the absolute value. In the particular case of s >> 1, the integral can be computed by splitting to regions with θ smaller and larger than θ = 0.5. The result is G = 2.25 U s/w.
In the general case, the integral is computed numerically to give values of G for several values of s. The following correlation is found to fit exactly the numerically computed data:
G = U ws 0 1 [ 6 ( θ θ 2 ) ( s 1 / 2 ) + θ ] 6 ( s 1 / 2 ) ( 1 2 θ ) + 1 d θ
The next question is for how long during the piston movement each liquid element undergoes the above shear rate. A simple calculation can be made by considering the average residence time in the gap. This time can be easily computed as τ = δ/(U s) for each time the piston moves in one direction along the test cell. A further analysis of the above relation can lead to the much more general result that relates the actual emulsification time to the nominal one (which is the time of device operation) and to the device geometry. The ratio of two times can be proven to be equal to the ratio of the liquid volume in the gap to the total liquid volume.

4.2. Piston Plate of Non-Uniform Height

Let us assume that the height of the piston is not uniform, but it has a distribution along the gap perimeter. Let us consider the piston side shape is described by a height function δ (z) with z being the direction along the gap perimeter, Figure 15b. A naive approximation is that the fluid enters uniformly to the gap so there is a single s value that leads to the result for shear rate and actual emulsification time derived in the previous section. The reality, however, is that the different positions along the gap perimeter exhibit different values of pressure drop and since the major contribution of pressure drop in the flow field arises in the gap region, the flow field is automatically adjusted in order to equalize the pressure in the z-direction. This is the so-called flow network model which has been used in the past to assess flow distribution inside monolith reactors [29]. The average value of s is denoted as S and it is as before the ratio of the cell to the gap cross-section. The difference here is that there is a distribution of s in the z direction (i.e., distribution of flow rate along gap perimeter). Integrating Equation (4) along the gap results in the following pressure drop z-profile:
Δ P ( z ) = 6 U μ w 2 ( s 1 / 2 ) δ
The requirement of uniform pressure drop in z direction renders necessary to consider s being a function of z. Some algebra yields that the probability distribution of s that leads to uniform in z pressure is:
s 1 / 2 S 1 / 2 = Z / δ P ( 1 / δ ) dz
where Z is the length of the gap perimeter. It is noted that the average value of s denoted as S is a purely geometrical parameter.
Equation (10) defines a distribution of s over z, i.e., s (z), and correspondingly a distribution of G and τ over z through the appropriate equations for G and τ. The exact way of elaborating this problem, taking into account the linearity of the breakage equations, is to solve an independent breakage problem for each z having its own value of shear rate G (z) and residence time τ (z). The results of these problems will be averaged over z in the cup-mixing sense which means weighting with respect to s/S.
A simplified analysis to find the effect of a non-uniform piston plate height on emulsification extent follows: at first the average residence time is examined. This time is the cup mixing average of local residence time over z. Averaging τ over z with weight factor s/S results in the following simple result for the mean residence time Tb in the device:
T b = δ ave US
where δave is the mean piston height. The above relation is a straightforward extension of the one for the uniform height case. It can be shown, based on this relation, that the equality between the ratios (i) of the liquid volume in the gap to the total liquid volume and (ii) of the actual to nominal emulsification time, still holds.
The next step is to find a representative value for the shear rate. It must be stressed that averaging independently the shear rate from the residence time can lead to quite misleading results because of the highly non-linear process dependence on them. Therefore, it is suggested that their product G τ (strain) is the parameter that better describes the degree of emulsification and it is more uniformly distributed than G and τ. We call B = G τ the deformation extent per pass through the gap which apparently is a single measure of the emulsification efficiency. The proper average of the deformation extent Bave is the cup-mixing one so:
B ave = 1 ZS P sG τ dz = 1 ZUS P G δ dz = 1 ZwS P ( 2.25 ( 0.72 1 s + 1 3 s 2 ) ) s δ dz
where
s = 1 / 2 + ( S 1 / 2 ) Z / δ P ( 1 / δ ) dz
The integration in Equation (12) must be performed numerically. However, a simple, yet informative, result arises for the practically important case of S >> 1. In that limit, the local B value is simply 2.25 δ/w. Equation (12) is transformed to:
B ave = 2.25 1 w Z P ( 1 / d ) dz = 2.25 δ ave w [ P ( δ ave / δ ) d ( z / Z ) ] 1 = 2.25 δ ave w F
The total deformation is given as Btot = Bave 2 f * (nominal emulsification time). The factor F computed from the above integral is a purely structural factor and depends only on the uniformity of height of the piston (and not on the actual dimensions etc.,). For uniform shape F = 1. As the non-uniformity increases F decreases. As an example, let us assume that the half-side of the piston has a trapezoidal shape with minimum height being a fraction ζ of the average one. In that case the computation gives:
F = 2 ( 1 ζ ) / ln ( 2 ζ 1 )
So, the simple relation (14) suggests that the emulsification extent increases as mean piston height increases, as gap thickness decreases and as piston height non-uniformity decreases.
Summarizing all the above development leads to the following results: The characteristic (real) emulsification time for a particular experiment and device is computed as Ta = (Vg/Vf) * (nominal emulsification time) where Vg is the volume of liquid in the gap and Vf is the total volume of liquid. The characteristic shear rate is computed as Gb = Btot/Ta = Bave 2 f Vf/Vg. It is noted that the above analysis holds in the limit of Vg << Vf, δ << D and uniform piston velocity. These requirements are reasonably fulfilled in the present experiments.

5. Discussion and Analysis of the Results

Let us first derive the structure of the functional dependence between the problem parameters and the measured results. As it has been described above the emulsification conditions (device used, pulsation frequency and nominal emulsification time) can be transformed to intrinsic characteristic parameters as the mean shear rate Gb and the actual emulsification time Ta. The possible phenomena occurring during emulsification are droplet coalescence and breakage. However, the existence of surfactant creates a barrier to coalescence. It is clear from the lack of oil separation in the creaming experiments that for the employed surfactant concentrations there is no coalescence (at least at the time scale of emulsification). It can be shown that this is not the case for smaller concentrations of surfactant. So, during the present emulsification experiments the only occurring phenomenon is droplet breakage.
The functional dependence between the number average droplet diameter dav and the emulsification parameters is dav = ψ (Gb, Ta, φ, cs) where φ is the oil volume fraction and cs is the surfactant concentration. The droplet size obviously decreases as Gb or Ta increases. It is well-known that as φ increases the emulsification efficiency decreases (may be due to the absorption of energy from the additional interfacial area) [30]. Finally, an increase of the surfactant concentration cs leads to the decrease of the droplet size. The effect of surfactant concentration is three-fold: (i) To increase emulsification efficiency through the reduction of interfacial tension of the oil-water system, (ii) to partially hinder the effect of (i) through interfacial elasticity [31], and (iii) to decrease emulsification efficiency by increasing the dispersed phase bulk viscosity. For the latter, it is known that bulk viscosity increase is less than 10% even for concentrations of 10 CMC. In addition it is known [32] that as the oil volume fraction increases the effect of the continuous phase viscosity on emulsification decreases. So for the purposes of the present work it can be safely ignored. Therefore, surfactant concentration affects droplet size upon emulsification through interfacial tension and interfacial elasticity. Their combination actually leads to an apparent surface tension [31].
The phase separation evolution curves showed before suggest that there is always a dominant separation (front motion) velocity that can be inferred from the main slope of the evolution curves. In some runs this is the exact uniform front velocity whereas in some other runs only the average front velocity. In any case, a characteristic velocity u can be derived from the separation curves. It is interesting that despite the relatively broad droplet size distribution, the phase separation front velocity is almost constant. Typical fitted straight lines to the separation data are shown in Figure 16. This velocity should be equal to the buoyancy-induced velocity of the dominant droplet size. It is noted that the employed surfactant concentrations renders the oil-water interface immobile so droplets can be treated as solid particles regarding the resistance to their motion. In addition, the effect of surfactant on dispersed phase viscosity can be ignored. Finally, the measured velocities and droplet sizes are so small that the Reynolds number is of the order of 0.1. Summarizing the above, it can be argued that the front velocity is related to the droplet diameter as [33]:
u = g d v 2 Δ ρ 18 μ ( 1 φ ) 5
where Δρ is the density difference between oil and water, g is the gravitational acceleration and μ is the water viscosity.
From the above relation the characteristic droplet size that corresponds to the separation curve can be determined. It is noted that a different symbol (dv) is used than for the number average droplet size estimated from imaging analysis (dav). The two parameters should coincide only for a fully monodisperse droplet size distribution. The dv is closer to a volumetric average since the front is determined from droplet volume and not from droplet number. Quantitative results of the present work appear in Table 3 and Table 4. In these tables, the first three parameters refer to calculated essential variables of emulsification (characteristic shear rate, actual emulsification time, surface tension. The two parameters values of the log-normal approximation of droplet diameter PDFs are presented in Table 5 and Table 6. The interfacial tension values for the dodecane water system with several SDS concentration are taken from Llammas et al. [22]. It is noted that according to the results presented and the above analysis, emulsions stability is related to both the number average diameter and the standard deviation of diameters (since these parameters determines dv).
As expected, in all cases the dv value is larger than the dav value. An extensive discussion on what should be the case can be found in Kostoglou et al. [33]. Even so, this is additional information on the droplet size distribution further to this acquired by image processing. The effect of emulsification parameters on the resulting droplet size can be clearly derived from Table 3 and Table 4. It is noted that the polydispersity index PI results from the number and volume average droplet diameters computed from droplet image analysis data. For the same Piston, while keeping constant the other parameters, the following parameter dependence is registered:
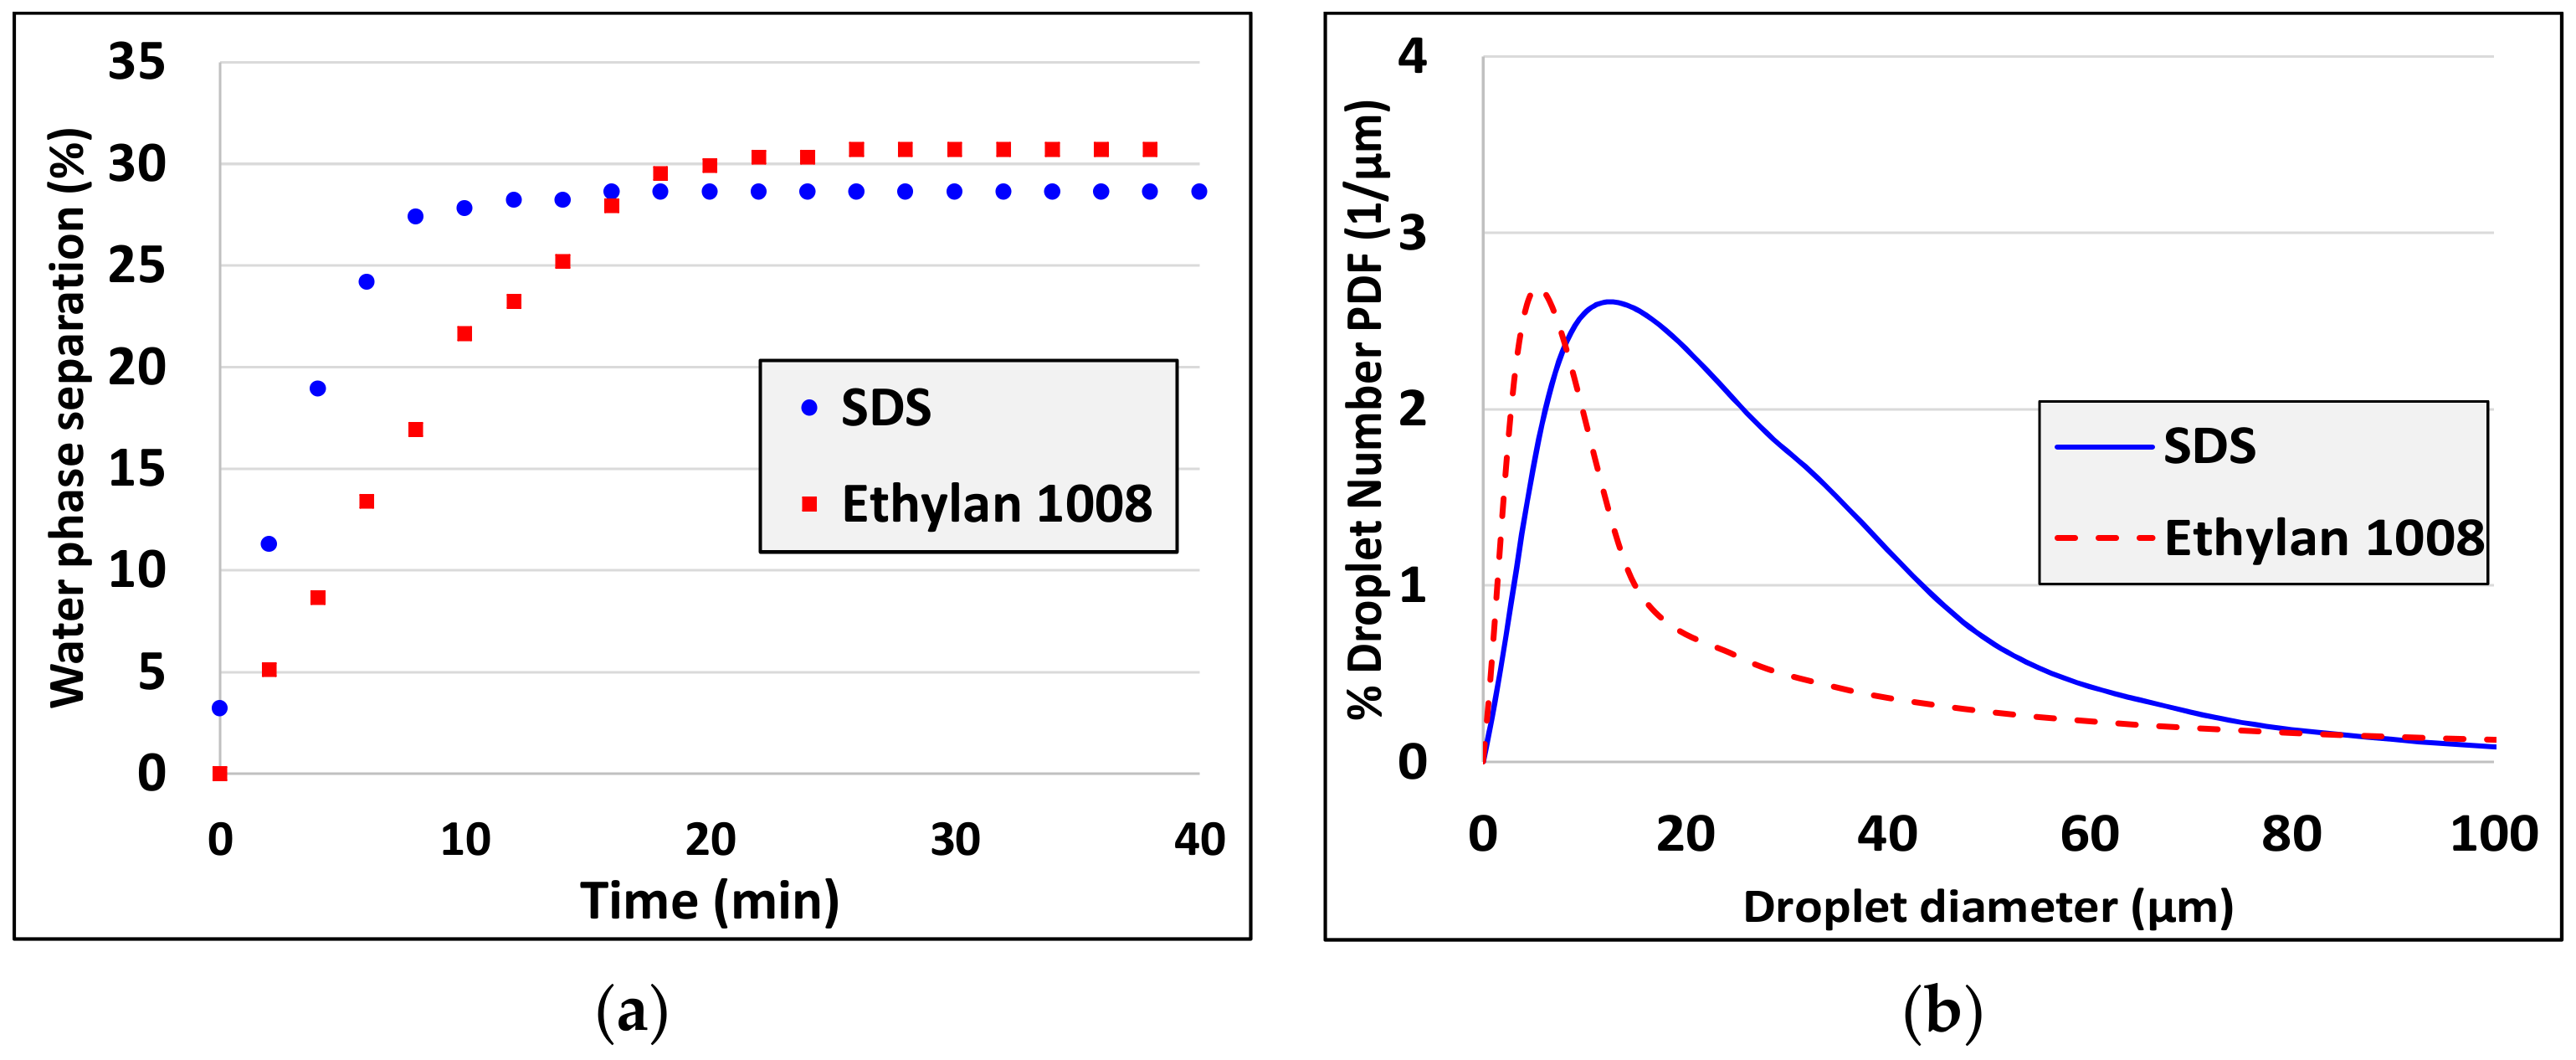
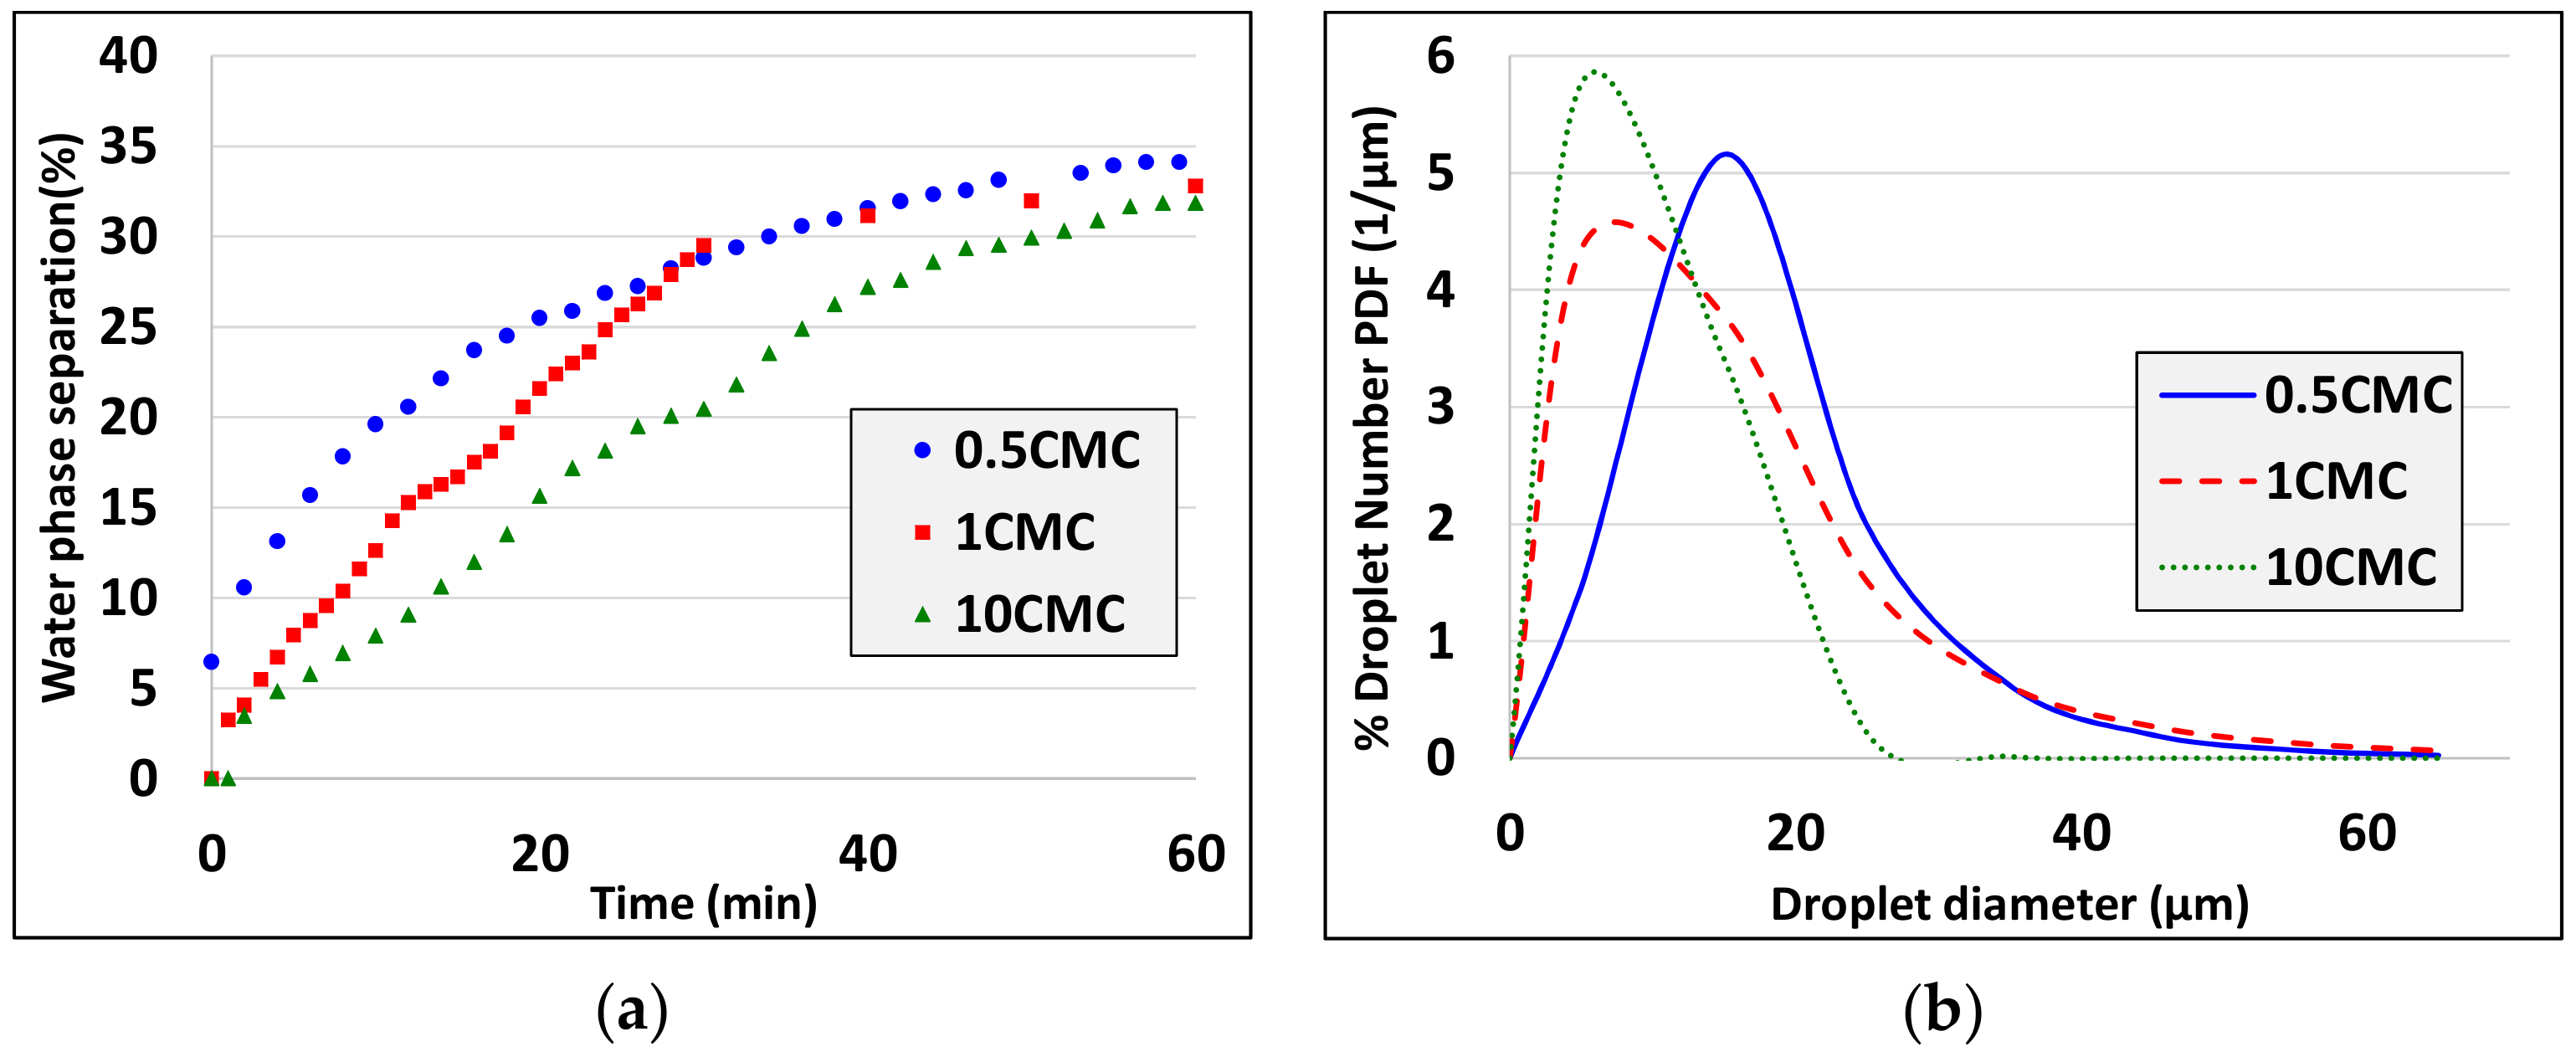
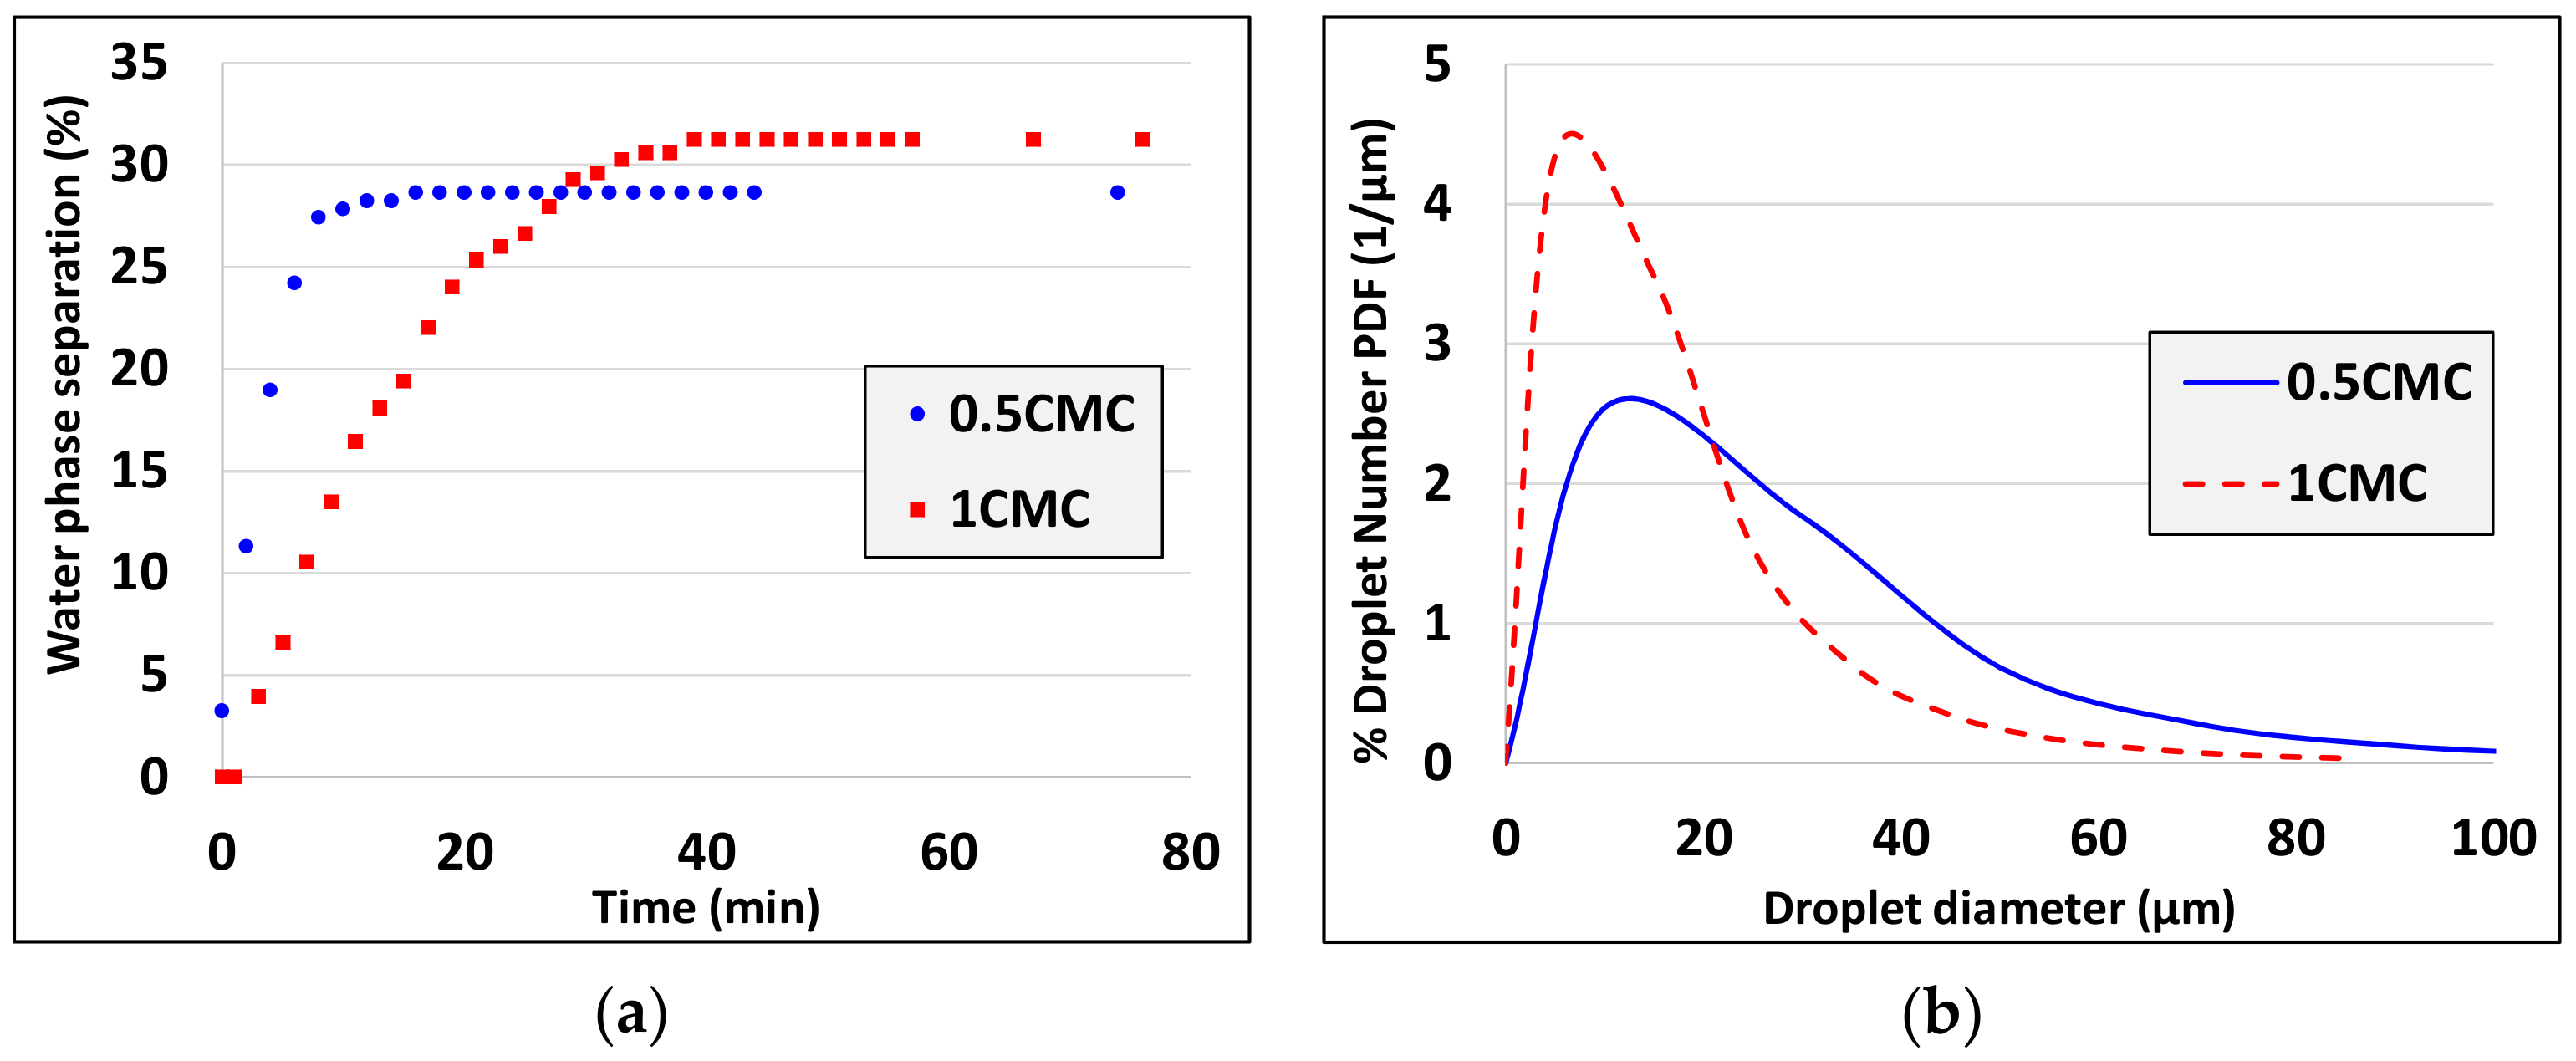
  • Droplet size decreases as interfacial tension decreases (see experiments 1, 2 and experiments 10, 11, 12). There is a discrepancy to this rule comparing experiments 2 and 9 but there are two possible explanations: i) The differences are in the limit of resolution of interfacial tension and droplet diameter measurement techniques and ii) for such small differences not only the interfacial tension but also the interfacial elasticity (which differs for the two different surfactants) affects the droplet size.
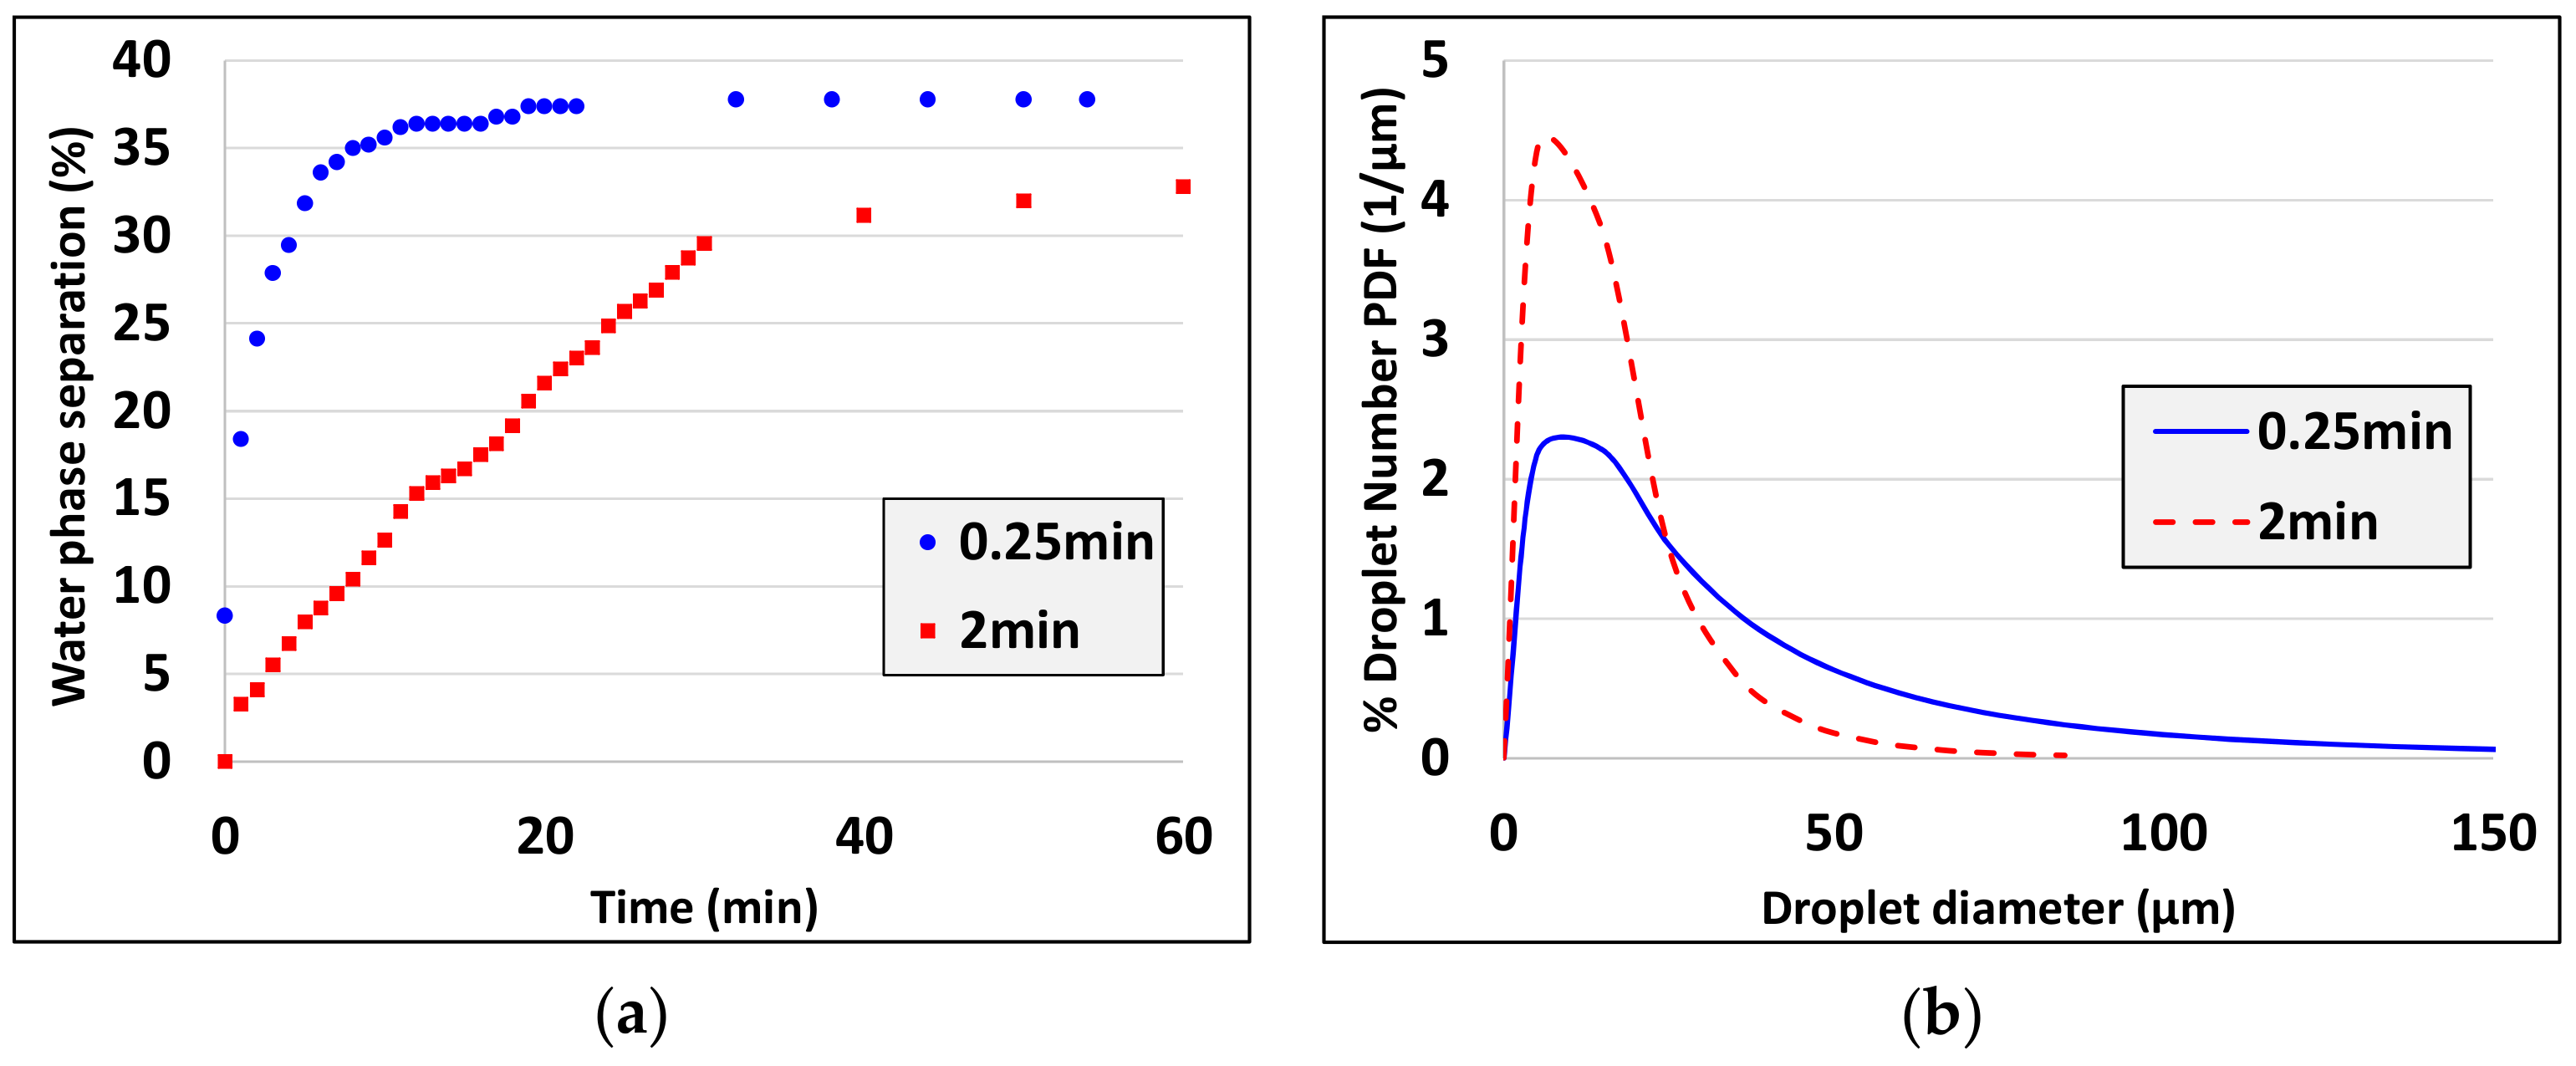
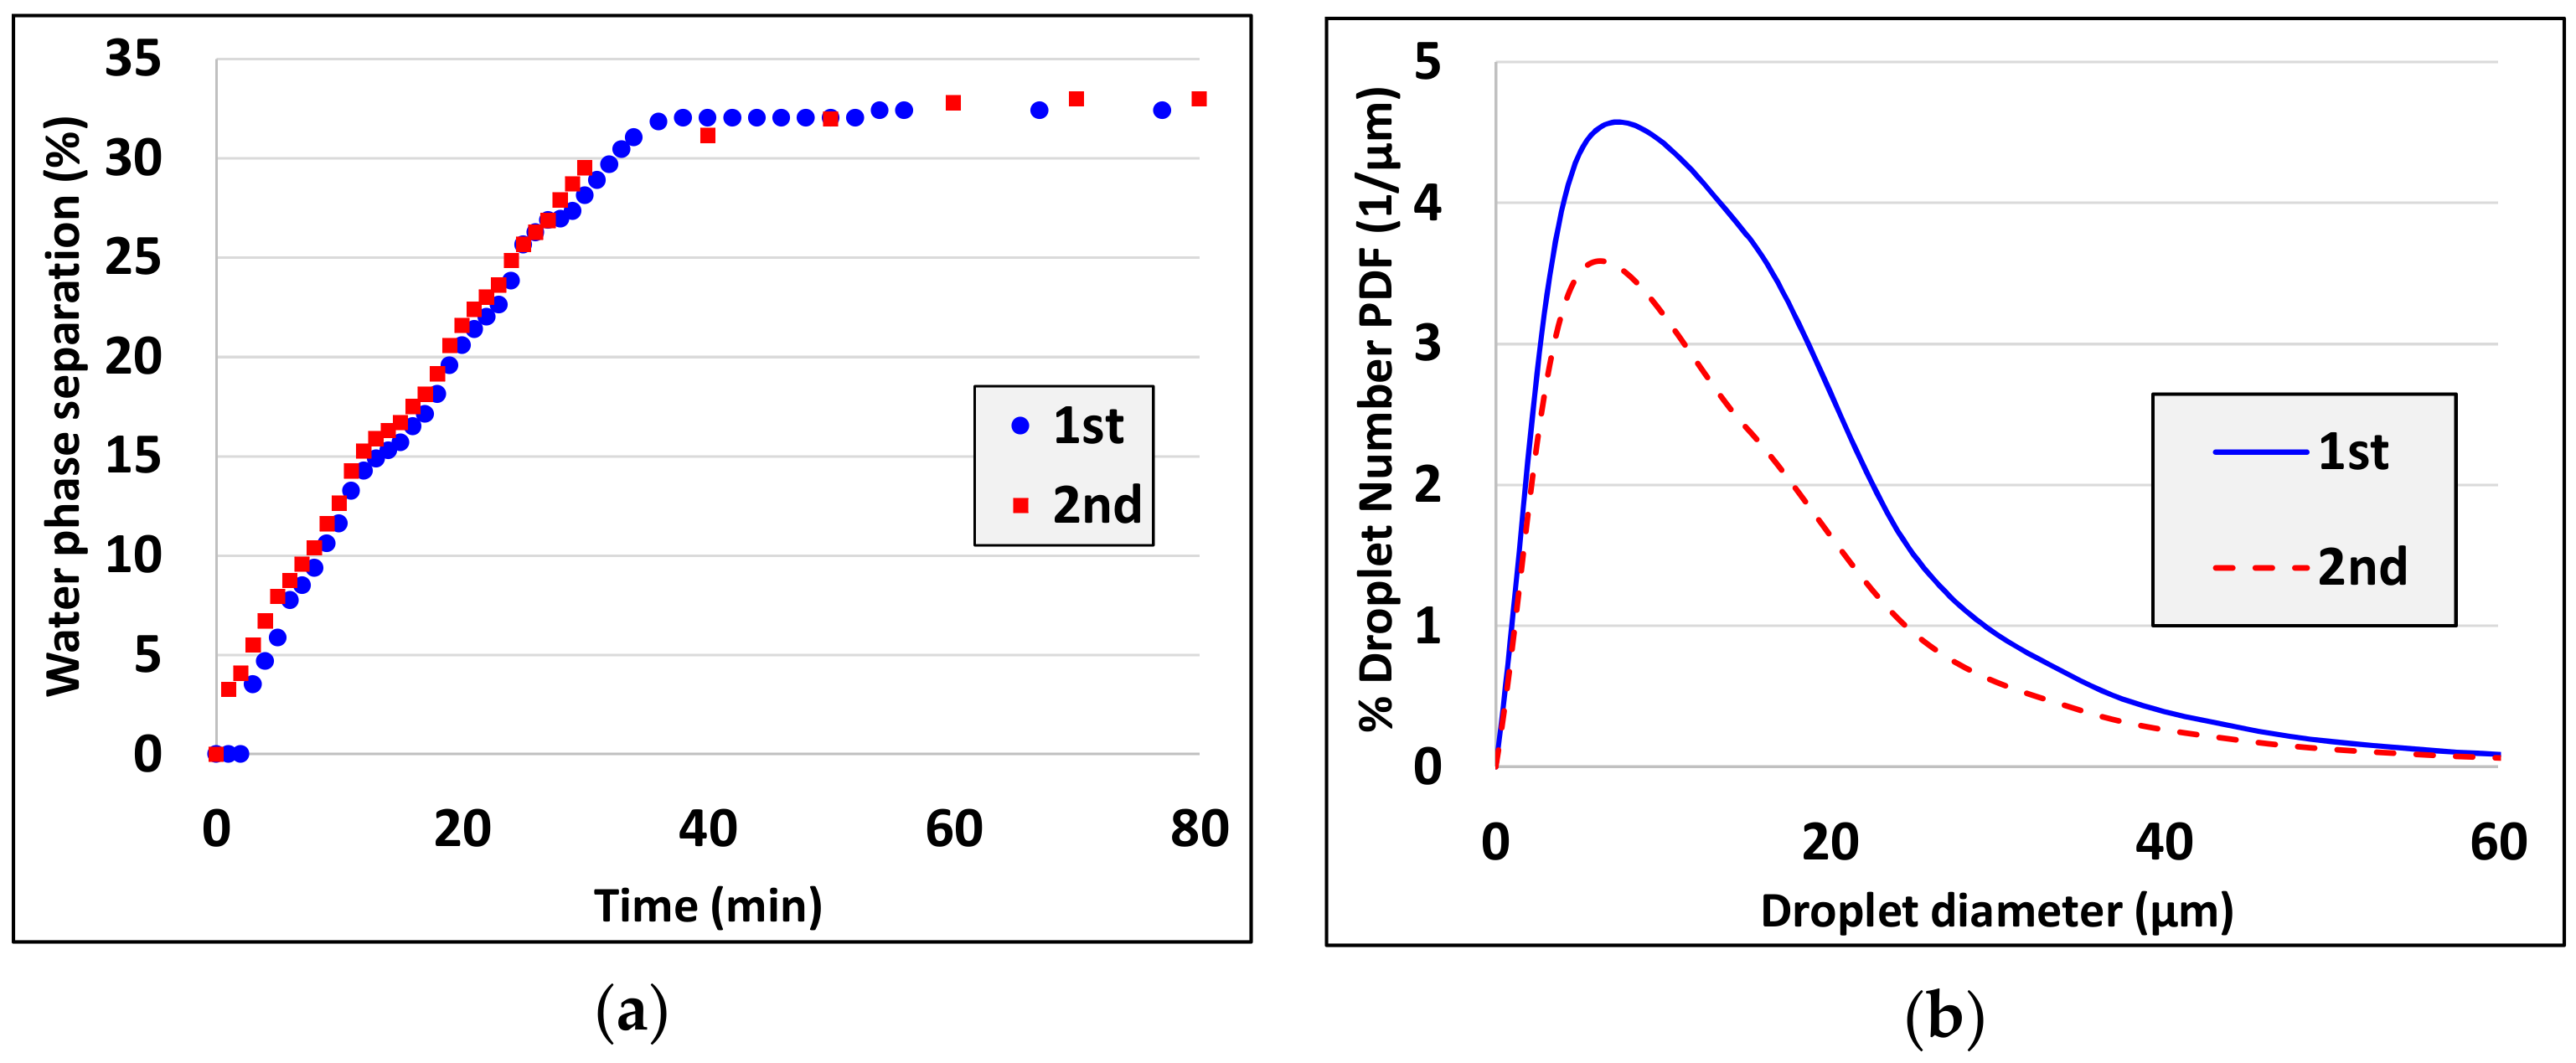
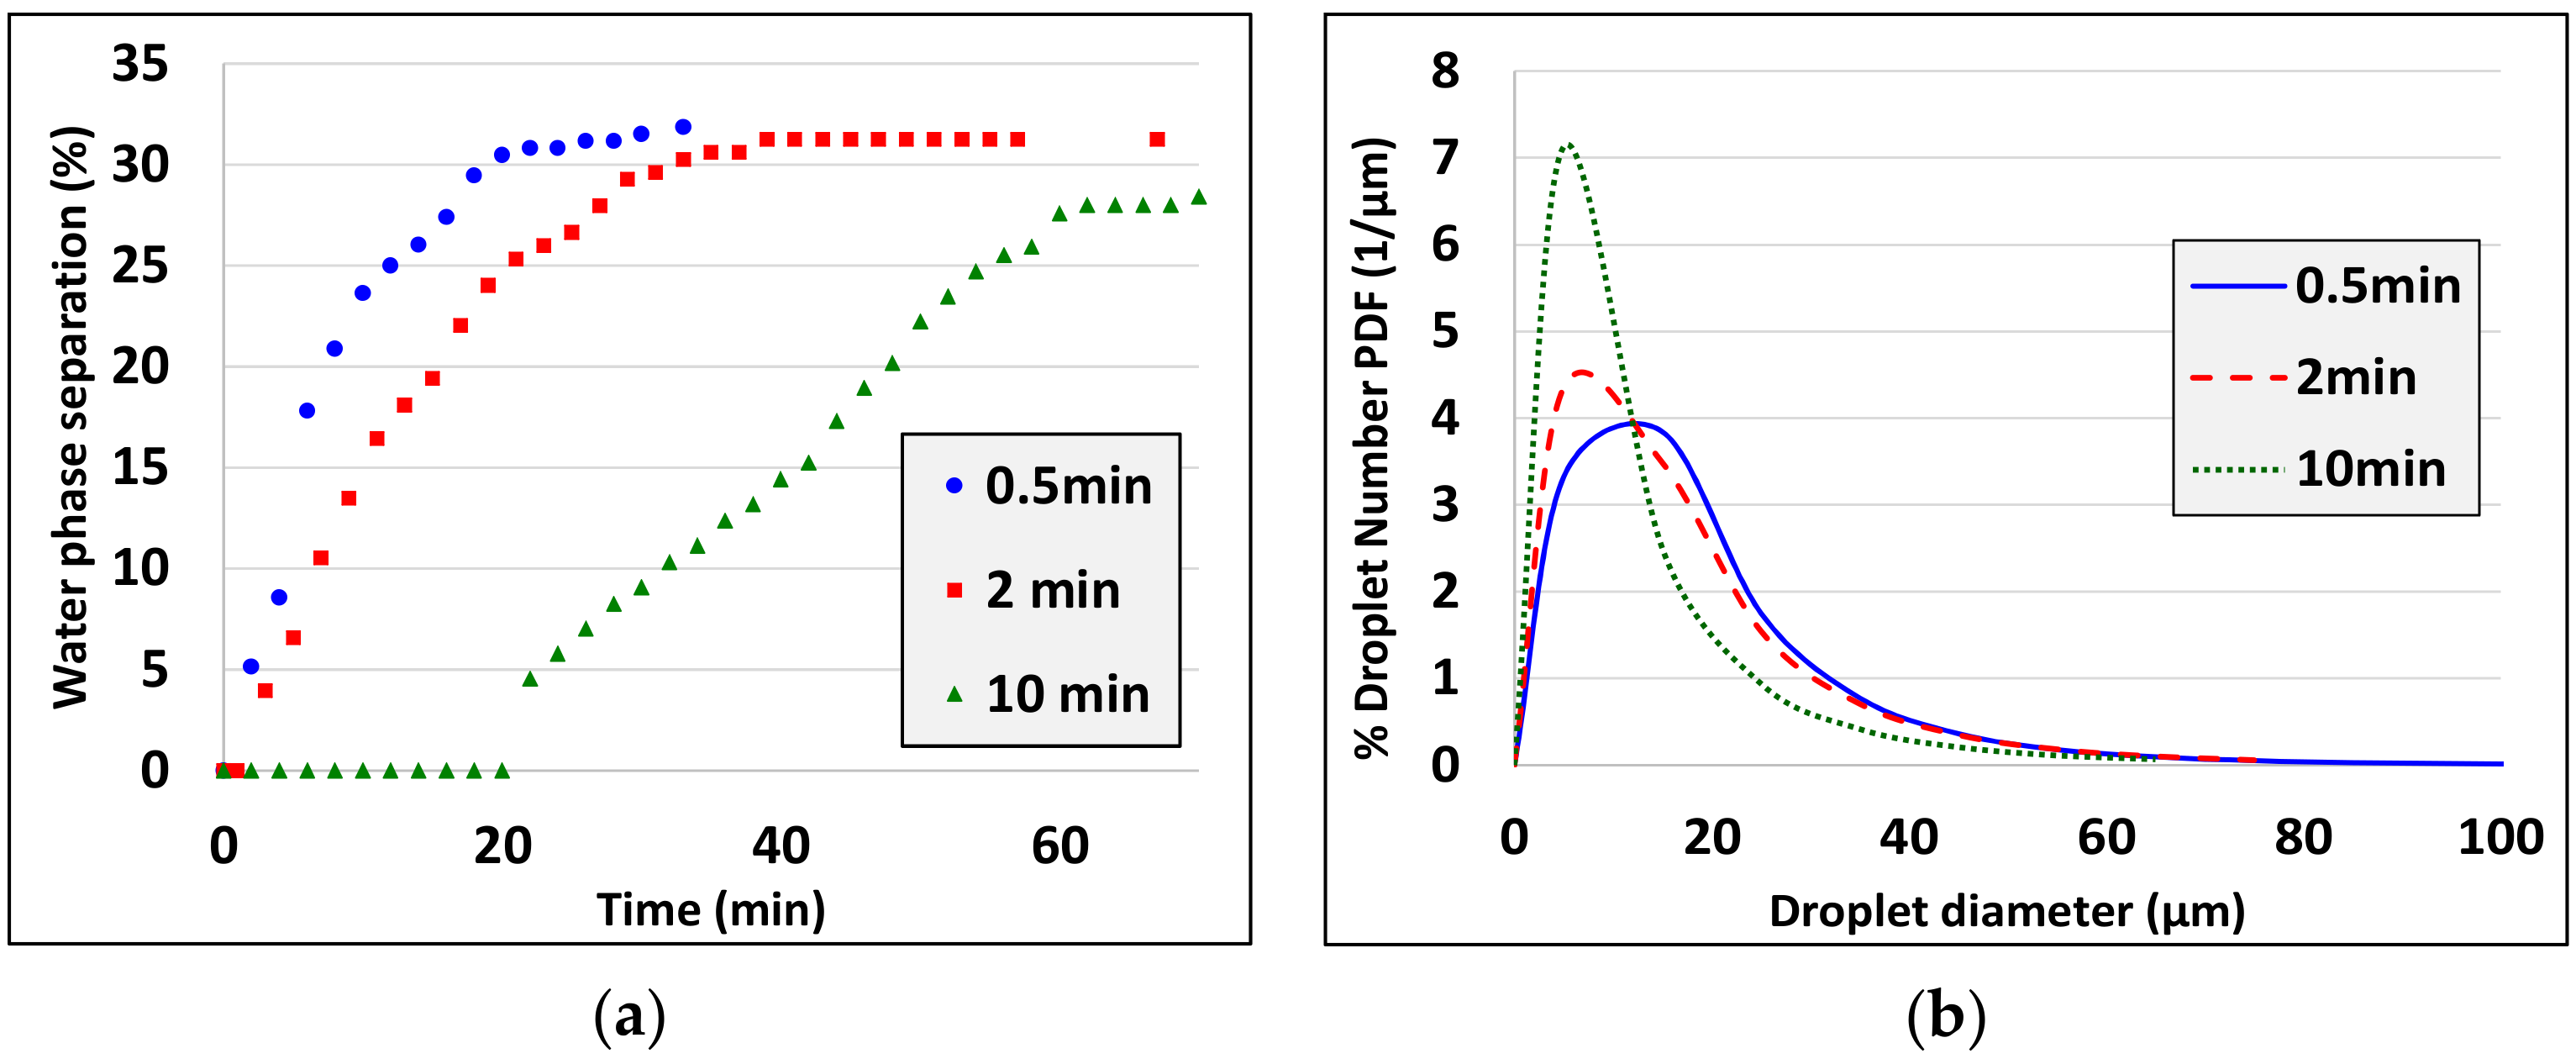
  • Droplet size decreases as the actual emulsification time increases (see experiments 3, 4, experiments 5, 7 and experiments 10, 15).
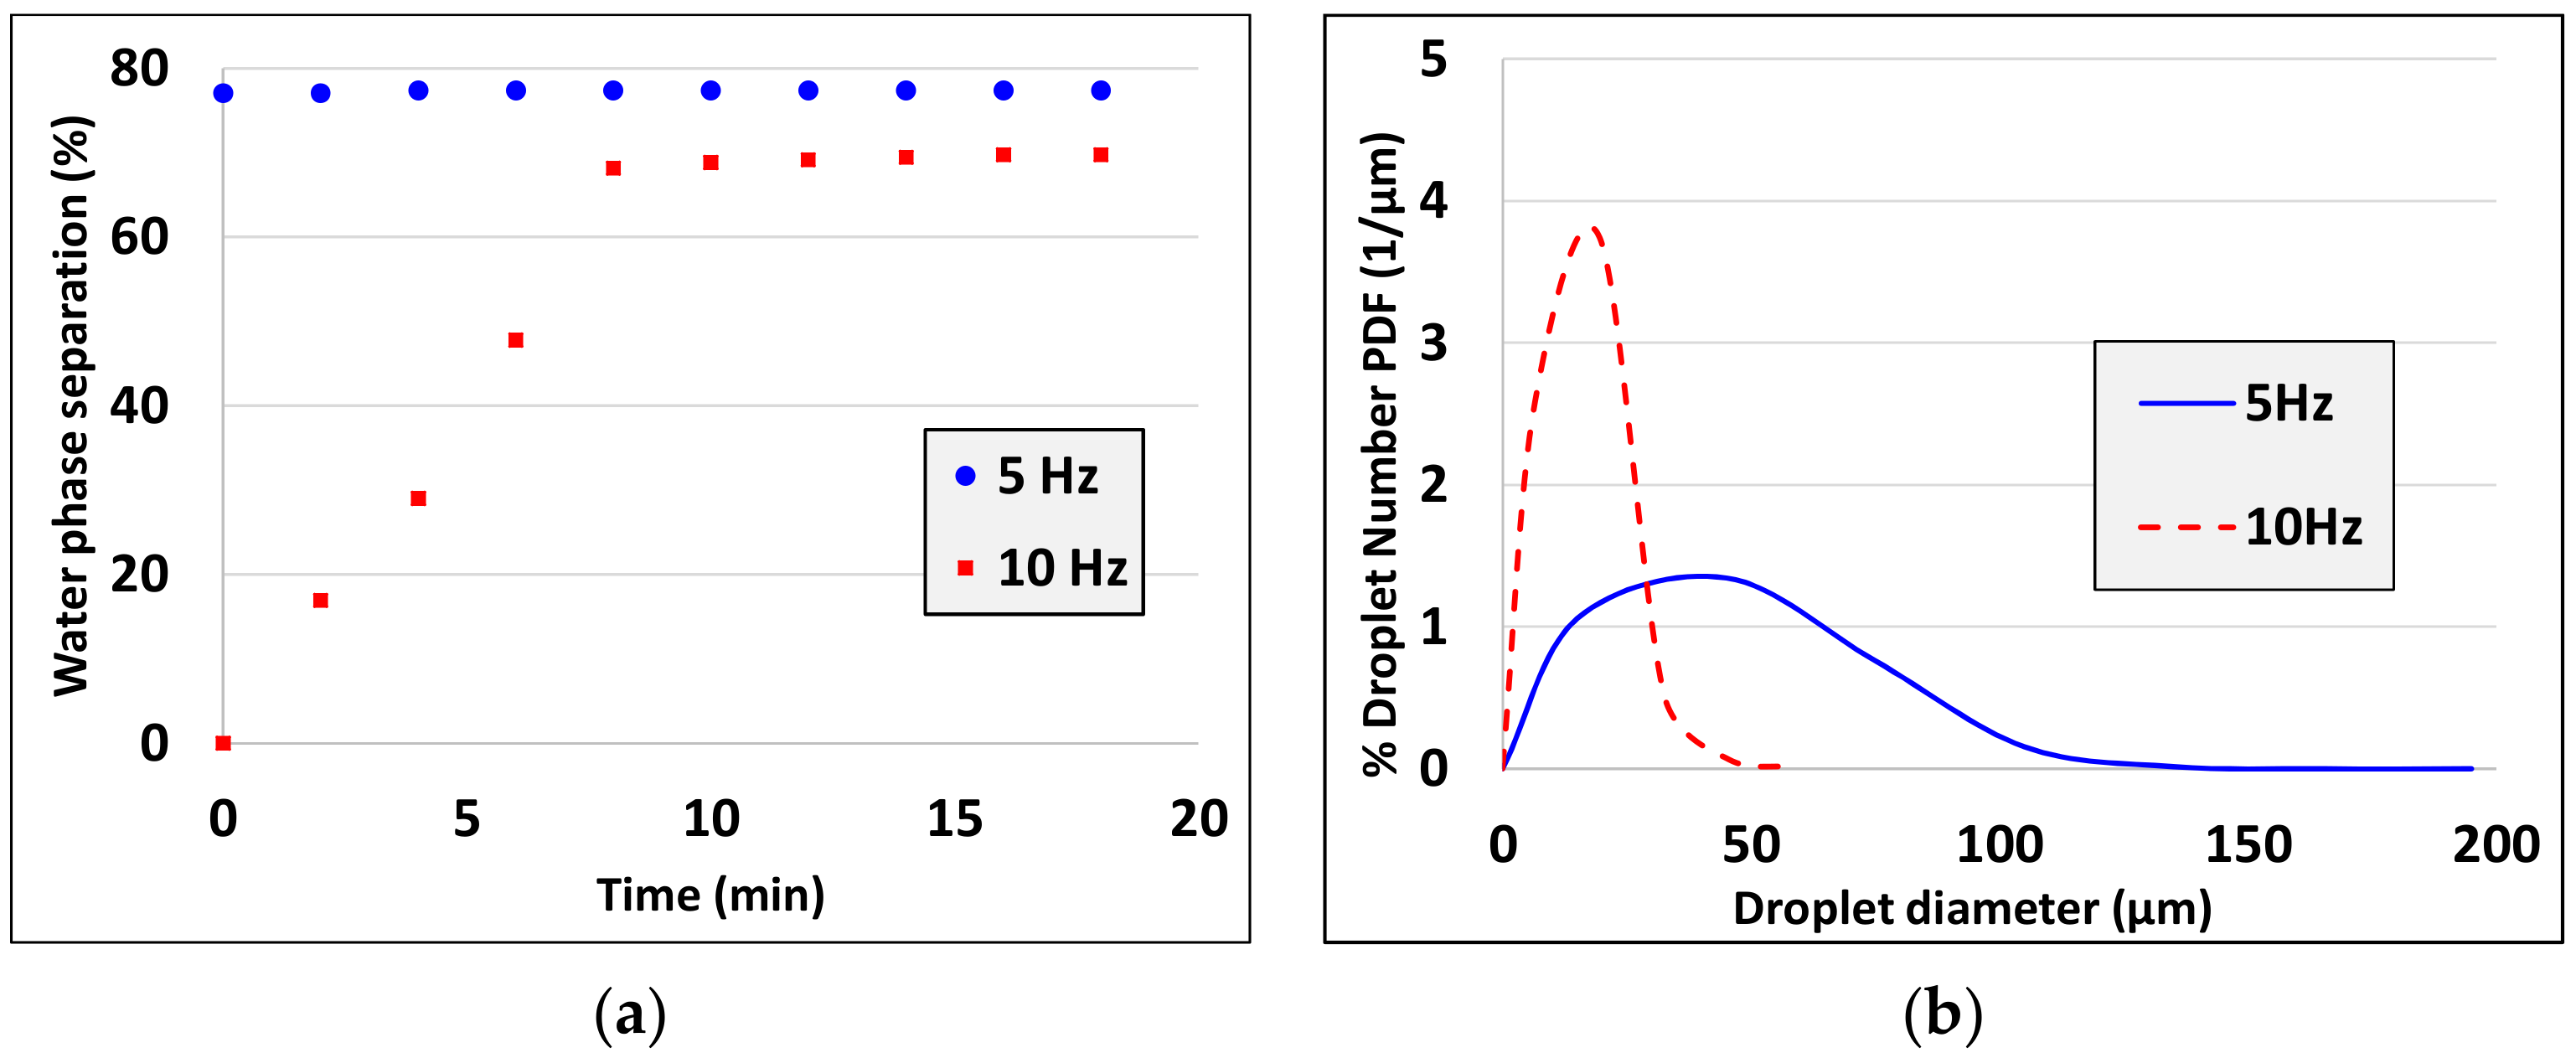
  • Droplet size decreases as the characteristic shear rate increases (see experiments 5,6, experiments 7, 8 and experiments 10, 13, 14).
  • Droplet size decreases as oil volume fraction decreases (see experiments 10, 16).
All the above observations are compatible with the droplets breakage theory based on the concept of critical capillary number [31,34,35] (i.e., the droplet size decreases as shear rate increases and surface tension decreases). Comparing the two pistons it is apparent that the first develops higher shear rates but their effect is counterbalanced by the much shorter actual emulsification times leading at the end to lower emulsification efficiency (higher droplet size). The proposed procedure of characterizing the condition in the device allows the comparison and scale-up of the emulsification results among different emulsification set-ups (i.e., liquid volume, gap thickness and piston plate geometry) for the particular device designed here. In addition, the present experimental results show that the phase separation front velocity increases with droplet size and decreases with oil volume fraction as the theory suggests (see Equation (16)).

6. Conclusions

This work illustrates the development and characterization of an innovative miniature pulsating emulsification device. Two pistons (Piston 1 and Piston 2) are constructed having different geometry plates at their tip since the shape of the piston sides (non-uniform and uniform height) and the gap between the plate and the test cell walls (0.25 and 0.6 mm) play an important role in emulsification and consequently in emulsions stability. The total cell volume does not exceed 3.5 mL, so only small consumable (organic phase, surfactant) quantities are needed. For emulsion preparation, SDS and Ethylan 1008 are used as surfactants and dodecane as the organic phase. The examined emulsification parameters are the type and concentration of surfactants, oil to water volume ratio, emulsification duration, and pulsation stroke frequency. Evaluation of the produced emulsion stability is investigated by means of (i) the evolution of phases (water/emulsion/oil) separation versus time and (ii) the initial oil droplet size distribution. The aforementioned analysis allows us to draw conclusions regarding both the performance of the device upon emulsification as well as the emulsions stability. Since no oil separation is ever observed in the present experiments it is apparent that the employed surfactant concentrations (0.5, 1, 10 CMC) are capable of hindering droplets coalescence in the produced emulsions. The obtained results show that water phase separation occurs slower with smaller droplet size, as expected. Ιt is shown that droplet size decreases as the surface tension decreases, the oil:water ratio decreases, the stroke frequency increases, and the nominal emulsification time increases. Moreover, the mean shear rate and the actual emulsification time are calculated. Piston 1 develops higher shear rates than Piston 2. However, their effect is counterbalanced by the smaller actual emulsification time of Piston 1. This yields a higher emulsification effectiveness of Piston 2.

Author Contributions

Conceptualization, A.P.C., M.K., and T.D.K.; data curation, A.P.C. and M.K.; formal analysis, S.P.E. and M.K.; funding acquisition, T.D.K.; methodology, A.P.C., S.P.E., and T.D.K.; project administration, T.K.; supervision, M.K. and T.D.K.; validation S.P.E., M.K., and T.D.K.; writing—original draft preparation, A.P.C. and M.K.; writing—review and editing, M.K. and T.D.K. All authors have read and agreed to the published version of the manuscript.

Funding

This research was funded by (a) the “Soft Matter Dynamics – Foams, Granular Matter and Emulsions” project by the European Space Agency – Contract No.: 4000115113/15/NL/PG and (b) Greece and the European Union (European Social Fund-ESF) through the Operational Programme “Human Resources Development, Education and Lifelong Learning” in the context of the project “Reinforcement of Postdoctoral Researchers” (MIS-5001552), implemented by the Greek State Scholarships Foundation (ΙΚΥ).

Acknowledgments

This research was supported by (a) the European Space Agency (ESA) MAP-PROJECT “Soft Matter Dynamics – Foams, Granular Matter and Emulsions” – Contract No.: 4000115113/15/NL/PG and (b) the project “Reinforcement of Postdoctoral Researchers” (MIS-5001552), implemented by the Greek State Scholarships Foundation (ΙΚΥ). Colloids 04 00007 i001

Conflicts of Interest

The authors declare no conflict of interest.

References

  1. Chappat, M. Some applications of emulsions. Colloids Surf. A Physicochem. Eng. Asp. 1994, 91, 57–77. [Google Scholar] [CrossRef]
  2. Ahmadi, P.; Asaadian, H.; Kord, S.; Khadivi, A. Investigation of the simultaneous chemicals influences to promote oil-in-water emulsions stability during enhanced oil recovery applications. J. Mol. Liq. 2019, 275, 57–70. [Google Scholar] [CrossRef]
  3. Al-Malah, K.I.; Azzam, M.O.J.; Omari, R.M. Emulsifying properties of BSA in different vegetable oil emulsions using conductivity technique. Food Hydrocoll. 2000, 14, 485–490. [Google Scholar] [CrossRef]
  4. Forgiarini, A.; Esquena, J.; Gonzalez, C.; Solans, C. Formation of Nano-emulsions by Low-Energy Emulsification Methods at Constant Temperature. Langmuir 2001, 17, 2076–2083. [Google Scholar] [CrossRef]
  5. Tadros, T.F. Applied Surfactants Principles and Applications; Wiley-VCH Verlag GmbH & Co. KGaA: Weinheim, Germany, 2005. [Google Scholar]
  6. Kazemzadeh, Y.; Ismail, I.; Rezvani, H.; Sharifi, M.; Riazi, M. Experimental investigation of stability of water in oil emulsions at reservoir conditions: Effect of ion type, ion concentration and system pressure. Fuel 2019, 243, 15–27. [Google Scholar] [CrossRef]
  7. Tadros, T.F. Emulsion Formation and Stability, 1st Ed. ed; Wiley-VCH Verlag GmbH & Co. KGaA: Weinheim, Germany, 2013. [Google Scholar]
  8. Agboola, S.O.; Singh, H.; Munro, P.A.; Dalgleish, D.G.; Singh, A.M. Destabilization of Oil-in-Water Emulsions Formed Using Highly Hydrolyzed Whey Proteins. J. Agric. Food Chem. 1998, 46, 84–90. [Google Scholar] [CrossRef] [PubMed]
  9. Tcholakova, S.; Denkov, D.N.; Lips, A. Comparison of solid particles, globular proteins and surfactants as emulsifiers. Phys. Chem. Chem. Phys. 2008, 10, 1597–1712. [Google Scholar] [CrossRef] [PubMed]
  10. Varka, E.M.; Karapantsios, T.D. Global versus local dynamics during destabilization of eco-friendly cosmetic emulsions. Colloids Surf. A Physicochem. Eng. Asp. 2011, 391, 195–200. [Google Scholar] [CrossRef]
  11. Binks, P.B. Modern Aspects of Emulsion Science; Royal Society of Chemistry: Cambridge, UK, 1998. [Google Scholar]
  12. Friberg, S.; Larsson, K.; Sjoblom, J. Food Emulsions, 4th ed.; Marcel Dekker: New York, NY, USA, 2004. [Google Scholar]
  13. Rosen, M.J. Surfactants and interfacial phenomena, 3rd ed.; John Wiley & Sons Inc.: New Jersey, NJ, USA, 2004. [Google Scholar]
  14. Schramm, L.L. Emulsions, Foams and Suspensions, Fundamentals and Applications; Wiley-VCH Verlag GmbH & Co. KGaA: Weinheim, Germany, 2005. [Google Scholar]
  15. Leal-Calderon, F.; Schmitt, V.; Bibette, J. Emulsion Science: Basic Principles, 2nd ed.; Springer: New York, NY, USA, 2007. [Google Scholar]
  16. Moinard-Checot, D.; Chevalier, Y.; Briancon, S.; Beney, L.; Fessi, H. Mechanism of nanocapsules formation by the emulsion-diffusion process. J. Colloid Interf. Sci. 2008, 317, 458–468. [Google Scholar] [CrossRef]
  17. Toledano, O.; Magdassi, S. Emulsification and Foaming Properties of Hydrophobically Modified Gelatin. J. Colloid Interf. Sci. 1998, 200, 235–240. [Google Scholar] [CrossRef]
  18. Williams, A.P.; Sayers, C.; Viebke, C.; Senan, C. Elucidation of the Emulsification Properties of Sugar Beet Pectin. J. Agric. Food Chem. 2005, 53, 3592–3597. [Google Scholar] [CrossRef] [PubMed]
  19. Bhardwaj, A.; Hartland, S. Dynamics of Emulsification and Demulsification of Water in Crude Oil Emulsions. Ind. Eng. Chem. Res. 1994, 33, 1271–1279. [Google Scholar] [CrossRef]
  20. Cabrera-Trujillo, M.A.; Filomena-Ambrosio, A.; Quintanilla-Carvajal, M.X.; Sotelo-Diaz, L.I. Stability of low-fat oil in water emulsions obtained by ultra turrax, rotor-stator and ultrasound homogenization methods. Int. J. Gastron. Food Sci. 2018, 13, 58–64. [Google Scholar] [CrossRef]
  21. Salerni, F.; Orsi, D.; Santini, E.; Liggieri, L.; Ravera, F.; Christofolini, L. Diffusing wave spectroscopy for investigating emulsions: II. Characterization of a paradigmatic oil-in-water emulsion. Coll. Surf. A 2019, 580, 123724. [Google Scholar] [CrossRef]
  22. Llamas, S.; Santini, E.; Liggieri, L.; Salerni, F.; Orsi, D.; Christofolini, L.; Ravera, F. Adsorption of Sodium Dodecyl Sulphate at Water-Dodecane Interface in Relation to the Oil in Water Emulsion Properties. Am. Chem. Soc. 2018, 34, 5978–5989. [Google Scholar]
  23. Ethylan 1008. Available online: https://www.nouryon.com/product/ethylan-1008-non-ionic-surfactant/ (accessed on 19 November 2019).
  24. Zaboulis, X.; Papara, M.; Chatziargyriou, A.; Karapantsios, T.D. Detection of densely dispersed spherical bubbles in digital images based on a template matching technique: Application to wet foams. Colloids Surf. A Physicochem. Eng. Asp. 2007, 309, 96–106. [Google Scholar] [CrossRef]
  25. Caserta, S.; Simeone, M.; Guido, S. Evolution of drop size distribution of polymer blends under shear flow by optical sectioning. Rheol. Acta 2004, 43, 491–501. [Google Scholar] [CrossRef]
  26. Caserta, S.; Sabetta, L.; Simeone, M.; Guido, S. Shear-induced coalescence in aqueous biopolymer mixtures. Chem. Engin. Sci. 2005, 60, 1019–1027. [Google Scholar] [CrossRef]
  27. Caserta, S.; Simeone, M.; Guido, S. A parameter investigation of shear-induced coalescence in semidilute PIB-PDMS polymer blends: Effects of shear rate, shear stress volume fraction and viscosity. Rheol. Acta 2006, 45, 505–512. [Google Scholar] [CrossRef]
  28. Ampatzidis, D.C.; Varka, E.M.; Karapantsios, T.D. Interfacial Activity of amino acid-based glycerol ether surfactants and their performance in stabilizing O/W cosmetic emulsions. Colloids Surf. A Physicochem. Eng. Asp. 2014, 460, 176–183. [Google Scholar] [CrossRef]
  29. Konstandopoulos, A.; Kostoglou, M.; Vlachos, N.; Kladopoulou, E. Advances in the Science and Technology of Diesel Particulate Filter Simulation. Adv. Chem. Eng. 2007, 33, 213–275. [Google Scholar]
  30. Coulaloglou, C.A.; Tavlarides, L.L. Description of Interaction Processes in Agitated Liquid-Liquid Dispersions. Chem. Eng. Sci. 1977, 32, 1289. [Google Scholar] [CrossRef]
  31. Williams, A.; Janseen, M.J.J.; Prins, A. Behavior of droplets in simple shear flow in the presence of a protein emulsifier. Colloids Surf. A Physicochem. Eng. Asp. 1997, 125, 189–200. [Google Scholar] [CrossRef]
  32. Jansen, K.B.M.; Agterof, W.G.M.; Mellema, J. Droplet breakup in concentrated emulsions. J. Rheol. 2001, 45, 227. [Google Scholar] [CrossRef]
  33. Kostoglou, M.; Varka, E.M.; Kalogianni, E.P.; Karapantsios, T.D. Evolution of volume fractions and droplet sizes by analysis of electrical conductance curves during destabilization of oil-in-water emulsions. J. Colloid Interf. Sci. 2010, 349, 408–416. [Google Scholar] [CrossRef]
  34. Janssen, M.J.J.; Boon, A.; Agterof, M.W.G. Droplet break-up in simple shear flow in the presence of emulsifiers. Colloids Surf. A Physicochem. Eng. Asp. 1994, 91, 141–148. [Google Scholar] [CrossRef]
  35. Grace, H.P. Dispersion Phenomena in High Viscosity Immiscible Fluid Systems and Application of Static Mixers as Dispersion Devices in Such Systems. Chem. Eng. Commun. 1982, 14, 225–277. [Google Scholar] [CrossRef]
Figure 1. Schematic representation of the (a) pulsating emulsification device and (b) subsequent positions of the piston as it moves downwards during a pulsation.
Colloids 04 00007 g001
Figure 2. Schematic representation of (a) Piston 1 (non-uniform plate height) and (b) Piston 2 (uniform plate height).
Colloids 04 00007 g002
Figure 3. (a) Tracking phase separation in the emulsions inside multiple tubes by taking pictures at different time intervals with a camera (Sony a6300), (b) close-up of pictures of the same emulsion taken at different time intervals showing phase separation over time.
Colloids 04 00007 g003
Figure 4. (a) Microscope furnished with a digital camera operated through a laptop, (Axiostar Plus, Carl Zeiss Inc.). (b) Analysis of microscope images with a custom made software (BubblesEdit [24]).
Colloids 04 00007 g004
Figure 5. Repeatability test of emulsion production: (a) water phase separation and (b) droplet size distribution of emulsions (CSDS = 1 CMC, tn = 2 min, φ = 0.5 and f = 10Hz; Piston 1, 1st: dav = 14.4 μm, 2nd: dav = 16.2 μm, 1st and 2nd: dmin = 2.78 μm).
Colloids 04 00007 g005
Figure 6. Effect of surfactant concentration CSDS on (a) water phase separation and (b) droplet size distribution of emulsions (tn = 2 min, φ = 0.5 and f = 10 Hz; Piston 1, 0.5 CMC: dav = 23.3 μm, 1 CMC: dav = 13.5 μm, 0.5 and 1 CMC: dmin = 1.7 μm).
Colloids 04 00007 g006
Figure 7. Effect of nominal emulsification time tn on (a) water phase separation and (b) droplet size distribution of emulsions (CSDS = 1 CMC, φ = 0.5 and f = 10 Hz; Piston 1, 0.5 min: dav = 16.2 μm, 2 min: dav = 13.5 μm, 10 min: dav = 8.1 μm, 0.5, 2 and 10 min: dmin = 1.7 μm).
Colloids 04 00007 g007
Figure 8. Effect of stroke frequency f on (a) water phase separation and (b) droplet size distribution of emulsions (CSDS = 10 CMC, φ = 0.2 and tn = 0.5 min; Piston 1, 5 Hz: dav = 45 μm, 10 Hz: dav = 14.6 μm, 5 Hz: dmin = 1.7 μm, 10 Hz: dmin = 0.82 μm).
Colloids 04 00007 g008
Figure 9. Effect of stroke frequency f on (a) water phase separation and (b) droplet size distribution of emulsions (CSDS = 10 CMC, φ = 0.2 and tn = 2 min; Piston 1, 5 Hz: dav = 39.4 μm, 10 Hz: dav = 10.9 μm, 5 Hz: dmin = 1.7 μm, 10 Hz: dmin = 0.82 μm).
Colloids 04 00007 g009
Figure 10. Effect of surfactant type on (a) water phase separation and (b) droplet size distribution of emulsions (CSDS = 1 CMC, CEthylan 1008 = 1 CMC, φ = 0.2, tn = 2 min and f = 10 Hz; Piston 1, SDS: dav = 23.3 μm, Ethylan 1008: dav = 15.4 μm, SDS and Ethylan 1008: dmin = 1.7 μm).
Colloids 04 00007 g010
Figure 11. Effect of surfactant concentration CSDS on (a) water phase separation and (b) droplet size distribution of emulsions (tn = 2 min, φ = 0.5 and f = 10 Hz; Piston 2, 0.5 CMC: dav = 17.3 μm, 1 CMC: dav = 14.4 μm, 10 CMC: dav = 11.3 μm, 0.5, 1 and 10 CMC: dmin = 2.78 μm).
Colloids 04 00007 g011
Figure 12. Effect of nominal emulsification time tn on (a) water phase separation and (b) droplet size distribution of emulsions (CSDS = 1 CMC, φ = 0.5 and f = 10 Hz; Piston 2, 0.25 min: dav = 29.2 μm, 2 min: dav = 14.4 μm, 0.5 and 2 min: dmin = 2.78 μm).
Colloids 04 00007 g012
Figure 13. Effect of stroke frequency f on (a) water phase separation and (b) droplet size distribution of emulsions (CSDS = 1 CMC, φ = 0.5 and tn = 2 min; Piston 2, 10 Hz: dav = 14.4 μm, 15 Hz: dav = 10.1 μm, 20 Hz: dav = 10.5 μm, 10, 15 and 20 Hz: dmin = 2.78 μm).
Colloids 04 00007 g013
Figure 14. Effect of oil to water ratio φ on (a) water phase separation and (b) droplet size distribution of emulsions (CSDS = 1 CMC, tn = 2min, and f = 10Hz; Piston 2, φ = 0.5: dav = 14.4 μm, φ = 0.2: dav = 10.1 μm, φ = 0.5 and 0.2: dmin = 2.78 μm).
Colloids 04 00007 g014
Figure 15. Geometry of piston plates: Definition of variables and coordinate systems for (a) 2-dimensional case, (x-y dimensions visible) and (b) 3-dimensional case (x-z dimensions visible); δ is the height of the plate and w is the thickness of the gap with the wall.
Colloids 04 00007 g015
Figure 16. Phase separation front velocity calculation through line fitting.
Colloids 04 00007 g016
Table 1. Experimental conditions of the experiments with Piston 1.
Experimental parameters
Oil: Water Ratio (%)Stroke Frequency
(Hz)
Surfactant Concentration (x CMC)Nominal Emulsification Time (min)
Dodecane
Millipore water
SDS
150:50100.52
250:501012
350:501010.5
450:5010110
520:805100.5
620:8010100.5
720:805102
820:8010102
Dodecane Millipore water Ethylan 1008950:50100.52
Table 2. Experimental conditions of the experiments with Piston 2.
Experimental Parameters
Oil: Water Ratio (%)Stroke Frequency
(Hz)
Surfactant Concentration
(x CMC)
Nominal Emulsification Time
(min)
Dodecane
Millipore water
SDS
1050:501012
1150:50100.52
1250:5010102
1350:501512
1450:502012
1550:501010.25
1620:801012
Table 3. Quantitative results of the experiments with Piston 1.
Calculated Input ParametersEmulsification Results
Characteristic Shear Rate (1/s)Actual Emulsification Time (min)Interfacial Tension (mN/m)Separation Front Velocity (mm/sec)dav (μm)dv (μm)PI
Dodecane
Millipore water
SDS
1136000.706170.008523.344.71.64
2136000.7069.80.005213.534.81.34
3136000.1769.80.007816.2431.49
4136003.529.80.00168.119.81.35
568000.1766.2too large45>451.26
6136000.1766.20.045514.631.81.18
768000.7066.2too large39.4>39.41.26
8136000.7066.20.05810.936.11.33
Dodecane
Millipore water Ethylan 1008
9136000.7069.20.007215.441.23.22
Table 4. Quantitative results of the experiments with Piston 2.
Calculated Input ParametersEmulsification Results
Characteristic Shear Rate (1/s)Actual Emulsification Time (min)Interfacial Tension (mN/m)Separation Front Velocity (mm/sec)dav (μm)dv (μm)PI
Dodecane
Millipore water
SDS
1039203.729.80.004214.431.51.40
1139203.72170.00517.334.51.20
1239203.726.20.003111.3271.43
1358803.729.80.003812.1301.38
1478403.729.80.002510.524.41.46
1539200.4659.80.01729.2641.47
1639203.729.80.01310.117.41.15
Table 5. Parameters of log-normal approximation of the experiments with Piston 1.
σd* (μm)
Dodecane
Millipore water
SDS
10.5324.69
20.5813.73
30.4814.94
40.839
5--
60.1914.53
7--
80.611.9
Dodecane
Millipore water Ethylan 1008
96.9918.52
Table 6. Parameters of log-normal approximation of the experiments with Piston 2.
σd*
(μm)
Dodecane
Millipore water
SDS
100.4813.18
110.2715.37
120.169.43
130.2710.88
140.159.16
151.0926.28
16--

