Article

Membrane Filtration of Anionic Surfactant Stabilized Emulsions: Effect of Ionic Strength on Fouling and Droplet Adhesion

by
Janneke M. Dickhout
1,2,
Rob G. H. Lammertink
2 and
Wiebe M. de Vos
2,*
1
Wetsus European Centre of Excellence for Sustainable Water Technology, Oostergoweg 9, 8911 MA Leeuwarden, The Netherlands
2
Membrane Science and Technology, University of Twente, P.O. Box 217, 7500 AE Enschede, The Netherlands
*
Author to whom correspondence should be addressed.
Colloids Interfaces 2019, 3(1), 9; https://doi.org/10.3390/colloids3010009
Submission received: 1 December 2018 / Revised: 8 January 2019 / Accepted: 9 January 2019 / Published: 10 January 2019

Abstract

:
Membranes hold great potential to be used for the successful treatment of oily waste water, but membrane fouling leads to substantial decreases in performance. Here we study the impact of ionic strength on membrane fouling from an emulsion stabilized by the anionic surfactant sodium dodecyl sulfonate (SDS). For this we use a unique combinatorial approach where droplet adhesion to a cellulose surface in a flow cell is compared to membrane fouling (flux decline) on a cellulose membrane. In the initial membrane fouling stages droplet adhesion dominates. While the flow cell demonstrates a high number of droplets adhering especially at high ionic strengths (100 mM NaCl), the strongest flux decline is observed at intermediate (10 mM NaCl) ionic strength. This suggests that the fouling mechanism must be different, with pore blocking expecting to dominate at intermediate ionic strength. At the later fouling stages the porosity of the cake layer plays a key role in the flux reduction. At low ionic strength, oil droplets repel each other strongly and an open, more permeable, cake layer is formed. However at higher ionic strength, a screening of charge interactions leads to a lower porosity and thereby a lower flux. This leads to a clear trend: with a higher ionic strength a higher flux decline is observed. Flux recovery is high at all ionic strengths, in line with the observation in the flow cell that oil droplets can easily be sheared of a cellulose surface at all ionic strengths. This work thus highlights the critical effect of the ionic strength on membrane fouling by anionically stabilized emulsions. Moreover it shows how the use of an optical flow cell can provide key insights to help explain observations in more standard membrane fouling experiments.

Graphical Abstract

1. Introduction

Membrane filtration of oil-in-water emulsions is a cost-effective and selective way of separating water from oil. This is especially the case for stable emulsions, with droplets < 10 μ m, which cannot be separated efficiently by, for instance, flotation or other gravity-driven processes [1,2,3,4,5]. Membranes, however, suffer from fouling, which causes a decline in clean water production and an increase in energy consumption.
Membrane fouling has been studied extensively on a macroscopic level, mainly by correlating the flux decline of a filtration process with models [6,7,8,
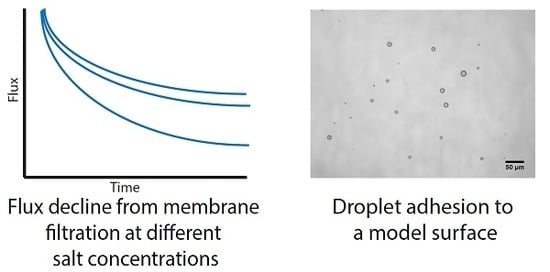
9]. The more microscopic interactions between particles or, in this case, oil droplets, and the membrane surface are harder to study in-situ. In the case of oil droplets on a membrane, the interaction between the oil droplets and the membrane surface will determine much of the fouling behavior. Droplets can deform, coalesce and spread out on the membrane surface. In contrast to hard particles, which form a dense but permeable cake layer on top of the membrane surface, oil droplets can also form a film of oil on the surface, with an even more detrimental effect on the flux [5]. Direct observation of oil droplets on a membrane surface is therefore an important step towards better understanding membrane fouling by oil-in-water emulsions. In addition, understanding the interactions between oil droplets and the membrane surface is a first step towards better tailoring membrane filtration processes to their feed stream in the future.
Many different optical and spectroscopic techniques have been used to investigate the process of membrane fouling [10]. Most of these techniques can be applied only in quite specific situations or systems, or require elaborate optical devices. Altmann and Rippeger used a laser triangulometer to measure the layer thickness of either diatomaceous earth or silica particles on a membrane during crossflow filtration [11]. Based on their model, they concluded that smaller particles attach easier to the fouling layer than larger particles or aggregates, and that the latter are the only particles that can be detached from the layer once attached. They also concluded that by changing the operating parameters of the filtration process, the layer characteristics can be changed. Li et al. used direct observation through the membrane (DOTM) to study the deposition of either yeast or latex beads on the membrane surface [12]. The membrane in this case was an anodized aluminum membrane with see-through pores, which allowed them to place the microscope on the permeate size. They determined that the particle deposition on the membrane was largely dependent on a critical flux, which depends on the crossflow velocity. In addition, they discovered that initial deposition of particles causes more particles to deposit on the membrane. Mores et al. performed direct visual observation of yeast deposition on membranes in a specialized membrane cell and with colored yeast on a cellulose acetate and an anodized alumina membrane [13]. By mounting the microscope on the feed side of the membrane, they could observe the yeast particles during filtration, but also during and after a backflush routine. Vanysacker et al. studied biofouling in a high throughput crossflow membrane filtration system by placing it in a confocal laser scanning microscope system [14]. They combined this technique with SEM and optical microscopy to study the formation of a biofilm. By running multiple experiments simultaneously in this setup, they yielded reproducible results for statistical analysis. Fux and Ramon studied the behavior of surfactant-stabilized oil droplets on a membrane surface in the presence of a transmembrane flow [15]. By studying the deformation of individual oil droplets on the membrane surface using a confocal microscope, they discovered that the transmembrane flow and the force exerted on the droplet determine the adhesion to the surface. To properly model this behavior, they proposed a modified capillary number. At higher forces and thus higher deformation, droplets are harder to remove, in some cases the adhesion is irreversible. Di et al. developed a microfluidic system in which a polyethersulfone membrane was mounted and subsequently fouled by latex microbeads [16]. The whole system was placed in a confocal microscope, enabling them to acquire 3D time-sequenced images of the fouling layer. They observed that at increasing ionic strength, less latex particles deposited, but they formed more aggregates than at lower ionic strengths [17].
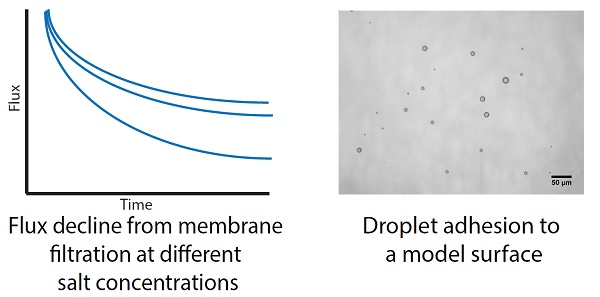
In this chapter, we investigate the correlation between droplet adhesion on a model surface and fouling during crossflow membrane filtration. A recently developed flow-cell approach allows us to directly observe droplet adhesion to a model surface. The strength with which droplets are adhered to a surface can give an indication of the fouling potential of the oil droplets in an emulsion. Because the technique is relatively easy and fast, multiple parameters can be taken into account. In the case of produced water, which is a complex mixture of different components, this can prove useful to study the influence on fouling of each of those components. Membrane fouling by produced water, which fouls much more severely than other (less complex) oil-in-water emulsions, is still poorly studied, and this technique can contribute to extending our knowledge on the subject [5]. For produced water, where a complex emulsion is often stabilized by charged surfactants, especially the ionic strength of the solution is expected to be key to oil droplet adhesion at the interface and subsequent cake layer build-up. Indeed in a recent study, the strength of adhesion of surfactant stabilized oil droplets was found to be strongly affected by the ionic strength, both on a hydrophobic and charged hydrophilic surface [18].
Although the flow cell has no permeation interface, the membrane and model surface are chemically identical (cellulose). The emulsion used for both flow cell and membrane filtration is also identical, with well defined characteristics. We directly observe the adhesion between the oil droplets in feed stream and the cellulose surface in the flow cell. From this, we know how much droplets stick to the surface, but by increasing the shear force we can also determine how strong the droplet-surface interactions are. In the membrane filtration experiments we observe the flux decline caused by fouling. The kinetics of this fouling can tell us how the fouling is formed and what the characteristics of the layer are.

2. Materials and Methods

To prepare the emulsions and flush solutions for all experiments, we used de-ionized (DI) water, sodium dodecyl sulfate (SDS, Sigma Aldrich 75746, Zwijndrecht, the Netherlands), n-hexadecane (Merck Schuchardt OHG 820633, Darmstadt, Germany), and sodium chloride (NaCl, Boom 51275, Meppel, The Netherlands). For the glass surface modification we used trichloromethylsilane (Sigma Aldrich M85301, Zwijndrecht, the Netherlands) and trimethylsilylcellulose (TMSC, Artecs bv, Hengelo, the Netherlands), prepared via the protocol in [19], but without addition of the catalyst. The membranes we used were regenerated cellulose membranes on a polyethylene terephthalate (PET) support with a molecular weight cutoff of 500 kDa (Microdyn Nadir UC500, Wiesbaden, Germany). All chemicals were used without further purification steps.

2.1. Emulsion Preparation

To ensure all emulsions have the same characteristics, a stock emulsion was prepared under standard conditions, which was then diluted with carefully chosen concentrations to obtain the desired oil, salt and surfactant concentration for the membrane experiments and the flow cell. The stock emulsions were prepared by dissolving 463 mg/L SDS in 1 L of DI water in a Duran® bottle (Duran 21801545, Boom, Meppel, The Netherlands) by mixing with a dispersing mixer (IKA® T25 digital Ultra-Turrax with S25N 18G element, Boom, Meppel, The Netherlands) for 2 min at 14,000 rpm. Then, 2 g of n-hexadecane was injected near the mixer head and mixed for 10 min at 14,000 rpm. For the membrane filtration experiments, the stock emulsion was diluted to make up 20 L of emulsion with 100 mg/L hexadecane, 463 mg/L SDS and 1, 10 or 100 mM NaCl, which was then stored in a glass 20 L bottle.
For the flow cell, the stock emulsion was diluted to contain 1 g/L hexadecane, 463 mg/L SDS and 1, 10 or 100 mM NaCl. The concentration of hexadecane in the emulsions for the flow cell was chosen higher than the concentration of oil in the membrane filtration experiments to ensure enough droplets would be visible in the flow cell. Surfactant solutions used for rinsing and for applying shear were prepared the same as the emulsions, but without hexadecane. The concentrations of surfactant and NaCl were identical to the emulsion used in each experiment. After preparation, the surfactant solutions were degassed under vacuum and ultrasonic sonication for 15 min, followed by 15 min of only vacuum. The emulsions were not degassed, as this was not to be found necessary. Furthermore, surfactant solutions were also used for all contact angle and interfacial tension measurements. While in this work no zeta potentials where obtained of the emulsions, these SDS based emulsions are known to be strongly negatively charged (zeta potentials of −60 to −100 mV) for similar SDS concentrations and ionic strengths [20].

2.2. Glass Preparation for Flow Cell

Microscope glass slides (VWR 631-1552, Boom, Meppel, The Netherlands) were washed with DI water and ethanol, dried in an oven and placed in a desiccator with 0.2 mL of trichloromethylsilane in a glass bottle. The glass slides were left overnight so the trichloromethylsilane could deposit on the glass slides to make them hydrophobic. A 20 mg/L solution of TMSC in chloroform was prepared by stirring overnight. To remove any solids, the solution was filtered over a steel filter with 15 μ m pores. The TMSC was spincoated on the hydrophobic glass slides by spinning at 2500 rpm for 20 s. The TMSC was then regenerated to cellulose by exposing the glass slides to a hydrochloric acid vapor by placing them in a desiccator above 37% hydrochloric acid for 15 min [19]. After regeneration, the layer thickness was determined to be 115 ± 2 nm with a roughness of 30 ± 2 nm by ellipsometry.

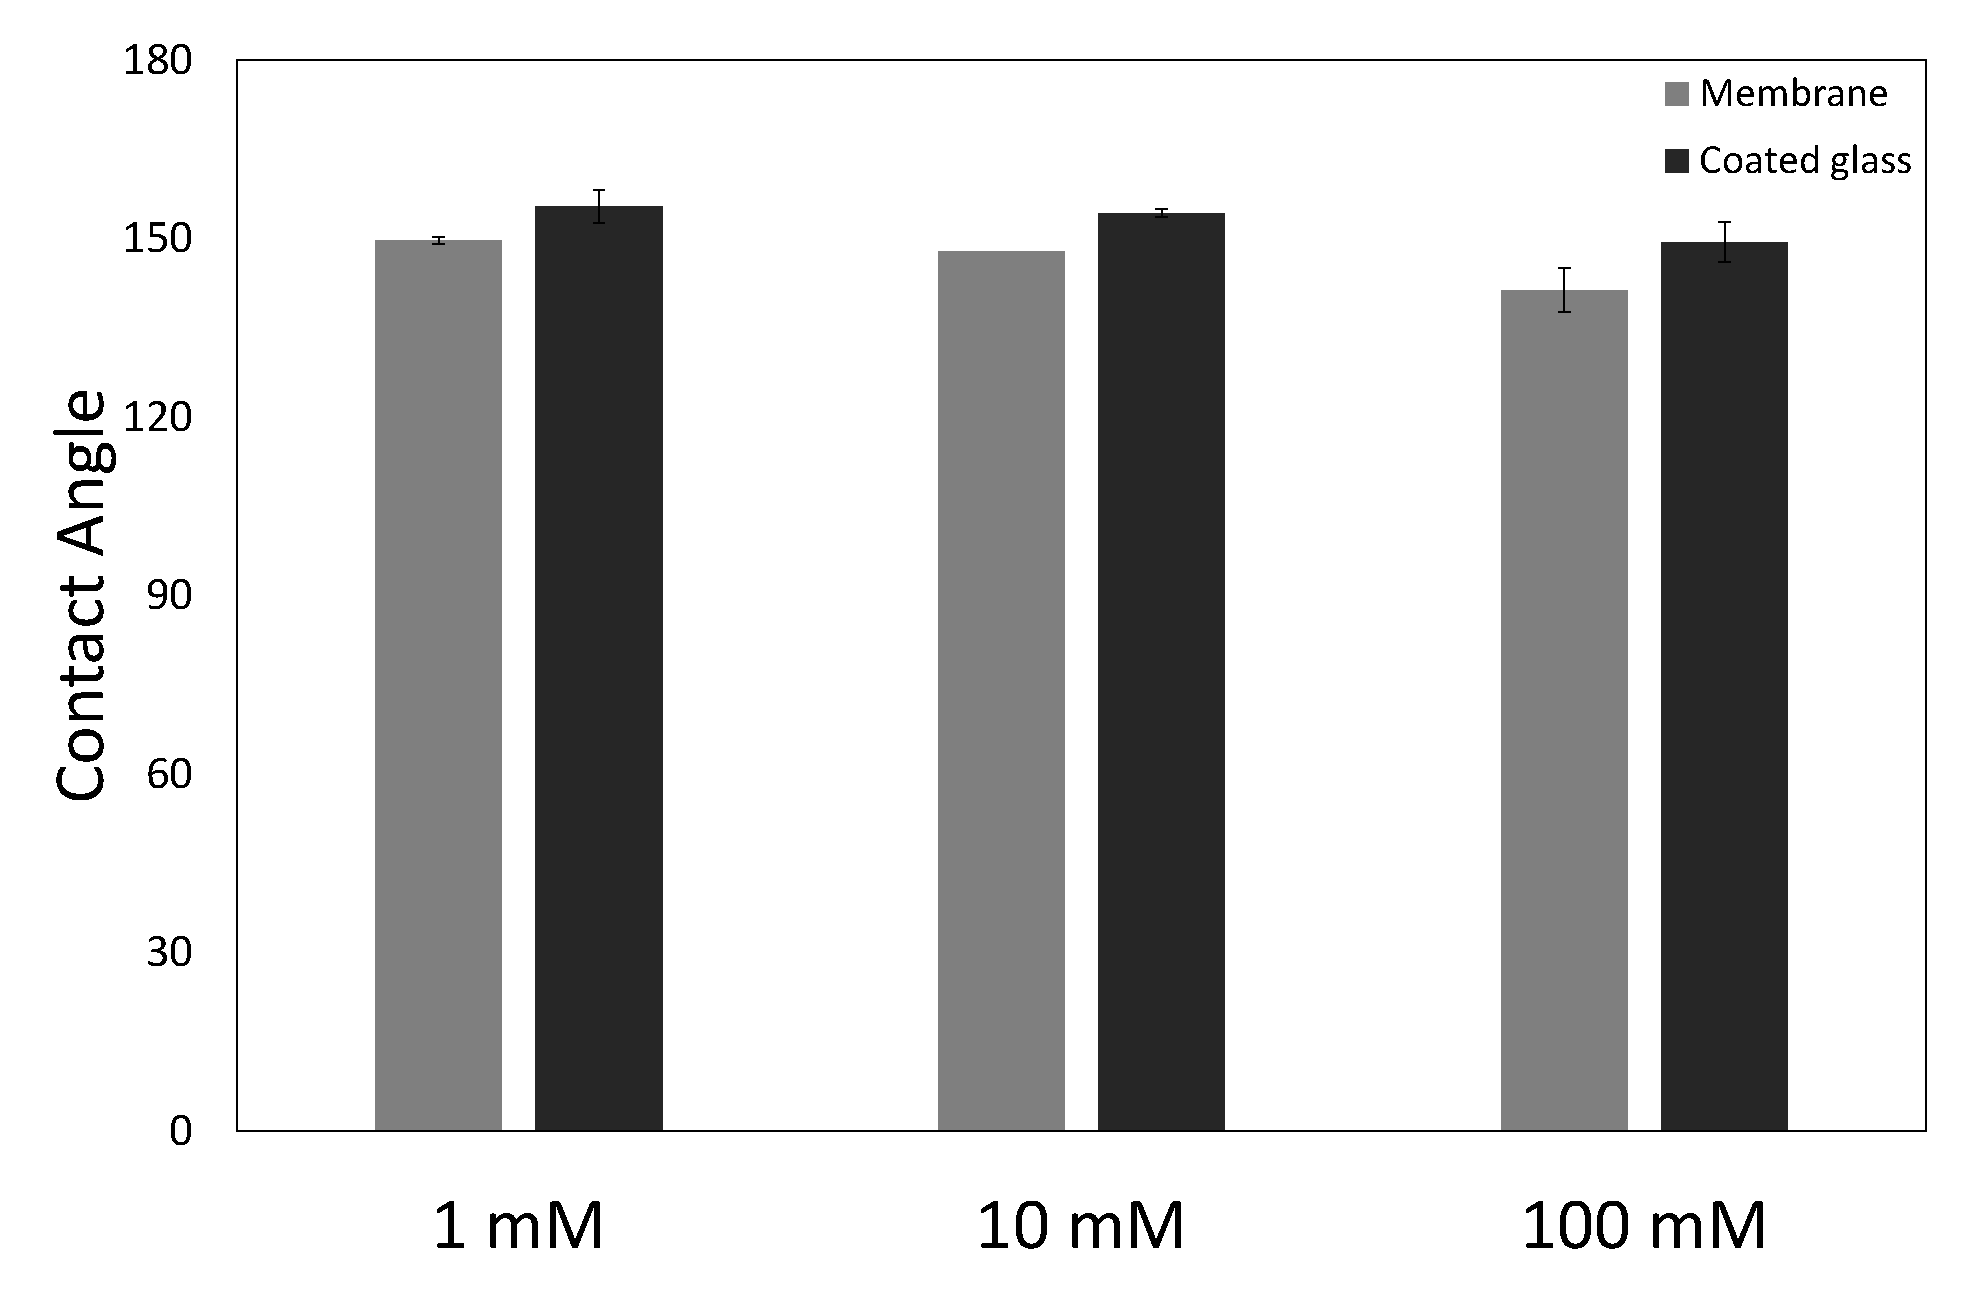
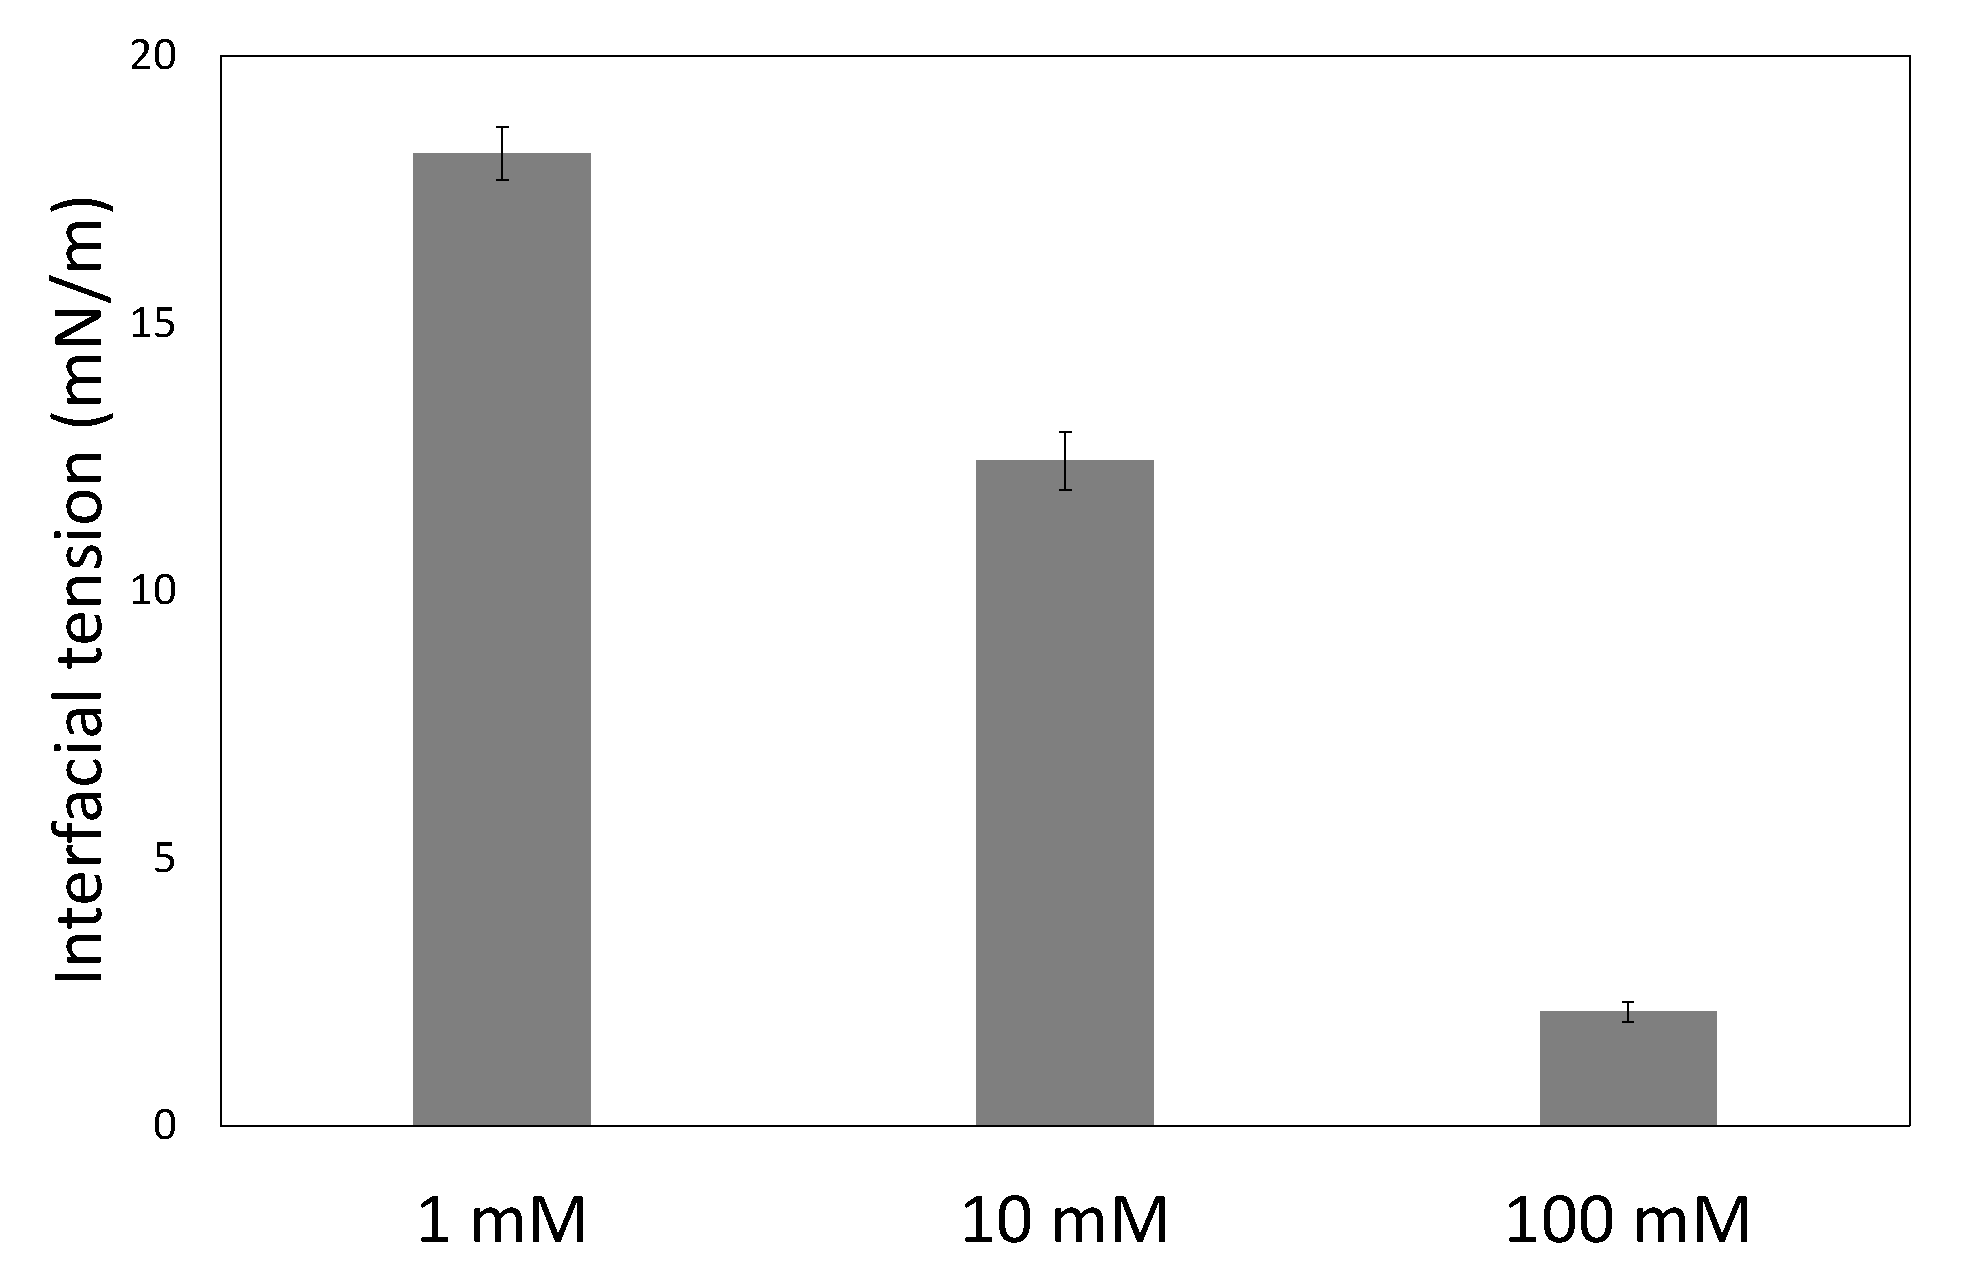
2.3. Contact Angle and Interfacial Tension Measurements

Measurements were performed on a contact angle and contour analysis instrument (Dataphysics, Filderstadt, Germany, OCA 35). The contact angle measurements were performed in captive bubble mode, where a droplet of hexadecane is captured under a cellulose coated glass slide or a piece of membrane in the aqueous solution with surfactant and salt. The interfacial tension measurements were performed with the pendant droplet technique, where a droplet of aqueous solution with surfactant and salt is suspended in hexadecane. Image analysis for both contact angle and interfacial tension measurements was performed with the software provided with the measuring instrument.

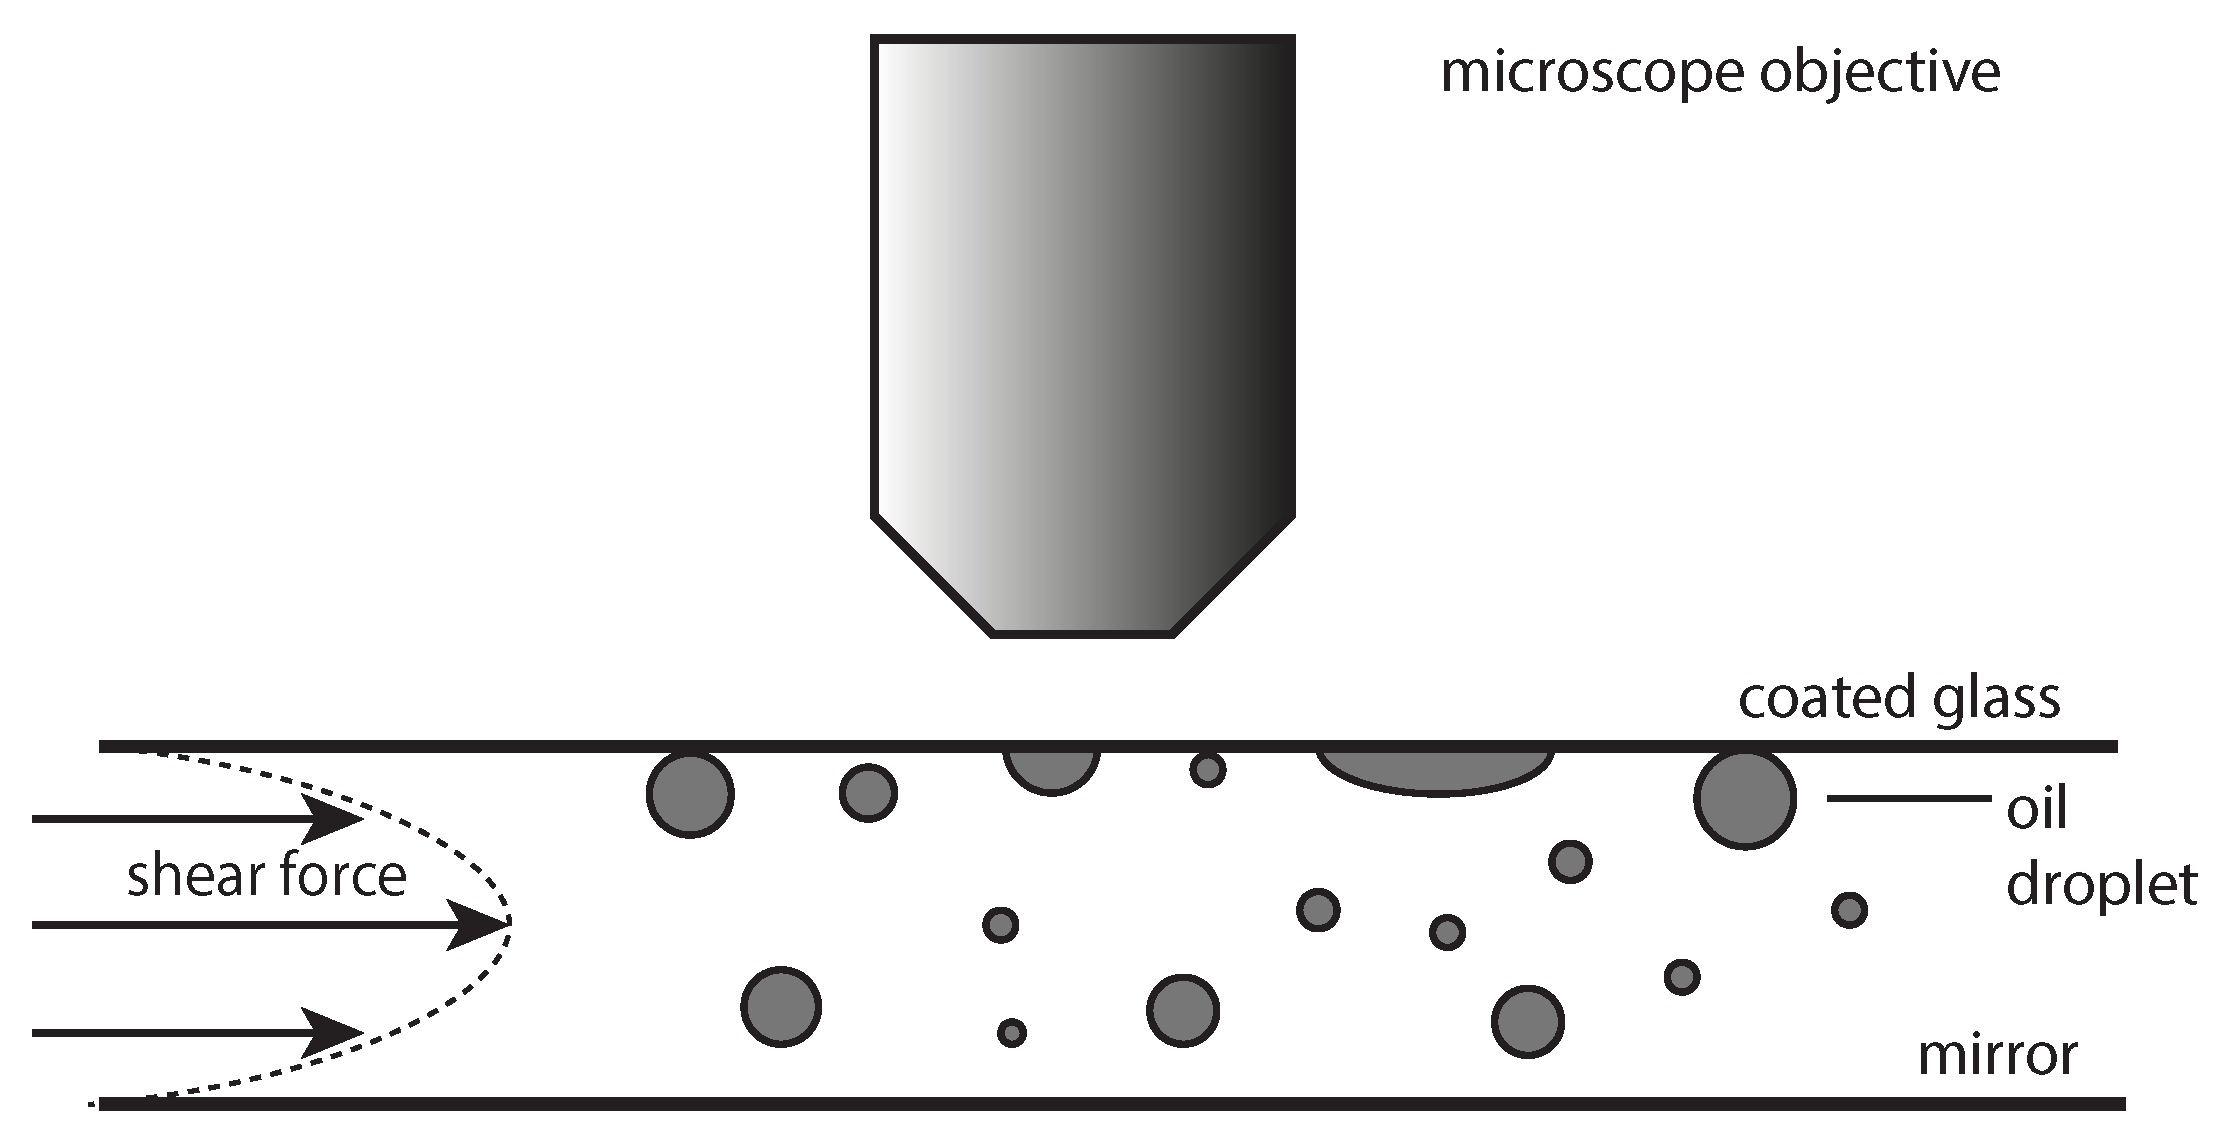
2.4. Flow Cell Setup and Operation

To measure the adhesion of oil droplets in the emulsion to the model cellulose surface, a flow cell setup was used. This flow cell has been used before in our previous work [18]. The emulsion is fed into the flow chamber by a pulseless pump, and the droplets are observed by placing the flow cell under a microscope (Figure 1). A detailed desciption of the flow cell, flow cell operation and image analysis can be found in [18].

2.5. Membrane Filtration

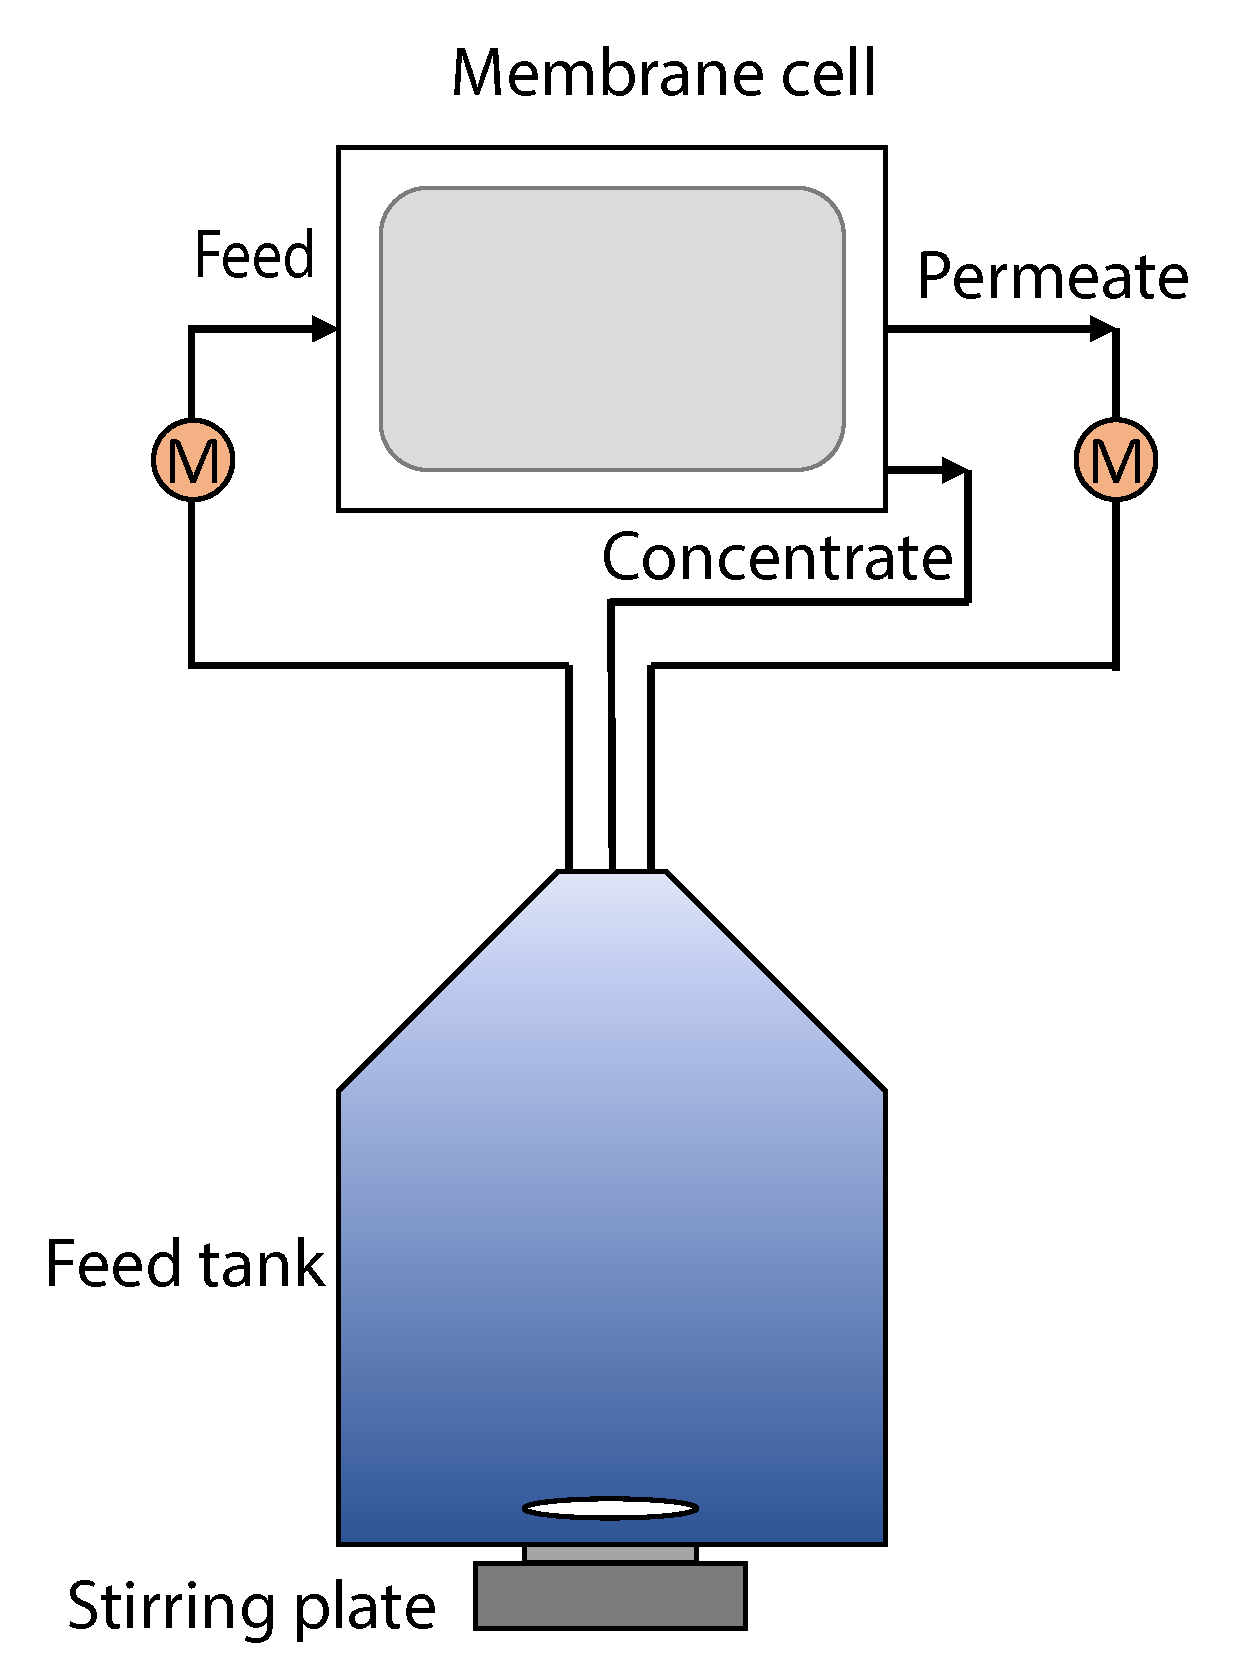
The membrane filtration experiments were performed using an OSMO -inspector crossflow membrane filtration system built by Convergence (Enschede, the Netherlands) (Figure 2). The membrane was mounted in a flat sheet crossflow membrane cell with an effective surface of 240 cm 2 , using a feed spacer with a thickness of 700 μ m, a filament angle of 90 and a maze size of 2.5 × 2.5 mm. The volume and density of the feed and permeate streams were measured by Bronckhorst M15 mass flow meters. The 20 L glass feed bottle was constantly stirred to prevent creaming of the feed. Both concentrate and permeate were recycled to the feed bottle to ensure a consistent feed quality. Before mounting the membrane, it was soaked in DI water overnight to remove production chemicals and glycerine from the membrane. Then, the clean water flux was measured under experimental conditions because the membrane sheets provided were not uniform (Supplementary Information 1). A membrane filtration experiment consisted of filtering for 3 h at a transmembrane pressure (TMP) of 1 bar and a flow rate of 48 kg/h, which corresponds to a crossflow velocity of 0.2 m/s. The permeate flux was constantly monitored. To clean the membrane, the cell was flushed with DI water for 1 h without applied pressure, then a backflush with DI water of 3 min at 0.2 bar, and then another flush. After the cleaning, the clean water flux was measured again to determine the flux recovery.
The amount of oil in the permeate was determined by liquid-liquid extraction with hexane followed by HPLC. The extraction protocol can be found in Supplementary Information 2. To check the stability of the emulsion during the experiment, emulsion characteristics where checked before and after the experiment on a number of occasions. As the emulsions used in this study are quite stable, only small changes where observed. Typically the oil concentration decreased by 10–20% while also the average droplet size decreased by 10–20%. The decrease in oil concentration was taken into account when calculating the end of experiment oil retention.
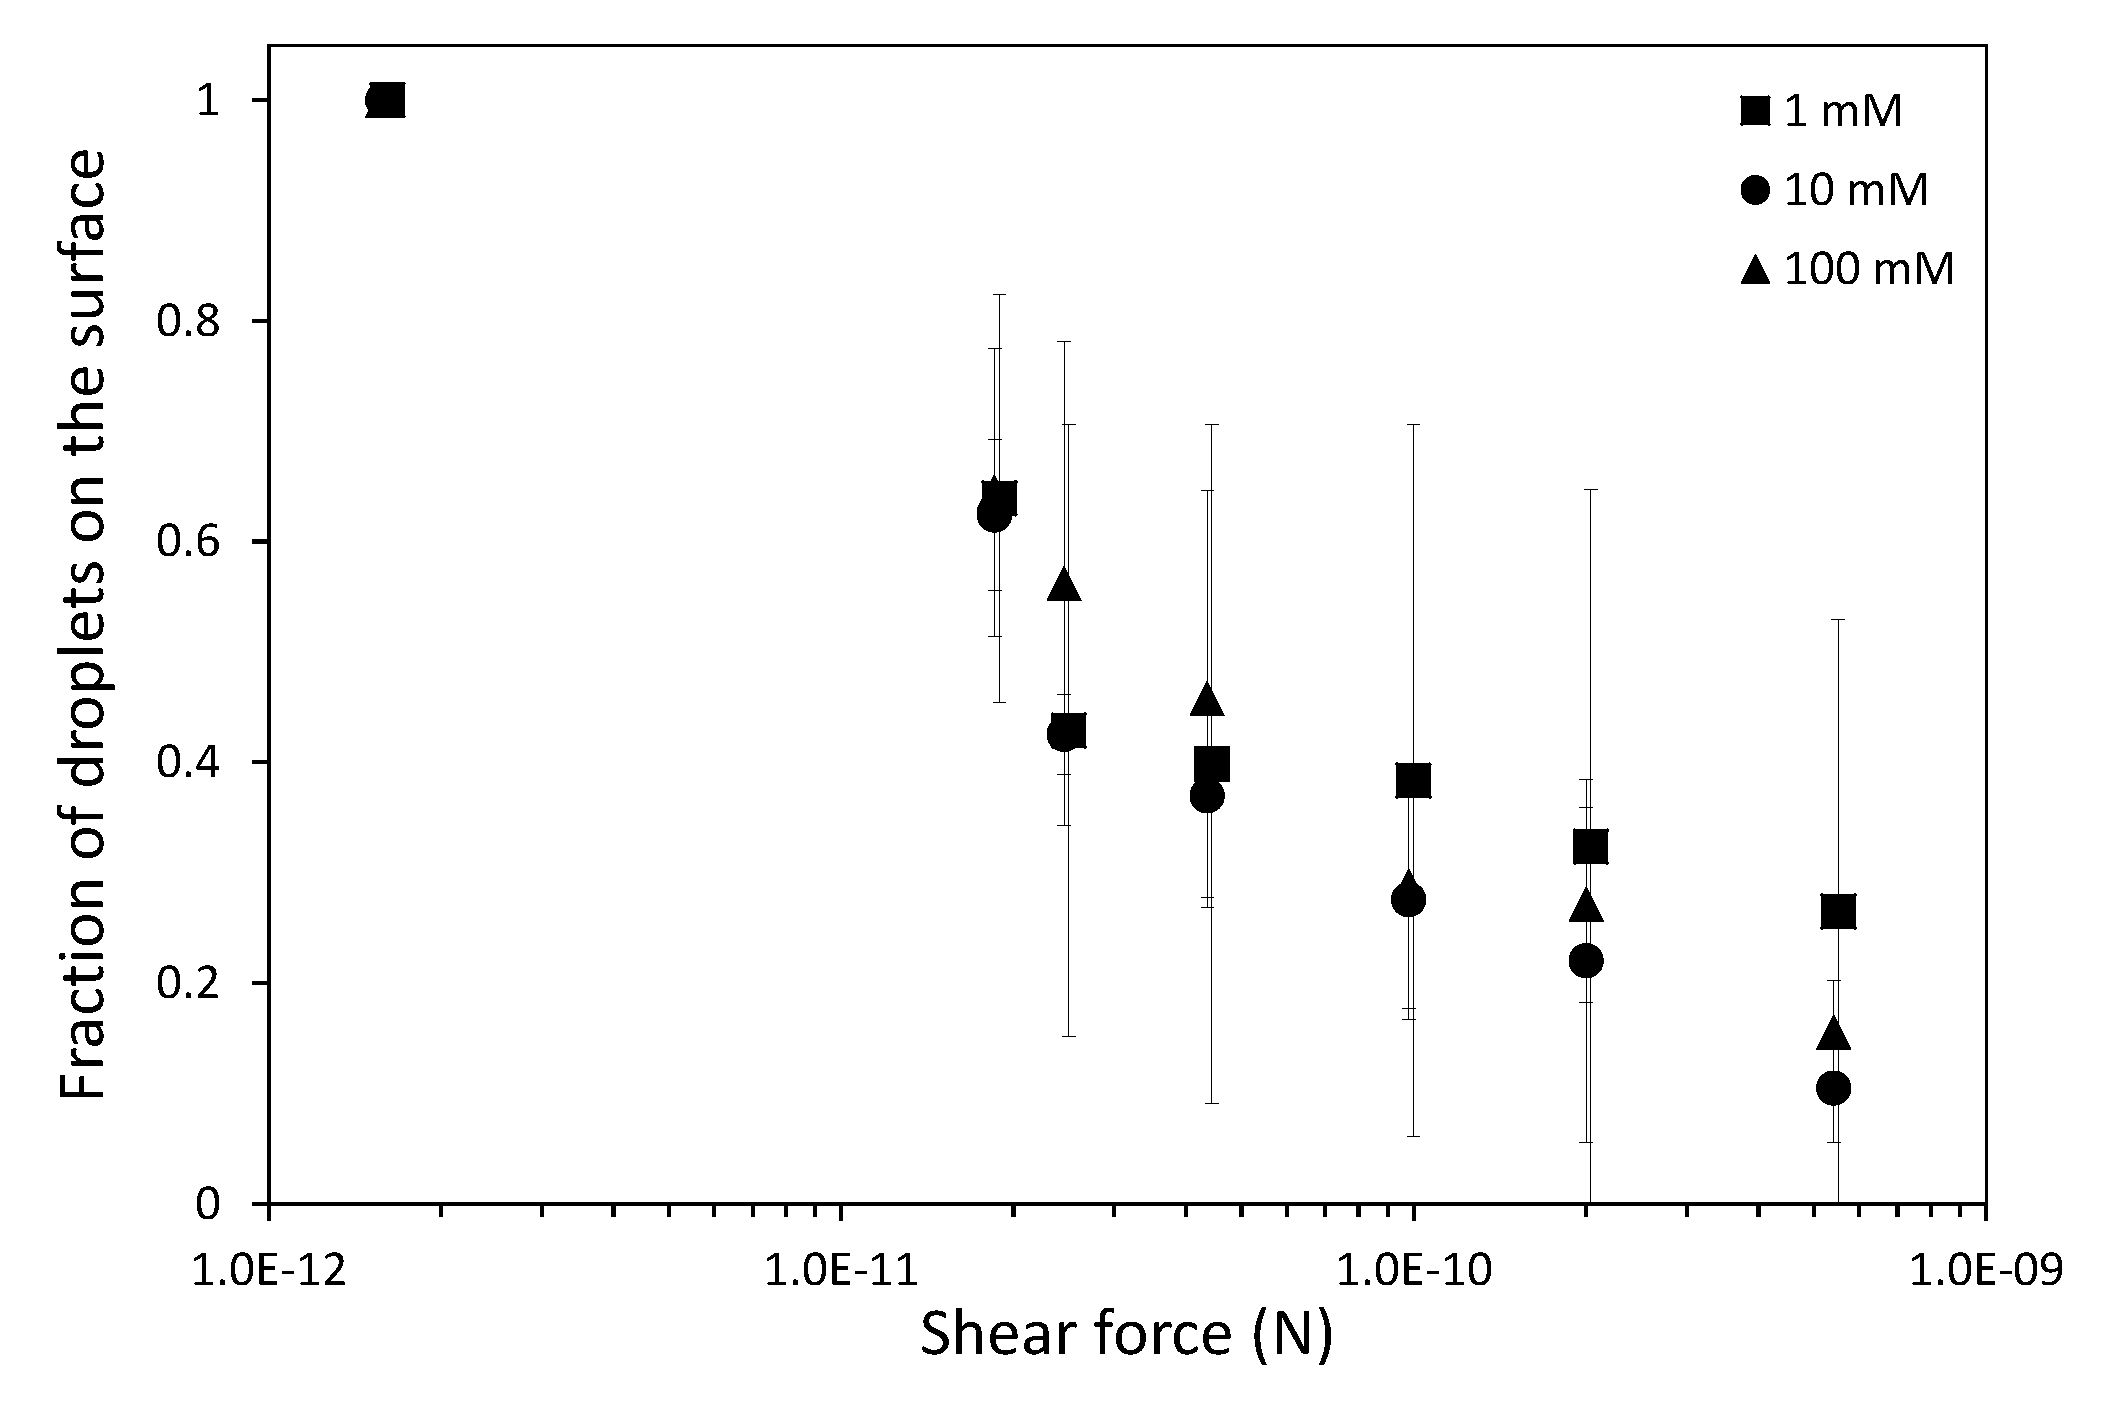
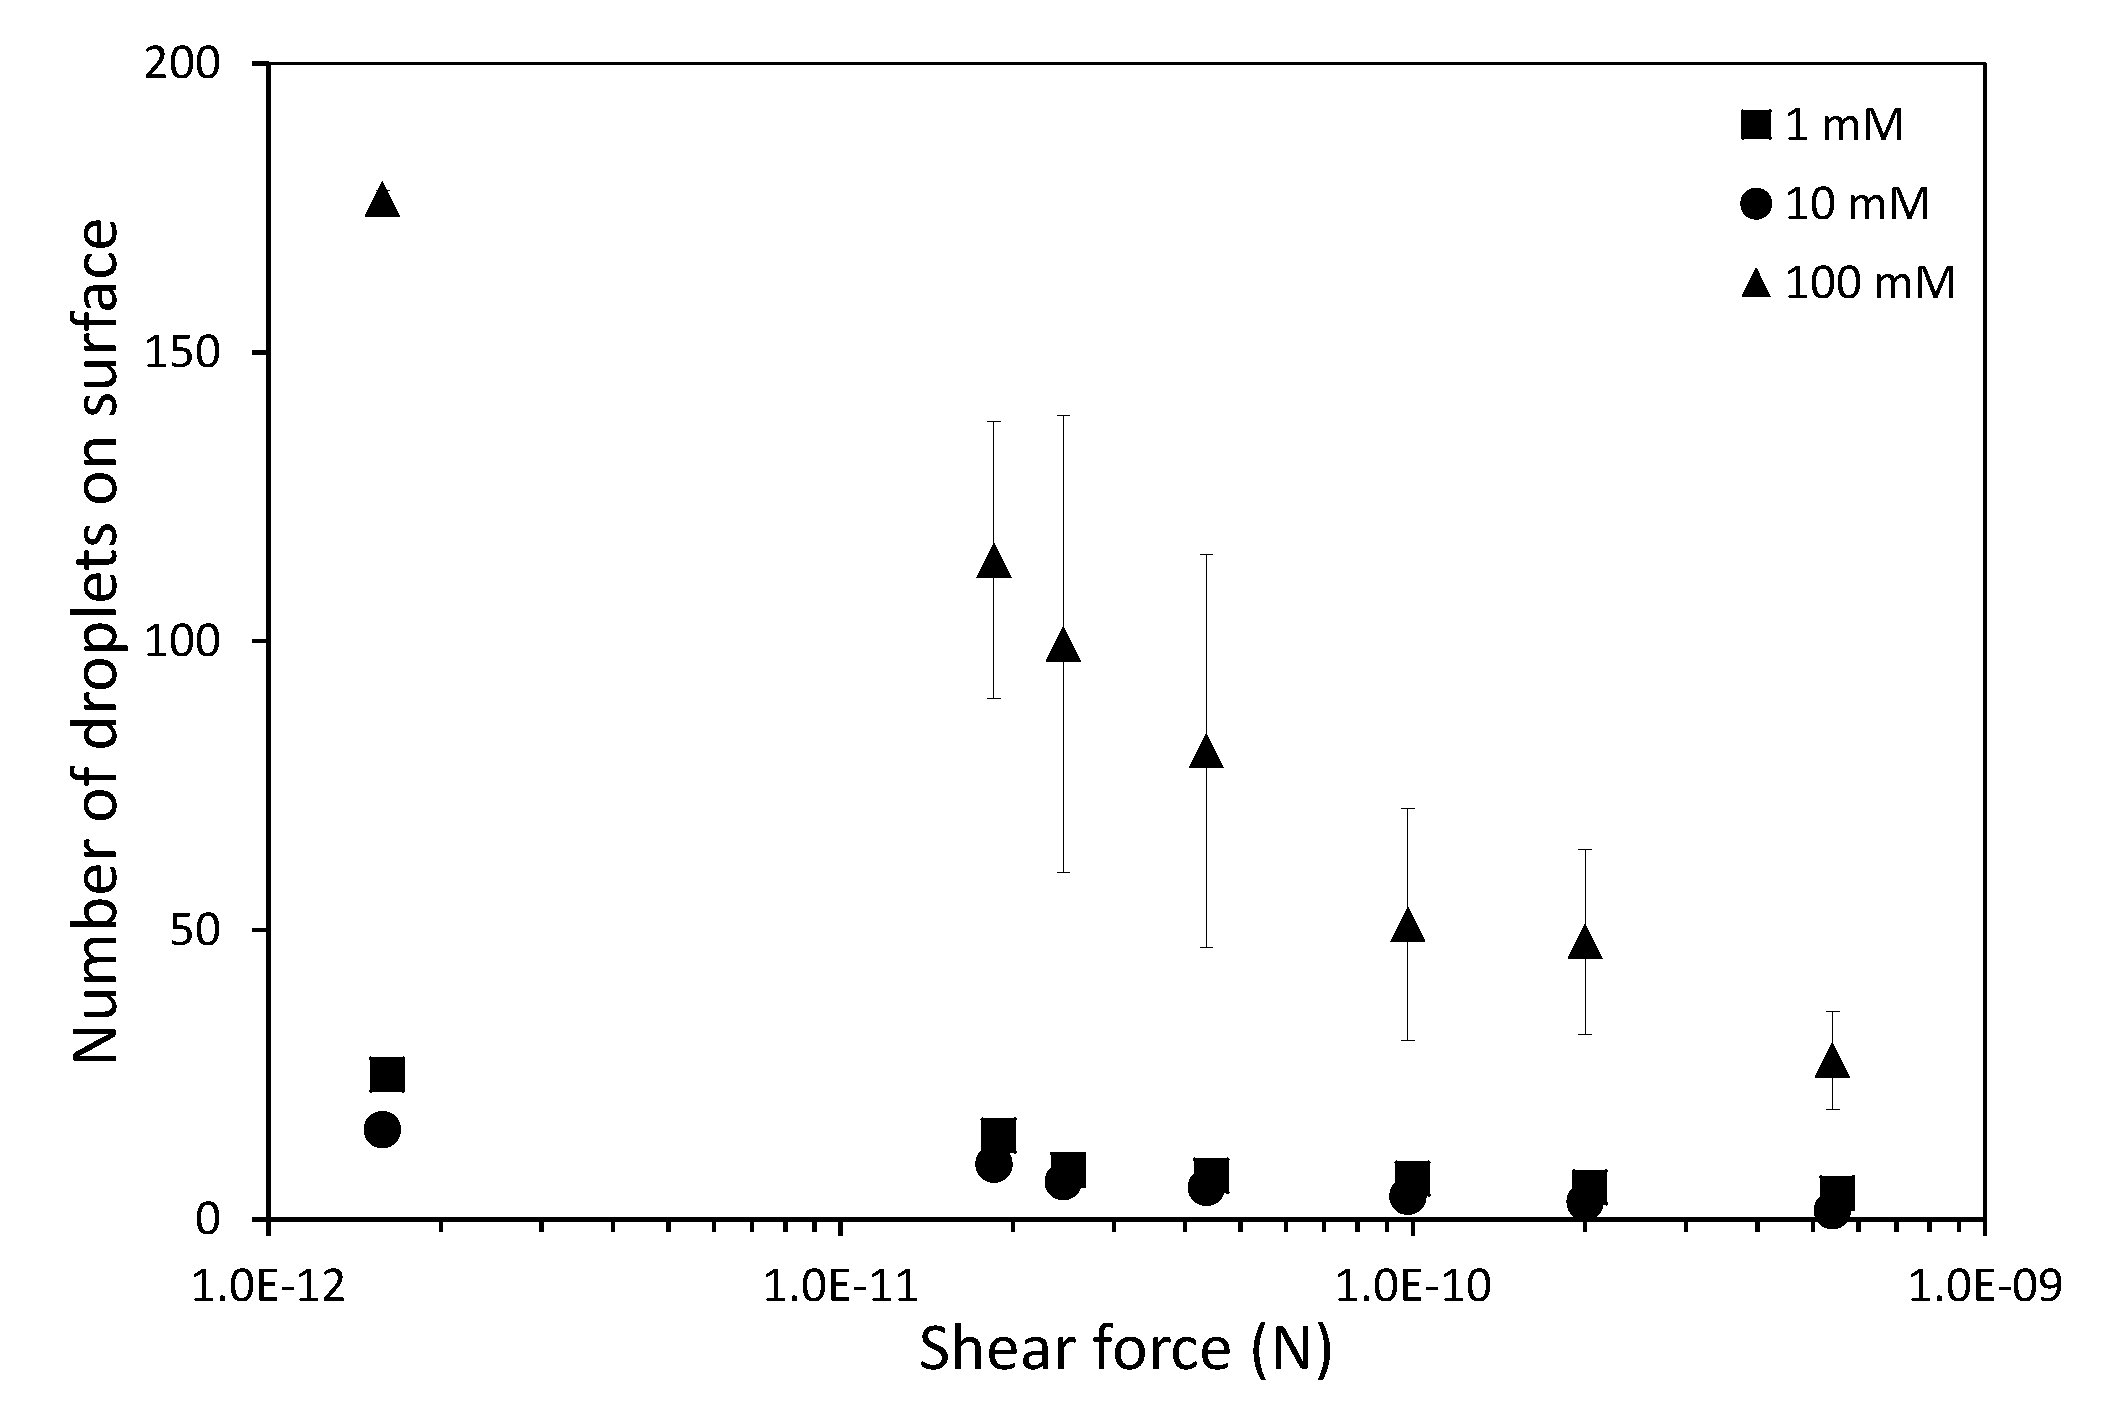
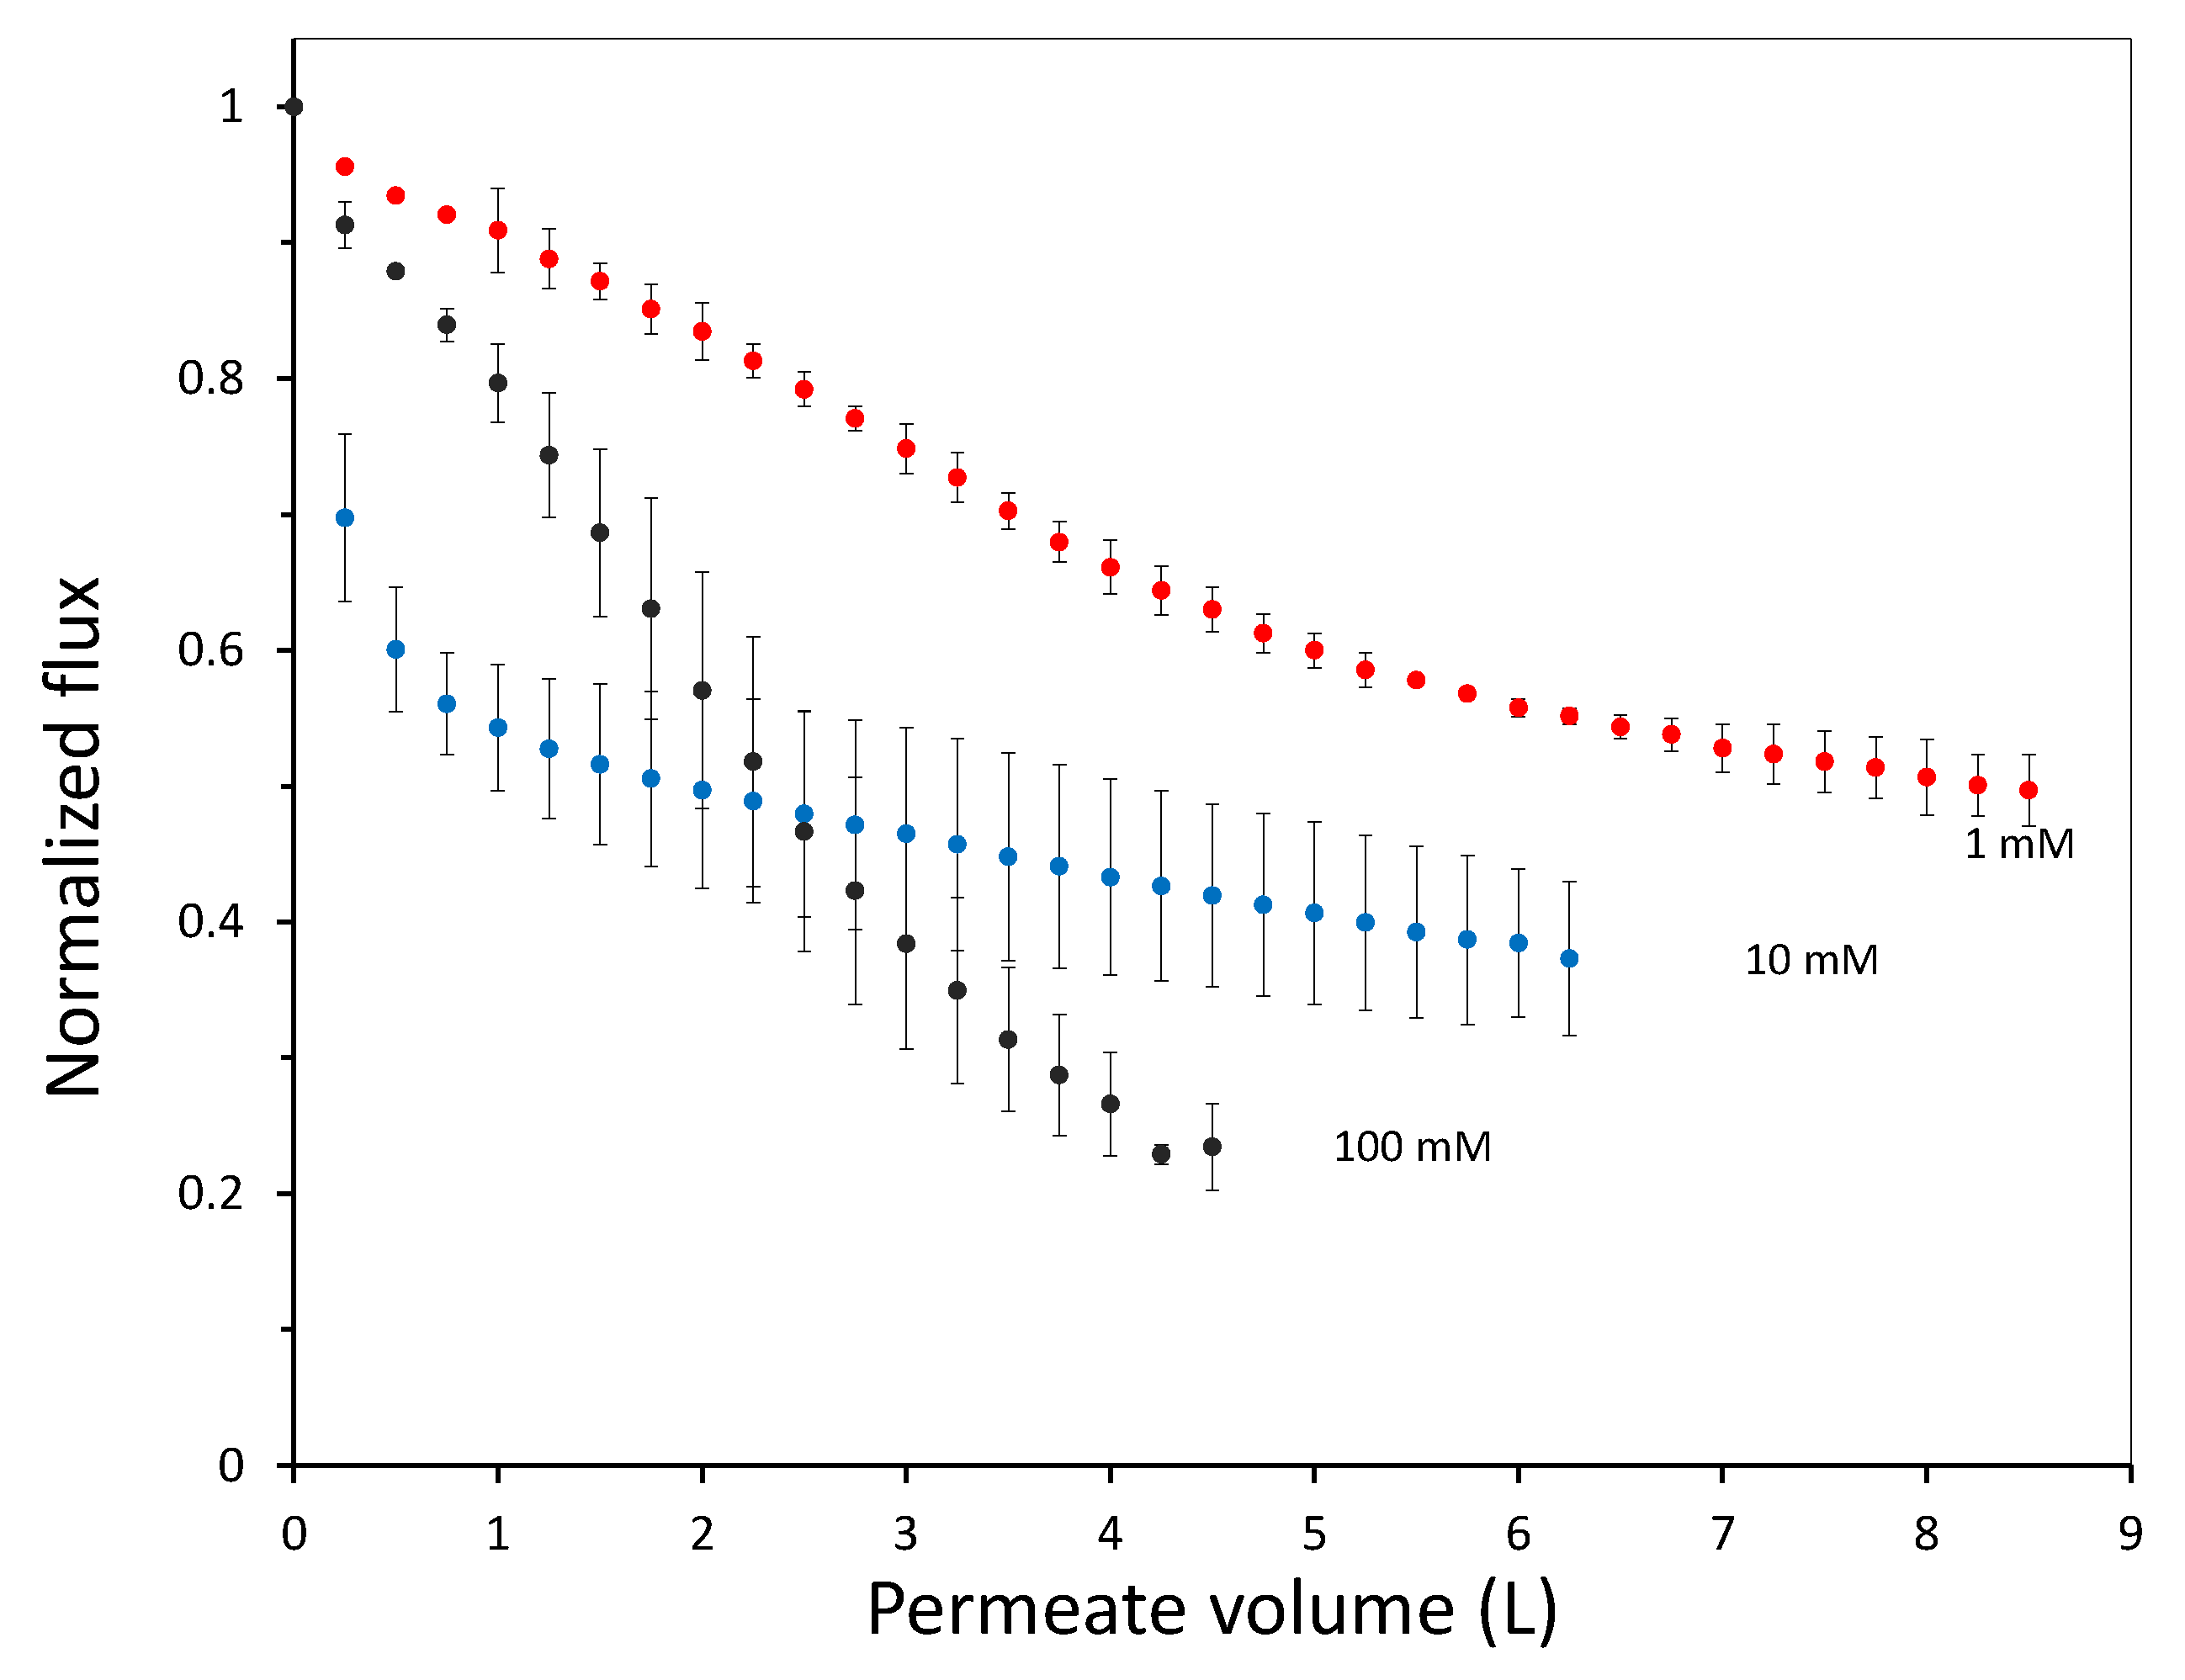
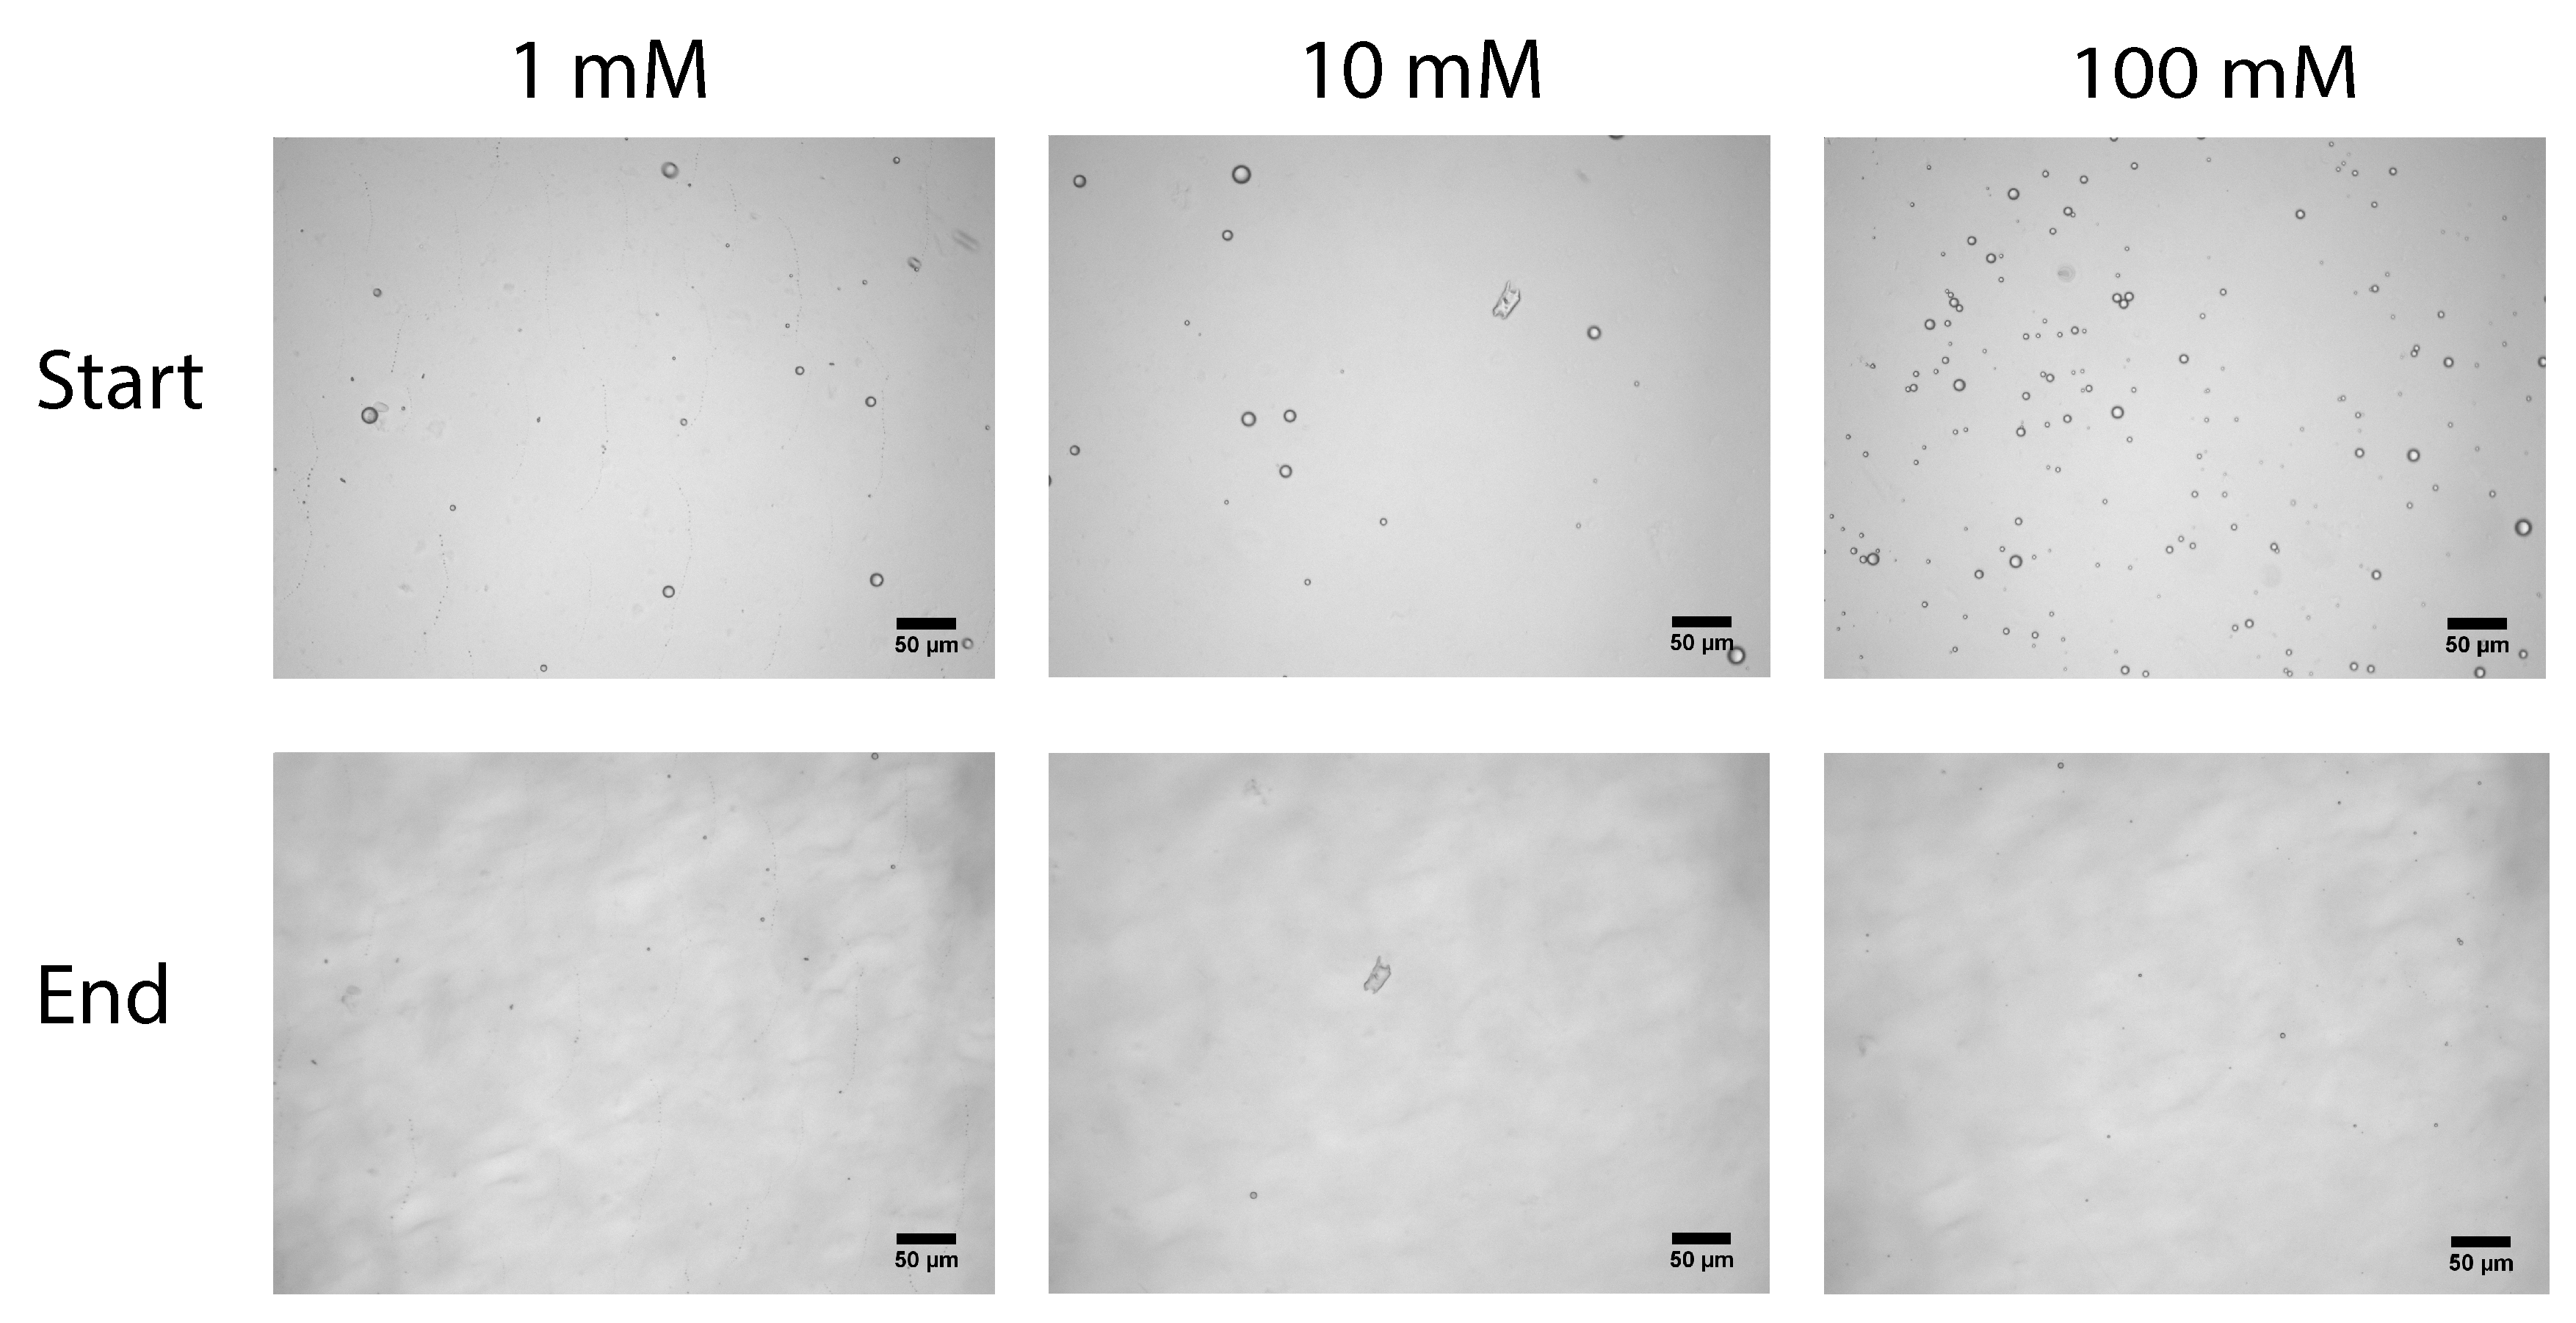
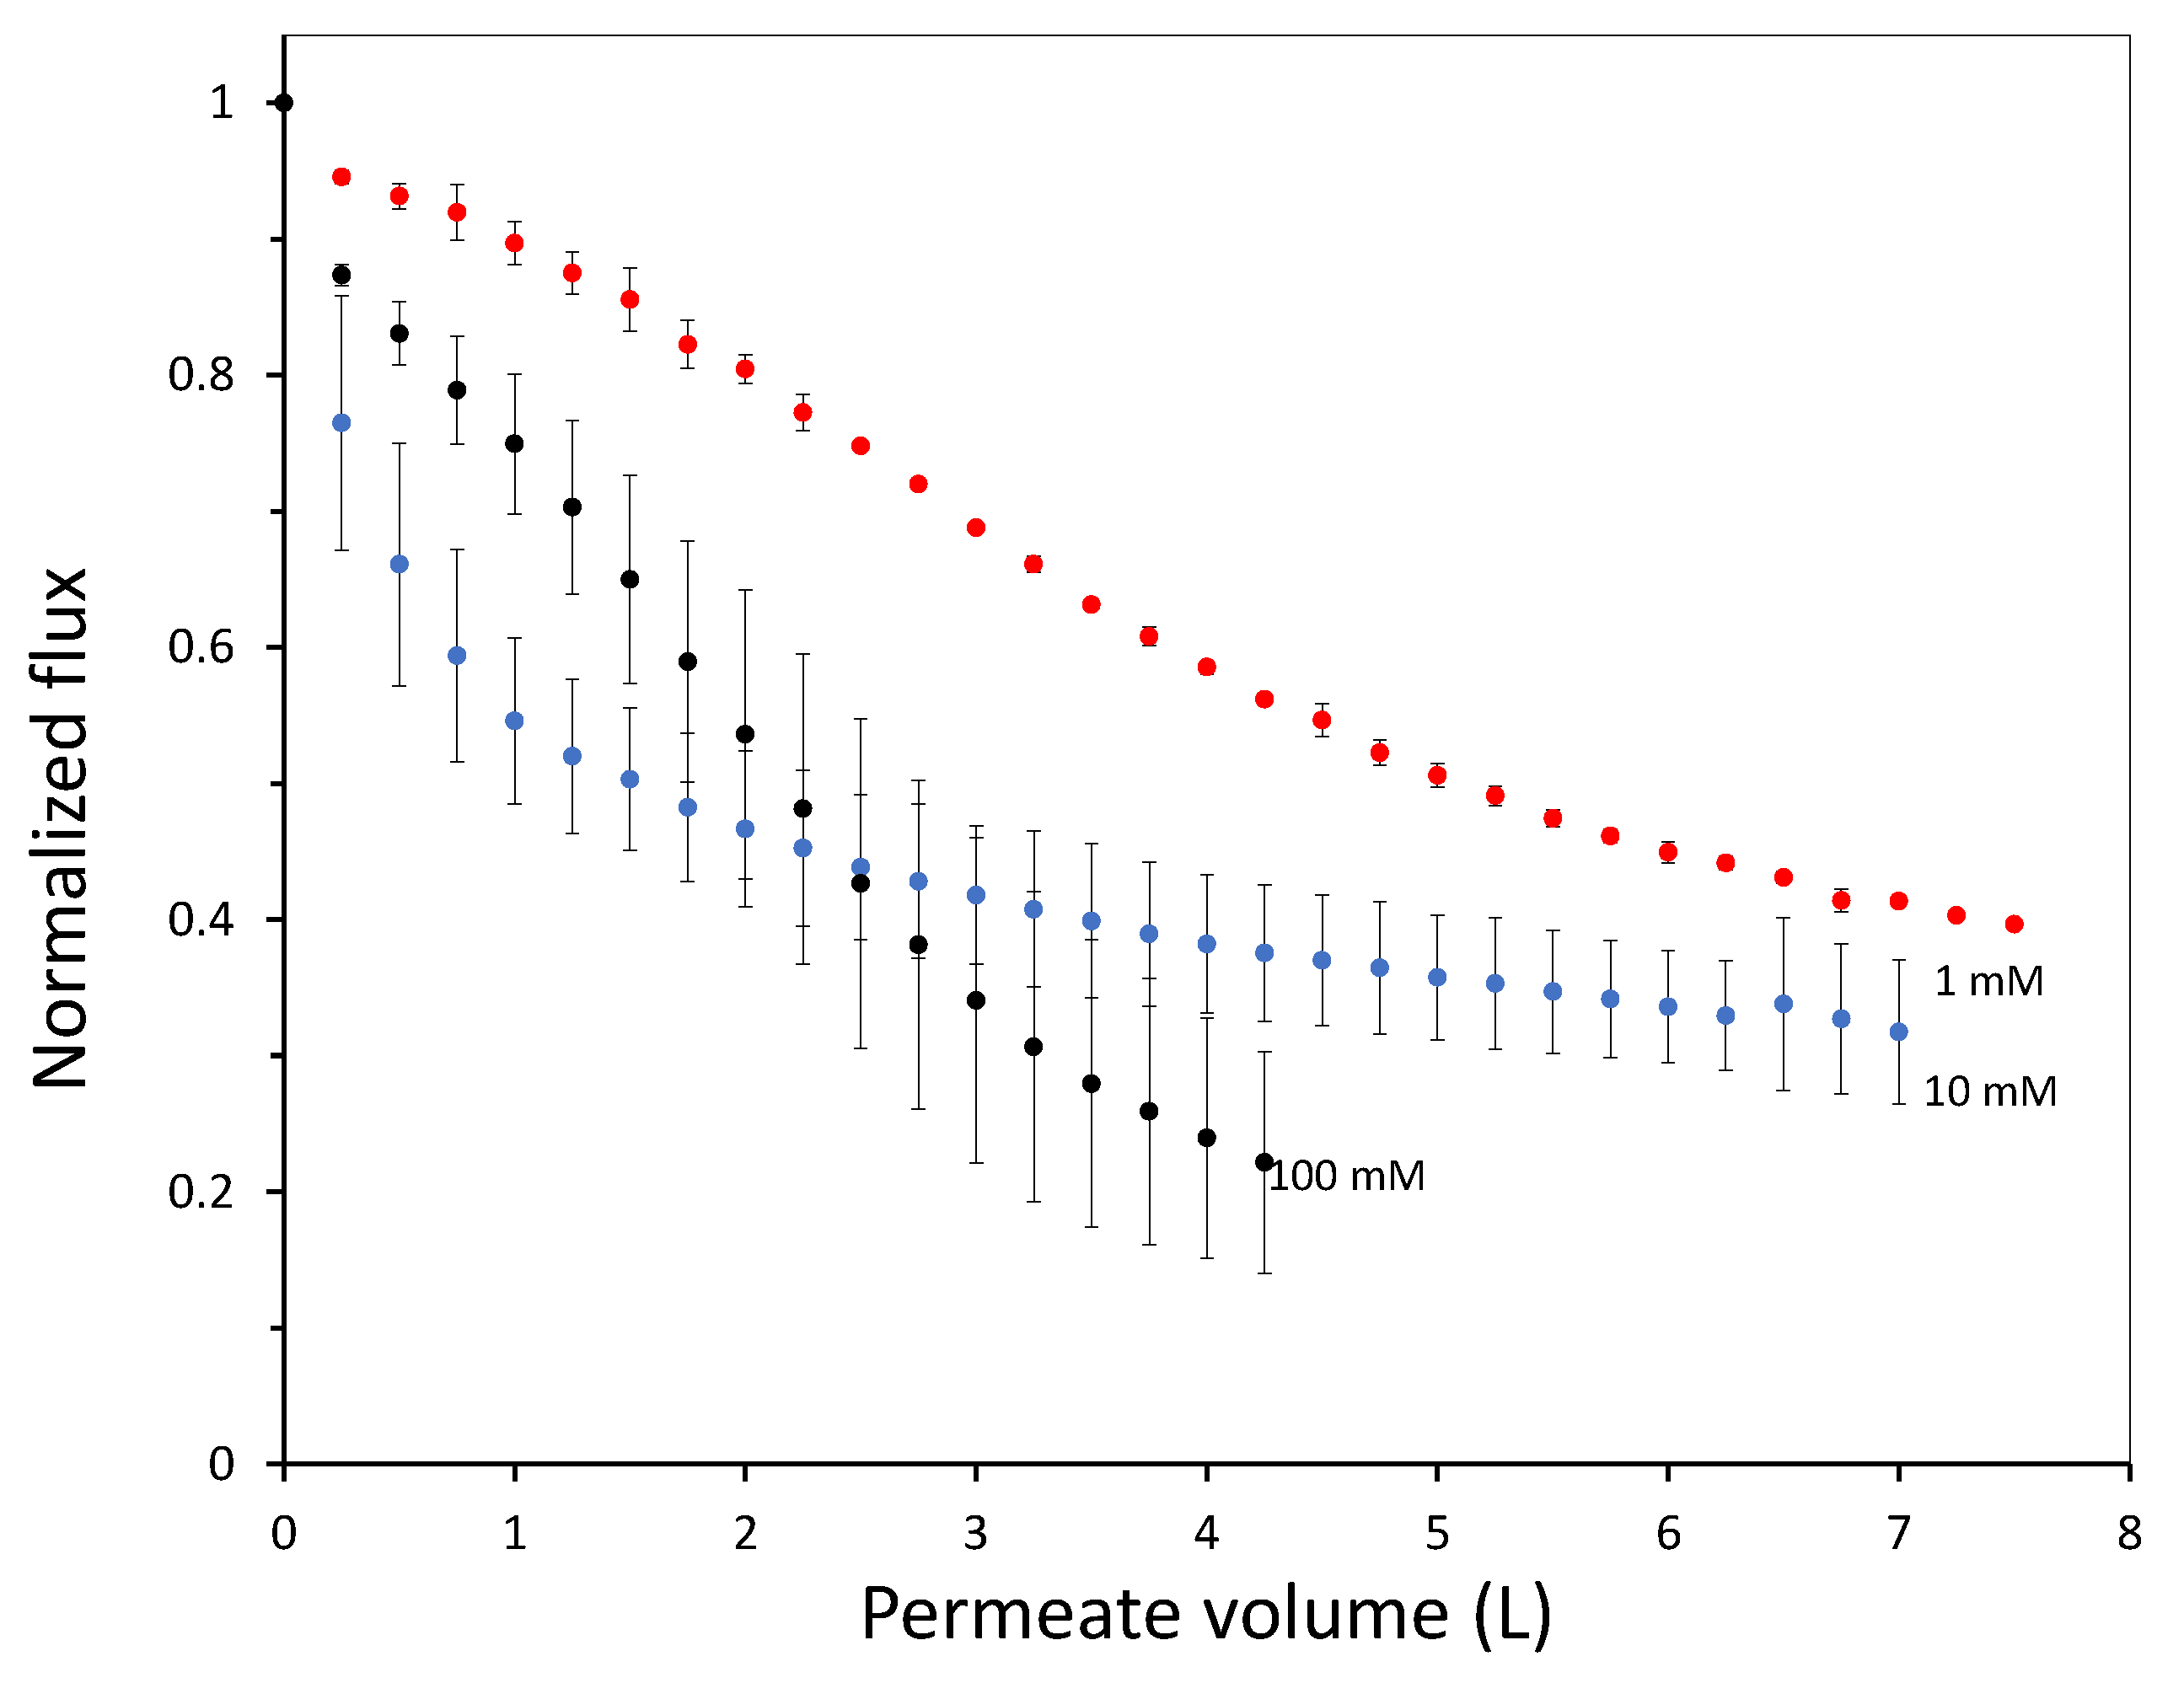
3. Results and Discussion

This results and discussion section is split into three distinct parts. First, emulsion characteristics and emulsion surface interactions are discussed from measurements on the the contact angle of oil droplets in a surfactant solution with the cellulose surfaces and the interfacial tension of oil in the surfactant solution. Secondly, a study of oil droplets attachment to the cellulose surface in the flow cell will give us an indication of the strength of adhesion between droplets and the model surface, which will be used in the third part to help explain fouling observed in an actual membrane filtration experiment.

3.1. Contact Angle Measurements

The contact angle measurements were performed in captive bubble mode, in which a droplet of oil is injected under the surface of interest. In this configuration, a large contact angle indicates a hydrophilic surface and a small contact angle a hydrophobic surface. The measured contact angles of the cellulose coated glass model surfaces and the membrane surfaces for 1, 10 and 100 mM NaCl are shown in Figure 3. On the membrane, the contact angle is 150 ± 1 for 1 mM NaCl, 148 ± 1 for 10 mM NaCl and 141 ± 4 for 100 mM NaCl. On the glass, the contact angles are 155 ± 3, 154 ± 1 and 148 ± 3 for 1, 10 and 100 mM respectively. All measured contact angles are above 140 , which indicates the surfaces are all hydrophilic [21]. This is to be expected, because cellulose has hydrophilic OH groups. Even after 10 min of contact time with the surface, the droplet displayed a stable contact angle. The contact angles measured on the membrane is in all cases about 5 degrees lower than the contact angles measured on the cellulose model surface. This might indicate that the membrane surface is more hydrophobic, but is more likely due to higher surface roughness and air pockets trapped in the membrane pores [22]. At increasing ionic strength, there seems to be a very small decrease of the contact angle on both surfaces, indicating a tiny increase in hydrophobic interactions. The cellulose surface will be slightly negatively charged due to dissociation of surface OH groups, while the droplets are also negatively charged because of the anionic surfactant. At higher salt concentrations the repulsion between droplet and surface is decreasing, allowing a small decrease in contact angle.

3.2. Interfacial Tension Measurements

The interfacial tension was measured by suspending an aqueous droplet in hexadecane and using the Laplace equation for contour analysis. The results are shown in Figure 4. The interfacial tension of the droplets goes down with increasing ionic strength, because the ions screen the charge repulsion between the SDS headgroups. This allows more SDS to adsorb on the interface, lowering the interfacial tension. By using the Gibbs adsorption equation, Γ = C R T d γ d C , we can make an estimate of the amount of surfactant adsorbed to the surface. By fitting the interfacial tension data with the Szyszkowski-Langmuir adsorption isotherm and inserting the obtained d γ d C into the Gibbs-equation, we find 0.5 μ mol/m 2 for 1 mM NaCl, 1.5 μ mol/m 2 for 10 mM NaCl and 2.0 μ mol/m 2 for 100 mM NaCl. An increase in surfactant on the surface gives an increasing surface charge, but since the salt concentration in the aqueous phase is also higher, electrostatic screening increases at the same time. Overall, this means the electrostatic repulsion between droplets and droplets and the model surface goes down with increasing ionic strength.

3.3. Flow Cell

As shown in previous work [18], the amount of droplets attached to the surface of the flow cell is an indication of the adhesion force between droplets and surface. In the current work, we coated the glass surface of the flow cell with a thin cellulose layer. In Figure 5, microscopic images are shown from the flow cell setup. As can been seen, the cellulose layer is optically transparent and flat. For 1 and 10 mM of NaCl, not many droplets stick to the cellulose surface, which can be observed all over the flow cell window. At 100 mM NaCl, the amount of adsorbed droplets is significantly higher.
The fraction of droplets attached to the surface as a function of shear force is plotted in Figure 6. The fraction of droplets adhered tot the surface with applied shear force is comparable for the three different salt concentrations. This means that the force required to wash away droplets from the surface does not change significantly with an increasing salt concentration, in line with the rather constant contact angle of these droplets (Figure 3). These observations are however quite different from the effect of ionic strength observed for the adhesion of SDS stabilized emulsion droplets to a strongly negative hydrophilic surface (glass) and a hydrophobic surface [18]. For both surfaces a higher ionic strength was found to lead to a stronger adhesion. For these surfaces, charge, and thus the ionic strength plays a much more significant role. A glass surface is strongly negatively charged (at the studied pH), while also the hydrophobic surface obtains a strong negative charge due to the adsorption of surfactant. At higher salt concentration, charge repulsion between the negatively charged droplet and the negatively charged surfaces is screened, allowing stronger adhesion forces. For cellulose, only weakly charged and too hydrophilic to facilitate surfactant adsorption, this effect is not present and a relatively constant adhesion force is observed. The force of adhesion for the three different salt concentrations is thus quite constant for our weakly negative hydrophilic surface. When we look at the absolute number of droplets adhered to the model surface, however, we do observe a difference (Figure 7). At a salt concentration of 1 and 10 mM, only a few oil droplets adhere to the surface (see also Figure 5). At a salt concentration of 100 mM however, significantly more droplets adhere to the surface. At the end of the experiment, at maximum shear force, the largest number of droplets adhere to the surface at the highest salt concentration. The initial adhesion phase, when the fluid in the cell is stagnant, determines the amount of droplets that adhere to the surface. At 1 and 10 mM NaCl, the repulsive force between the slightly negatively charged cellulose surface and the negatively charged oil droplets is just sufficient to act as a kinetic barrier, decreasing the rate at which droplets adhere. At 100 mM however, due to electrostatic screening the repulsion between the droplets and the surface is slightly less, allowing the droplets to approach the surface more easily. This increases the chance for adhesion, and therefore the number of droplets that stick to the surface.

3.4. Membrane Filtration

3.4.1. Flux Decline

An emulsion with 100 ppm oil, 463 mg/L SDS and 1, 10 or 100 mM NaCl was filtered over an ultra-filtration (UF) regenerated cellulose membrane for 3 h. The crossflow velocity was 0.2 m/s and the transmembrane pressure was kept constant at 1 bar. The permeate flux was measured every 10 s. In Figure 8, the normalized permeate flux is plotted as a function of the total permeate volume. At 1 mM NaCl, the flux decline is gradual and reaches 50 ± 3% of the initial flux at the end of the experiment. At 10 mM NaCl, the initial flux decline is very steep, but after this initial stage the flux slowly declines until 37 ± 6% at the end of the experiment. For 100 mM NaCl, the flux decline is initially steep and then slows down, until at the end of the experiment the flux is 23 ± 3% of the initial flux. These effects of ionic strength are reproducible and are also observed at a lower crossflow velocity of 0.14 m/s (Figure 9), where the final flux decline is 40 ± 0% for 1 mM, 32 ± 5% for 10 mM and 22 ± 8% for 100 mM. For the flux decline at the initial stages of filtration a strong correlation is expected with the flow cell experiments, especially regarding the initial number of droplets attached to the surface. Indeed, for 1 and 100 mM the flow cell demonstrates a much larger degree of adsorbed droplets at the high ionic strength, and a much stronger flux decline is observed in the membrane fouling experiments. However, for 10 mM of salt the fouling rate at the initial stages is much higher than can be expected on the basis of the amount of adhered droplets observed in the flow cell experiments. We expect that the fouling mechanism for 10 mM of salt is different with pore blocking leading to a very rapid decrease in flux during the initial stages. Clearly, the flow cell approach provides useful insights relevant to membrane fouling, but cannot by itself explain all intricacies of fouling, as in the current flow cell design no pores are present and no permeation is taking place.
After initial droplet adhesion on the surface, the flux decline is mainly determined by droplet-droplet adhesion and the formation of a cake layer on the surface. This means that subsequent adhesion of oil droplets is mainly influenced by repulsive forces between negatively charged oil droplets. This repulsive force will also influence the characteristics of the cake layer and possibly prevent the adhesion of oil droplets to the cake layer, leading to a steady state.
The resistance of the cake layer can be given by the Kozeny Carman term:
R c = 150 l c ( 1 ε c ) 2 D v 2 ε c 3
where l c is the thickness of the cake layer, ε c the porosity of the cake layer and D v the effective diameter of the oil droplets. As can be seen from this equation, the resistance of the cake layer is heavily dependent on the porosity of the layer. According to Song and Elimelech, the maximum packing of a cake layer of monodisperse rigid particles arises at a porosity of 0.36 [23]. If we however assume a close cubic packing of spheres (ccp), the porosity has a mimimum of 0.26. This means that for a cake layer of monodisperse particles the maximum radius of a particle that can pass through the spaces in between the particles of radius a is approximately 0.12a. In our case the membrane has an expected pore size of around 40–80 nm, while the open space between our large oil droplets will be in the order of 0.5 to 1 um. The cake layer thus remains very open compared to the pore size of the membrane. Naturally, the porosity of the cake layer will be determined by more parameters, such as the flux through the membrane. At higher flux, we have higher shear forces, that push the droplets closer together. Still as in this work we worked at constant pressure, and thus a constant initial flux, this is not taken into account here.
For charged fouling species, the porosity of the cake layer is strongly linked to the ionic strength. At low ionic strength, the negatively charged droplets repel each other leading to a open cake layer with a relatively high flux. At increasing ionic strength the cake layer becomes denser (lower porosity), leading to a much higher resistance and thus lower fluxes. The same ionic strength effects on the cake layer porosity, and thus the extend of flux decline was recently also observed for negatively charged silica nanoparticles [24]. Clearly the ionic strength has a massive effect on the successful filtration of emulsions stabilized by anionic surfactants. A low ionic strength is preferred to avoid the formation of a dense cake layer. The filtration could also be influenced by surfactant adsorption at the membrane surface. Trzaskus et al. [25] found that SDS shows only very limited adsorption to negatively charged membranes, but some adsorption can be expected. Such adsorption would increase the negative charge of the membrane surface and will thus help to prevent droplet adhesion.

3.4.2. Flux Recovery and Oil Retention

In addition to the flux decline, we also determined the oil retention and the flux recovery after a forward flush and a backwash. As can be seen from Table 1, the flux recovery is high for all concentrations. This is in line with the flow cell experiments that indicated that the oil droplets could be easily rinsed of the cellulose surface by applying shear forces. Still, there is an effect of ionic strength visible, where at the higher salt concentration a better flux recovery is found. One possibility is that the denser cake layers formed at higher ionic strength are easier to remove as a whole, while a more open cake layer is just partly removed [11]. Another possibility is that there is a more kinetic origin. When flushed with water, the bulk surfactant concentration drops and surfactant desorbs from the interface of the emulsion droplets. The rinsing step could thus also have a destabilizing effect on the emulsion droplets. However, at high ionic strength much more surfactant molecules are adsorbed to the droplet interface (see Section 3.2), keeping the droplets stable for longer, possibly allowing a more complete droplet removal from the surface. This could be studied by follow-up experiments in which we flush with a surfactant solution instead of water.
For all salt concentrations, the oil retention is around 90% and does not change significantly during the experiment. As discussed in Section 3.4.1, this suggests the cake layer is indeed an ineffective filtration layer, as the rejection does not go up over time, in contrast to observations made on silica nanoparticles [24]. Most likely only the smallest droplets in the emulsion pass through the largest pores of the membrane. The theoretical critical pressure for an oil droplet to pass through a membrane pore in the absence of crossflow is:
P c r i t = γ O p cos θ A p ( N / m 2 )
where γ is the interfacial tension between the oil and the aqueous phase, O p the circumference of the pore, θ the contact angle of the droplet on the surface and A p the surface area of the membrane pore. For membrane pores of 60 nm, the critical pressure at the measured interfacial tensions and contact angles is predicted to be 10.5 bar for 1 mM NaCl, 7.0 bar for 10 mM NaCl and 1.1 bar for 100 mM NaCl. This means that at 1 and 10 mM NaCl droplets will not be pushed through the membrane. At 100 mM we expect to be close to the critical pressure, but clearly the oil retention is still quite high, indicating that we have not gone over the critical pressure.

4. Conclusions

In this work we have used a unique combinatorial approach to study membrane fouling by surfactant stabilized oil droplets at different ionic strengths. We do not only study fouling by looking at indirect measurements, such as flux decline of the membrane and oil permeation, but also more directly by observing oil droplet adhesion on a chemically identical surface using a flow cell approach. On a weakly negative cellulose surface the force of adhesion between the surface and SDS stabilized oil droplets is found to be independent on the ionic strength. The low degree of charge, and thus low charge repulsion between surface and droplet means that the addition of ions has no significant effect on the strength of adhesion. In all cases, the attached droplets can nearly completely be removed from the cellulose surface using shear forces. Still the number of droplets that adhere to the surface before applying shear is clearly affected by the ionic strength, with many more droplets adhering especially at the high ionic strength of 100 mM NaCl. The weak negative charge on the surface does seem to provide a kinetic barrier that slows down droplet adhesion, but this effect disappears at higher ionic strength leading to many more adhered droplets. Membrane fouling on cellulose membranes was subsequently studied over time-scales of a few hours. Here we can distinguish two regimes, initially the rate of flux decline is coupled to droplets adhering to the membrane surface, while for longer times the build up of a cake layer will dominate the flux decline. At the start of the experiment, the flux decline is higher at 100 mM than at 1 mM, which can be coupled to the higher droplet adhesion expected at high salt concentration on the basis of the flow-cell results. However, at 10 mM the flux decline is even stronger than for 100 mM, indicating that at 10 mM another fouling mechanism is occurring, most likely pore blocking. For the flux decline at the later stages of the experiment, there is a clear trend, with a greater flux decline at increasing ionic strength. The porosity of the cake layer plays a key role in the flux reduction. At low ionic strength, oil droplets repel each other strongly and an open, more permeable, cake layer is formed. However at higher ionic strength, a screening of charge interactions leads to a lower porosity and thereby a lower flux. Flux recovery after a forward flush and backwash is high at all ionic strengths, in line with the flow cell observation that droplets can easily be sheared off. The flux recovery is highest at high ionic strength, possibly due to the more compact cake layer, or due to the much higher amount of surfactant molecules at the interface of the oil droplets. Naturally, in more complex oil water emulsions, adhesion and fouling mechanisms could change. The approach developed here, utilizing a combination of flow-cell and membrane experiments, could also yield valuable information when applied to these more realistic emulsions. Overall this work highlights the key role that ionic strength plays in the fouling of membranes by emulsions stabilized with an anionic surfactant. Moreover the work demonstrates the potential of our combinatorial approach, where insights from a flow-cell, where droplets adhesion can be directly observed, are combined with standard membrane fouling experiments. While the flow cell approach will not show all intricacies of membrane fouling (no pores, no permeation), it provides valuable insights that help in the interpretation of the more indirect flux decline data.

Supplementary Materials

The following are available at https://www.mdpi.com/2504-5377/3/1/9/s1.

Author Contributions

Conceptualization, J.M.D., R.G.H.L. and W.M.d.V.; Methodology, J.M.D. and W.M.d.V.; Formal Analysis, J.M.D.; Investigation, J.M.D.; Writing—Original Draft Preparation, J.M.D.; Writing—Review and Editing, R.G.H.L., W.M.d.V.; Supervision, R.G.H.L., W.M.d.V.; Project Administration, W.M.d.V.; Funding Acquisition, W.M.d.V.

Funding

This work was performed in the cooperation framework of Wetsus, European Centre of Excellence for Sustainable Water Technology (www.wetsus.eu). Wetsus is co-funded by the Dutch Ministry of Economic Affairs and Ministry of Infrastructure and Environment, the Province of Fryslân and the Northern Netherlands Provinces.

Acknowledgments

The authors like to thank the participants of the Wetsus research theme Concentrates for the fruitful discussions and their financial support. They would also like to thank Harmen Zwijnenberg from the Membrane Science and Technology group from the University of Twente for his help in hydrophobizing the glass surfaces, and Joeri de Valença for his help with ImageJ.

Conflicts of Interest

The authors declare no conflicts of interest.

References

  1. Cheryan, M.; Rajagopalan, N. Membrane processing of oily streams. Wastewater treatment and waste reduction. J. Membr. Sci. 1998, 151, 13–28. [Google Scholar] [CrossRef]
  2. Fakhru’l-Razi, A.; Pendashteh, A.; Abdullah, L.C.; Biak, D.R.A.; Madaeni, S.S.; Abidin, Z.Z. Review of technologies for oil and gas produced water treatment. J. Hazard. Mater. 2009, 170, 530–551. [Google Scholar] [CrossRef] [PubMed]
  3. Zhu, Y.; Wang, D.; Jiang, L.; Jin, J. Recent progress in developing advanced membranes for emulsified oil/water separation. NPG Asia Mater. 2014, 6, e101. [Google Scholar] [CrossRef]
  4. Padaki, M.; Surya Murali, R.; Abdullah, M.; Misdan, N.; Moslehyani, A.; Kassim, M.; Hilal, N.; Ismail, A. Membrane technology enhancement in oil–water separation. A review. Desalination 2015, 357, 197–207. [Google Scholar] [CrossRef]
  5. Dickhout, J.; Moreno, J.; Biesheuvel, P.; Boels, L.; Lammertink, R.; de Vos, W. Produced water treatment by membranes: A review from a colloidal perspective. J. Colloid Interface Sci. 2016. [Google Scholar] [CrossRef] [PubMed]
  6. Mohammadi, T.; Kazemimoghadam, M.; Saadabadi, M. Modeling of membrane fouling and flux decline in reverse osmosis during separation of oil in water emulsions. Desalination 2003, 157, 369–375. [Google Scholar] [CrossRef]
  7. Hwang, K.J.; Liao, C.Y.; Tung, K.L. Analysis of particle fouling during microfiltration by use of blocking models. J. Membr. Sci. 2007, 287, 287–293. [Google Scholar] [CrossRef]
  8. Vela, M.C.V.; Blanco, S.Á.; García, J.L.; Rodríguez, E.B. Analysis of membrane pore blocking models applied to the ultrafiltration of PEG. Sep. Purif. Technol. 2008, 62, 489–498. [Google Scholar] [CrossRef]
  9. Salahi, A.; Abbasi, M.; Mohammadi, T. Permeate flux decline during UF of oily wastewater: Experimental and modeling. Desalination 2010, 251, 153–160. [Google Scholar] [CrossRef]
  10. Chen, J.C.; Li, Q.; Elimelech, M. In situ monitoring techniques for concentration polarization and fouling phenomena in membrane filtration. Adv. Colloid Interface Sci. 2004, 107, 83–108. [Google Scholar] [CrossRef]
  11. Altmann, J.; Ripperger, S. Particle deposition and layer formation at the crossflow microfiltration. J. Membr. Sci. 1997, 124, 119–128. [Google Scholar] [CrossRef]
  12. Li, H.; Fane, A.; Coster, H.; Vigneswaran, S. Direct observation of particle deposition on the membrane surface during crossflow microfiltration. J. Membr. Sci. 1998, 149, 83–97. [Google Scholar] [CrossRef]
  13. Mores, W.D.; Davis, R.H. Direct visual observation of yeast deposition and removal during microfiltration. J. Membr. Sci. 2001, 189, 217–230. [Google Scholar] [CrossRef]
  14. Vanysacker, L.; Declerck, P.; Vankelecom, I. Development of a high throughput cross-flow filtration system for detailed investigation of fouling processes. J. Membr. Sci. 2013, 442, 168–176. [Google Scholar] [CrossRef]
  15. Fux, G.; Ramon, G.Z. Microscale Dynamics of Oil Droplets at a Membrane Surface: Deformation, Reversibility, and Implications for Fouling. Environ. Sci. Technol. 2017, 51, 13842–13849. [Google Scholar] [CrossRef] [PubMed]
  16. Di, H.; Martin, G.J.; Dunstan, D.E. A microfluidic system for studying particle deposition during ultrafiltration. J. Membr. Sci. 2017, 532, 68–75. [Google Scholar] [CrossRef]
  17. Di, H.; Martin, G.J.; Sun, Q.; Xie, D.; Dunstan, D.E. Detailed, real-time characterization of particle deposition during crossflow filtration as influenced by solution properties. J. Membr. Sci. 2018, 555, 115–124. [Google Scholar] [CrossRef]
  18. Dickhout, J.M.; Kleijn, J.M.; Lammertink, R.G.H.; de Vos, W.M. Adhesion of emulsified oil droplets to hydrophilic and hydrophobic surfaces—Effect of surfactant charge, surfactant concentration and ionic strength. Soft Matter 2018, 14, 5452–5460. [Google Scholar] [CrossRef]
  19. Cooper, G.K.; Sandberg, K.R.; Hinck, J.F. Trimethylsilyl cellulose as precursor to regenerated cellulose fiber. J. Appl. Polym. Sci. 1981, 26, 3827–3836. [Google Scholar] [CrossRef]
  20. Avranas, A.; Stalidis, G.; Ritzoulis, G. Demulsification rate and zeta potential of O/W emulsions. Colloid Polym. Sci. 1988, 266, 937–940. [Google Scholar] [CrossRef]
  21. Grundke, K.; Bogumil, T.; Werner, C.; Janke, A.; Pöschel, K.; Jacobasch, H.J. Liquid-fluid contact angle measurements on hydrophilic cellulosic materials. Colloids Surf. A Physicochem. Eng. Asp. 1996, 116, 79–91. [Google Scholar] [CrossRef]
  22. Grundke, K.; Pöschel, K.; Synytska, A.; Frenzel, R.; Drechsler, A.; Nitschke, M.; Cordeiro, A.; Uhlmann, P.; Welzel, P. Experimental studies of contact angle hysteresis phenomena on polymer surfaces—Toward the understanding and control of wettability for different applications. Adv. Colloid Interface Sci. 2015, 222, 350–376. [Google Scholar] [CrossRef]
  23. Song, L.; Eiimelech, M. Theory of Concentration Polarization in Crossflow Filtration. J. Chem. Soc. Faraday Trans. 1995, 91, 3389–3398. [Google Scholar] [CrossRef]
  24. Trzaskus, K.W.; de Vos, W.M.; Kemperman, A.; Nijmeijer, K. Towards controlled fouling and rejection in dead-end microfiltration of nanoparticles—Role of electrostatic interactions. J. Membr. Sci. 2015, 496, 174–184. [Google Scholar] [CrossRef]
  25. Trzaskus, K.W.; Lee, S.L.; de Vos, W.M.; Kemperman, A.; Nijmeijer, K. Fouling behavior of silica nanoparticle-surfactant mixtures during constant flux dead-end ultrafiltration. J. Colloid Interface Sci. 2017, 506, 308–318. [Google Scholar] [CrossRef] [PubMed]
Figure 1. Schematic representation of the flow cell setup under the microscope. The distance h between the mirror and the replaceable upper glass slide can be changed. The shear force is obtained by pumping a solution through the flow cell channel.
Colloids 03 00009 g001
Figure 2. Schematic representation of the membrane filtration setup. The feed, concentrate and permeate flows are all regulated by the Con-Vergence OSMO setup, the feed and permeate mass flow are measured by mass flow meters (M).
Colloids 03 00009 g002
Figure 3. Contact angles of sodium dodecyl sulfonate (SDS) stabilized hexadecane droplets on cellulose coated glass and cellulose based ultra-filtration (UF) membranes as measured with the captive bubble method with 1, 10 and 100 mM NaCl. Error bars represent the standard deviation after duplicates.
Colloids 03 00009 g003
Figure 4. Interfacial tension of the oil-water interface in presence of SDS for 1, 10 and 100 mM of NaCl and 463 mg/L SDS. Error bars represent the standard deviation after duplicates.
Colloids 03 00009 g004
Figure 5. Images of the cellulose coated glass with attached droplets in the flow cell at 1, 10 and 100 mM NaCl and 463 mg/L SDS. The Start images were taken after flushing of the flow cell at the lowest possible speed, the End images were taken after the maximum shear force was applied.
Colloids 03 00009 g005
Figure 6. Fraction of droplets that sticks to a cellulose surface for different NaCl concentrations and 463 mg/L SDS. Error bars represent standard deviation after duplicates.
Colloids 03 00009 g006
Figure 7. Number of droplets that sticks to a cellulose surface for different NaCl concentrations and 463 mg/L SDS. Error bars represent standard deviation after duplicates.
Colloids 03 00009 g007
Figure 8. Normalized membrane flux as a function of the permeated volume for different concentrations of NaCl and 463 mg/L SDS. 48 kg/h TMP = 1 bar.
Colloids 03 00009 g008
Figure 9. Normalized membrane flux as a function of the permeated volume for different concentrations of NaCl and 463 mg/L SDS. 32 kg/h TMP = 1 bar.
Colloids 03 00009 g009
Table 1. Flux recovery and oil retention at 48 kg/h and 1 bar TMP.
Salt ConcentrationFlux RecoveryOil Retention StartOil Retention End
1 mM74%98 ± 6%88 ± 6%
10 mM78%97 ± 4 %97 ± 4%
100 mM95%92 ± 1 %93 ± 1%

