1. Introduction
Saponite is a trioctahedral phyllosilicate clay mineral that belongs to the smectite group, with the molecular formula,
where M represents the interlayer exchange cations [
1]. It is a product of magnesium silicates that is commonly formed during the weathering process of basic volcanic materials [
2].
One of the biggest industrial deposits of saponite clay mineral in Europe is found in the north-western part of Khmelnitsky region in the Slavuta district of Ukraine. These reserves contain over 100 million tons of saponite [
3]. Unfortunately, their main characteristics important for industrial applications have been insufficiently studied, and the works previously done in this field are not complex [
3,
4,
5]. Saponite deposits located in countries such as Canada, the United States, Japan, Turkey, the United Kingdom, Spain, and the Czech Republic [
6,
7,
8,
9,
10,
11,
12,
13,
14,
15] are well-known. However, the industrial applications of saponite clays from different locations are varied, because of distinctions in their physical and chemical properties, which are dependent on structure and composition. Mineralogical composition of the raw clay samples which have been identified as saponites distinctively depends on the location of their deposit [
5,
13,
16,
17]. Mineral impurities within saponite raw samples usually consist of quartz, feldspar, clay (illite, chlorite, and montmorillonite), iron (hematite, magnetite, goethite, and nontronite), carbonate (dolomite and calcite), etc.
This paper focuses on characterization of structural features and composition of raw and acid-treated saponite clays originating from the Tashkiv deposit, in the Khmelnitsky region of Ukraine.
The unit cell of saponite consists of an octahedral sheet sandwiched between two opposing tetrahedral sheets with a negatively charged surface. Meanwhile, the interlayer space between these units is occupied by water molecules and cations, which may easily be exchanged with other metal cations to compensate for the negative charge of the unit cell’s surface [
18].
In saponite, the main cation of the tetrahedral sheet is Si
4+, but other cations such as Al
3+ and Fe
3+ have also been identified [
18,
19]. Substituting Al
3+ or Fe
3+ with Si
4+ within the tetrahedral sheet contributed to the increase of the layer’s charge. Magnesium-rich saponite usually contained a Mg
2+ cation within its octahedral sheet. However, Fe-rich varieties with Fe
3+ and Fe
2+ substituted for Mg
2+ were also widespread in nature [
18,
20]. Substitutions of Mg
2+ with Al
3+ and Ti
4+ cations were also identified. Isomorphic forms of saponite differed in ion exchange and thermal properties [
18,
20]. Adsorption capacity values obtained from the analyses of raw saponite samples varied from 70 to 120 meq/100 g [
13,
21].
According to the results of an X-ray diffraction study [
9], unit cell parameters of saponite from Orrock (Scotland) were a = 0.53 nm, b = 0.92 nm, and c = 1.49 nm. Results obtained by Suquet et al. [
10] for saponite from Kozakov (Czech Republic) were slightly different—a = 0.53 nm, b = 0.92 nm, and c = 1.54 nm. The unit cell edge length in the c-direction for the latter differed due to cations exchanged within the interlayer space and its water content. The thickness of the layer may also vary from 1.2 to more than 1.5 nm [
1].
Specific surface area of raw saponite collected from different deposits determined using nitrogen adsorption ranged from 30 to 70 m
2g
−1 [
5,
18,
22]. A considerably higher BET specific surface area of 202 m
2 g
−1 was determined for a raw sample of saponite from Vicalvaro (Spain) [
13]. The authors attributed this to the abundance of small-sized particles of raw saponite, which originated from sediments.
2. Materials and Methods
Saponite clay samples were collected from the Tashkiv deposit (Khmelnitsky region, Ukraine). Acid-modified saponite was obtained by treating five grams of the raw powder clay under mechanical stirring with 150 mL of 2 M H2SO4 for four hours at 90 °C. Subsequently, the solid phase was washed and separated from the solution and dried at room temperature.
Structure and surface morphology of the raw and modified saponite were characterized using scanning electron microscopy with a focused ion beam (SEM/FIB Quanta 200 3D FEG), under the following analytical conditions—magnification = 200 − 350,000×, WD = 9.5–10 mm, HV = 20.0 kV, spot = 2.5, and signal = SE. Elemental composition (energy dispersive X-ray (EDX) elemental analysis) and elemental distribution (EDX elemental mapping) were characterized using a scanning electron microscope coupled with energy dispersive X-ray spectroscopy (SEM/EDX), under the following analytical conditions—magnification = 500×, WD = 25.0 mm, HV = 28.0 kV, spot = 3.0, and signal = SE. Transmission electron microscopy (TEM) (Tecnai F20 X-Twin) at an accelerating voltage of 200 kV, using HAADF (high angle annular dark field) and EDX (energy dispersive X-ray spectrometer) detectors, was applied to characterize the structure and surface morphology of saponite on the nanoscale.
X-ray diffraction (XRD) patterns were obtained using an X’Pert Pro diffractometer, in Cu Kα radiation (λ = 0.15406 nm; 60 kV, 55 mA) mode. Diffraction angle values were scanned from 5° to 120° (with a 2θ step size of 0.001). Mineral composition was determined by comparing the experimental spectra to the reference powder diffraction patterns from the database integrated within the PANalytical’s software package.
Porous structure parameters of the saponite samples were determined using the low-temperature (77 K) nitrogen adsorption/desorption method. Samples were degassed for 20 h at 453 K in vacuum. Adsorption data were obtained using Autosorb 6B, version 3.0 (Quantachrome Instruments, Boynton Beach, FL, USA). Specific surface area (S) was calculated from the Brunauer–Emmett–Teller (BET) adsorption isotherms and computational methods (DFT). The total pore volume (V
total) was determined by converting the volume of nitrogen adsorbed at p/p
s = 0.99 to a volume of liquid adsorbate. The mesopore volume (V
mesBJH) and the pore diameter (D
BJH) were obtained using the Barrett–Joyner–Halenda (BJH) method [
23]. The t-plot method [
24] was applied to determine the micropore volume (V
mict), the external surface area (S
extt), and the micropore surface area (S
mict). The Horvath–Kawazoe (HK) model [
23] was used for micropore size calculations. Pore size distribution was determined using the standard non-local density functional theory (NLDFT) equilibrium model [
25].
Fourier transform infrared spectroscopy (FTIR) spectra were recorded using a Spectrum 2000 (SMART Collector) spectrophotometer in order to determine the structural groups of the saponite samples. Each spectrum scan was recorded at a resolution of 8 cm−1. FTIR spectra were recorded from 400 to 4000 cm−1 using the KBr pellet technique in a ratio of sample to KBr of 1 to 40.
3. Results and Discussion
3.1. Elemental Composition of Saponite Samples
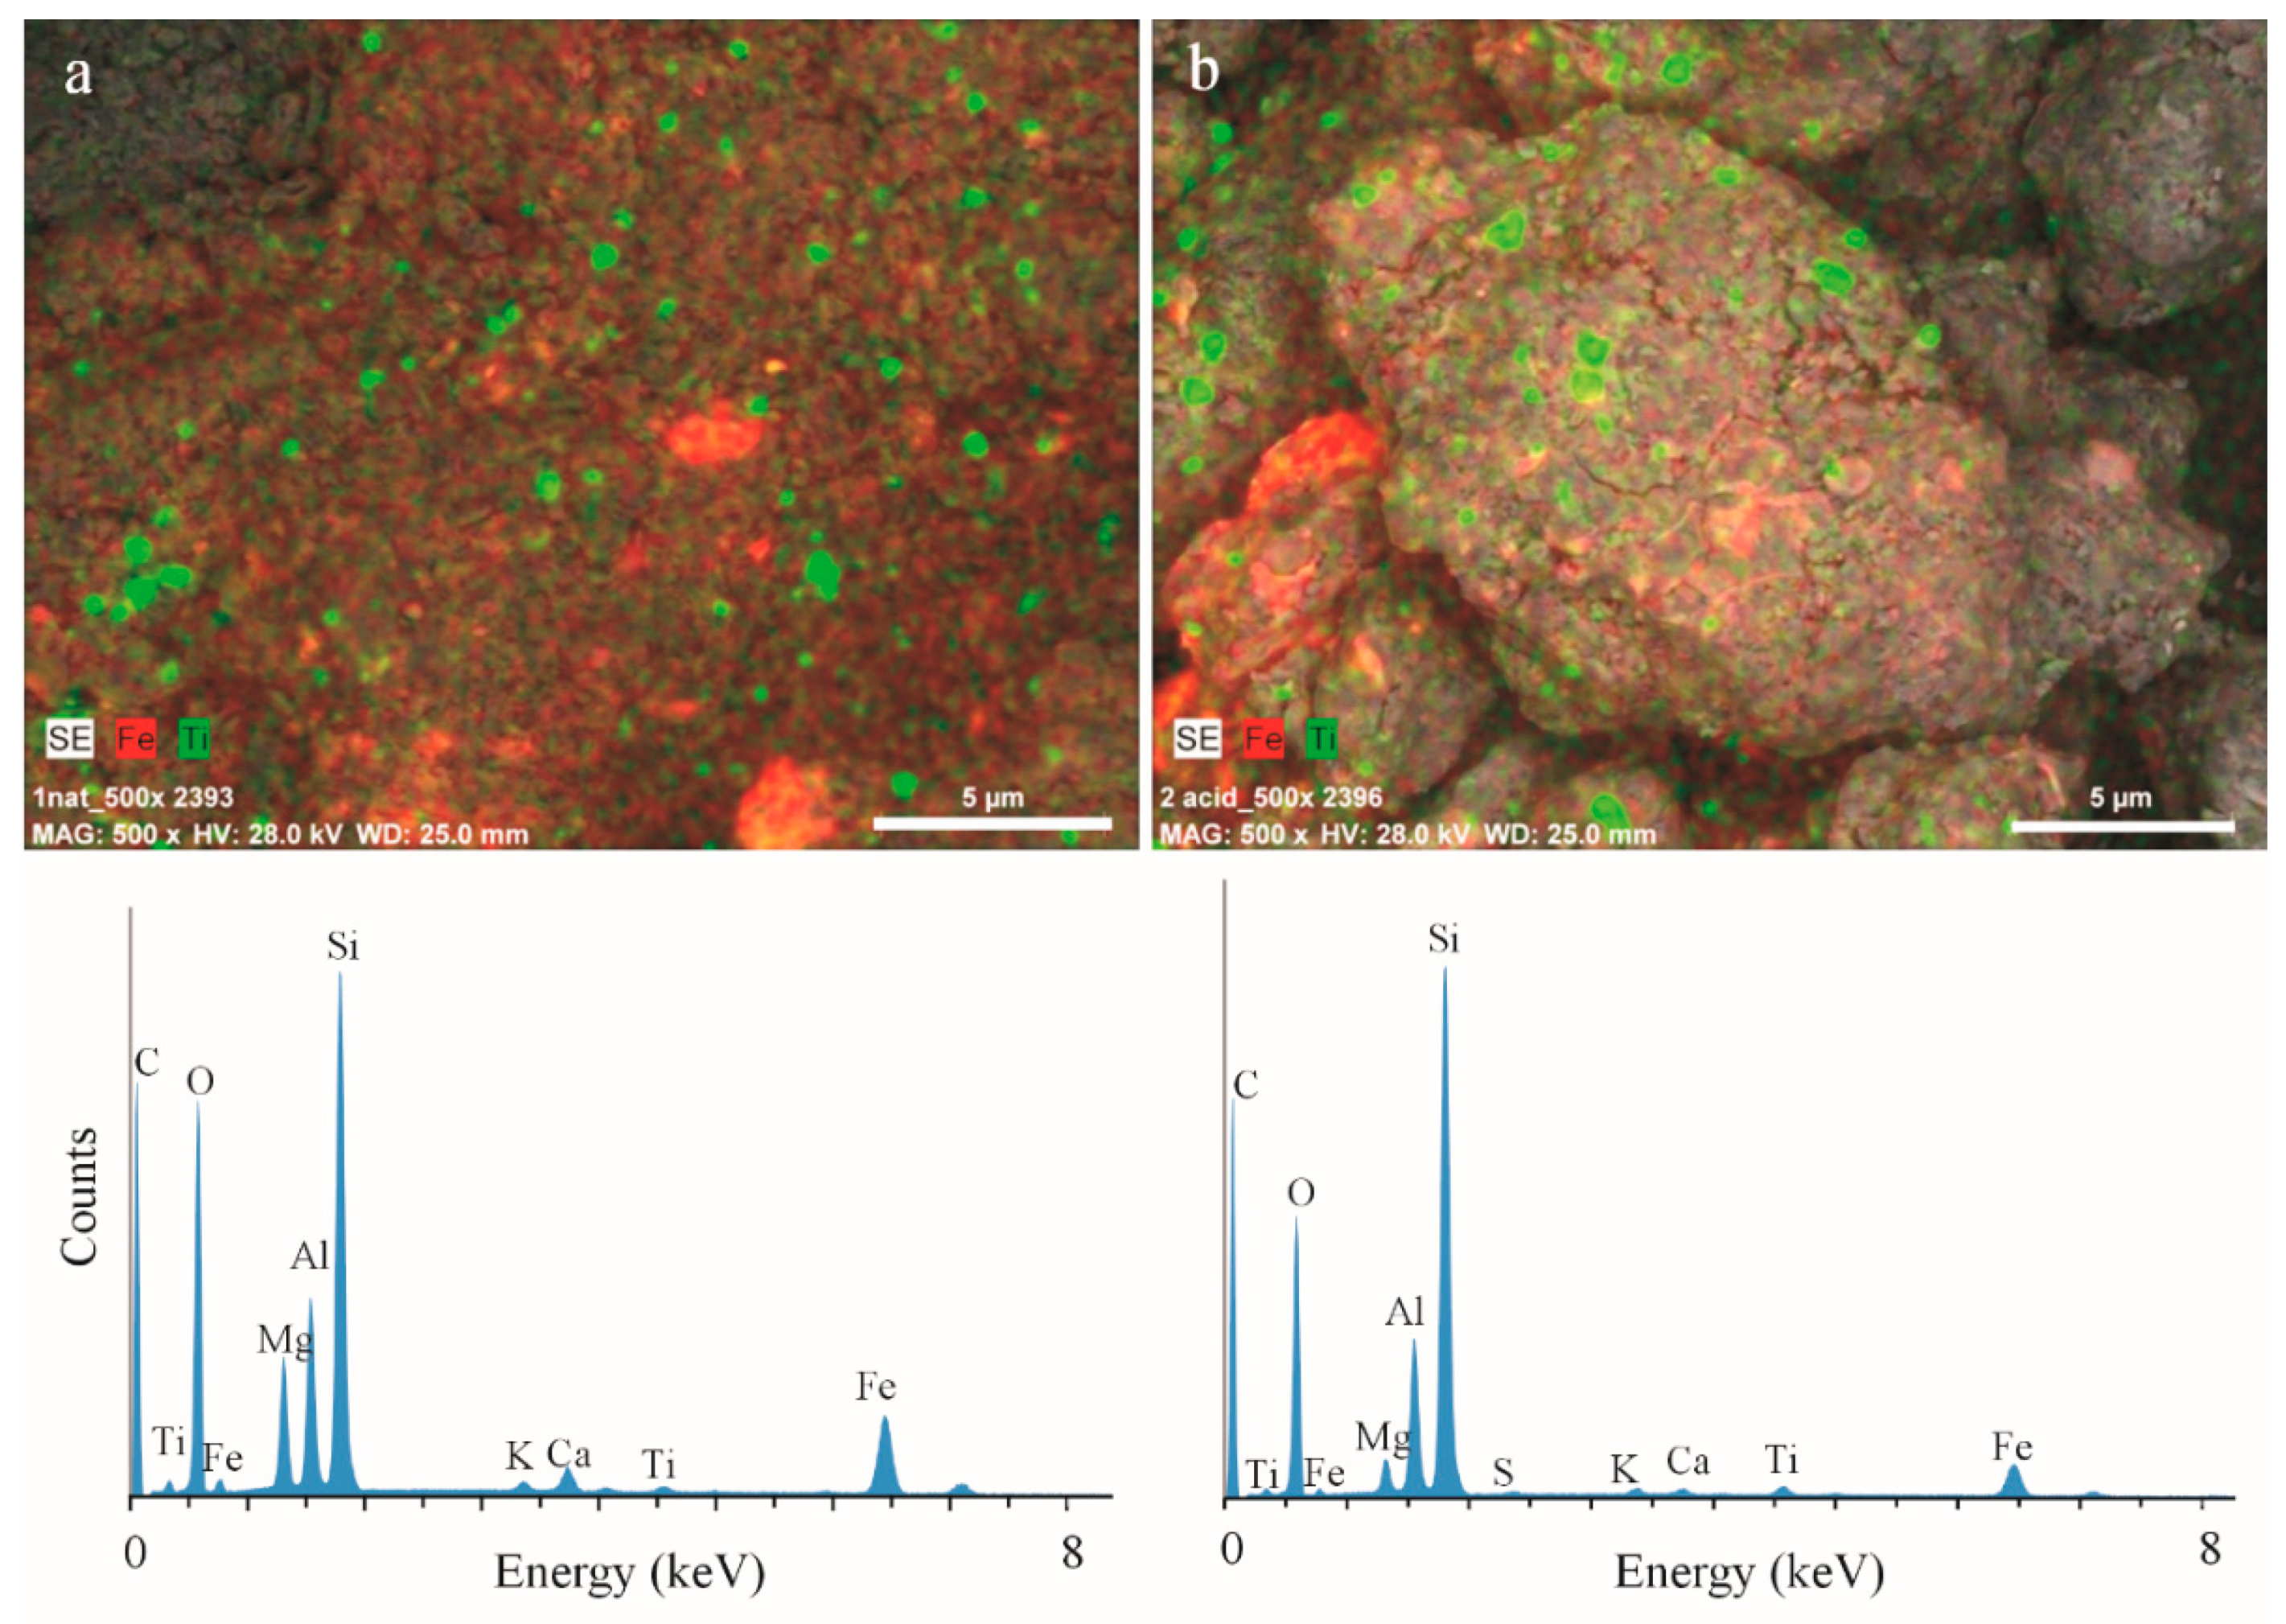
The elemental composition of the saponite samples obtained using SEM-EDX is summarized in
Table 1. EDX spectra have shown that oxygen, iron, magnesium, aluminum, and silicon are the base elements of the raw samples with about 1% of titanium present. It should be noted that raw saponite is characterized by a considerable content (19.32%) of iron. Iron can be included in the saponite structure in both the octahedral and tetrahedral sheets or could also be present as a charge-balancing cation in a clay exchange complex [
26,
27].
After acid treatment, the content of Si and Al increased, while the content of Fe, Mg, and Ca decreased. According to the previously reported findings [
28], treatment of clays using mineral acids of medium strength (2–4 M) led to leaching of exchangeable cations of interlayer space (Na
+ and Ca
2+) and cations of the octahedral lattice (Al
3+, Fe
3+, and Mg
2+) destroying packages in the process, considerably expanding the pore space and increasing the specific surface area. Meanwhile, the content of potassium was nearly unchanged. According to Stucki et al. [
27,
29] the fixation of K
+ in the Fe
3+-containing smectite octahedral sheet was possibly due to its reduction.
Acid treatment resulted in an easier removal of Fe
3+ cations than of Mg
2+ cations. This was corroborated by the decrease of Fe/Mg ratio in the modified samples. However, after acid treatment when the exchangeable cations of interlayer space have been removed, a considerable amount of Fe
3+ was still present in the solids. This suggests that Fe
3+ cations remain in the octahedral sheet of the clay structure [
30].
Elemental distribution in the clay samples was assessed using SEM-EDX mapping techniques, and spot-mode quantitative analysis on points within single clay flakes (
Figure 1). This mineral exhibits homogeneous distribution of titanium oxides in regular oval forms with different submicrometer sizes (mainly between 0.1 and 1 µm) which corresponds to anatase, according to data complemented by XRD analysis (see
Section 3.3 below). Non-isometric iron particles with sizes between 0.1 and 4 µm are uniquely distributed in the clay matrix.
3.2. Morphology and Structure of the Saponite Particles
The morphology and structure of the saponite particles before and after modification were determined using SEM (
Figure 2a,b) and TEM (
Figure 3a,b). Differences in the microstructure between raw and modified forms of the clay are visible from the SEM photomicrographs. For untreated saponite, the amorphous mass that consists of lath-like particles without well-defined borders are characteristic of the morphology of this clay mineral [
13]. We cannot observe the individual crystallites, but only aggregates of irregular clay particles. Such cluster structures of clay do not allow determination of the size of individual crystallites. Saponite treated with acid exhibits smaller aggregates with dominant flake-like forms and irregular edges. The diameter of these aggregates is large (up to 10 μm), but the individual plate width is much less than 1 μm. These morphological changes are a result of the transformations in the clay matrix and at the boundaries between clay layers. Acid treatment results in modification of the surfaces of clays by disaggregation of particles, possible elimination of mineral impurities, and removal of exchangeable cations [
31].
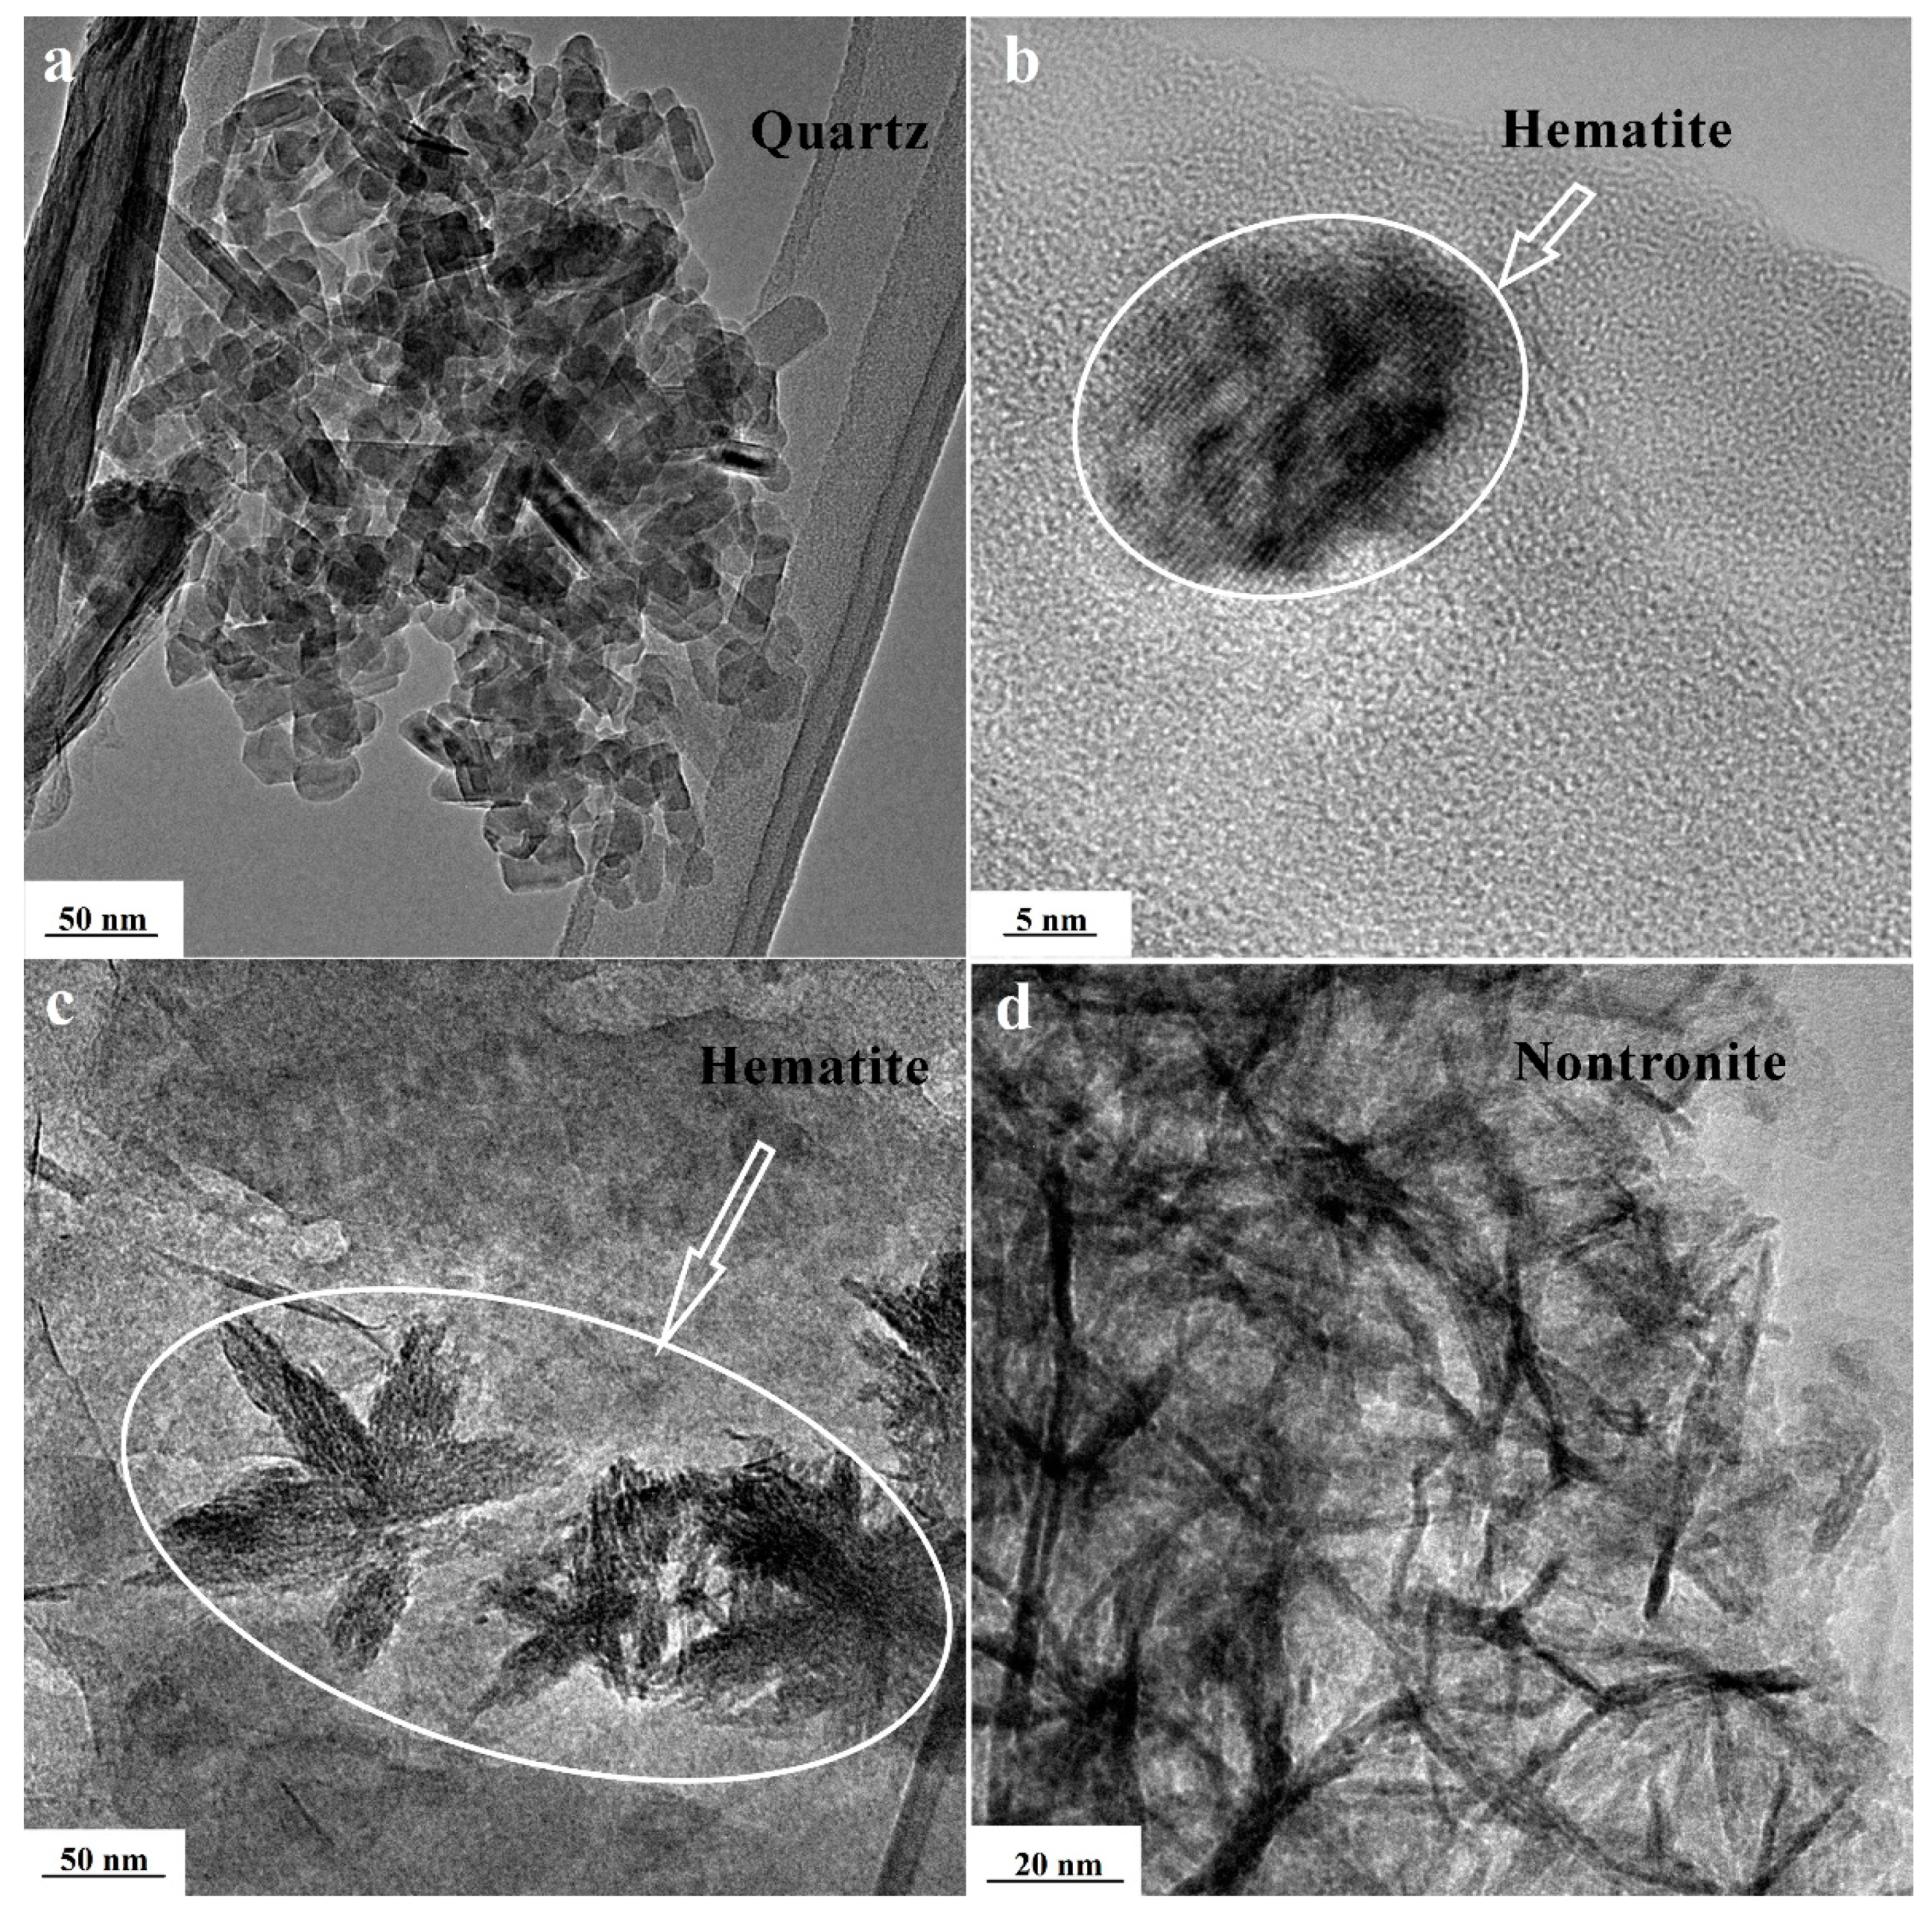
Saponite imaged with TEM (
Figure 3) was characterized by thin elongated plate-like particles of clay crystallites, single plates, and layered aggregates 10–200 nm long and 10–100 nm wide. The thicknesses of the particles did not exceed a few nanometers (2–5 nm). Aggregation of plate crystallites with flake-like forms of far smaller sizes had also been observed. TEM photomicrographs revealed the sites with irregular small clay aggregates (<10 nm) composed of even smaller individual clay nanocrystallites. It can also be observed that the saponite treated with acid was more dispersed in comparison to the raw sample. Mineral impurities such as quartz, hematite, and nontronite were revealed within samples that have been analyzed using TEM-EDX. Quartz was indicated in samples by columnar nanosized crystals 20–70 nm in the longest direction (
Figure 4a). The impurities of hematite were present in two forms (
Figure 4b,c). The first represented isometric particles with a size of about 10 nm. The second was present in circular arrangements of bladed crystals. In
Figure 4d, agglomerates of fibrous nanocrystals of nontronite with a thickness of around 3 nm are depicted.
3.3. X-Ray Diffraction Patterns
X-ray diffraction patterns of the raw clay and acid-modified samples are shown in
Figure 5. Diffractogram of the raw sample indicated that saponite was the dominant clay mineral. The most intense reflection appeared at 2θ = 6.02° and corresponded to basal spacing of the c-axis (d
001) of the saponite cell with a value of 1.509 nm. For acid-treated sapointe, a slight shift of this characteristic reflection was observed, related to the decrease of basal spacing to 1.463 nm. The decrease of interlayer space for the acid-treated saponite was due to cation exchange (Fe, Ca, and Mg) with smaller hydronium cations during acid treatment. The broad form of these reflections suggested low crystallinity and small particle size of the samples [
13]. A small, but rather sharp reflection near 2θ = 26.5° (d
L = 0.334 nm) corresponded to a substantial content of quartz in the samples. Other small reflections detected in the X-ray diffraction patterns corresponded to the relative concentration of crystalline impurities contaminating the raw sample, mainly anatase (d
L = 0.368 nm) and hematite (d
L = 0.352 nm). After acid treatment, the intensity of the reflections assigned to mineral admixtures clearly increased (especially for quartz).
The reflection at 2θ = 60.04° (d
L = 0.1535 nm) corresponded to trioctahedral structure of the saponite phase. Presence of the dioctahedral clay phase as nontronite could be related to the reflection at 2θ = 62.51° (d
L = 0.1497 nm) [
20,
32].
3.4. Nitrogen Adsorption/Desorption Isotherms
Adsorption–desorption isotherms of nitrogen for saponite samples (
Figure 6) were similar to type IV of the Brunauer–Deming–Deming–Teller (BDDT) classification with the hysteresis loop of the type H3 of IUPAC classification, that had often been associated with slit-shaped pore structures [
33]. On the other hand, the H3 loop did not have a plateau at high p/p0 values and the whole adsorption branch of the hysteresis loop followed the same path as the corresponding part in a Type II isotherm. According to the opinion of Sing and Williams [
34] such isotherms of II pseudo-type character were due to the metastability of the adsorbed multilayer. This was associated with the low degree of pore curvature and non-rigid, slit-shaped pores structure, or non-rigid assemblages of platy particles. Rouquerol et al. [
35] also considered that this type of isotherm can be referred to as a Type II (b) with the H3 hysteresis loop, but this hypothesis has not yet been generally accepted.
The shapes of the saponite samples isotherms indicated the presence of both micro and mesopores. The hysteresis loop began at a relative pressure near 0.4 and corresponded to the loading and unloading of mesopores [
36]. The isotherm curves sharply raised at the beginning at a small value of relative pressure (p/p
0 ˂ 0.1) that was caused by the presence of free micropores in the adsorbent samples in which nitrogen adsorption occurred. Values of several important parameters of the pore structure obtained from the analyses of the isotherms are summarized in
Table 2.
Specific surface area of the saponite sample after acid treatment significantly increased from 47 to 189 m
2 g
−1, while the total pore volume increased from 0.134 to 0.201 cm
3 g
−1. The considerable increase in the specific surface area was due to the increase in internal surface area which was equivalent to the micropore surface area. The micropore volume for the saponite treated with acid increased seven-fold, up to 0.062 cm
3 g
−1 and 0.086 cm
3 g
−1, as calculated from the t-plot and the Horvath–Kawazoe model, respectively. These results are in accordance with analyses of saponite samples originating from deposits from other locations [
18,
37].
Increase in pore volume was due to the removal of interlayer cations (Fe
3+, Mg
2+, and Ca
2+) that caused weakening of bond between the layers and the expansion of space between the clay particles [
31].
Analysis of the pore size distribution using the NLDFT model (
Figure 7) provided pore diameter maxima with a wide peak that corresponded to 5–15 nm pores. Pore size distribution of the saponite treated with acid was different from the one obtained for the raw sample. A few narrow peaks that correspond to a considerable increase of pores with sizes ranging from 1 to 3 nm and from 5 to 6 nm were observed.
3.5. Fourier Transform Infrared Spectra of Saponite Samples
Fourier transform infrared spectra (
Figure 8) indicated the existence of different types of structural bonds and functional groups for saponite samples. The high frequency region of the spectrum contained an overlapping wide absorption band in the 3650–3000 cm
−1 range, which corresponded to stretching vibration of hydroxyl groups [
19,
38]. FTIR spectra of raw saponite showed an intensive band at about 3623 cm
−1, which corresponded to stretching vibration of OH groups within Mg–OH–Fe bonds in trioctahedral sheets [
39]. The absorption band at about 3574 cm
−1 could be attributed to OH stretching vibration of Fe–OH–Fe bonds and indicated the isomorphic substitution of Fe by Mg in the trioctahedral sheets of Fe saponite [
38,
40,
41]. According to the findings of Mas et al. [
39] this spectral region (3650–3500 cm
−1) corresponding to OH stretching was related to the co-existence of Fe- and Mg-rich phases in octahedral sheets of clay minerals. Absorption in a wide spectral range of 3500–3000 cm
−1 with two maxima at 3400 cm
−1 and 3270 cm
−1 could be assigned to OH stretching vibrations of hydrogen-bonded water molecules in the interlayer region [
38,
41,
42].
The absorption band at 1641cm
−1 was related to the deformation of molecular water H–O–H [
20]. An intense absorption band with a maximum around 1025 cm
−1 corresponded to stretching of O–Si–O comprising the tetrahedral sheet [
42]. Absorption bands at 839, 657, and 453 cm
−1 were due to Fe–OH–Fe, Fe–O out of plane, and Fe–O–Si bending vibration, respectively. This confirmed the high Fe-content within the octahedral sheet [
43]. A small peak at 520 cm
−1 was attributed to the Si–O–Al deformation and indicates the presence of some aluminum in the tetrahedral sheet [
20].
FTIR spectra of samples treated with acid depict changed in saponite structure. The O–Si–O band changed in form and had exhibited a shift from 1025 to 1035 cm
−1, while the OH bending band intensities decreased. This pointed to a partial alteration of the clay structure [
22]. The intensities of the bands at 658 cm
−1 (Fe–O bonds), 3574 cm
−1 (Mg–OH–Fe bonds), and 3623 cm
−1 (Al–OH–Mg bonds) decreased after acid treatment upon removal of Mg
2+ and Fe
3+ cations in agreement with SEM-EDX data. The absorption band at 1641cm
−1 was attributed to the deformation of molecular water, which was maintained after the treatment exhibiting a small decrease and a shift to 1625 cm
−1. However, the acid treatment caused the most intense bands at 799 cm
−1, 516 cm
−1, and 463 cm
−1 to appear. These bands were attributed to Si–O bonds of the free amorphous silica phase formed as a result of the partial destruction of tetrahedral sheets [
44], Si–O–Al and Si–O–Si bonds due to dissolution of the octahedral sheet [
45] by leaching of Mg and Fe, respectively.
4. Conclusions
Results of this study have shown that raw saponite forms amorphous aggregates of flake-like or lath-like clay crystallites without well-defined borders. Disaggregation of clay particles, as a result of acid treatment, prompted the formation of even smaller clay crystallites with dominant irregular flake-like forms, which corresponded to the elimination of exchangeable cations from the interlayer space and the weakening of bonds between the clay crystallites.
Raw saponite is composed predominantly of a trioctahedral smectite, while an admixture of dioctahedral phase corresponds to a substantial quantity of nontronite and a certain amount of associated minerals such as quartz, anatase, and hematite. Submicrometer anatase particles (1.1% of titanium) are homogeneously dispersed in the clay matrix with >1%. The high content of iron (19.3%) is distributed in the saponite clay structure within octahedral and tetrahedral sheets, and exchangeable cations in the interlayer space, or as a non-isometric form of micrometer-sized hematite particles.
Results of nitrogen adsorption/desorption revealed that the porous structure of saponite is comprised of micropores and mesopores in the form of narrow slits. Treatment with acid resulted in a considerable increase of pores with size ranging from 1 to 6 nm and an increase in the specific surface area of saponite ranging from 47 m2 g−1 to 189 m2 g−1, while the total volume within the pores increased from 0.134 cm2 g−1to 0.201 cm2 g−1.
Spectroscopic studies revealed the existence of different types of hydroxyl groups associated with dioctahedral and trioctahedral sheets of raw and modified saponite. Treatment with acid led to the partial decrease in the number of hydroxyl groups which were derived from octahedral sheets.
Results obtained in this study are of interest from practical point of view, since the textural characteristics and chemical composition of saponite founded in Khmelnitsky region might be useful for formulation of industrial materials. They may cause noticeable effects on quality of industrial products such as catalysts, adsorbents, sealants, adhesives, etc.
Author Contributions
Conceptualization, A.G.; formal analysis, H.S.; funding acquisition, H.S. and M.S.; investigation, H.S. and A.G.; methodology, M.S. and A.G.; project administration, B.B.; supervision, M.S. and B.B.; writing—original draft, H.S.; Writing—review and editing, M.S. and V.R.
Funding
This research was funded by the International Visegrad Fund, grant number 51501546/2015.
Conflicts of Interest
The authors declare no conflict of interest. The funders had no role in the design of the study; in the collection, analyses, or interpretation of data; in the writing of the manuscript, or in the decision to publish the results.
References
- Brigatti, M.F.; Galan, E.; Theng, B.K.G. Structures and Mineralogy of Clay Minerals. In Handbook of Clay Science: Developments in Clay Science; Bergaya, F., Theng, B.K.G., Legaly, G., Eds.; Elsevier: Amsterdam, The Netherlands, 2006; Volume 1, pp. 19–86. ISBN 9780080441832. [Google Scholar]
- Eggleton, R.A. The Regolith Glossary: Surficial Geology, Soils and Landscapes; Cooperative Research Centre of Landscape Evolution and Mineral Exploration: Canberra, Australia, 2001; p. 105. ISBN 9780731533435. [Google Scholar]
- Hrytsyk, V.E. Sedimentary Rocks and Ores; Naukova Dumka: Kiev, Ukraine, 1984; pp. 162–167. (In Russian) [Google Scholar]
- Spivak, V.; Astrelin, I.; Tolstopalova, N.; Atamaniuk, I. Ecological sorbent based on saponite mineral from Ukrainian clay-field. Chem. Chem. Technol. 2012, 6, 451–457. [Google Scholar]
- Polyakov, V.E.; Tarasevich, Y.I. Ion-exchange equilibriums involving single-charged cations on saponite. J. Water Chem. Technol. 2012, 34, 11–16. [Google Scholar] [CrossRef]
- Kohyama, N.; Shimoda, S.; Sudo, T. Iron-rich saponite (ferrous and ferric forms). Clays Clay Miner. 1973, 21, 229–237. [Google Scholar] [CrossRef]
- April, R.H.; Keller, D.M. Saponite and vermiculite in amygdales of the Granby basaltic tuff, Connecticut Valley. Clays Clay Miner. 1992, 40, 22–31. [Google Scholar] [CrossRef]
- Murray, H.H. Traditional and new applications for kaolin, smectite, and palygorskite: A general overview. Appl. Clay Sci. 2000, 17, 207–221. [Google Scholar] [CrossRef]
- Cowking, A.; Wilson, M.; Tait, J.; Robertson, R. Structure and swelling of fibrous and granular saponitic clay from Orrock quarry, Fife, Scotland. Clay Miner. 1983, 18, 49–64. [Google Scholar] [CrossRef]
- Suquet, H.; De La Calle, C.; Pezerat, H. Swelling and structural organization of saponite. Clays Clay Miner. 1975, 23, 1–9. [Google Scholar] [CrossRef]
- Kemp, S.; Rochelle, C.; Merriman, R. Back-reacted saponite in Jurassic mudstones and limestones intruded by a Tertiary sill, Isle of Skye. Clay Miner. 2005, 40, 263–282. [Google Scholar] [CrossRef]
- Garvie, L.; Metcalfe, R. A vein occurrence of co-existing talc, saponite, and corrensite, Builth Wells, Wales. Clay Miner. 1997, 32, 223–240. [Google Scholar] [CrossRef]
- Casal, B.; Merino, J.; Ruiz-Hitzky, E.; Gutierrez, E.; Alvarez, A. Characterization, pillaring and catalytic properties of a saponite from Vicálvaro, Madrid, Spain. Clay Miner. 1997, 32, 41–54. [Google Scholar] [CrossRef]
- Ece, O.I.; Coban, F.; Gungor, N.; Suner, F. Clay mineralogy and occurrence of ferrian smectites between serpentinite saprolites and basalts in Biga peninsula, northwest Turkey. Clays Clay Miner. 1999, 47, 241–251. [Google Scholar] [CrossRef]
- Post, J.L. Saponite from near Ballarat, California. Clays Clay Miner. 1984, 32, 147–153. [Google Scholar] [CrossRef]
- Treiman, A.H.; Morris, R.V.; Agresti, D.G.; Graff, T.G.; Achilles, C.N.; Rampe, E.B.; Bristow, T.F.; Blake, D.F.; Vaniman, D.T.; Bish, D.L. Ferrian saponite from the Santa Monica Mountains (California, USA, Earth): Characterization as an analog for clay minerals on Mars with application to Yellowknife Bay in Gale Crater. Am. Mineral. 2014, 99, 2234–2250. [Google Scholar] [CrossRef]
- Brigatti, M.; Lugli, C.; Poppi, L.; Venturelli, G. Iron-rich saponite: Dissolution reactions and Cr uptake. Clay Miner. 1999, 34, 637–645. [Google Scholar] [CrossRef]
- Wilson, M.; Deer, W.; Howie, R.; Zussman, J. Rock-Forming Minerals, Volume 3C, Sheet Silicates: Clay Minerals, 2nd ed.; Geological Society: London, UK, 2013; pp. 300–323. ISBN 978-1-86239-359-2. [Google Scholar]
- Bishop, J.; Murad, E.; Dyar, M. The influence of octahedral and tetrahedral cation substitution on the structure of smectites and serpentines as observed through infrared spectroscopy. Clay Miner. 2002, 37, 617–628. [Google Scholar] [CrossRef]
- Ogorodova, L.; Kiseleva, I.; Mel’chakova, L.; Vigasina, M.; Krupskaya, V.; Sud’in, V. Calorimetric determination of the enthalpy of formation of natural saponite. Geochem. Int. 2015, 53, 617–623. [Google Scholar] [CrossRef]
- Pshinko, G.; Kobets, S.; Bogolepov, A.; Goncharuk, V. Treatment of waters containing uranium with saponite clay. J. Water Chem. Technol. 2010, 32, 10–16. [Google Scholar] [CrossRef]
- Prieto, O.; Vicente, M.A.; Bañares-Muñoz, M.A. Study of the porous solids obtained by acid treatment of a high surface area saponite. J. Porous Mater. 1999, 6, 335–344. [Google Scholar] [CrossRef]
- Lowell, S.; Shields, J.E.; Thomas, M.A.; Thommes, M. Characterization of Porous Solids and Powders: Surface Area, Pore Size and Density; Springer Science & Business Media: New York, NY, USA, 2012; Volume 16, ISBN 9789048166336. [Google Scholar]
- Condon, J.B. Surface Area and Porosity Determinations by Physisorption: Measurements and Theory; Elsevier: Amsterdam, The Netherlands, 2006; ISBN 9780444519641. [Google Scholar]
- Sing, K.S.W.; Rouquerol, F.; Rouquerol, J.; Llewellyn, P. Assessment of mesoporosity. In Adsorption by Powders and Porous Solids Principles, Methodology and Applications, 2nd ed.; Rouquerol, F., Rouquerol, J., Sing, K.S.W., Llewellyn, P., Maurin, G., Eds.; Academic Press: Amsterdam, The Netherlands, 2014; pp. 269–302. ISBN 9780080970356. [Google Scholar]
- Dmitrenko, Y.A.; Mamchenko, A. Sorption of hydrochloric acid with saponite. J. Water Chem. Technol. 2013, 35, 15–22. [Google Scholar] [CrossRef]
- Stucki, J.W. Properties and Behaviour of Iron in Clay Minerals. In Handbook of Clay Science: Developments in Clay Science; Bergaya, F., Theng, B.K.G., Legaly, G., Eds.; Elsevier: Amsterdam, The Netherlands, 2006; Volume 1, pp. 423–475. ISBN 9780080441832. [Google Scholar]
- Forano, C.; Hibino, T.; Leroux, F.; Taviot-Guého, C. Layered double hydroxides. In Handbook of Clay Science: Developments in Clay Science; Bergaya, F., Theng, B.K.G., Legaly, G., Eds.; Elsevier: Amsterdam, The Netherlands, 2006; Volume 1, pp. 1021–1095. ISBN 9780080441832. [Google Scholar]
- Stucki, J.W.; Lee, K.; Zhang, L.; Larson, R.A. Effects of iron oxidation states on the surface and structural properties of smectites. Pure Appl. Chem. 2002, 74, 2145–2158. [Google Scholar] [CrossRef]
- Rodriguez, M.V.; Barrios, M.S.; Gonzalez, J.L.; Munoz, M.B. Acid activation of a ferrous saponite (griffithite): Physico-chemical characterization and surface area of the products obtained. Clays Clay Miner. 1994, 42, 724–730. [Google Scholar] [CrossRef]
- Suárez Barrios, M.; De Santiago Buey, C.; García Romero, E.; Martín Pozas, J.M. Textural and structural modifications of saponite from Cerro del Aguila by acid treatment. Clay Miner. 2001, 36, 483–488. [Google Scholar] [CrossRef]
- Cuadros, J.; Michalski, J.R.; Dekov, V.; Bishop, J.; Fiore, S.; Dyar, M.D. Crystal-chemistry of interstratified Mg/Fe-clay minerals from seafloor hydrothermal sites. Chem. Geol. 2013, 360, 142–158. [Google Scholar] [CrossRef]
- Everett, D. IUPAC Manual of Symbols and Terminology: Appendix 2, Part 1: Colloid and Surface Chemistry. Pure Appl. Chem. 1972, 31, 577–638. [Google Scholar] [CrossRef]
- Sing, K.; Williams, R. Physisorption hysteresis loops and the characterization of nanoporous materials. Adsorp. Sci. Technol. 2004, 22, 773–782. [Google Scholar] [CrossRef]
- Rouquerol, J.; Llewellyn, P.; Sing, K. Adsorption by Clays, Pillared Clays, Zeolites and Aluminophosphates. In Adsorption by Powders and Porous Solids: Principles, Methodology and Applications, 2nd ed.; Rouquerol, F., Rouquerol, J., Sing, K.S.W., Llewellyn, P., Maurin, G., Eds.; Academic Press: Amsterdam, The Netherlands, 2013; pp. 467–527. ISBN 9780080970356. [Google Scholar]
- Sing, K. The use of nitrogen adsorption for the characterisation of porous materials. Colloids Surf. A 2001, 187, 3–9. [Google Scholar] [CrossRef]
- Nikolopoulou, A.; Papoulis, D.; Komarneni, S.; Tsolis-Katagas, P.; Panagiotaras, D.; Kacandes, G.H.; Zhang, P.; Yin, S.; Sato, T. Solvothermal preparation of TiO2/saponite nanocomposites and photocatalytic activity. Appl. Clay Sci. 2009, 46, 363–368. [Google Scholar] [CrossRef]
- Madejova, J.; Palkova, H.; Komadel, P. IR spectroscopy of clay minerals and clay nanocomposites. In Spectroscopic Properties of Inorganic and Organometallic Compounds: Techniques, Materials and Applications, Volume 41; Yarwood, J., Douthwaite, R., Duckett, S., Eds.; The Royal Society of Chemistry: London, UK, 2010; Volume 41, pp. 22–71. ISBN 9781847550477. [Google Scholar]
- Mas, A.; Meunier, A.; Beaufort, D.; Patrier, P.; Dudoignon, P. Clay minerals in basalt-hawaiite rocks from mururoa atoll (French polynesia). I. mineralogy. Clays Clay Miner. 2008, 56, 711–729. [Google Scholar] [CrossRef]
- Madejová, J.; Komadel, P. Information available from infrared spectra of the fine fractions of bentonites. In The Application of Vibrational Spectroscopy to Clay Minerals and Layered Double Hydroxides. CMS Workshop Lectures; Theo Kloprogge, J., Ed.; Clay Minerals Society: Aurora, CO, USA, 2005; Volume 13, pp. 66–98. ISBN 9781881208141. [Google Scholar]
- Zviagina, B.B.; McCarty, D.K.; Środonón, J.; Drits, V.A. Interpretation of infrared spectra of dioctahedral smectites in the region of OH-stretching vibrations. Clays Clay Miner. 2004, 52, 399–410. [Google Scholar] [CrossRef]
- Madejova, J.; Komadel, P. Baseline studies of the clay minerals society source clays: Infrared methods. Clays Clay Miner. 2001, 49, 410–432. [Google Scholar] [CrossRef]
- Hradil, D.; Grygar, T.; Hrušková, M.; Bezdička, P.; Lang, K.; Schneeweiss, O.; Chvátal, M. Green earth pigment from the Kadaň Region, Czech Republic: Use of rare Fe-rich smectite. Clays Clay Miner. 2004, 52, 767–778. [Google Scholar] [CrossRef]
- Uthirakumar, P.; Kim, C.-J.; Nahm, K.S.; Hahn, Y.B.; Lee, Y.-S. Preparation and characterization of new difunctional cationic radical initiator-montmorillonite hybrids. Colloids Surf. A 2004, 247, 69–75. [Google Scholar] [CrossRef]
- Komadel, P.; Madejová, J. Acid Activation of Clay Minerals. In Developments in Clay Science; Bergaya, F., Theng, B.K.G., Legaly, G., Eds.; Elsevier: Amsterdam, The Netherlands, 2006; Volume 1, pp. 263–287. ISBN 9780080441832. [Google Scholar]
© 2019 by the authors. Licensee MDPI, Basel, Switzerland. This article is an open access article distributed under the terms and conditions of the Creative Commons Attribution (CC BY) license (http://creativecommons.org/licenses/by/4.0/).


 ,
, 


