Equilibrium, Kinetic, and Thermodynamic Studies of Anionic Dyes Adsorption on Corn Stalks Modified by Cetylpyridinium Bromide


Abstract
:1. Introduction
2. Materials and Methods
2.1. Materials
2.2. Methods
2.2.1. Preparation of Adsorbent
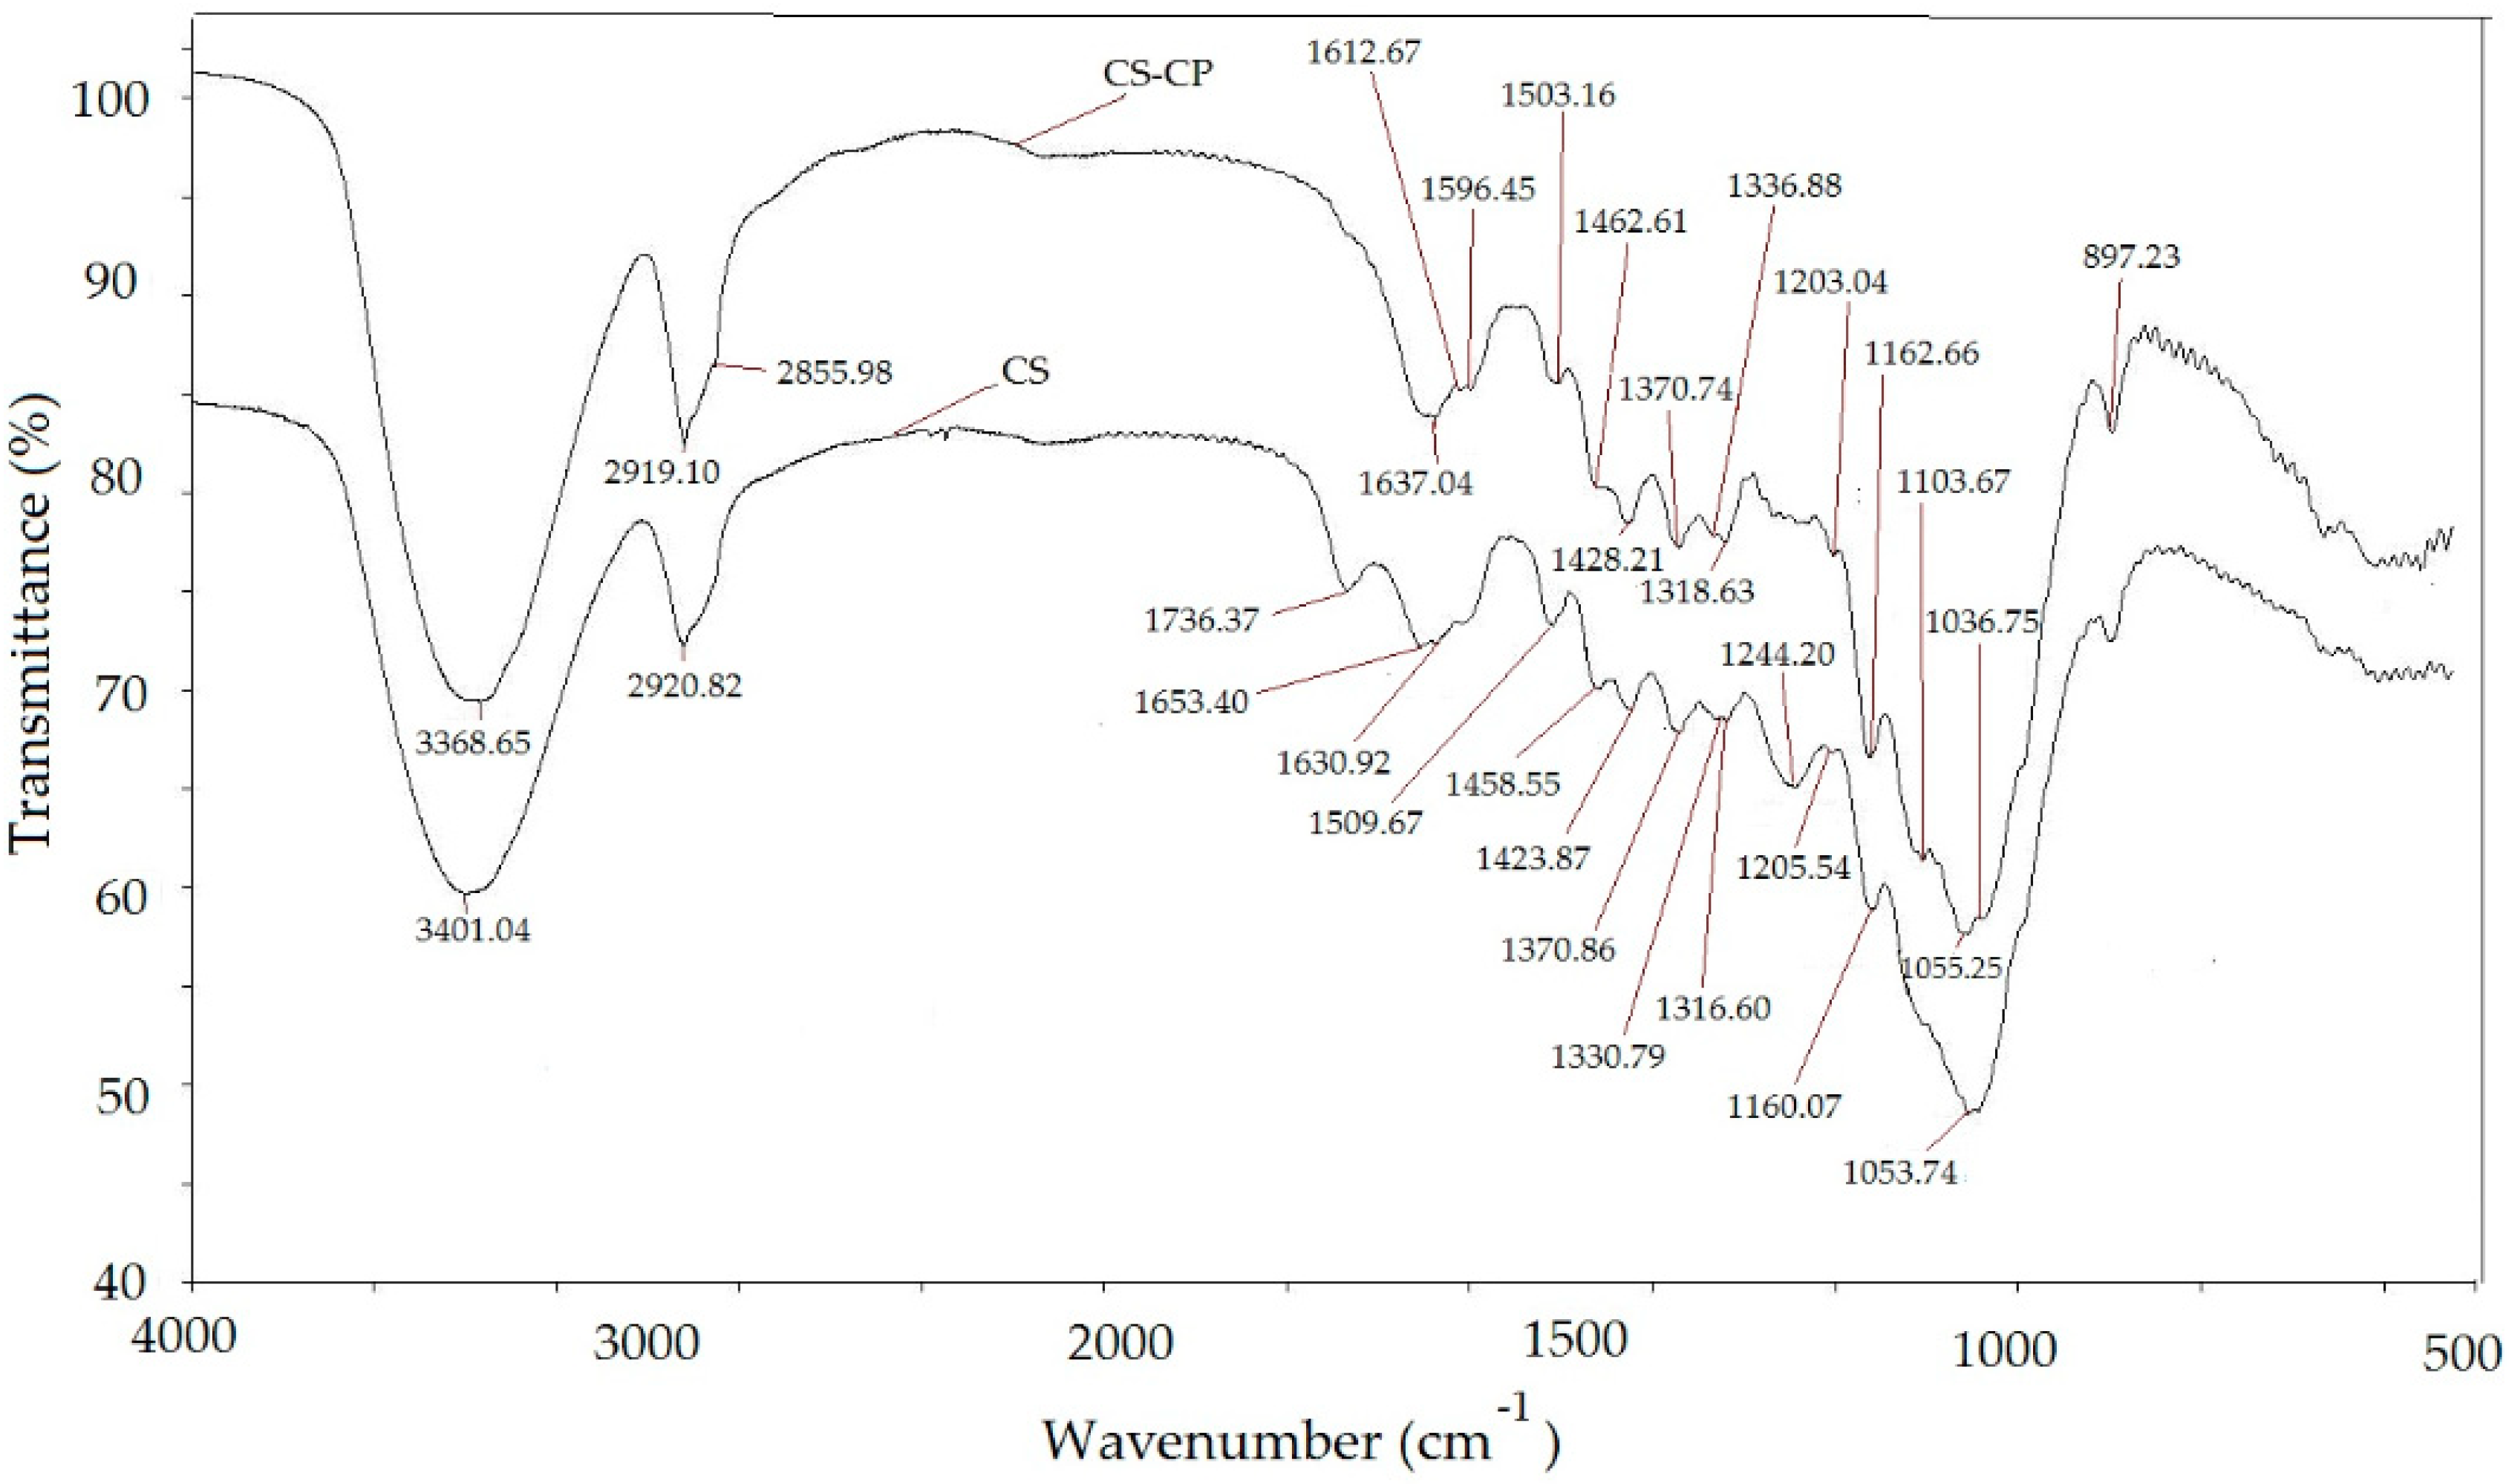
2.2.2. Infrared Analysis
2.2.3. Batch Experiments
2.2.4. Desorption Studies
2.2.5. Adsorption Isotherms
2.2.6. Kinetic Studies
2.2.7. Adsorption Thermodynamics
2.2.8. Error Analysis
3. Results and Discussion
3.1. Characterization of Adsorbent
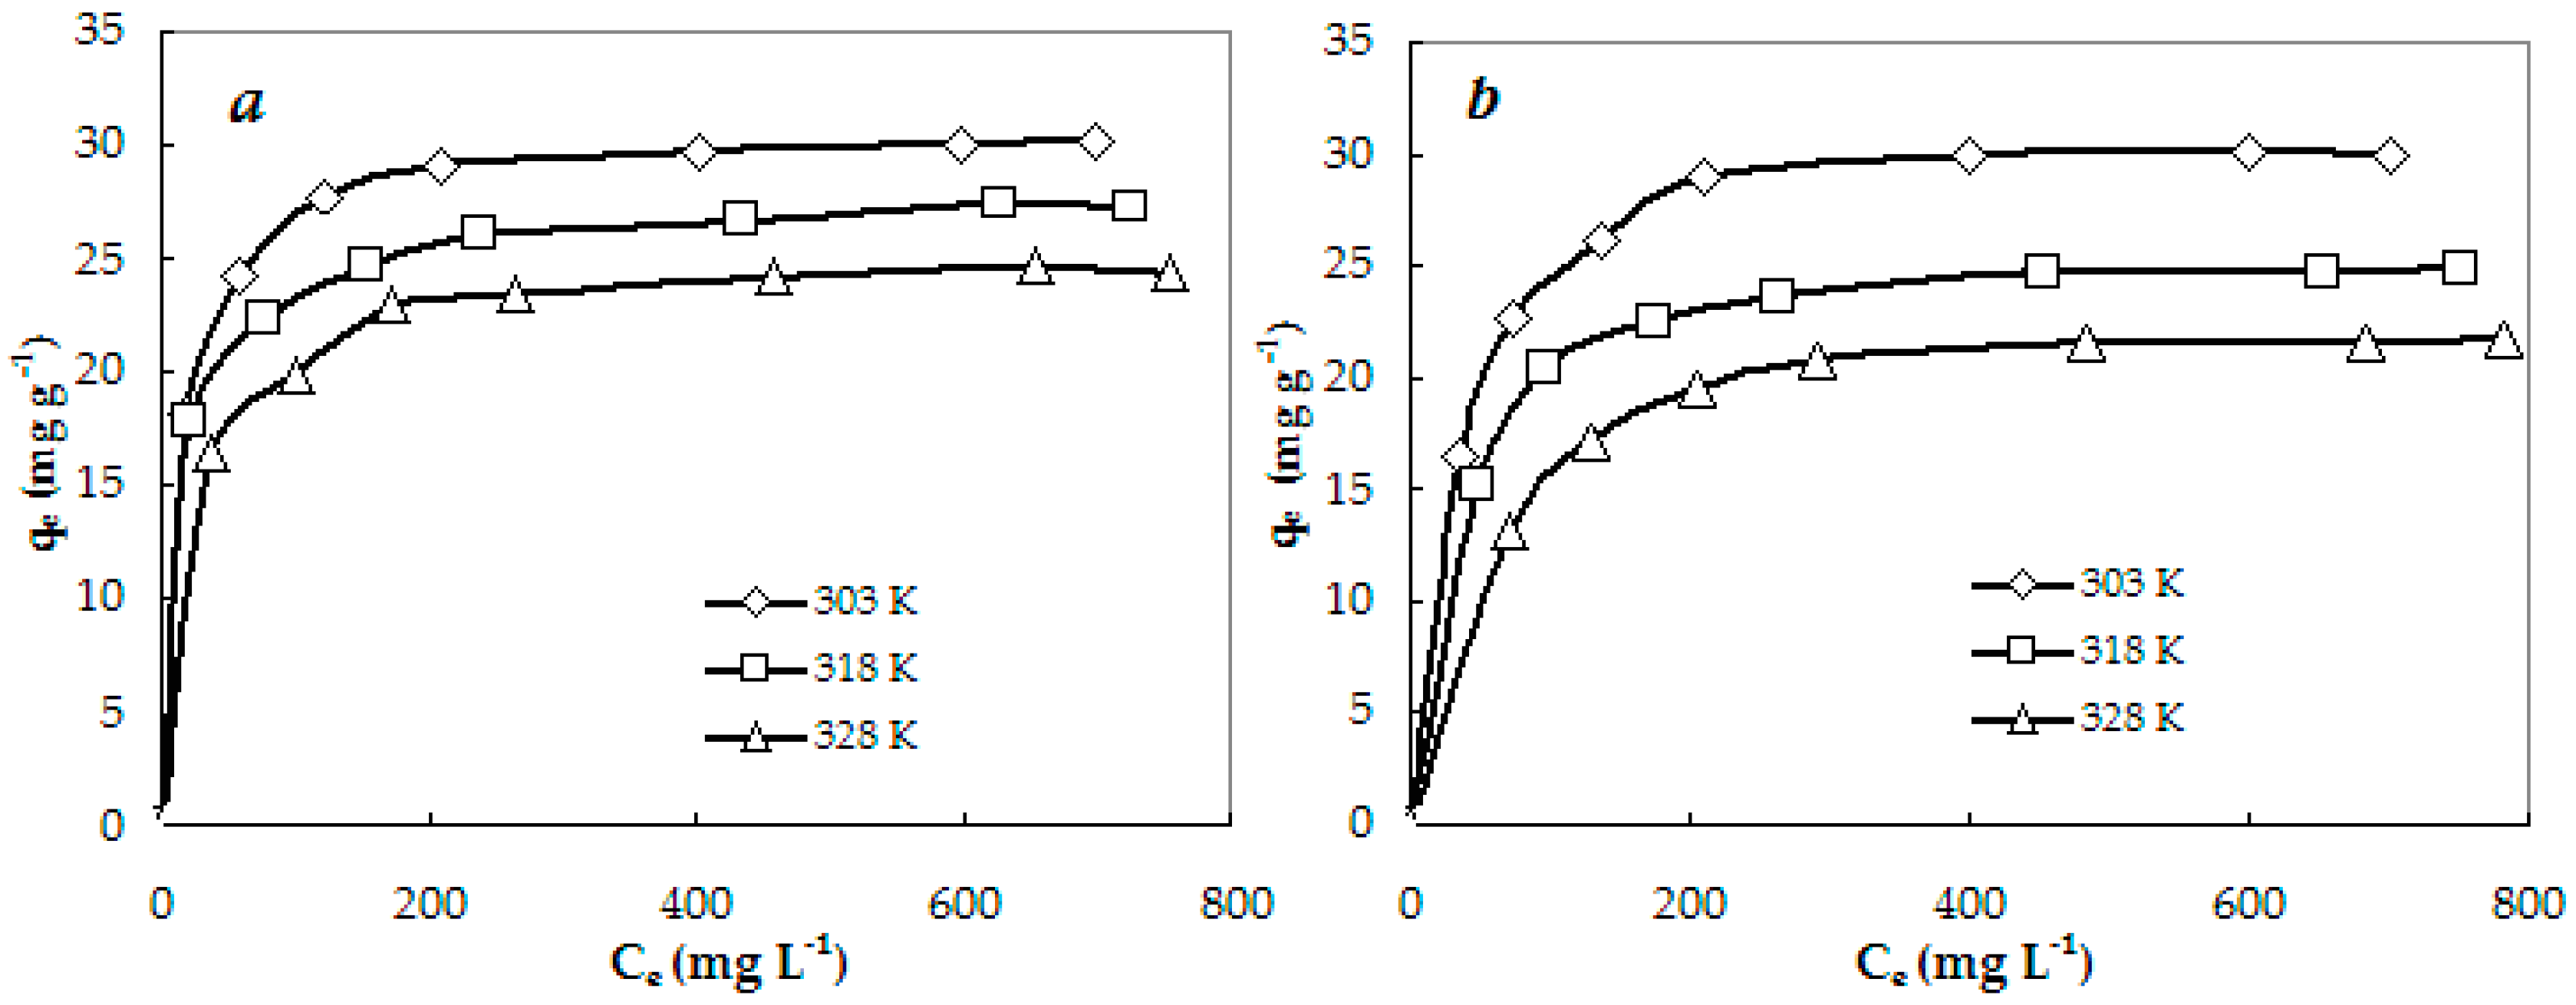
3.2. Equilibrium Studies
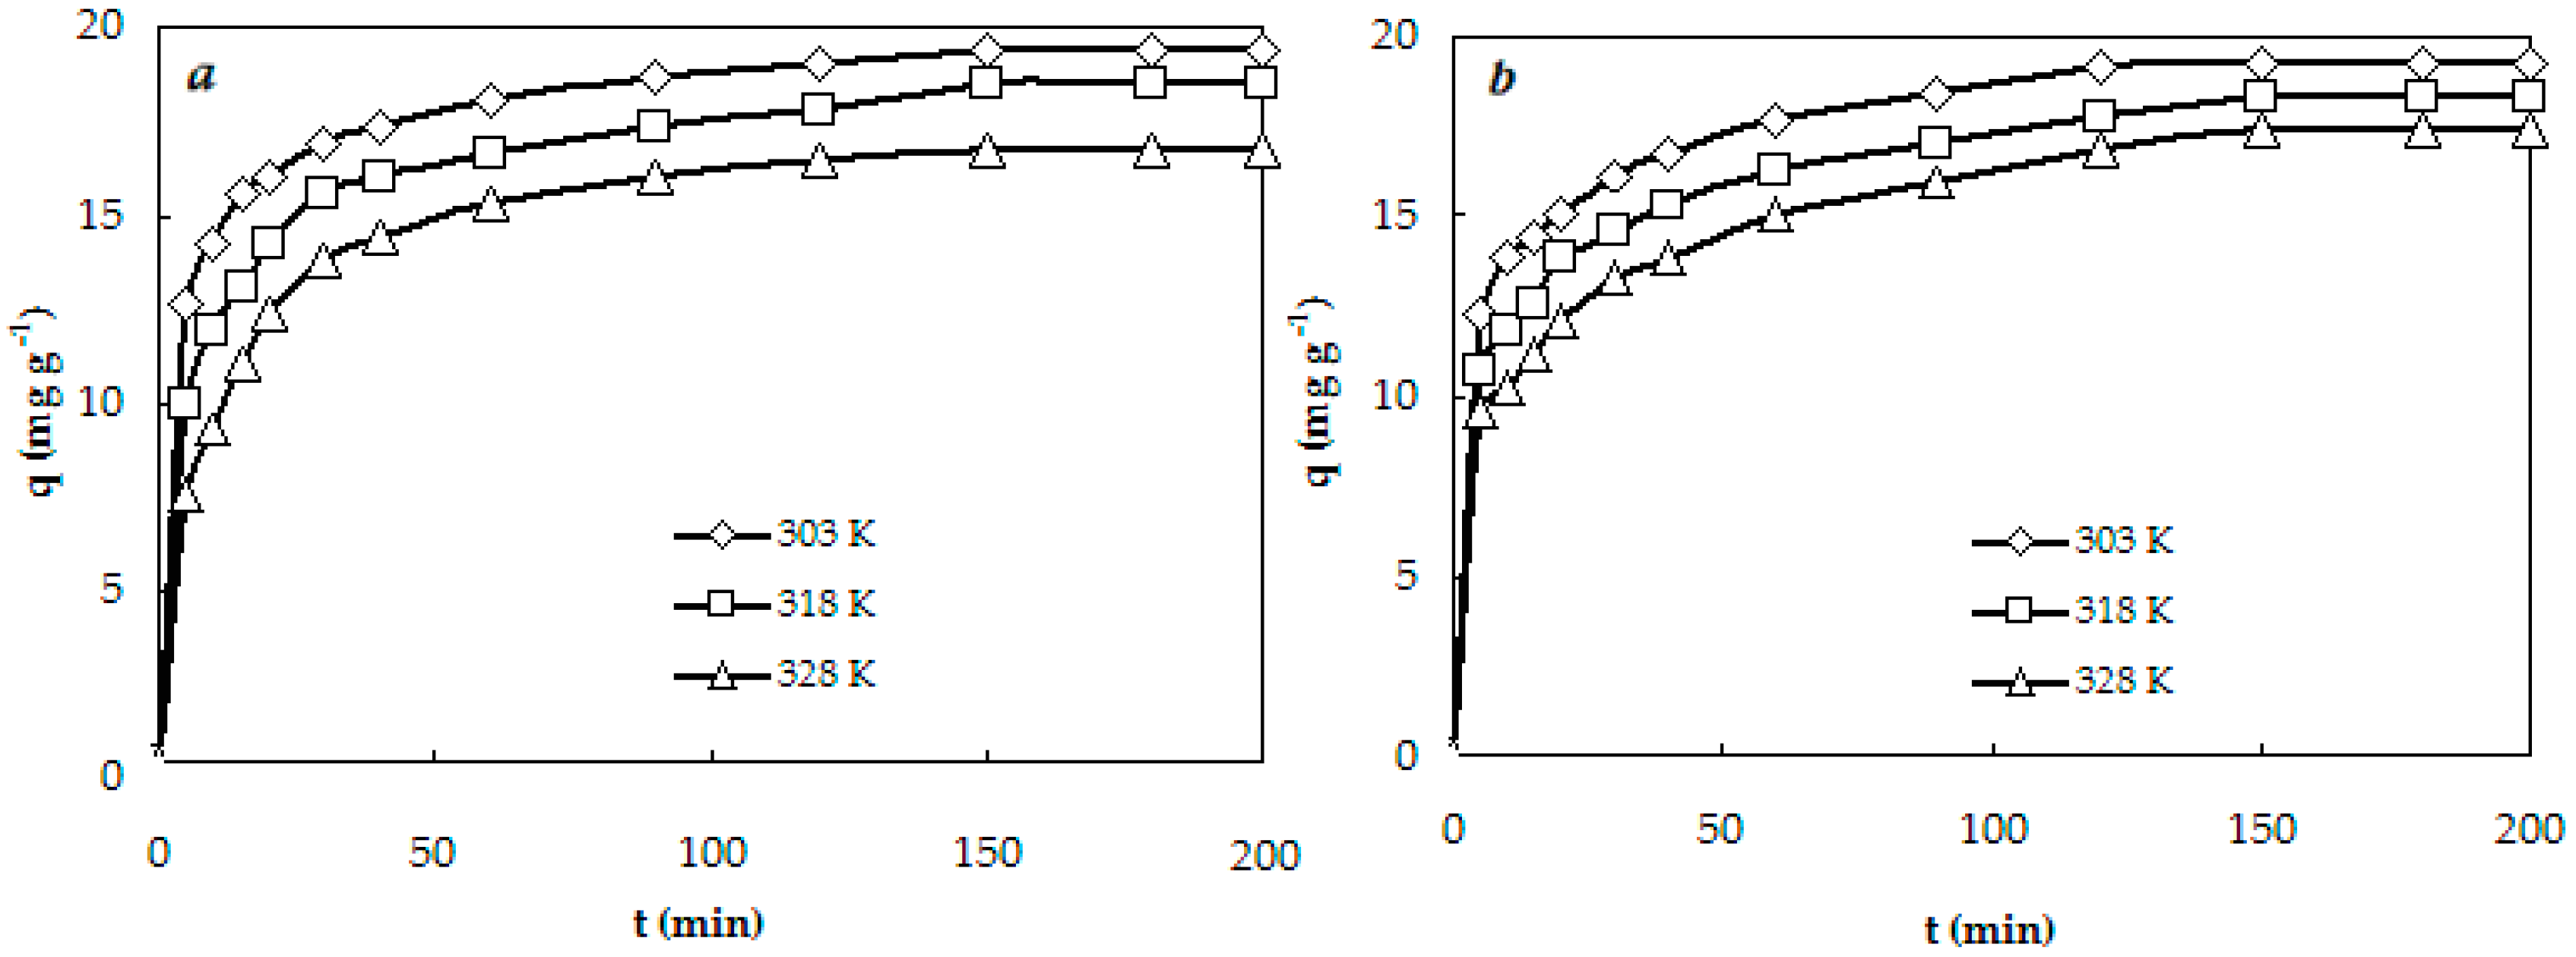
3.3. Kinetics Studies
3.4. Thermodynamic Study
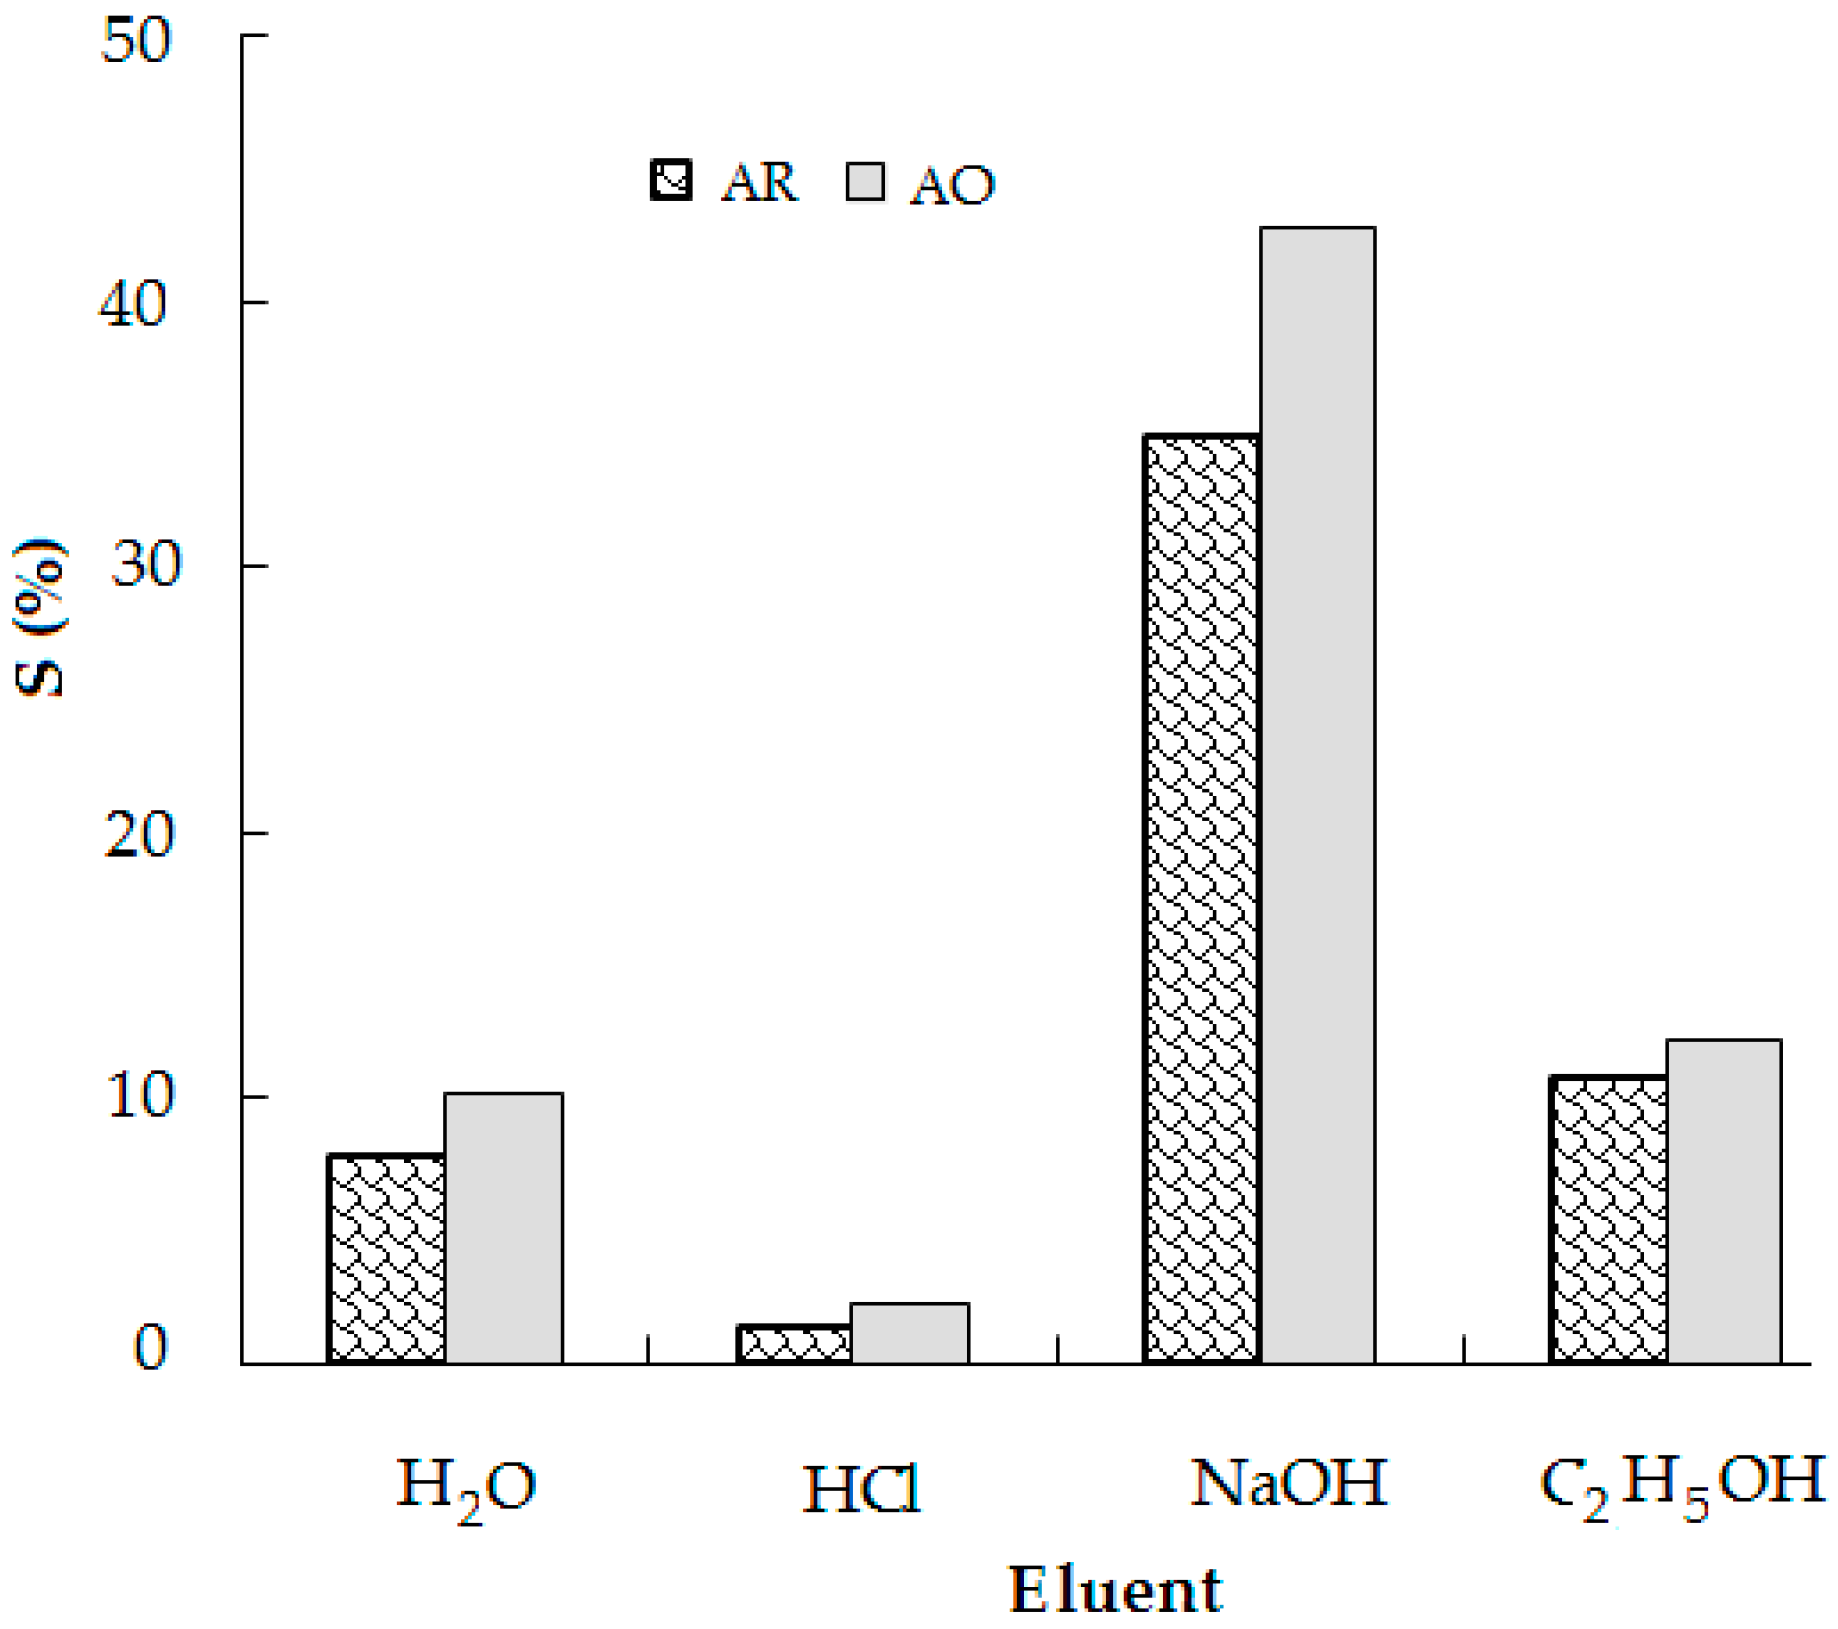
3.5. Desorption Studies
3.6. Adsorption Mechanism
4. Conclusions
Author Contributions
Funding
Conflicts of Interest
References
- Ansari, R.; Seyghali, B. Application of wood sawdust modified with cationic surfactants for efficient removal of acidic dyes from aqueous solutions: Kinetic and thermodynamic studies. Eur. Chem. Bull. 2013, 2, 499–506. [Google Scholar] [CrossRef]
- Bharathi, K.S.; Ramesh, S.T. Removal of dyes using agricultural waste as low-cost adsorbents: A review. Appl. Water Sci. 2013, 3, 773–790. [Google Scholar] [CrossRef]
- Zaharia, C.; Suteu, D. Textile organic dyes—Characteristics, polluting effects and separation/elimination procedures from industrial effluents—A critical overview. In Organic Pollutants Ten Years after the Stockholm Convention—Environmental and Analytical Update; Puzyn, T., Ed.; InTechOpen: Rijeka, Croatia, 2012; pp. 55–86. ISBN 978-953-307-917-22. [Google Scholar]
- Gisi, S.D.; Lofrano, G.; Grassi, M.; Notarnicola, M. Characteristics and adsorption capacities of low-cost sorbents for wastewater treatment: A review. Sustain. Mater. Technol. 2016, 9, 10–40. [Google Scholar] [CrossRef]
- Soldatkina, L.M.; Zavrichko, M.A. Application of agriculture waste as biosorbents for dye removal from aqueous solution. Chemistry, Physics and Technology of Surface. Хімія, фізика та технoлoгія пoверхні 2013, 4, 99–104. [Google Scholar] [CrossRef]
- Oei, B.C.; Ibrahim, S.; Wang, S.; Ang, H.M. Surfactant modified barley straw for removal of acid and reactive dyes from aqueous solution. Bioresour. Technol. 2009, 100, 4292–4295. [Google Scholar] [CrossRef] [PubMed]
- Su, Y.; Zhao, B.; Xiao, W.; Han, R. Adsorption behavior of light green anionic dye using cationic surfactant-modified wheat straw in batch and column mode. Environ. Sci. Pollut. Res. 2013, 20, 5558–5568. [Google Scholar] [CrossRef] [PubMed]
- Su, Y.; Jiao, Y.; Dou, C.; Han, R. Biosorption of methyl orange from aqueous solutions using cationic surfactant-modified wheat straw in batch mode. Desalin. Water Treat. 2014, 52, 6145–6156. [Google Scholar] [CrossRef]
- Zhao, B.; Xiao, W.; Shang, Y.; Zhu, H.; Han, R. Adsorption of light green anionic dye using cationic surfactant-modified peanut husk in batch mode. Arab. J. Chem. 2017, 10, S3595–S3602. [Google Scholar] [CrossRef]
- Kamaru, A.A.; Sani, N.S.; Malek, N.A.N.N. Raw and surfactant-modified pineapple leaf as adsorbent for removal of methylene blue and methyl orange from aqueous solution. Desalin. Water Treat. 2015, 1–15. [Google Scholar] [CrossRef]
- Namasivayam, C.; Sureshkumar, M.V. Anionic Dye Adsorption Characteristics of Surfactant-Modified Coir Pith, a ‘Waste’ Lignocellulosic. J. Appl. Polym. Sci. 2006, 100, 1538–1546. [Google Scholar] [CrossRef]
- Kumar, R.; Sharma, R.K.; Singh, A.P. Cellulose based grafted biosorbents-Journey from lignocellulose biomass to toxic metal ions sorption applications—A review. J. Mol. Liquids 2017, 232, 62–93. [Google Scholar] [CrossRef]
- Ibrahim, S.C. Treatment of Oily and Dye Wastewater with Modified Barley Straw. Available online: http://hdl.handle.net/20.500.11937/589 (accessed on 30 January 2017).
- Chen, Y.L.; Chen, S.; Frank, C.; Israelachvili, J. Molecular mechanisms and kinetics during the self-assembly of surfactant layers. J. Colloid Interface Sci. 1992, 153, 244–265. [Google Scholar] [CrossRef]
- Soldatkina, L.M.; Menchuk, V.V.; Zavrichko, M.A. Adsorption properties of polyaniline modified corn stalks. Herald ONU (Ukr). Chem. 2013, 18, 13–19. [Google Scholar] [CrossRef]
- Ofomaja, A.E.; Ho, Y.-S. Equilibrium sorption of anionic dye from aqueous solution by palm kernel fibre as sorbent. Dyes Pigments 2007, 74, 60–66. [Google Scholar] [CrossRef]
- Khambhaty, Y.; Mody, K.; Basha, S.; Jha, B. Kinetics, equilibrium and thermodynamic studies on biosorption of hexavalent chromium by dead fungal biomass of marine Aspergillus niger. Chem. Eng. J. 2009, 145, 489–495. [Google Scholar] [CrossRef]
- Bhatt, H.N.; Safa, Y. Removal of anionic dyes by rice milling waste from synthetic effluents: Equilibrium and thermodynamic studies. Desalin. Water Treat. 2012, 48, 267–277. [Google Scholar] [CrossRef]
- Itodo, A.U.; Itodo, H.U. Activation chemistry and kinetics of Shea nut shell biosorbents for textile waste water treatment. Acad. Arena 2010, 2, 51–60. [Google Scholar] [CrossRef]
- Gholizadeh, A.; Kermani, M.; Gholami, M.; Farzadkia, M. Kinetic and isotherm studies of adsorption and biosorption processes in the removal of phenolic compounds from aqueous solutions: Comparative study. J. Environ. Health Sci. Eng. 2013, 11, 1–10. [Google Scholar] [CrossRef] [PubMed]
- Azimvand, J.; Didehban, K.; Mirshokraie, S.A. Safranin-O removal from aqueous solutions using lignin nanoparticle-g-polyacrylic acid adsorbent: Synthesis, properties, and application. Adsorpt. Sci. Technol. 2018, 36, 1422–1440. [Google Scholar] [CrossRef]
- Mousa, K.M.; Taha, A.H. Adsorption of Reactive Blue Dye onto Natural and Modified Wheat Straw. Am. J. Chem. Eng. 2016, 4, 9–15. [Google Scholar] [CrossRef]


| Dye | Molecular Structure | Van der Waals Area (nm2) |
|---|---|---|
| Acid Red (AR) | 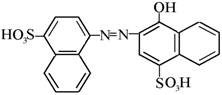 | 1.19 |
| Acid Orange (AO) | 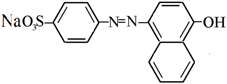 | 0.58 |
| Adsorbent | S (m2 g−1) | pHpzc | Δ (g cm−3) |
|---|---|---|---|
| CS | 19.6 | 6.7 | 0.09 |
| CS-CP | 42.6 | 5.1 | 0.18 |
| Isotherm Model | Parameter | AR | AO | ||||
|---|---|---|---|---|---|---|---|
| 303 (K) | 318 (K) | 328 (K) | 303 (K) | 318 (K) | 328 (K) | ||
| Langmuir | qm (mg g−1) | 30.77 | 27.78 | 25.06 | 31.06 | 25.71 | 22.78 |
| KL·102 (L mg−1) | 7.8 | 6.9 | 5.9 | 4.7 | 4.1 | 3.0 | |
| R2 | 1.0000 | 0.9998 | 0.9997 | 0.9995 | 0.9997 | 0.9988 | |
| SE | 0.55 | 1.05 | 1.05 | 1.41 | 0.88 | 1.26 | |
| χ2 | 0.17 | 1.00 | 0.91 | 1.07 | 0.46 | 2.04 | |
| Freundlich | 1/n | 0.29 | 0.27 | 0.27 | 0.32 | 0.31 | 0.30 |
| KF (mg1−1/n L1/n g−1) | 5.73 | 5.63 | 4.85 | 4.53 | 3.86 | 3.39 | |
| R2 | 0.8673 | 0.8754 | 0.8916 | 0.9029 | 0.9062 | 0.9521 | |
| SE | 5.20 | 4.07 | 3.34 | 4.64 | 3.62 | 2.39 | |
| χ2 | 8.10 | 5.86 | 4.08 | 5.92 | 4.38 | 2.00 | |
| Temkin | KT (L g−1) | 2.16 | 2,61 | 1.87 | 1.00 | 0.87 | 0.74 |
| b (J mol−1) | 562 | 650 | 695 | 509 | 610 | 696 | |
| R2 | 0.9526 | 0.9616 | 0.9674 | 0.9697 | 0.9643 | 0.9709 | |
| SE | 2.25 | 1.75 | 1.41 | 1.80 | 1.54 | 1.18 | |
| χ2 | 1.87 | 1.38 | 0.89 | 1.02 | 0.88 | 0.62 | |
| Kinetic Model | Parameter | AR | AO | ||||
|---|---|---|---|---|---|---|---|
| 303 (K) | 318 (K) | 328 (K) | 303 (K) | 318 (K) | 328 (K) | ||
| Experimental | te (min) | 150 | 150 | 150 | 150 | 150 | 150 |
| Data | qeexp (mg g−1) | 19.42 | 18.52 | 16.73 | 19.25 | 18.34 | 17.41 |
| Pseudo-First Order | qecalc (mg g−1) | 9.53 | 6.96 | 15.94 | 8.36 | 7.73 | 15.72 |
| k1·102 (min−1) | 3.90 | 2.00 | 4.90 | 3.15 | 2.15 | 4.16 | |
| R2 | 0.8363 | 0.9469 | 0.8251 | 0.9636 | 0.9902 | 0.7911 | |
| SE | 11.20 | 12.62 | 2.12 | 12.02 | 11.65 | 3.29 | |
| χ2 | 252.81 | 575.98 | 8.19 | 361.15 | 448.16 | 23.52 | |
| Pseudo-Second Order | qecalc (mg g−1) | 19.84 | 19.01 | 17.45 | 19.84 | 19.01 | 18.25 |
| k2·103 (g mg−1 min−1) | 10.80 | 7.54 | 7.15 | 8.88 | 6.79 | 5.62 | |
| R2 | 0.9998 | 0.9993 | 0.9999 | 0.9996 | 0.9993 | 0.9988 | |
| SE | 0.82 | 1.04 | 0.31 | 1.05 | 1.12 | 1.19 | |
| χ2 | 0.62 | 1.12 | 0.12 | 1.09 | 1.55 | 2.07 | |
| Elovich | α (mg g−1 min−1) | 564.69 | 49.40 | 13.83 | 198.27 | 49.35 | 20.11 |
| β (g mg−1) | 0.55 | 0.44 | 0.40 | 0.50 | 0.45 | 0.42 | |
| R2 | 0.9731 | 0.9722 | 0.9501 | 0.9856 | 0.9902 | 0.9861 | |
| SE | 0.38 | 0.49 | 1.58 | 0.31 | 0.59 | 0.83 | |
| χ2 | 0.01 | 0.17 | 1.93 | 0.05 | 0.24 | 0.59 | |
| Weber and Morris | kid (mg g−1 min−1/2) | 0.488 | 0.618 | 0.672 | 0.551 | 0.622 | 0.672 |
| I (mg g−1) | 13.40 | 10.85 | 8.61 | 12.47 | 10.53 | 8.92 | |
| R2 | 0.8496 | 0.8506 | 0.8058 | 0.8919 | 0.9161 | 0.9355 | |
| SE | 0.91 | 1.14 | 1.46 | 0.85 | 0.83 | 0.78 | |
| χ2 | 0.51 | 0.93 | 1.74 | 0.44 | 0.47 | 0.43 | |
| Dye | T (K) | K·10−5 | −ΔGo (kJ mol−1) | −ΔHo (kJ mol−1) | ΔSo (J K−1 mol−1) |
|---|---|---|---|---|---|
| AR | 303 | 1.60 | 30.2 | 9.0 | 70 |
| 318 | 1.42 | 31.3 | |||
| 328 | 1.20 | 31.9 | |||
| AO | 303 | 1.50 | 30.0 | 14.0 | 53 |
| 318 | 1.32 | 31.2 | |||
| 328 | 1.21 | 31.3 |
© 2018 by the authors. Licensee MDPI, Basel, Switzerland. This article is an open access article distributed under the terms and conditions of the Creative Commons Attribution (CC BY) license (http://creativecommons.org/licenses/by/4.0/).
Share and Cite
Soldatkina, L.; Zavrichko, M. Equilibrium, Kinetic, and Thermodynamic Studies of Anionic Dyes Adsorption on Corn Stalks Modified by Cetylpyridinium Bromide. Colloids Interfaces 2019, 3, 4. https://doi.org/10.3390/colloids3010004
Soldatkina L, Zavrichko M. Equilibrium, Kinetic, and Thermodynamic Studies of Anionic Dyes Adsorption on Corn Stalks Modified by Cetylpyridinium Bromide. Colloids and Interfaces. 2019; 3(1):4. https://doi.org/10.3390/colloids3010004
Chicago/Turabian StyleSoldatkina, Liudmyla, and Marianna Zavrichko. 2019. "Equilibrium, Kinetic, and Thermodynamic Studies of Anionic Dyes Adsorption on Corn Stalks Modified by Cetylpyridinium Bromide" Colloids and Interfaces 3, no. 1: 4. https://doi.org/10.3390/colloids3010004
APA StyleSoldatkina, L., & Zavrichko, M. (2019). Equilibrium, Kinetic, and Thermodynamic Studies of Anionic Dyes Adsorption on Corn Stalks Modified by Cetylpyridinium Bromide. Colloids and Interfaces, 3(1), 4. https://doi.org/10.3390/colloids3010004