Article

Experimental Investigations of Behaviour of Biosurfactants in Brine Solutions Relevant to Hydrocarbon Reservoirs

1
Chemical/Petrochemical Engineering Department, Akwa Ibom State University, Ikot Akpaden, Akwa Ibom State, Nigeria
2
School of Engineering, University of Aberdeen, Aberdeen AB24 3UE, UK
*
Author to whom correspondence should be addressed.
Colloids Interfaces 2019, 3(1), 24; https://doi.org/10.3390/colloids3010024
Submission received: 21 December 2018 / Revised: 29 January 2019 / Accepted: 30 January 2019 / Published: 2 February 2019

Abstract

:
In this study, we investigated the behaviour of rhamnolipid and Greenzyme in brine solutions relevant to hydrocarbon reservoir. Prior to this work, several studies only reported the behaviour of the biosurfactants dissolved in sodium chloride solutions of varied salinity. The results of this study are relevant to the application of the biosurfactants in enhanced oil recovery, during which the compounds are injected into reservoir saturated with formation water, typically of high salinity and complex composition. Surface tension and conductivity methods were used to determine the critical micelle concentrations of the biosurfactants, Gibbs surface excess concentrations and standard free energy at water-air interface. The results show that rhamnolipid and Greenzyme could reduce the surface tension of water from 72.1 ± 0.2 mN/m to 34.7 ± 0.4 mN/m and 47.1 ± 0.1 mN/m respectively. They were also found to be stable in high salinity and high temperature with rhamnolipid being sensitive to brine salinity, composition and pH while Greenzyme showed tolerance for high salinity. Furthermore, the Gibbs standard free energy of micellisation shows that rhamnolipid and Greenzyme have the tendency to spontaneously form micelles with rhamnolipid showing more surface adsorption. However from maximal Gibbs surface excess concentration calculations, Greenzyme monomers tend to favour aggregation more than that of rhamnolipid.

1. Introduction

Surfactants are surface active agents with at least one hydrophobic and one hydrophilic group in the same molecule and have the tendency to concentrate on the interface of immiscible phases [1,2,3,4]. Surfactants are produced from different sources which can be generally categorised as chemically- or biologically-based [5]. Irrespective of the source of surfactants, two physical properties common to all surfactants are: ability to adsorb on surfaces/interfaces of system and aggregation of their individual molecules into larger aggregates in aqueous solution due to their amphiphilic nature [6]. Recently, there have been increased studies on biologically generated surfactants (biosurfactants) due to their biodegradability, renewable sources, environmentally-friendly nature and adaptability to high temperature and salinity [3]. They have also been identified as a good substitute for chemical surfactants in most applications in various fields such as environmental, biotechnological, food, medical processes as well as oil industries [3,7,8]. Also, past studies have reported enhanced oil recovery (EOR) potential of biosurfactants (e.g., [9,10,11,12,13,14,15,16,17]). However, most of these studies were not conducted with brine composition and salinity relevant to hydrocarbon reservoirs. Low salinity NaCl solutions were commonly used for investigations of biosurfactant behaviour, while in real reservoir situations, the formation water is composed of multi-component high salinity brine.
The study conducted by Ghojavand et al. [18] on salinity variation effects on lipopeptidic biosurfactant suggested reduction in its efficiency as the salt concentration increased to 20 w/v%. This is consistent with the work of Al-Sulaimani et al. [19] who also identified the maximum biosurfactants salinity tolerance as 15–20% NaCl. Wang et al. [20] also reported salinity tolerance of rhamnolipid as 2–8% NaCl beyond which its surface activity decreased with further increase in salinity. Also, Al-Bahry et al. [21] identified a salinity range of 4–8% NaCl as the limit for stability of biosurfactants produced by Bacillus subtilis B20, above which its surface activity decreased with further increase in salinity. Amani et al. [15] on the other hand reported the rhamnolipid stability limit as 25 g/L NaCl concentration, while Al-Wahaibi et al. [16] reported a 5% NaCl concentration stability limit for two lipopeptide biosurfactants. Özdemir et al. [22] and Manko et al. [23] also performed extensive studies on aqueous behaviour of mono-rhamnolipid and di-rhamnolipid but their studies were limited to deionised water with the former focusing on pH effect.
Furthermore, previous studies investigated the effect of pH of aqueous solution on biosurfactants performance by adjusting the pH values with addition of acid or base. This may not be a true representative of what is obtainable in brine solutions relevant to hydrocarbon reservoir because in natural systems, the pH of aqueous solution is controlled by equilibration process. Hence, in this study, aqueous behaviour of biosurfactants in brine solutions of different compositions and salinity was experimentally investigated for the purpose of EOR applications using rhamnolipid and Greenzyme. All the pH measurements used in this study were measured at equilibrium. Rhamnolipids are produced by different species of Pseudomonas and have rhamnose as sugar component of hydrophilic group and different numbers of the hydrocarbon chains in their hydrophobic end [22]. They have been extensively studied due to their wide applications in other processes such as soil remediation. Greenzyme is a water soluble protein-enzyme produced using DNA of selected oil-eating microbes [11,24]. Greenzyme has not been extensively studied, although there are some recent studies (e.g., [13,25]) on its EOR applications but limited studies have been reported on its physicochemical properties.
The performance of biosurfactants in EOR applications is premised on their solution behavior that is determined by their surface thermodynamic properties [26]. To the best of our knowledge, no study has been reported on Greenzyme and rhamnolipid aqueous behaviour in solutions relevant to reservoir conditions. Hence, the aim of this study is to investigate the surface activity and aqueous behaviour of rhamnolipid and Greenzyme in solutions of varied salt compositions and concentrations at temperatures relevant to hydrocarbon reservoirs. In this paper we have reported micellisation of rhamnolipid and Greenzyme, their surface excess concentration at water-air interface and standard free energy as well as their behaviour in solutions of varied salt compositions and concentrations.

2. Materials and Methods

2.1. Materials and Sample Preparation

All the brine solutions were prepared with reagent grade of sodium chloride (NaCl), calcium chloride dihydrate (CaCl 2 ·2H 2 O), magnesium chloride hexahydrate (MgCl 2 ·6H 2 O) and sodium sulphate (Na 2 SO 4 ) salts from Sigma Aldrich, UK in deionized water from Thermo Scientific Barnstead Smart2pure system with 18.2 M Ω cm conductivity and purity >95%. Table 1 presents the compositional breakdown and concentration of stocks of the main brine solutions used in this study. The first and second solutions are synthetic formation brine (FMB) and sea water (SW) with ionic strengths of 3 M and 0.75 M respectively. The FMB is a typical composition and salinity of deep water aquifer and hydrocarbon reservoirs while SW is often used as injection fluid in hydrocarbon reservoirs. The other brine solutions used are single salt solutions (NaCl, CaCl 2 and MgCl 2 ), combination of two salts (Na + +Ca 2 + and Na + +Mg 2 + ), combination of three salts (Na + +Ca 2 + +Mg 2 + ). These brine solutions were used to study the effect of varied brine composition on biosurfactant surface and aqueous activities. Furthermore, different dilution of these brine solutions were used to study the effect of varied brine concentration on the biosurfactants surface activities using diluted solutions of the stock brine. The two biologically produced surfactants used in this study were 90% rhamnolipid from Sigma Aldrich, UK and 100% Greenzyme supplied by Biotech Processing Supply, Dallas Texas. The liquid chromatography mass spectrometry (LCMS) analysis of rhamnolipid suggests presence of mixture of mono-rhamnolipid and di-rhamnolipid of the form R-C 10 C 10 and RR-C 10 C 10 with a molecular mass of 505 and 651 g/mol, respectively. Based on this analysis, it was assumed that the rhamnolipid sample has 90% mono-rhamnolipid and 10% di-rhamnolipid hence, the average molecular mass of this rhamnolipid calculated on this basis and used was 516 g/mol. The chemical formula and structure of Greenzyme are not disclosed due to patent right and company policy but its molecular weight is stated to be between 80,000 and 90,000 g/mol, so in this study, an average molecular weight of 85,000 g/mol was adopted and used. The LCMS analysis of the sample was not successful due to its high molecular weight.

2.2. Critical Micelle Concentration Determination

Surfactant adsorption at water-air interface takes place at various concentrations depending of the molecular structure. To characterise these biosurfactants efficiency, the critical micelle concentration (CMC) at which spontaneous formation of aggregate of rhamnolipid and Greenzyme molecules occur was investigated using surface tension and electrical conductivity methods. A range of concentration (0.001 to 25 mM) of rhamnolipid and Greenzyme in deionised water were investigated at 23 ± 2 C with Kruss tensiometer (Du Nouy ring method) and Mettler Toledo conductivity meter. All measurements were taken at least three times and the presented results are the average of these measurements. Plots of measured surface tension and conductivity against their respective concentration were generated. The point at which steady change in slope was observed in the graphs as their respective concentration increases in the solution was used to define the concentration at which their micellisation was initiated. Using the obtained experimental results, the thermodynamic Gibbs free energy of micellisation was calculated with Equation (1) [23,27].
Δ G m i c o = ( 2 β ) R T ln X c m c ,
where Δ G m i c o is Gibbs free energy of micellisation (kJ·mol 1 ), β is counterion dissociation (constant), T is temperature (K), R is gas constant (8.314 JK 1 ·mol 1 ), X c m c is critical micelle concentration in mole fraction. Furthermore, since the concentration of surfactant at the surface is always higher than the bulk solution, the maximum surface excess concentration ( Γ ) can be calculated using Gibbs adsorption equation (Equation (2)) [27,28], where n is number of particle supplied by each molecule of the surfactant in solution ( n = 2 , for surfactant acting as divalent) and d σ d l o g C is obtained from the plot of surface tension ( σ ) against log of concentration ( l o g C ).
Γ = 1 2.303 n R T d σ d l o g C = 1 4.606 R T d σ d l o g C .

2.3. Biosurfactants Solubility Tests

The objective of this experiment is to investigate the effects of temperature, brine composition and concentration on solubility of rhamnolipid and Greenzyme in aqueous solutions in order to determine their solubility in salinity condition relevant to reservoir brine. For brine composition effects investigations, fixed ionic strength solutions of eight different salts solutions presented in Table 1 were used, while for concentration effects investigations, different dilutions of the stock solutions were used. The methodology adopted for the tests is the aqueous stability method described by Sheng [29], which involves addition of fixed volumes (1 wt.%) of rhamnolipid and Greenzyme to a fixed volume of varied brine solutions (5 mL). Then visual observation of changes in the solutions over a period of time (maximum 24 h) was used to qualitatively classify them as either: clear, slightly hazy, hazy and precipitate. The clear and slightly hazy samples were considered as soluble while hazy and precipitate were considered as insolubility of the biosurfactant. The experimental temperatures investigated were 23, 50 and 70 C.

2.4. Biosurfactants Stability Tests

To apply biosurfactant in EOR process, its stability (capacity to maintain its surface activity) in salinity and temperature of interest needs to be studied to ensure its efficient operation under such conditions. Hence, stability of rhamnolipid and Greenzyme under varied salinity and temperatures were therefore investigated by monitoring their surface activity based on surface tension (Du Nouy ring method). The surface tension measurement of their aqueous solutions in distilled water was used as a reference for comparison of their surface activity in different brine solutions. The effect of brine composition and concentration on biosurfactant stability was investigated using single and combined salt solutions with compositions as detailed in Table 1. The composition effects were investigated using stock solutions of all the salts while the concentration effects were investigated with different dilutions of all the stock solutions. For temperature stability investigation, the solutions were subjected to different temperatures (23, 50 and 70 C) using a temperature regulated water bath. The surface tension measurements of the solutions were taken before and after subjection to varied temperatures, with measurements taken at 23 C being used as reference.

3. Results and Discussion

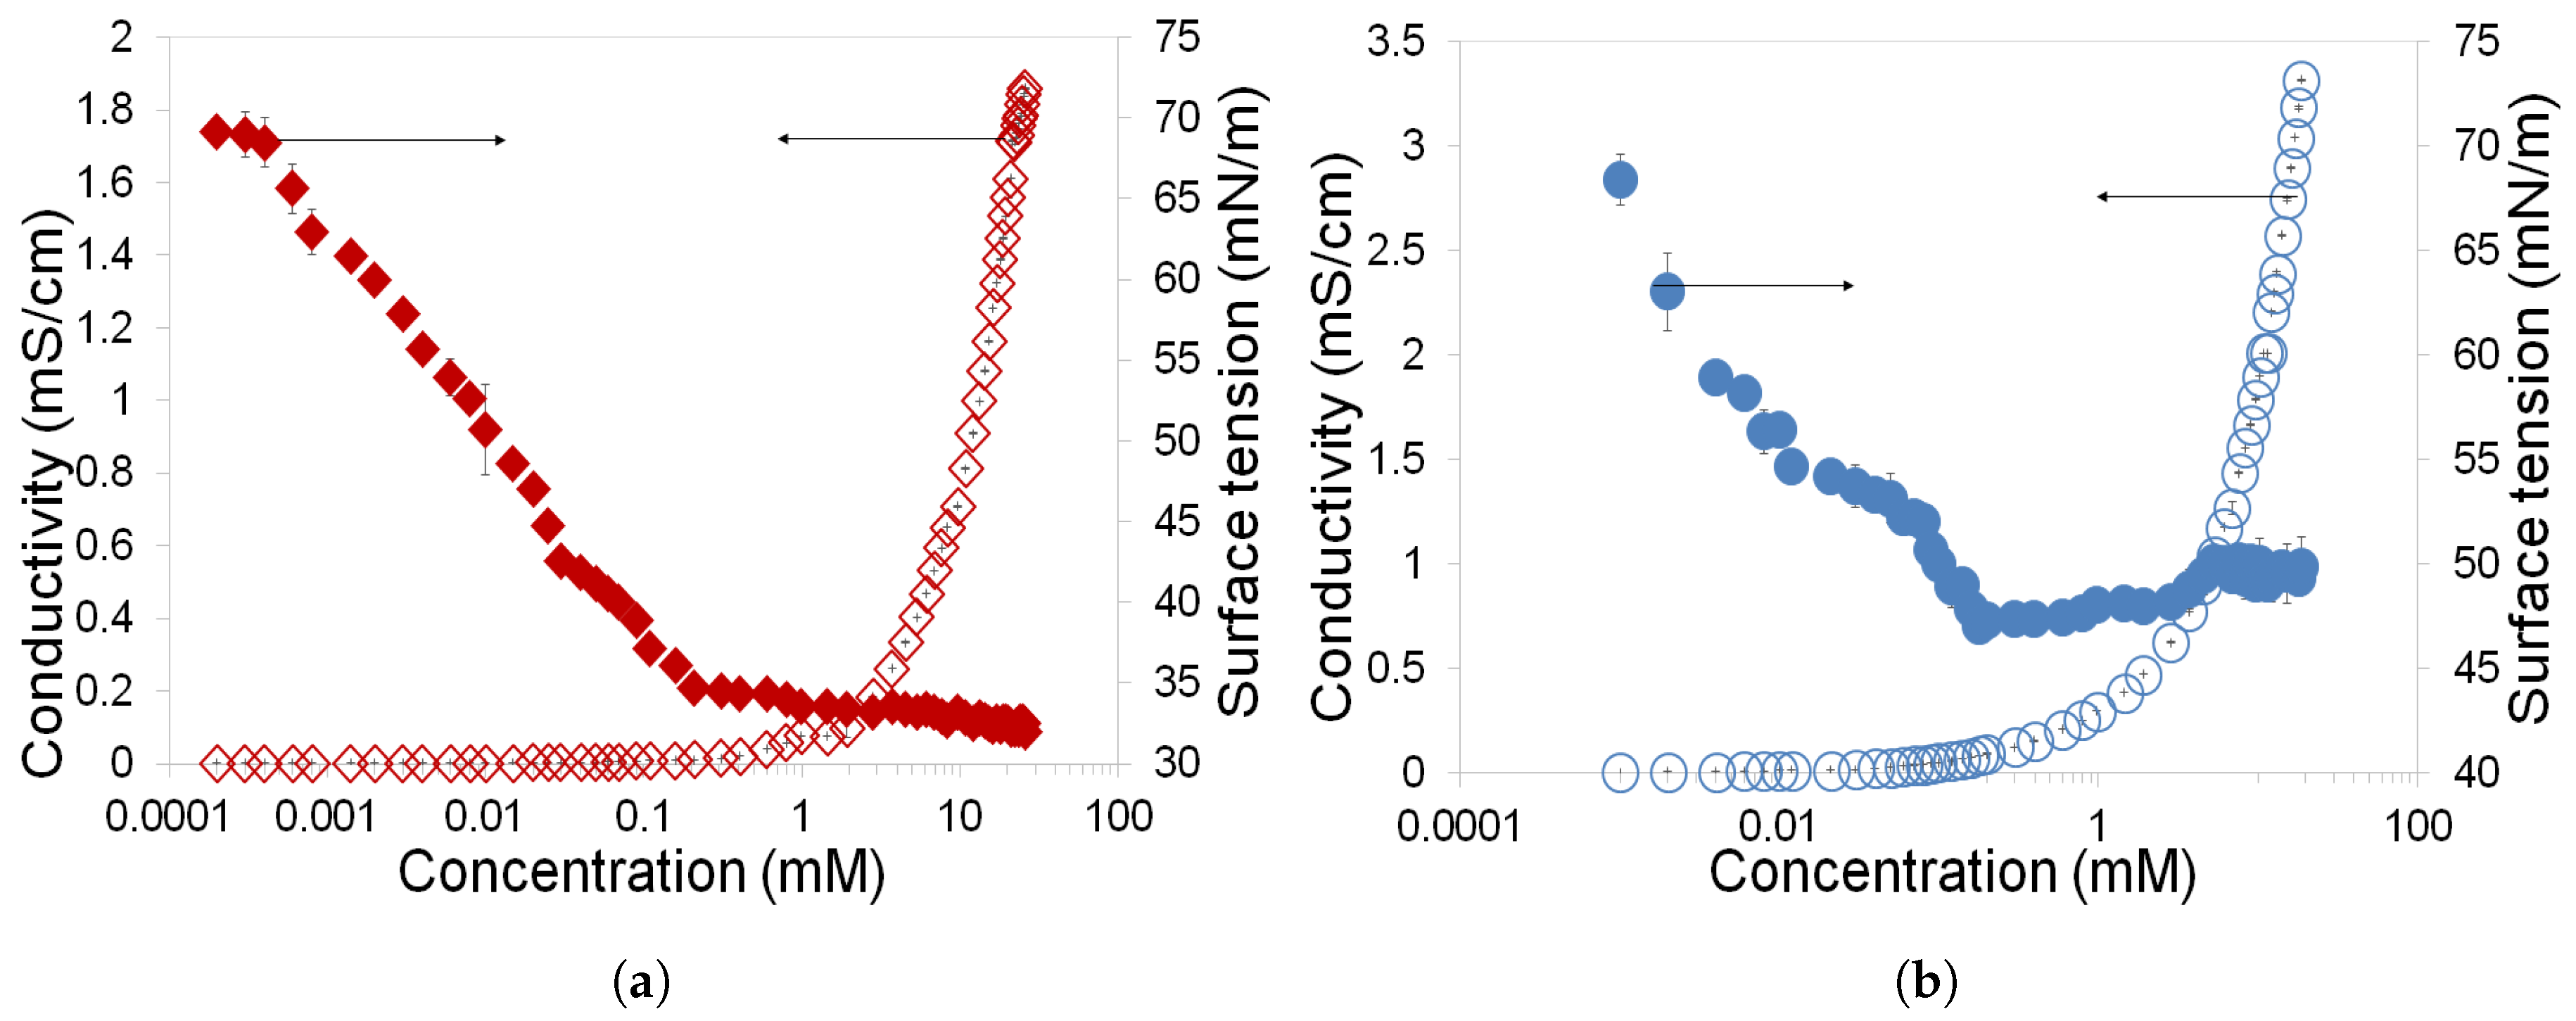
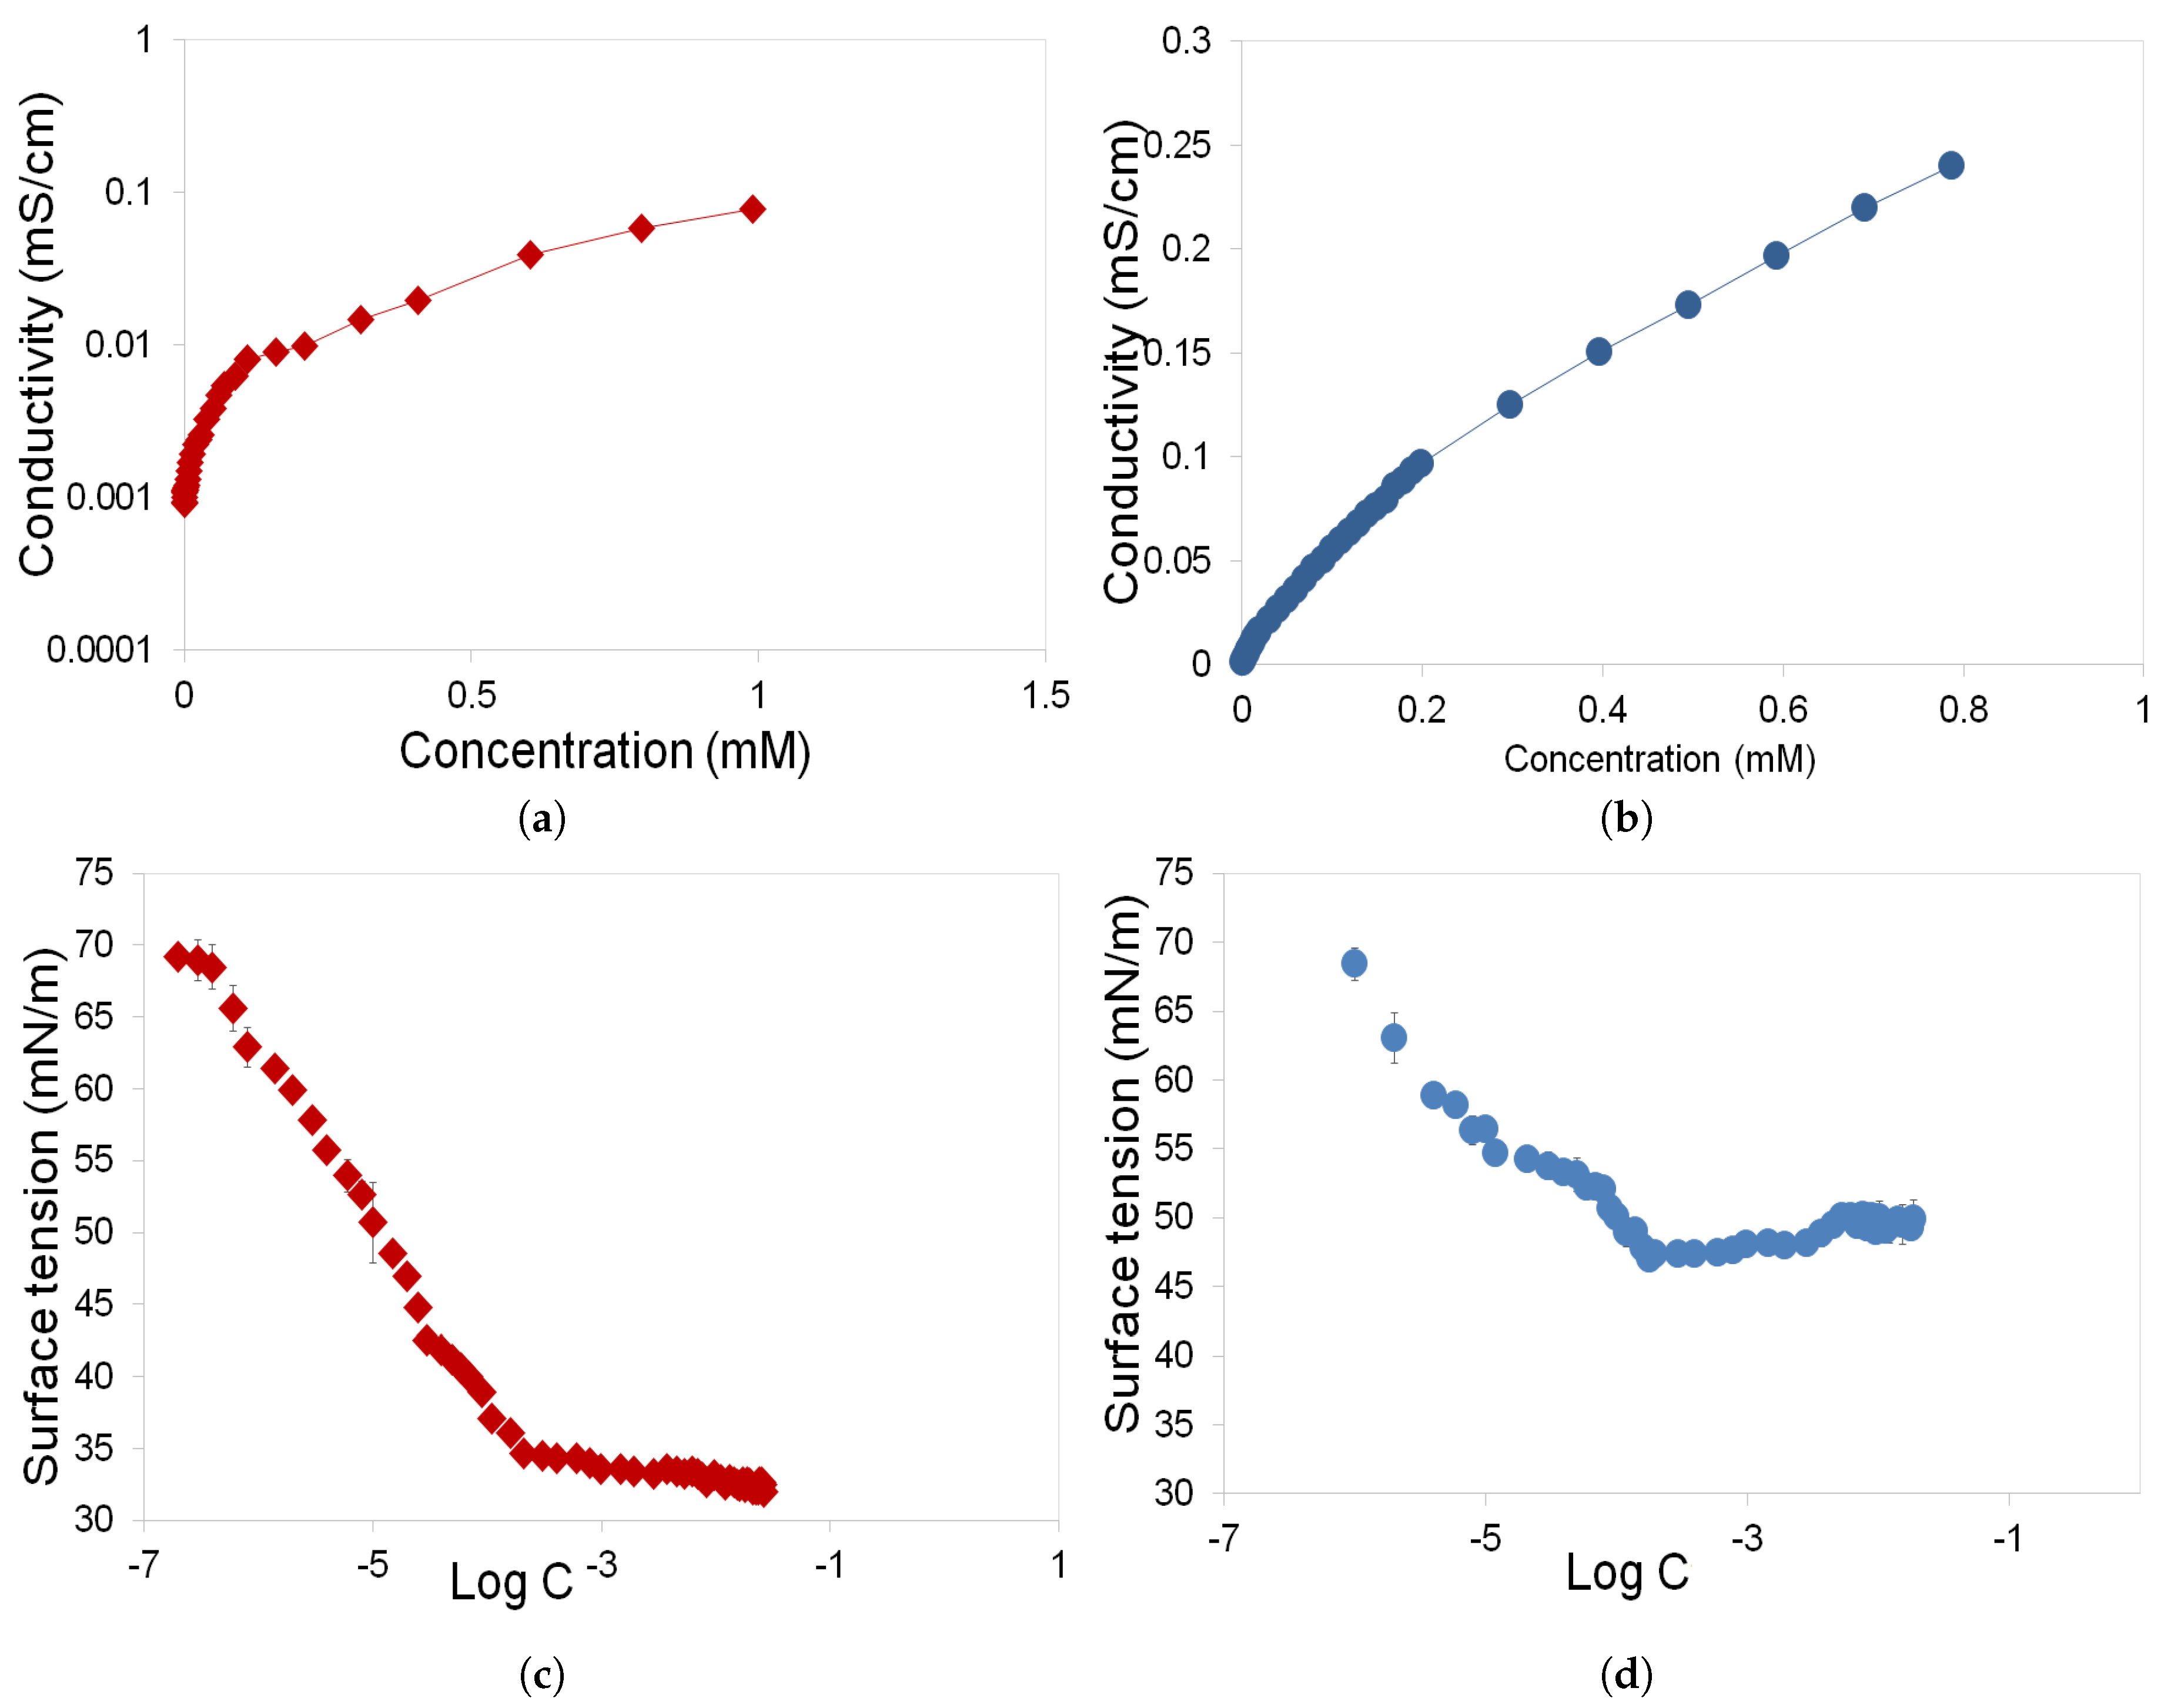
3.1. Determination of CMC and Gibbs Free Energy of Rhamnolipids and Greenzyme

The concentrations at which aggregation of rhamnolipid and Greenzyme molecules were initiated were determined based on change in their respective surface tension and conductivity plots as shown in Figure 1. From the surface tension measurements, an initial linear and rapid decrease in surface tension was observed with increase in their respective concentrations in the solution. After a given period of time, no significant change was observed in their respective surface tension measurements with further increase in concentrations and the point at which this steady measurements was initiated was used to define their CMCs. For the specific conductivity measurements, initial low and steady increase in conductivity was observed with increase in concentrations of rhamnolipid and Greenzyme. As their respective concentration increases, sudden increase in conductivity was observed; indicating increased ionic activity in the bulk phase due to conformational or molecular changes in the solution [30]. The concentration at which this sudden increase was observed was also taken to be their CMCs. The CMCs of rhamnolipid and Greenzyme from surface tension measurements were found to be 0.209 mM and 0.174 mM, and from conductivity measurements 0.307 mM and 0.160 mM respectively. At these concentrations, rhamnolipid and Greenzyme reduced the surface tension of water from 72.8 ± 0.2 mN/m to 34.7 ± 0.4 mN/m and 47.1 ± 0.1 mN/m, respectively.
Rhamnolipid generated greater surface activity than Greenzyme, which is related to their chemical composition and the strength of their hydrophilic and hydrophobic groups as noted by Sheng [29]. According to him, surfactant structure can be correlated with their surface activity and CMC based on their hydrophilic-lipophilic balance (HLB). Increase in hydrophilic groups results in decrease in surface activity of surfactants, while increase in hydrophobic group increases their surface activity but reduces its solubility [31]. This is consistent with the results of this study as shown in the next section, where higher solubility of Greenzyme was observed. Ozdemir et al. [22] also noted that pure mono-rhamnolipid (R1) have less hydrophilic nature than di-rhamnolipid (R2) due to the absence of the second rhamnosyl group which indicates its lower hydrophilicity. They also observed that R1 molecules have more surface activity than R2.
Furthermore, the obtained CMC of rhamnolipid is consistent with previous studies as reported in the literature. Özdemir et al. [22] obtained the CMC of 0.1 mM and 0.15 mM for mono-rhamnolipid and di-rhamnolipid respectively at pH 6.8, while Abalos et al. [32] obtained a CMC value of 0.163 mM for di-rhamnolipid. Also from the reported CMC of mixed rhamnolipid investigated by Chen et al. [33], CMC of 0.26 ± 0.02 mM and 0.34 ± 0.02 mM were obtained. Furthermore, the CMC of rhamnolipid obtained is equivalent to 107.84 mg/L, which is within the range of rhamnolipid CMC (1–200 mg/L) obtained by other authors e.g., [10,15,17,23,32,34,35]. However, a wide range of rhamnolipid CMC have been reported in literature and this could probably be attributed to the fact that rhamnolipids comprise of mixture of varied homologues with mono-rhamnolipid and/or di-rhamnolipid being the dominant form in different proportions [32,36]. Also, these differences in rhamnolipid CMC suggest the possibility of range of concentration at which aggregation of rhamnolipid molecules occur as oppose to the point of aggregation. Having used four methods to investigate CMC of rhamnolipid, Manko et al. [23] also noted the possibility of range of concentration at which aggregation of rhamnolipid molecules occur and the sensitivity of different CMC determination methods to varied sizes of aggregates. It is however very difficult to compare the CMC of Greenzyme to those in literature because it is difficult to find such data. Figure 2 shows the specific conductivity measurements and surface tension isotherm used to determine the Gibbs free energy of micellisation and surface excess concentration of rhamnolipid and Greenzyme. From the Gibbs standard free energy of micellisation ( Δ G m i c o ) calculation using Equation (1), the degree of interactions between water molecules and micelles of rhamnolipid and Greenzyme were determined from conductivity as a function of concentration (Figure 2a,b). The Δ G m i c o for rhamnolipid and Greenzyme were found to be −16.50 kJ·mol 1 and −31.01 kJ·mol 1 , respectively. This shows that rhamnolipid and Greenzyme have the tendency to spontaneously form micelles. Also, from the plot of surface tension against log of concentration (Figure 2c,d), the maximum Gibbs surface excess concentrations of rhamnolipid and Greenzyme were determined using Equation (2) as 1.12 × 10 6 mol·m 2 and 6.83 × 10 7 mol·m 2 , respectively.
These reflect the behaviour of rhamnolipid and Greenzyme at the interface and in the bulk solution. The surface excess concentration indicate the amount of surfactant molecules at the interface and Δ G m i c o describes the aggregation tendency of the molecules in solution [23,37]. Higher Δ G m i c o was obtained for Greenzyme than rhamnolipid, which indicates that monomers of Greenzyme favour aggregation more than rhamnolipid. However, a higher surface excess concentration was obtained for rhamnolipid which shows they have higher surface activity than Greenzyme. The observed behaviour is in agreement with another study that suggested a less hydrophilic nature of rhamnolipid [22]. Also, the observed behaviour is consistent with their molecular size. Rhamnolipid molecules are smaller than Greenzyme which favour compaction at the surface as evident by maximum surface excess concentration. Conversely, due to larger size of Greenzyme molecules that requires minimum number of molecules to form an aggregate, it favours aggregation. This surface excess concentration that shows the effectiveness of surfactant adsorption at the interface is also an important factor for determining their surface properties such as wettability alteration, contact angle, foaming etc. [27].

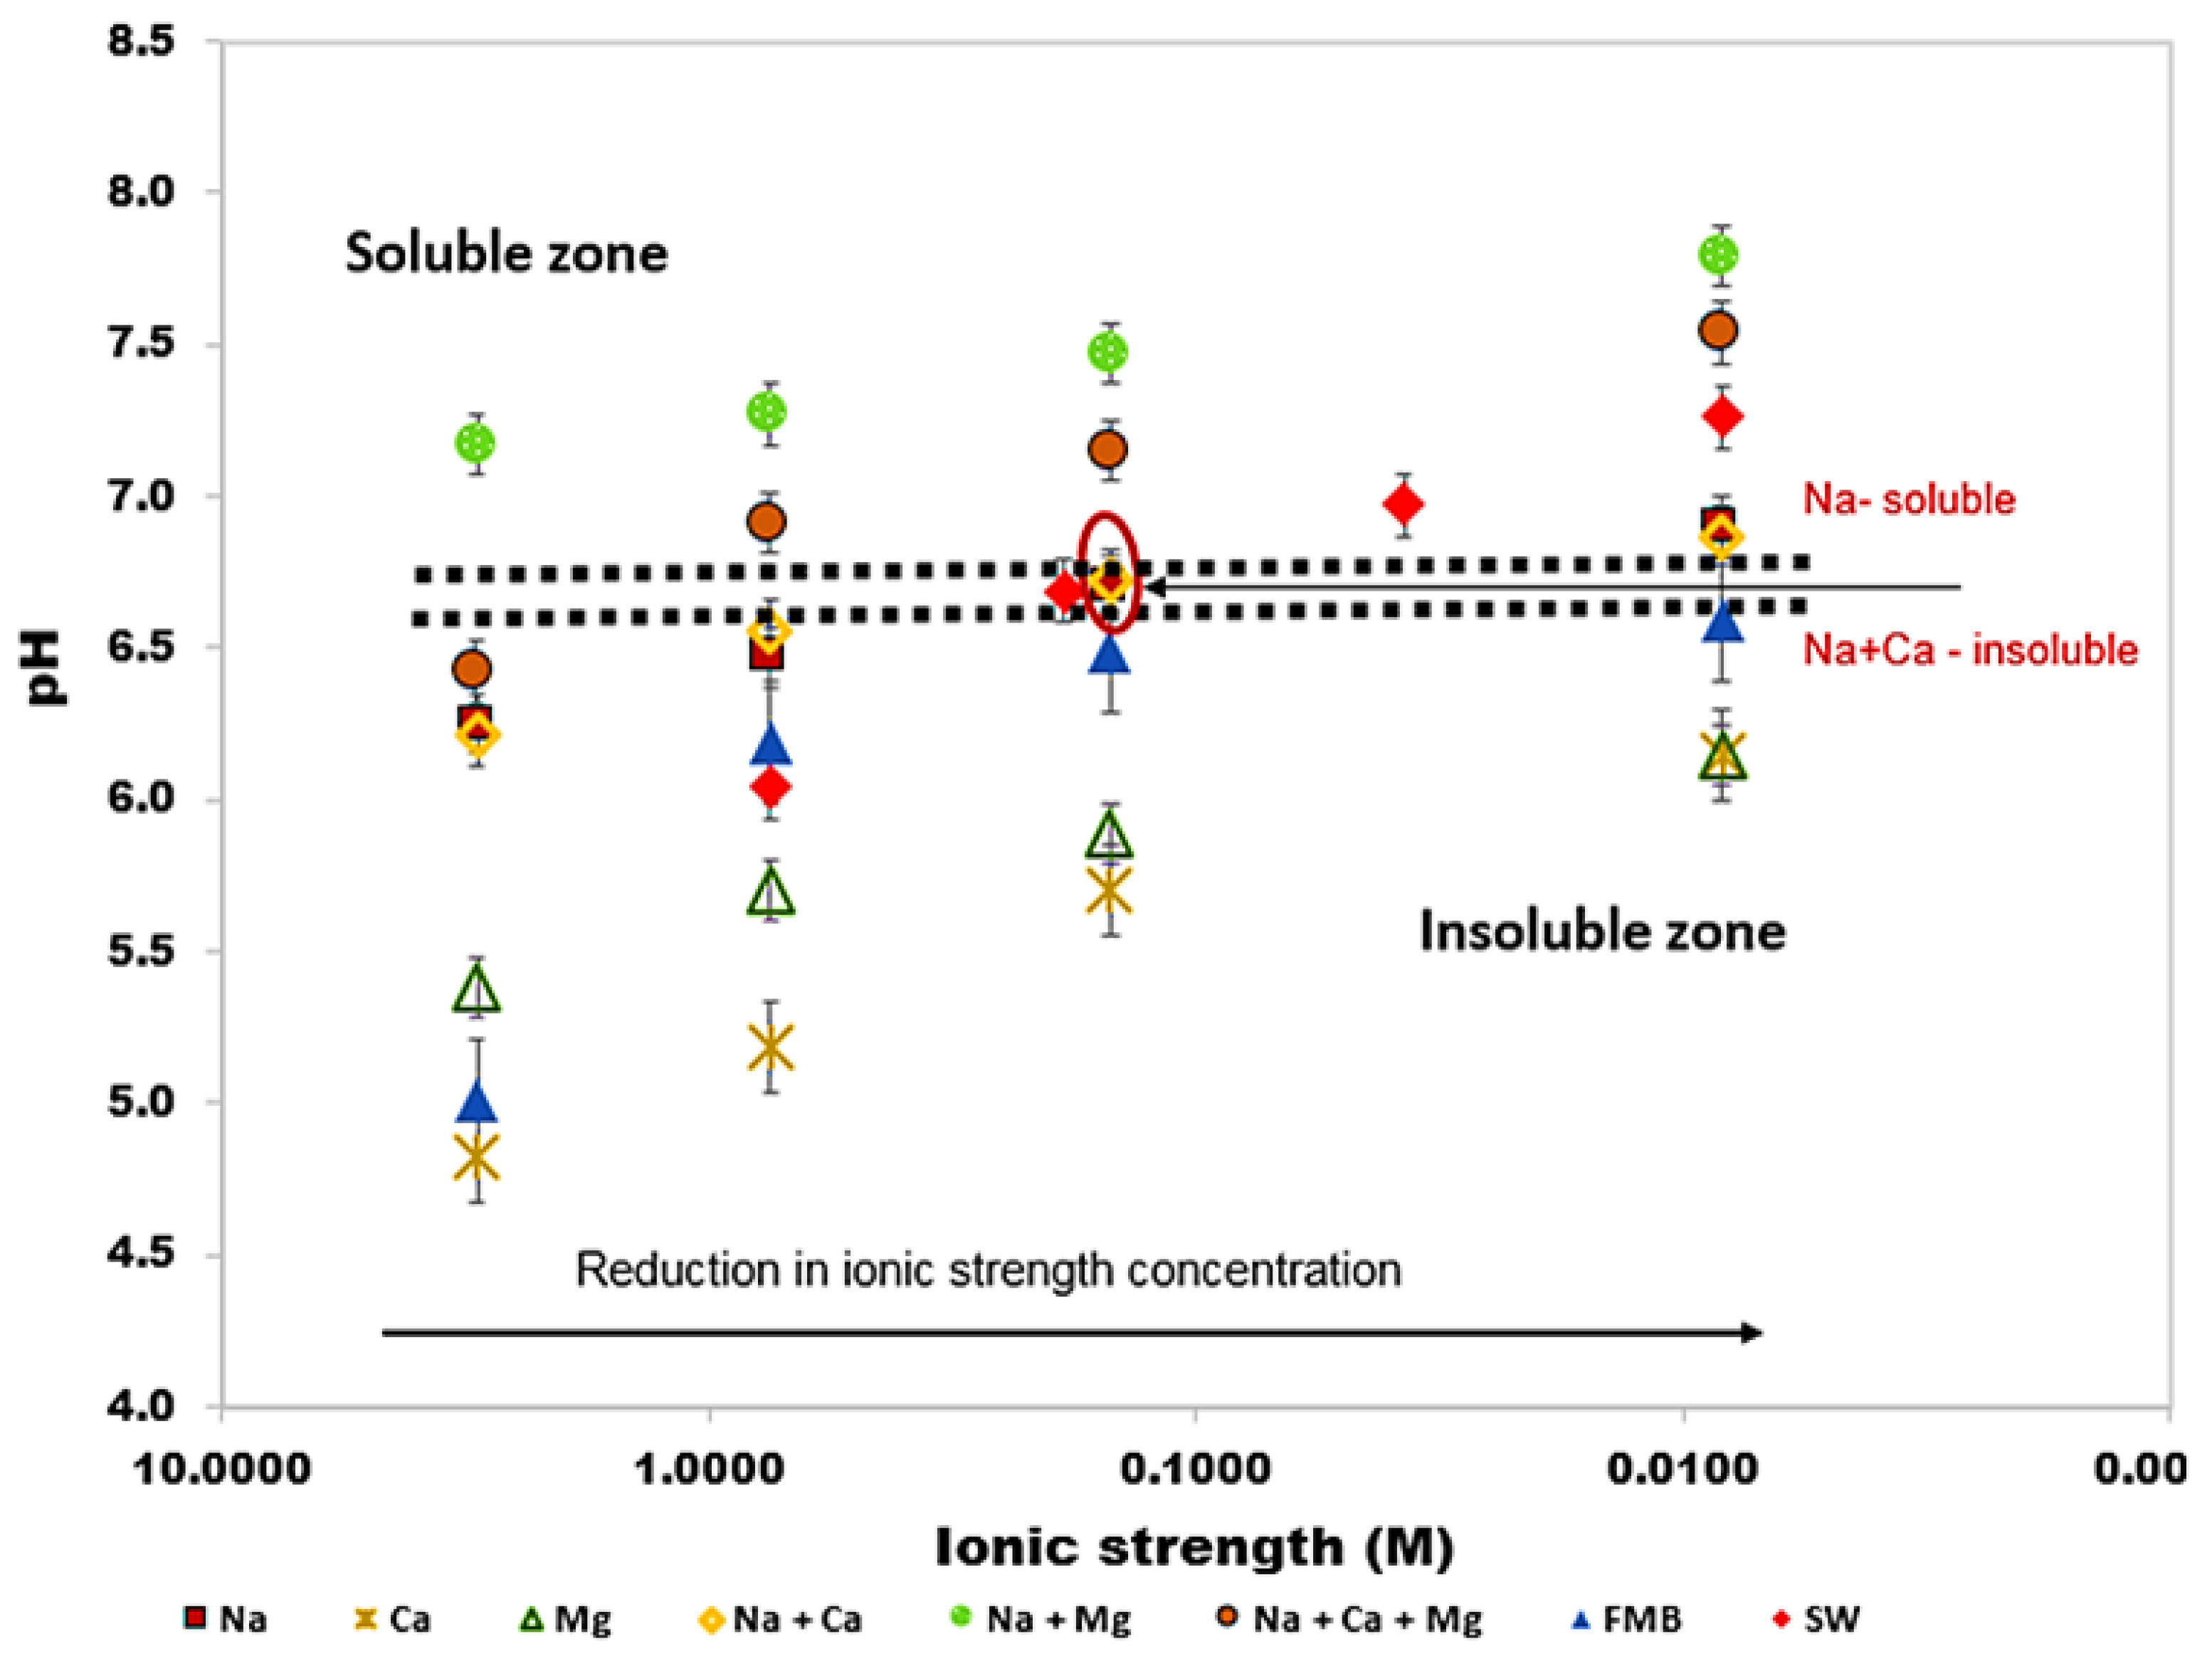
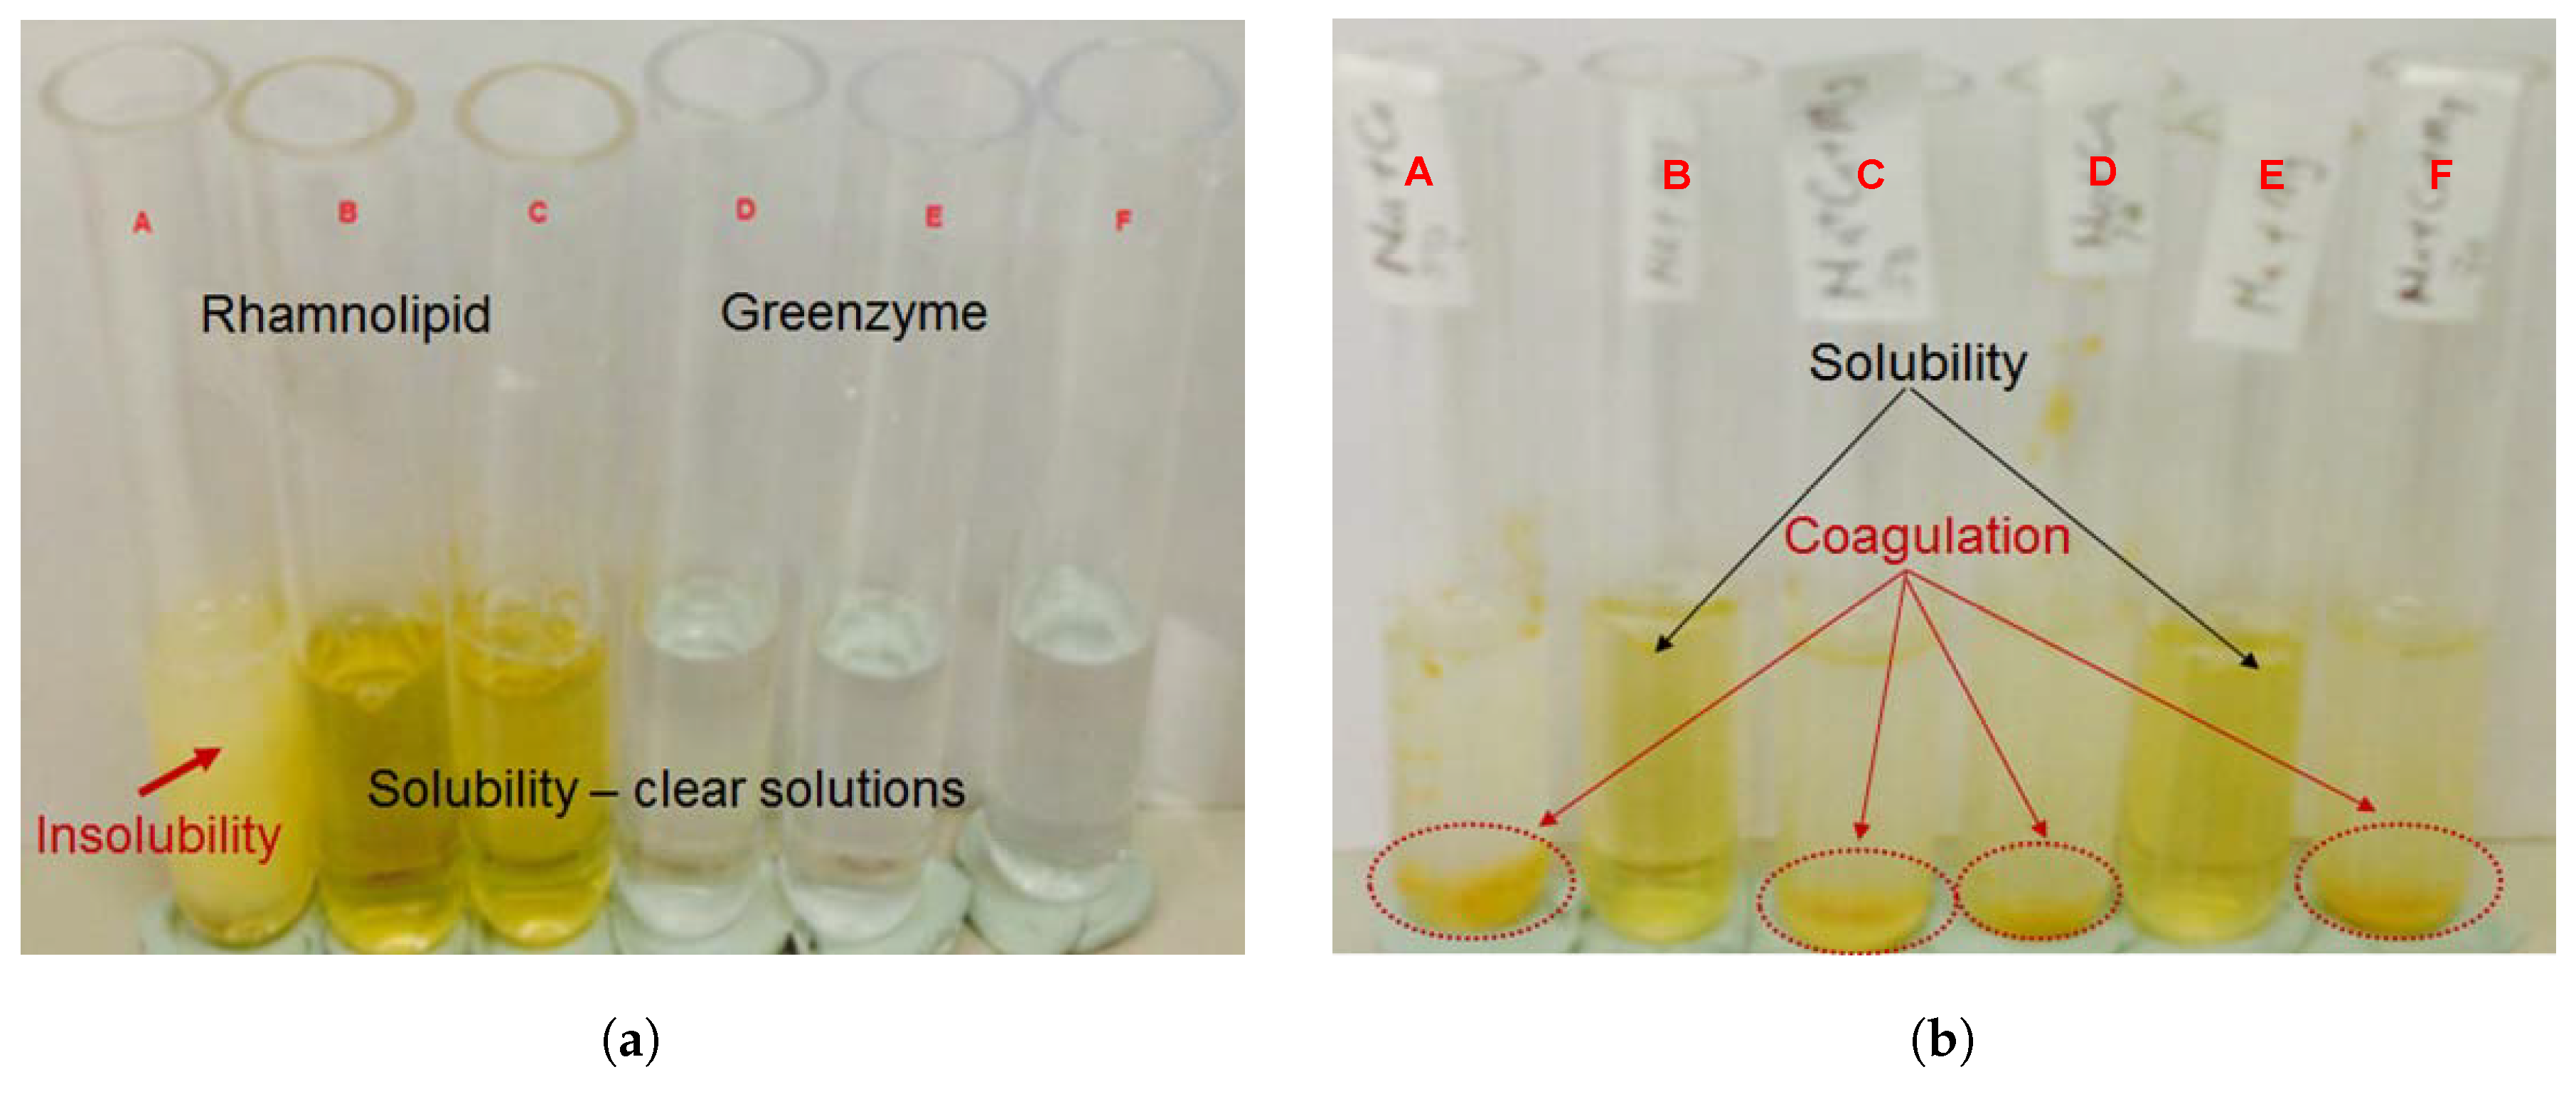
3.2. Effect of Brine Composition and Concentration on Biosurfactants Solubility

Figure 3 shows examples of visual observation of rhamnolipid and Greenzyme solution behaviour. For all the tests carried out, Greenzyme was soluble in all the brine solutions at every temperature investigated in this study. The solubility of Greenzyme in different electrolyte solutions depicted its tolerance to high salinity medium. Rhamnolipid on the other hand, behaved differently in different solutions based on the salt composition and concentration in aqueous solutions as illustrated in Figure 4.
Generally, a linear decrease in rhamnolipid solubility with decrease in pH and increase in ionic strength was observed with all the brine solutions, which is an indication of insolubility in acidic condition. However, a strong correlation was observed between rhamnolipid solubility and ionic strength of Ca 2 + , Mg 2 + , Na + +Mg 2 + and FMB solutions. Rhamnolipid was soluble in all solutions of Na + +Mg 2 + but it was insoluble in all Ca 2 + , Mg 2 + and FMB solutions, while for all other brine solutions, rhamnolipid solubility was influenced by combined effect of pH, brine composition and concentration. The pH threshold for rhamnolipid solubility was found to be around pH 6.8, above which rhamnolipid was soluble in brine solutions irrespective of the composition but stronger effect of brine composition is seen in brine solutions that are located within the two lines. These brine solutions have different composition but similar concentration and pH, while rhamnolipid was soluble in Na + and SW solutions, it was insoluble in Na + +Ca 2 + , indicating rhamnolipid sensitivity to this brine composition. Finally, increase in temperature and combination of rhamnolipid with Greenzyme did not improve rhamnolipid solubility in brine solutions in which they were insoluble, but rather increase in temperature led to coagulation of the precipitates as illustrated in Figure 3b.
The results of Greenzyme and rhamnolipid solubility in brine of varied composition and concentration are related to salting-in and salting-out effects [2,38,39]. The observed solubility of Greenzyme in all the investigated solutions indicate its tolerance to high salinity conditions which may be related to its high hydrophilicity. Increased hydrophilic groups of surfactants is said to increase their solubility in water but it however decreases their surface activity [1,31]. Piazza [40] also attributed the thermodynamic stability of proteins in aqueous solutions to their high hydrophilic nature. Also, the solubility of Greenzyme at experimental temperatures shows that the maximum experimental temperature used in this study is below its denaturation temperature since protein precipitation is one of the indications of its denaturation [38,41].
However, the mono-rhamnolipid that is dominant in this rhamnolipid is known to be less hydrophilic due to the absence of the second rhamnosyl group [22]. Hence, the observed rhamnolipid insolubility at high ionic strength can be related to salting-out effect due to hydrophobic interaction between its molecules. The general decrease in rhamnolipid solubility with a decrease in pH is however due to protonation of carboxyl groups of rhamnolipid to form weakly polar carboxylic acid as demonstrated by Özdemir et al. [22]. The observed pH effect is also consistent with previous studies by Al-Wahaibi et al. [16] and Al-Sulaimani et al. [19], who also observed biosurfactant precipitation in aqueous NaCl solution at pH of 5 and below.
Furthermore, previous studies have attributed rhamnolipid aqueous behaviour mainly to pH influence e.g., [42,43], the results of this study have however shown the importance of brine composition. Previously, pH effects is usually investigated based on acid and base regulated solutions but from this study, it is evident that the effects of brine composition supersedes that of pH since brine composition determines the system pH as observed with Na + , Na + +Ca 2 + and SW solutions in Figure 4. The three solutions had similar concentration and pH but rhamnolipid was insoluble in Na + +Ca 2 + and soluble in others. The observed variance in solubility of rhamnolipid in different brine solutions shows their sensitivity to brine composition and the significance of investigating biosurfactant solubility in salinity conditions relevant to their application.

3.3. Aqueous Stability of Rhamnolipid and Greenzyme

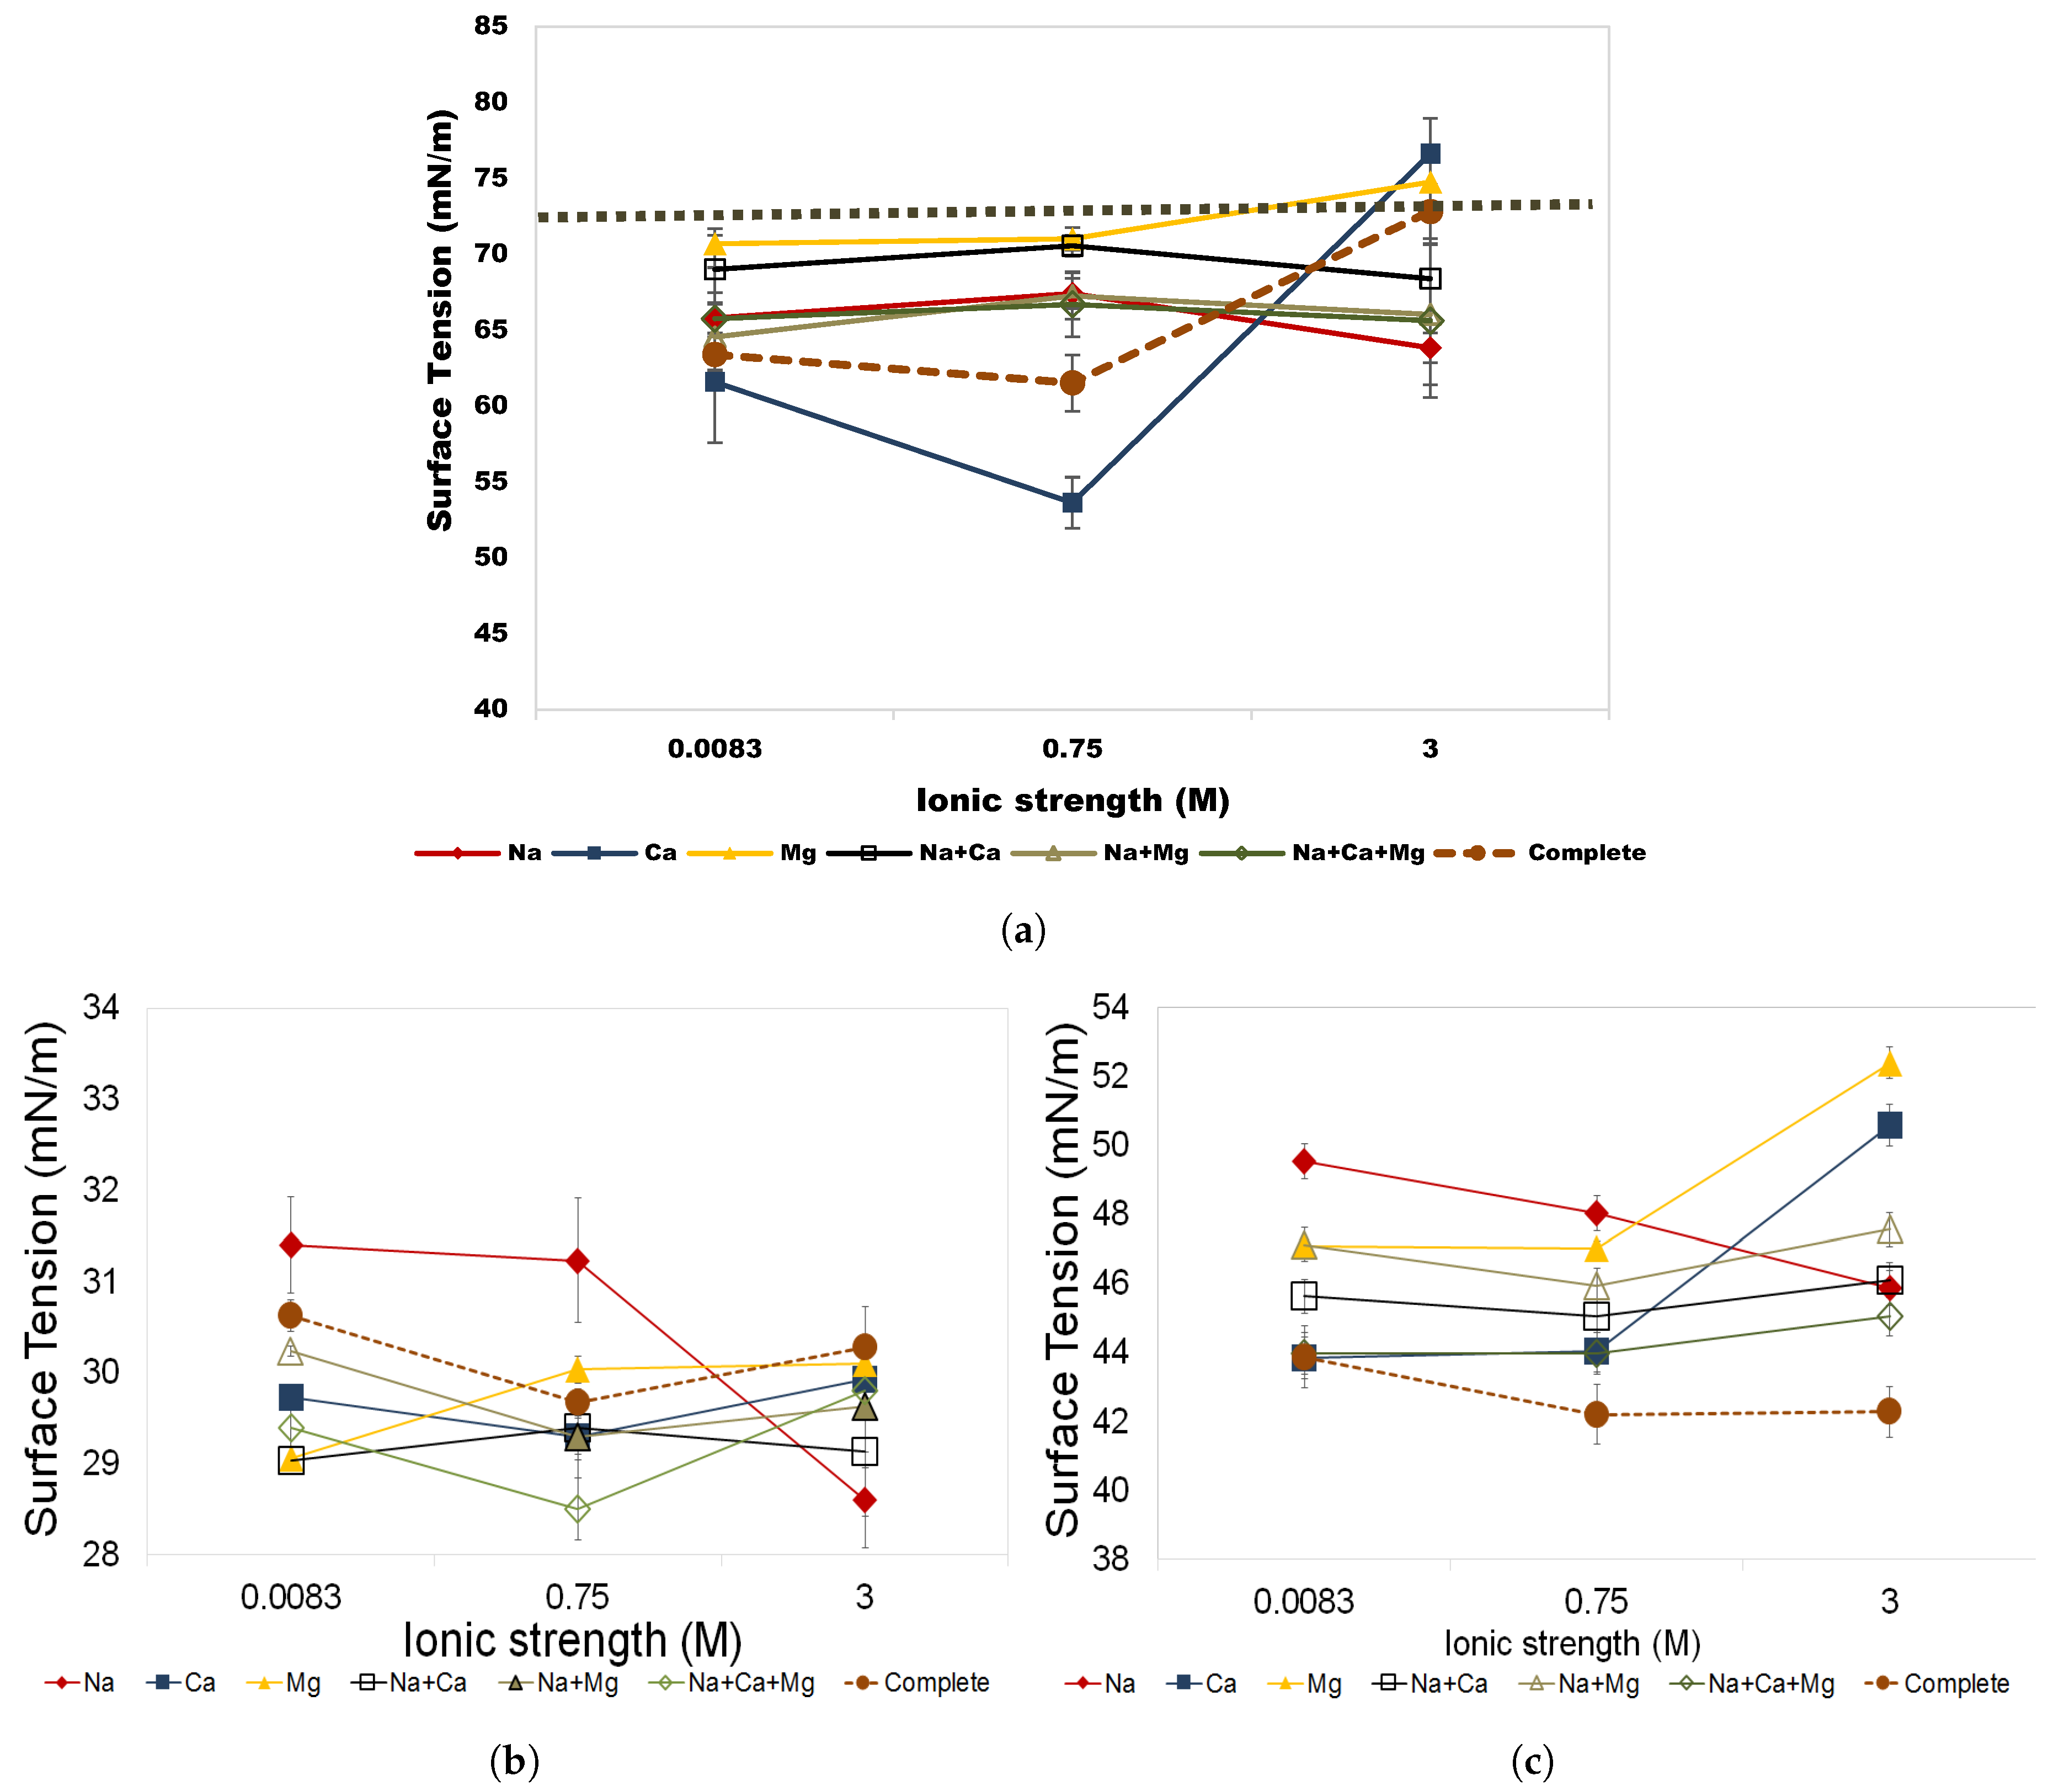
3.3.1. Salinity Effects

Figure 5 shows results of investigations of effect of brine composition and concentration on stability of surface activity (as indicated by surface tension reduction) of rhamnolipid and Greenzyme. The surface activity of each brine solution without addition of biosurfactant is presented in Figure 5a. Brine solutions of Ca 2 + and Mg 2 + show a distinct behaviour in comparison with other solutions. Ca 2 + brine has the highest surface activity at low and medium ionic strength (IS) and lowest surface activity at high IS. Mg 2 + brine however shows very low surface activity at all IS with lowest activity being observed at highest IS although it was slightly lower than Ca 2 + . They both however, show lower surface activity than distilled water at high IS.
Furthermore, a similar trend to Ca 2 + brine was observed with complete brine solutions of all the salt compositions. At low and medium ionic strength, high surface activity was observed but reduced surface activity was observed at high IS. However, for all other brine solutions, relative stability with increase in IS and similar surface activity was observed but Na + +Ca 2 + brine has lower surface activity than all others. This signifies surface activity alteration potential of each salt and combination of different salts. Figure 5b shows the responses of all salt solutions to rhamnolipid. Generally, addition of rhamnolipid increases the surface activity of all the brine solution by factors of 45–62%. However, each solution shows different response to rhamnolipid based on their composition and concentration. Na + brine has the lowest surface activity at low to medium IS and highest activity at high IS and complete brine solutions also show lower surface activity while other brine solutions show mixed responses based on IS.
The response of the different brine solutions to the presence of Greenzyme is shown in Figure 5c. Greenzyme addition also led to increased surface activity of all brine solutions with increased factor of 18–47% being observed. Each brine however shows different distinct responses based on their concentration. A linear increase in surface activity of Na + brine was observed with increase in IS but the highest surface activity was observed with complete brine. Low surface activity was however observed in Ca 2 + and Mg 2 + brine solutions at high IS.
These results show that addition of rhamnolipid and Greenzyme to all brine solutions generally improved their respective surface activity with rhamnolipid with more surface effect than Greenzyme. Lowest surface activity of both rhamnolipid and Greenzyme was however observed in Na solution at low (8.3 mM) to medium (0.75 M) ionic strength (IS) but increased linearly with increase in salinity with very high surface activity at high IS (3 M). Also, Na brine exhibited more instability than all other brine solutions investigated. This is of significant importance because most studies on biosurfactants are usually carried out with NaCl at low to medium salinity which may not be a good representative of the system. However, rhamnolipid was found to be stable in low and medium IS of Na brine as observed by other studies that reported biosurfactant stability based on NaCl of low to medium concentration [16,17,18,19,20,21]. Also, rhamnolipid and Greenzyme tend to be more stable in multi-component brine than single brine solution. This could be attributed to neutralisation and screening effect of multi-component ions in the solution [2]. Also, the results have shown that surface activity of rhamnolipid in complete brine solutions (Na + +Ca 2 + +Mg 2 + +SO 4 2 ) is comparable with other brine solutions but the highest surface activity of Greenzyme was observed in this brine, which further confirms Greenzyme high salinity tolerance. Finally, a close relation between response of complete brine and Na + +Ca 2 + +Mg 2 + brine solution with different end effect was observed for rhamnolipid and Greenzyme, suggesting possible effect of SO 4 2 on their interactions.

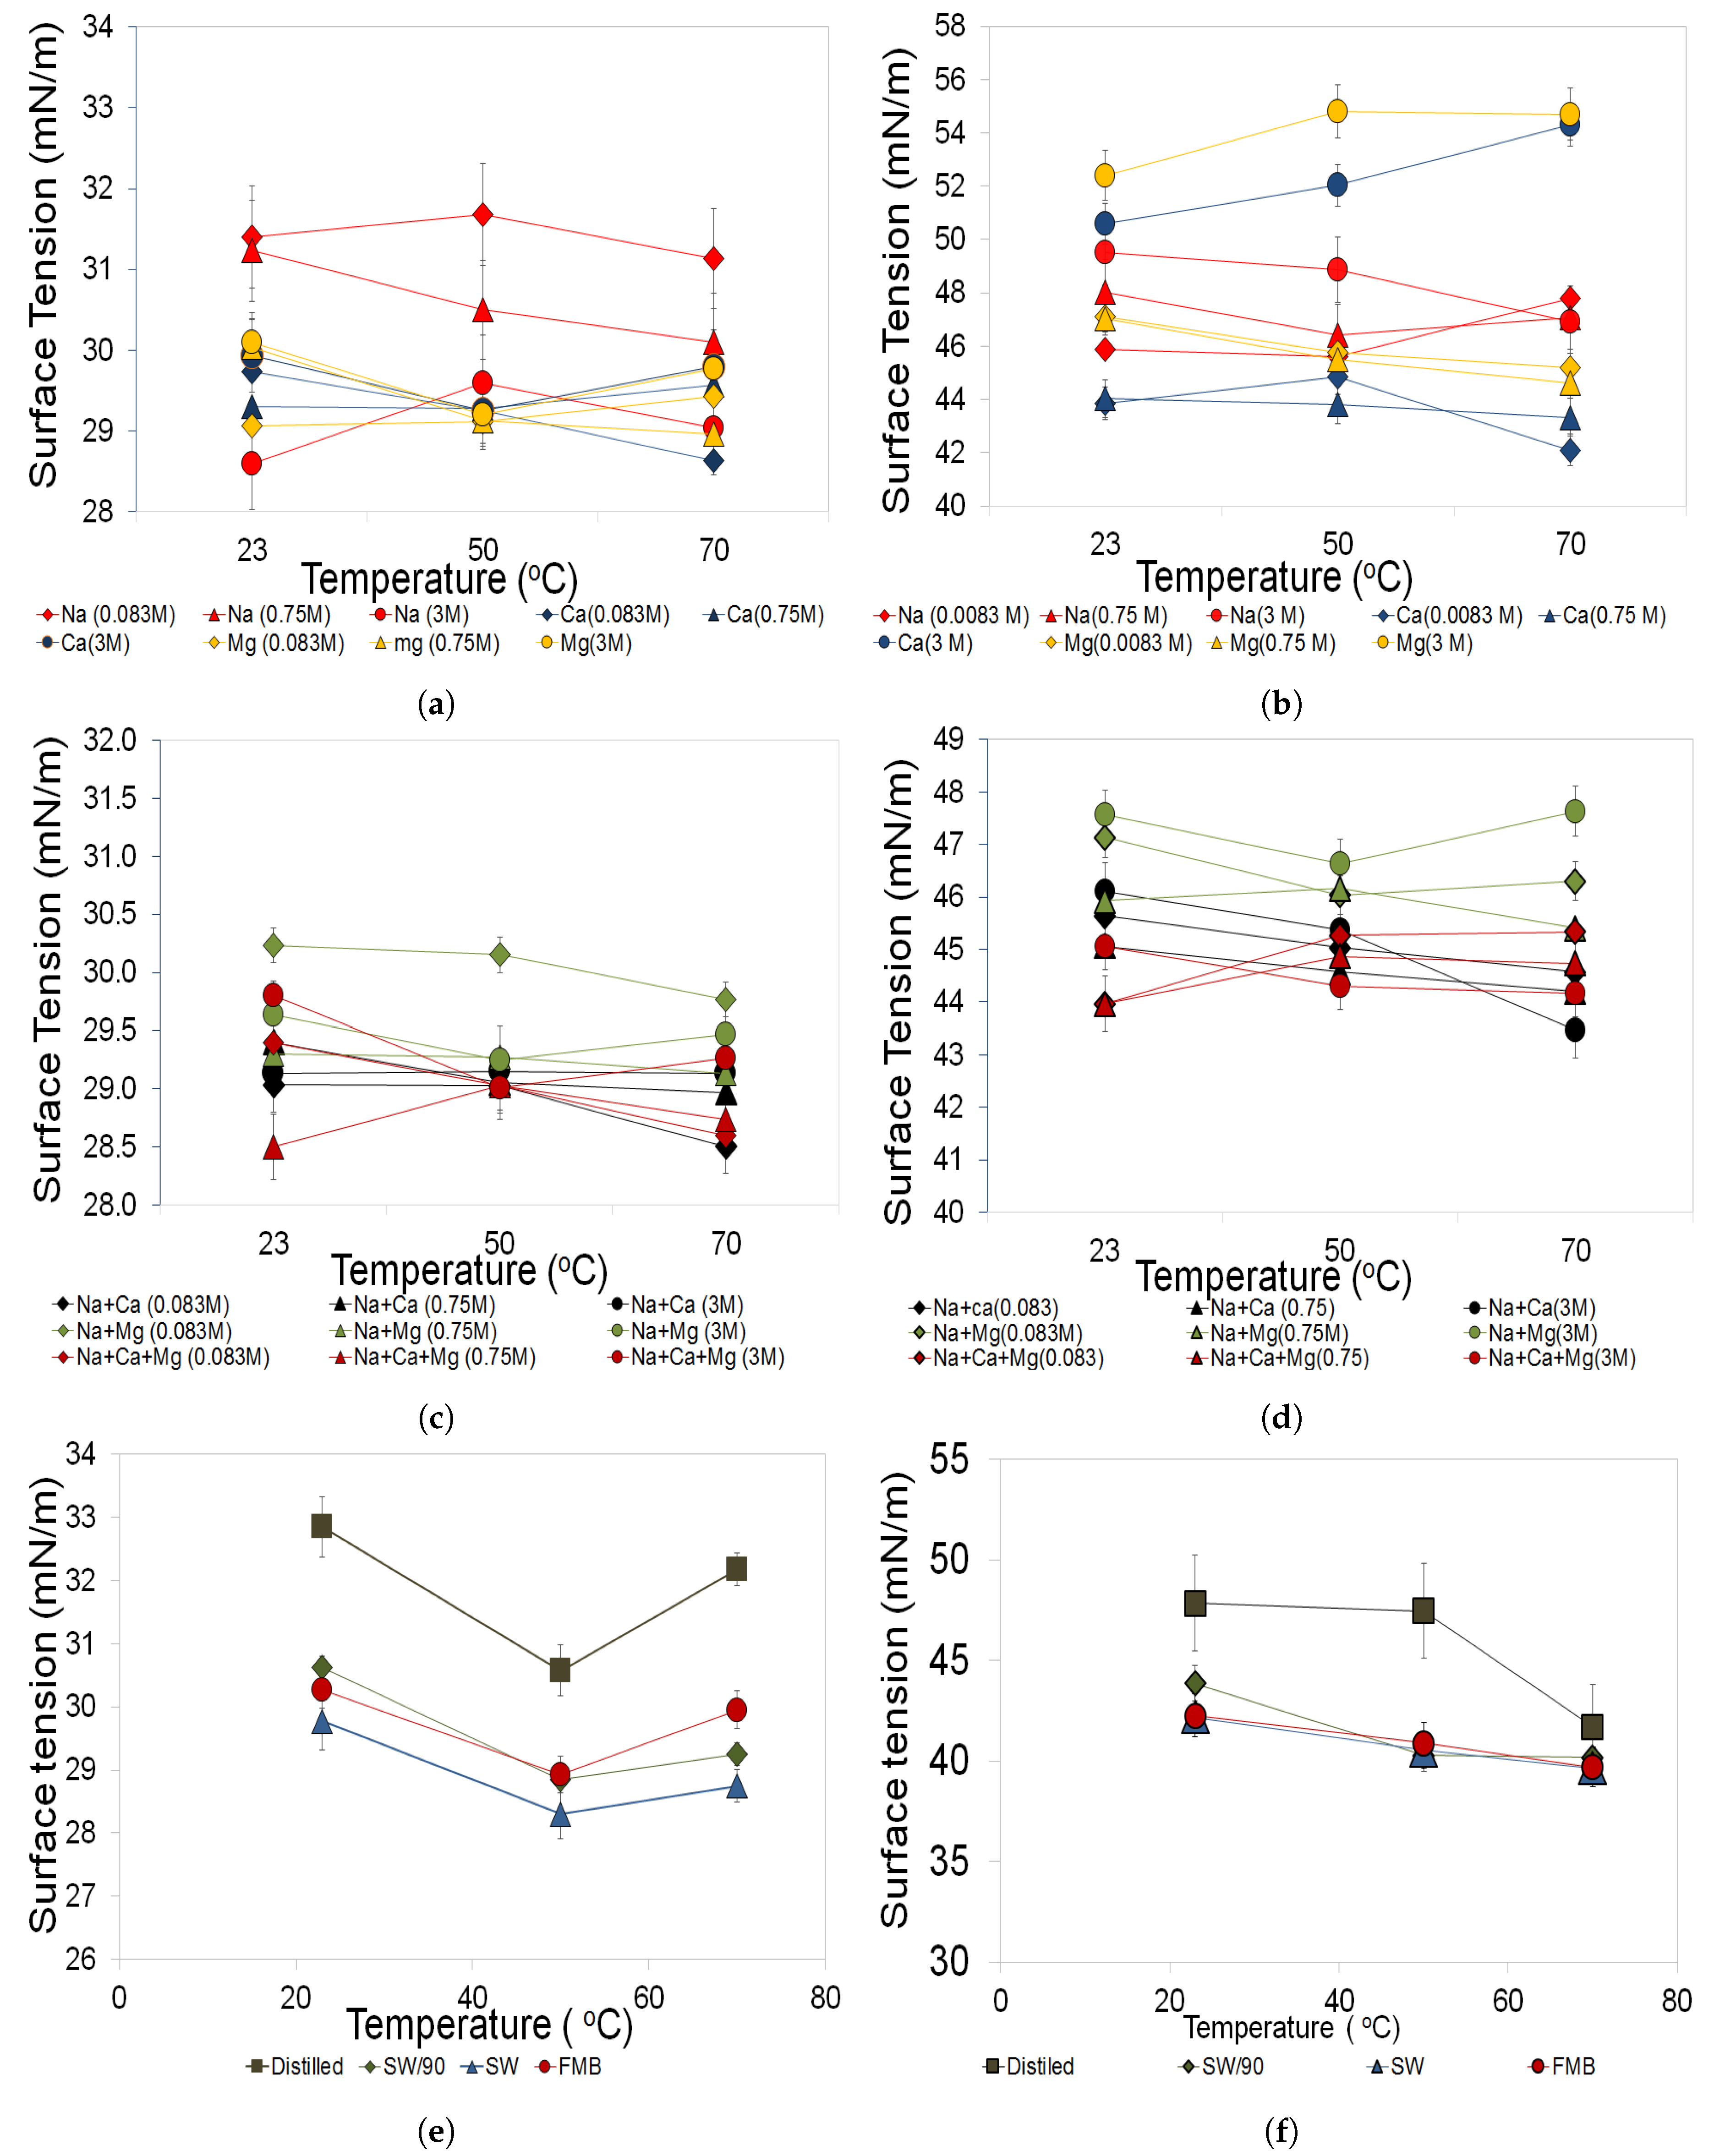
3.3.2. Temperature Effects

The results of combined effect of temperature, brine composition and concentration on biosurfactant surface activity is presented in Figure 6. Different responses were observed based on their respective composition and concentrations. Addition of rhamnolipid to these brine solutions at different temperatures resulted in closely related surface activity. For the single brine solutions (Figure 6a), a distinct surface activity of rhamnolipid was observed with Na + solution with clear correlation with brine concentration. Their surface activity increased with increase in salinity with the lowest activity being observed with lowest concentration but all the solutions showed relatively stable surface activity with an increase in temperature. For combined salts solutions (Figure 6c), no significant difference was observed with rhamnolipid surface activity with change in salinity and temperatures except for 8.3 mM Na + +Ca 2 + brine solution that was characterised by low surface activity. Furthermore, rhamnolipid shows relative stability in all complete brine solutions (Figure 6e) with an increase in temperatures with closely related surface activity. They however showed some instability in distilled water as the temperature changes from 23 C to 70 C.
Figure 6b shows the responses of each of the single brine solution to presence of Greenzyme. All the high salinity (3 M) solutions were characterised by distinct low surface activity with slight further reduction in its surface activity with increase in temperature. However, for all other solutions, no significant change was observed with change in salinity and temperature. Also, for the combined brine solutions (Figure 6d), no clear correlation was observed with brine concentration and Greenzyme surface activity. A closely related surface activity was observed with all the brine solutions and slight increase in surface activity. The results of the combined salinity and temperature effect on surface activity and stability of rhamnolipid and Greenzyme show that the trend of surface activity is a function of brine composition but their respective surface activity is stable with increase in temperature which is consistent with other studies [11,17,44,45,46]. Raheb and Hajipour [46] also observed rhamnolipid stability up to 100 C, while Amani et al. [44] and Amani [17] observed rhamnolipid stability at 120 C. More so, Xu et al. [45] also observed increase in surface activity of six protein samples investigated over a range of 23–60 C temperature.
The observed temperature stability of rhamnolipid and Greenzyme can be related to the strength of the hydrogen bonds between the hydroxyl groups of their hydrophilic group and water molecule, which prevents any significant dehydration relative to high temperatures as noted by Stubenrauch [47]. The results of this study have shown that the surface activity of rhamnolipid and Greenzyme in multi-component brine solution can be sustained at investigated temperatures but their surface activity and salinity stability are greatly influenced by brine composition and concentration. Hence, for better understanding of effectiveness of biosurfactants application in EOR processes, single salt solution cannot be used as a representative of multi-component reservoir brine therefore, relevant brine composition should be used.

4. Conclusions

The surface-active and aqueous solution behaviour of rhamnolipid and Greenzyme have been investigated and the results of this study have given fundamental facts on how they relate with brine relevant to hydrocarbon reservoirs which can be very helpful with the understanding of their EOR application. The obtained results show that:
  • Rhamnolipid and Greenzyme have demonstrated low CMC that is desirable of any surfactant. The surface tension of both biosurfactants was found to decrease with increasing concentration.
  • Rhamnolipid demonstrated higher surface activity than Greenzyme while Greenzyme shows higher aggregation capacity that favours micelle formation than rhamnolipid.
  • Greenzyme was found to be soluble in all brine solutions, while rhamnolipid solubility was found to be more dependent on brine composition than solution pH and ionic strength. Hence, biosurfactant aqueous behaviour should be carried out with relevant brine composition.
  • The results of this study have also shown that Greenzyme can be used for EOR applications at salinity up to 3 M, typical for many hydrocarbon reservoirs while rhamnolipid cannot be used due to its insolubility. However, at low to medium salinity condition, both of them can be used for EOR investigations.
  • Both biosurfactants demonstrated stable behavior in surface tension in solutions up to 3 M and temperatures up to 70 C, making these biosurfactants a suitable substitute for hazardous chemical surfactants used in chemical EOR.
  • This study has also shown that rhamnolipid and Greenzyme show highest surface tension and instability in NaCl solution that is commonly used in biosurfactant studies, while they were stable in multi-component brine solutions.

Author Contributions

T.U. and J.V. wrote the manuscript. T.U. and J.V. planned the experimental program. T.U. conducted the experiments. T.U. and J.V. interpreted the experimental results.

Funding

This research was funded by Tertiary Education Trust Fund (TETFund) grant through Akwa Ibom State University (AKSU), Nigeria.

Acknowledgments

The financial support of Tertiary Education Trust Fund (TETFund) through Akwa Ibom State University (AKSU) is highly appreciated. We also appreciate Biotech Processing Supply, Dallas Texas for the Greenzyme used in this study.

Conflicts of Interest

No conflict of interest.

References

  1. Myers, D. Surfactant surface activity. In Surfaces, Interfaces, and Colloids: Principles and Applications, 2nd ed.; Wiley-Vch: New York, NY, USA, 1999. [Google Scholar]
  2. Rosen, M.J. Adsorption of surface-active agents at interfaces: the electrical double layer. Surfactants Interfacial Phenom. 2004, 3, 34–104. [Google Scholar]
  3. Van Hamme, J.D.; Ajay, S.; Owen, P.W. Physiological aspects: Part 1 in a series of papers devoted to surfactants in microbiology and biotechnology. Biotechnol. Adv. 2006, 24, 604–620. [Google Scholar] [CrossRef] [PubMed]
  4. Banat, I.M.; Franzetti, A.; Gandolfi, I.; Bestetti, G.; Martinotti, M.G.; Fracchia, L.; Smyth, T.J.; Marchant, R. Microbial biosurfactants production, applications and future potential. Appl. Microbiol. Biotechnol. 2010, 87, 427–444. [Google Scholar] [CrossRef] [PubMed]
  5. Soberón-Chávez, G. Biosurfactants: From genes to applications. Springer Sci. Bus. Media 2010, 20, 2–3. [Google Scholar]
  6. Penfold, J.; Thomas, R.K.; Shen, H. Adsorption and self-assembly of biosurfactants studied by neutron reflectivity and small angle neutron scattering: Glycolipids, lipopeptides and proteins. Soft Matter 2012, 8, 578–591. [Google Scholar] [CrossRef]
  7. Banat, I.M. Biosurfactants production and possible uses in microbial enhanced oil recovery and oil pollution remediation: A review. Bioresour. Technol. 1995, 51, 1–12. [Google Scholar] [CrossRef]
  8. Norde, W. Driving forces for protein adsorption at solid surfaces. Macromol. Symp. 1996, 103, 5–19. [Google Scholar] [CrossRef]
  9. Pornsunthorntawee, O.; Arttaweeporn, N.; Paisanjit, S.; Somboonthanate, P.; Abe, M.; Rujiravanit, R.; Chavadej, S. Isolation and comparison of biosurfactants produced by Bacillus subtilis PT2 and Pseudomonas aeruginosa SP4 for microbial surfactant-enhanced oil recovery. Biochem. Eng. J. 2008, 42, 172–179. [Google Scholar] [CrossRef]
  10. Bordoloi, N.K.; Konwar, B.K. Microbial surfactant-enhanced mineral oil recovery under laboratory conditions. Colloids Surf. B Biointerfaces 2008, 63, 73–82. [Google Scholar] [CrossRef]
  11. Wang, Y.; Kantzas, A.; Li, B.; Li, Z.; Wang, Q.; Zhao, M. New Agent for Formation-Damage Mitigation in Heavy-Oil Reservoir: Mechanism and Application. In Proceedings of the SPE International Symposium and Exhibition on Formation Damage Control, Lafayette, LA, USA, 13–15 February 2008. [Google Scholar]
  12. Eskandari, S.; Rashedi, H.; Ziaie-Shirkolaee, Y.; Mazaheri-Assadi, M.; Jamshidi, E.; Bonakdarpour, B. Evaluation of oil recovery by rhamnolipid produced with isolated strain from Iranian oil wells. Ann. Microbial. 2009, 59, 573–577. [Google Scholar] [CrossRef]
  13. Nasiri, H.; Spildo, K.; Skauge, A. Use of enzymes to improve waterflood performance. In Proceedings of the International Symposium of the Society of Core Analysts, Noordwijk, The Netherlands, 27–30 September 2009; pp. 27–30. [Google Scholar]
  14. Wang, W. Experimental Study of Oil Displacement by the Bio-enzyme at the Third Type Reservoirs of Sabei Blocks. In Proceedings of the Power and Energy Engineering Conference (APPEEC), Chengdu, China, 28–31 March 2010; pp. 1–4. [Google Scholar]
  15. Amani, H.; Müller, M.M.; Syldatk, C.; Hausmann, R. Production of Microbial Rhamnolipid by Pseudomonas Aeruginosa MM1011 for Ex Situ Enhanced Oil Recovery. Appl. Biochem. Biotechnol. 2013, 170, 1080–1093. [Google Scholar] [CrossRef] [PubMed]
  16. Al-Wahaibi, Y.; Joshi, S.; Al-Bahry, S.; Elshafie, A.; Al-Bemani, A.; Shibulal, B. Biosurfactant production by Bacillus subtilis B30 and its application in enhancing oil recovery. Colloids Surf. B Biointerfaces 2014, 114, 324–333. [Google Scholar] [CrossRef] [PubMed]
  17. Amani, H. Study of enhanced oil recovery by rhamnolipids in a homogeneous 2D micromodel. J. Pet. Sci. Eng. 2015, 128, 212–219. [Google Scholar] [CrossRef]
  18. Ghojavand, H.; Vahabzadeh, F.; Roayaei, E.; Shahraki, A.K. Production and properties of a biosurfactant obtained from a member of the Bacillus subtilis group (PTCC 1696). J. Colloid Interface Sci. 2008, 324, 172–176. [Google Scholar] [CrossRef] [PubMed]
  19. Al-Sulaimani, H.; Al-Wahaibi, Y.; Al-Bahry, S.; Elshafie, A.; Al-Bemani, A.; Joshi, S.; Zargari, S. Optimization and partial characterization of biosurfactants produced by Bacillus species and their potential for ex-situ enhanced oil recovery. SPE J. 2011, 16, 672–682. [Google Scholar] [CrossRef]
  20. Wang, Q.; Fang, X.; Bai, B.; Liang, X.; Shuler, P.J.; Goddard, W.A.; Tang, Y. Engineering bacteria for production of rhamnolipid as an agent for enhanced oil recovery. Biotechnol. Bioeng. 2007, 98, 842–853. [Google Scholar] [CrossRef] [PubMed]
  21. Al-Bahry, S.N.; Al-Wahaibi, Y.M.; Elshafie, A.E.; Al-Bemani, A.S.; Joshi, S.J.; Al-Makhmari, H.S.; Al-Sulaimani, H.S. Biosurfactant production by Bacillus subtilis B20 using date molasses and its possible application in enhanced oil recovery. Int. Biodeterior. Biodegrad. 2013, 81, 141–146. [Google Scholar] [CrossRef]
  22. Özdemir, G.; Peker, S.; Helvaci, S.S. Effect of pH on the surface and interfacial behavior of rhamnolipids R1 and R2. Colloids Surf. A Physicochem. Eng. Asp. 2004, 234, 135–143. [Google Scholar] [CrossRef]
  23. Mańko, D.; Zdziennicka, A.; Jańczuk, B. Thermodynamic properties of rhamnolipid micellization and adsorption. Colloids Surf. B Biointerfaces 2014, 119, 22–29. [Google Scholar] [CrossRef] [PubMed]
  24. Khusainova, A.; Shapiro, A.A.; Stenby, E.H.; Woodley, J.M. Wettability Improvement with Enzymes: Application to Enhanced Oil Recovery under Conditions of the North Sea Reservoirs. Grad. Sch. Yearb. 2012 2014, 119, 125. [Google Scholar]
  25. Udoh, T.; Akanji, L.; Vinogradov, J. Experimental Investigation of Potential of Combined Controlled Salinity and Bio-Surfactant CSBS in Enhanced Oil Recovery EOR Processes. In Proceedings of the SPE Nigeria Annual International Conference and Exhibition, Lagos, Nigeria, 6–8 August 2018. [Google Scholar] [CrossRef]
  26. Chen, G. Rhamnolipid biosurfactant behavior in solutions. J. Biomater. Sci. Polym. Ed. 2004, 15, 229–235. [Google Scholar] [CrossRef] [PubMed]
  27. Demissie, H.; Duraisamy, R. Effects of electrolytes on the surface and micellar characteristics of Sodium dodecyl sulphate surfactant solution. J. Sci. Innov. Res. 2016, 5, 208–214. [Google Scholar]
  28. Szymczyk, K.; Jańczuk, B. The adsorption at solution-air interface and volumetric properties of mixtures of cationic and nonionic surfactants. Colloids Surf. A Physicochem. Eng. Asp. 2007, 293, 39–50. [Google Scholar] [CrossRef]
  29. Sheng, J.J. Modern Chemical Enhanced Oil Recovery; Gulf Professional Publishing: Burlington, MA, USA, 2011. [Google Scholar]
  30. Bâldea, I. Molecular Electronics: An Experimental and Theoretical Approach; Pan Stanford Publishing, 8 Temasek Boulevard: Singapore, 2016. [Google Scholar]
  31. Attwood, D.; Florence, A.T. FASTtrack Physical Pharmacy; Pharmaceutical Press: London, UK, 2012. [Google Scholar]
  32. Abalos, A.; Pinazo, A.; Infante, M.R.; Casals, M.; Garcia, F.; Manresa, A. Physicochemical and antimicrobial properties of new rhamnolipids produced by Pseudomonas a eruginosa AT10 from soybean oil refinery wastes. Langmuir 2001, 17, 1367–1371. [Google Scholar] [CrossRef]
  33. Chen, M.L.; Penfold, J.; Thomas, R.K.; Smyth, T.J.P.; Perfumo, A.; Marchant, R.; Banat, I.M.; Stevenson, P.; Parry, A.; Tucker, I. Solution self-assembly and adsorption at the air-water interface of the monorhamnose and dirhamnose rhamnolipids and their mixtures. Langmuir 2010, 26, 18281–18292. [Google Scholar] [CrossRef]
  34. Dyke, M.I.V.; Couture, P.; Brauer, M.; Lee, H.; Trevors, J.T. Pseudomonas aeruginosa UG2 rhamnolipid biosurfactants: Structural characterization and their use in removing hydrophobic compounds from soil. Can. J. Microbiol. 1993, 39, 1071–1078. [Google Scholar] [CrossRef]
  35. Rahman, P.K.S.M.; Gakpe, E. Production, characterisation and applications of biosurfactants-Review. Biotechnology 2008, 7, 360–370. [Google Scholar] [CrossRef]
  36. Lotfabad, T.B.; Abassi, H.; Ahmadkhaniha, R.; Roostaazad, R.; Masoomi, F.; Zahiri, H.S.; Ahmadian, G.; Vali, H.; Noghabi, K.A. Structural characterization of a rhamnolipid-type biosurfactant produced by Pseudomonas aeruginosa MR01: Enhancement of di-rhamnolipid proportion using gamma irradiation. Colloids Surf. B Biointerfaces 2010, 81, 397–405. [Google Scholar] [CrossRef]
  37. Butt, H.; Graf, K.; Kappl, M. Thermodynamics of Interfaces. In Physics and Chemistry of Interfaces; Wiley-VCH Verlag GmbH & Co. KGaA: Weinheim, Germany, 2010; pp. 26–41. ISBN 9783527602315. [Google Scholar]
  38. Xia, J. Protein-Based Surfactants: Synthesis: Physicochemical Properties, and Applications; Marcel Dekker, Inc.: New York, NY, USA, 2001; Volume 101. [Google Scholar]
  39. Ren, Z.H. Mechanism of the salt effect on micellization of an aminosulfonate amphoteric surfactant. Ind. Eng. Chem. Res. 2015, 54, 9683–9688. [Google Scholar] [CrossRef]
  40. Piazza, R. Interactions and phase transitions in protein solutions. Curr. Opin. Colloid Interface Sci. 2000, 5, 38–43. [Google Scholar] [CrossRef]
  41. Norde, W. Adsorption of proteins from solution at the solid-liquid interface. Adv. Colloid Interface Sci. 1986, 25, 267–340. [Google Scholar] [CrossRef]
  42. Ishigami, Y.; Gama, Y.; Ishii, F.; Choi, Y.K. Colloid chemical effect of polar head moieties of a rhamnolipid-type biosurfactant. Langmuir 1993, 9, 1634–1636. [Google Scholar] [CrossRef]
  43. Raza, Z.A.; Khalid, Z.M.; Khan, M.S.; Banat, I.M.; Rehman, A.; Naeem, A.; Saddique, M.T. Surface properties and sub-surface aggregate assimilation of rhamnolipid surfactants in different aqueous systems. Biotechnol. Lett. 2010, 32, 811–816. [Google Scholar] [CrossRef] [PubMed]
  44. Amani, H.; Mehrnia, M.R.; Sarrafzadeh, M.H.; Haghighi, M.; Soudi, M.R. Scale up and application of biosurfactant from bacillus subtilis in enhanced oil recovery. Appl. Biochem. Biotechnol. 2010, 162, 510–523. [Google Scholar] [CrossRef] [PubMed]
  45. Xu, Y.Y.; Howes, T.; Adhikari, B.; Bhandari, B. Investigation of Relationship between Surface Tension of Feed Solution Containing Various Proteins and Surface Composition and Morphology of Powder Particles. Drying Technol. 2012, 30, 1548–1562. [Google Scholar] [CrossRef]
  46. Raheb, J.; Hajipour, M.J. The Stable Rhamnolipid Biosurfactant Production in Genetically Engineered Pseudomonas Strain Reduced Energy Consumption in Biodesulfurization. Energy Sources Part A Recovery Util. Environ. Effects 2011, 33, 2113–2121. [Google Scholar] [CrossRef]
  47. Stubenrauch, C. Sugar surfactants—Aggregation, interfacial, and adsorption phenomena. Curr. Opin. Colloid Interface Sci. 2001, 6, 160–170. [Google Scholar] [CrossRef]
Figure 1. Plots of surface tension (filled symbols) and conductivity (unfilled symbols) against concentration of aqueous solution of (a) rhamnolipid (b) Greenzyme.
Colloids 03 00024 g001
Figure 2. Plots of conductivity and surface tension isotherms used to determine free energy of micellisation and excess surface concentration for: rhamnolipid (a,c) and Greenzyme (b,d).
Colloids 03 00024 g002
Figure 3. Illustration of biosurfactants solubility: (a) Solubility of Greenzyme and rhamnolipid in aqueous solution illustrated: (A) an example of rhamnolipid precipitation, (B,C) examples of rhamnolipid solubility (D–F) examples of Greenzyme solubility; (b) rhamnolipid solubility behaviour under different temperature: (A, C, D and F) are examples of solutions in which rhamnolipid was insoluble at low temperature and coagulation was observed at high temperatures while (B and E) are examples of solutions in which rhamnolipid was soluble at low temperature and still soluble at high temperature.
Colloids 03 00024 g003
Figure 4. Plot of relationship between pH and ionic strength of different aqueous solutions of rhamnolipid. The ionic strength decreases from left to right and the dashed lines represent the threshold pH, above and below the two lines rhamnolipid was soluble and insoluble respectively while in-between both effects were observed. The red circle shows electrolytes with same pH but different soluble effect.
Colloids 03 00024 g004
Figure 5. Plots of surface activity of brine solutions of different compositions and concentration: (a) without any biosurfactant, the dotted line is the surface tension of water as baseline (b) with addition of rhamnolipid (c) with addition of Greenzyme. Complete represents brine solution with Na + +Ca 2 + +Mg 2 + +SO 4 2 used at different salinity levels.
Colloids 03 00024 g005
Figure 6. Plots of effects of temperature on surface activity of aqueous solutions of rhamnolipid (the three plots on left—a,c,e) and Greenzyme (three plots on right—b,d,f) with different brine compositions and concentrations.
Colloids 03 00024 g006
Table 1. Concentration of stock solutions of different brine components used.
IonsFBM (M)SW (M)NaCl (M)CaCl 2 (M)MgCl 2 (M)Na + +Ca 2 + (M)Na + +Mg 2 + (M)Na + +Ca 2 + +Mg 2 + (M)
Na + 1.4630.5503.000--1.2002.5001.103
Ca 2 + 0.4200.014-1.000-0.600-0.559
Mg 2 + 0.0910.045--1.000-0.1670.074
Cl 2.4850.6203.0002.0002.0002.4002.8352.367
SO 4 2 0.0020.024------
Ionic strength3.0000.7503.0003.0003.0003.0003.0003.000
pH5.016.046.374.825.416.217.176.42

