Article

Effect of Amplitude on the Surface Dilational Visco-Elasticity of Protein Solutions

by
Volodymyr I. Kovalchuk
1,*,
Eugene V. Aksenenko
2,
Dmytro V. Trukhin
3,
Alexander V. Makievski
4,
Valentin B. Fainerman
4 and
Reinhard Miller
5
1
Institute of Biocolloid Chemistry, National Academy of Sciences of Ukraine, 03680 Kyiv (Kiev), Ukraine
2
Institute of Colloid Chemistry and Chemistry of Water, National Academy of Sciences of Ukraine, 03680 Kyiv (Kiev), Ukraine
3
Oncology Department, Odesa National Medical University, 65000 Odesa, Ukraine
4
SINTERFACE Technologies, D12489 Berlin, Germany
5
MPI Colloids and Interfaces, 14424 Potsdam, Germany
*
Author to whom correspondence should be addressed.
Colloids Interfaces 2018, 2(4), 57; https://doi.org/10.3390/colloids2040057
Submission received: 17 October 2018 / Revised: 6 November 2018 / Accepted: 7 November 2018 / Published: 10 November 2018

Abstract

:
Harmonic drop surface area oscillations are performed at a fixed frequency (0.1 Hz) to measure the dilational visco-elasticity for three proteins: β-casein (BCS), β-lactoglobulin (BLG), and human serum albumin (HSA). The surface area oscillations were performed with different amplitudes in order to find the origin of non-linearity effects. The analysis of data shows that the non-linearity in the equation of state—i.e., the relation between surface pressure and surface concentration of adsorbed protein molecules—is the main source of the amplitude effects on the apparent visco-elasticity, while perturbations due to non-uniform expansions and compressions of the surface layer, inertia effects leading to deviations of the drop profile from the Laplacian shape, or convective transport in the drop bulk are of less importance. While for the globular proteins, HSA and BLG the amplitude effects on the apparent visco-elasticity are rather large, for the non-globular protein BCS this effect is negligible in the studied range of up to 10% area deformation.

Graphical Abstract

1. Introduction

There are many studies on the dilational visco-elasticity of proteins adsorbed at liquid interfaces [1,2,3,4,5,6,7,8,9,10,11,12,13,14,15,16]. The easiest way to determine it is the measurement of the surface tension response generated by surface area changes. In these experiments, the studied object (in many cases a drop or a bubble) is forced to harmonic oscillations of the surface area at different amplitudes. The oscillations can be applied after the establishment of the adsorption equilibrium or under dynamic conditions during the continuous slow decrease of the surface tension due to the proceeding adsorption. The linear response of the surface or interfacial tension to the area variations is usually analyzed by using the Fourier transforms. In some cases [12,13], the response is analyzed in more details with account for any non-linear terms of the visco-elasticity. For a quantitative determination of the degree of distortion of the harmonical signal due to non-linear effects one usually uses the total harmonic distortion (THD) index [17,18]. The THD index shows the relative contribution of higher harmonics to the signal as compared to the contribution at the fundamental frequency.
For avoiding any non-linear responses, usually the measurements of the surface dilatational visco-elasticity are performed at sufficiently small area deformations. However, the situation in real systems like emulsions and foams is typically non-linear [19,20,21,22,23]. An example for studies in a wide range of surface oscillation amplitudes (from 10% to 30%) was presented in [20], where the foaming properties of mixtures of polymers and surfactants were investigated. It was observed that the surface dilatational modulus continuously decreases with increasing amplitude.
An investigation of the dilational surface visco-elasticity of solutions on the surface age of three frequently studied proteins: β-casein (BCS), β-lactoglobulin (BLG), and human serum albumin (HSA) was performed in [24] using the drop profile analysis tensiometry (PAT-1). Here, the surface tensions response to sinusoidal drop area oscillations during the process of adsorption layer formation was measured. For BCS solutions at short adsorption times (about 200 s after drop formation) the measured visco-elasticity moduli values at given surface pressure values were much lower than those at longer adsorption times or after the adsorption equilibrium was reached. In contrast, for BLG and HSA solutions, there is practically no kind of a dependence of the visco-elasticity modulus on adsorption time. A theoretical model published earlier [25] is generalized here in order to account for the adsorption at the drop surface, i.e., the loss of protein molecules inside the drop due to their adsorption at the drop surface is quantitatively considered. The obtained results show good agreement between the modified model with the experimental surface tension isotherm as well as with the calculated equilibrium visco-elastic modulus. In [24], the effect of the oscillation amplitude was also considered for the proteins studied here, and it was shown that the apparent visco-elasticity modulus for BLG increases when the area oscillation amplitude decreases. For BCS, on the contrary, no remarkable changes in the visco-elastic modulus at different oscillations amplitude were observed. A reason for this situation could maybe be the fact that for non-globular proteins like BCS the modulus is much lower than for globular proteins like BLG. The data for HSA have showed that the visco-elasticity of HSA adsorption layers at smaller amplitudes is also significantly higher than those measured at higher amplitudes.
In the present work, we continue the studies of the effect of oscillation amplitude on the rheological surface properties of proteins solutions. However, in contrast to the experiments performed in [24], we consider here only concentrations below the critical concentration. Although the THD index reflects the degree of deviation from an ideal sinusoidal signal, it does not allow to identify the physical origin for these deviations. Therefore, an analysis of the non-linear effects, which produce the most significant deviations, is performed. It is shown that for the proteins studied here (BCS, BLG, and HSA) the main factor leading to a dependence of the measured visco-elasticity on amplitude can be the non-linearity of the equation of state of the adsorption layer. The non-linear effects for the proteins were calculated by using the corresponding equations of state. The calculation results were compared with the experimental data to show a significant contribution of the non-linearity of the equation of state to the dependency of the elasticity modulus on the amplitude of the applied area oscillations.

2. Materials and Methods

The experimental details of surface tension measurements using the drop profile analysis tensiometry (PAT-1, SINTERFACE Technologies, Germany), are given elsewhere [24,26]. The experiments were performed in the pendant drop mode. For the determination of the dilational visco-elasticity, we performed harmonic drop area oscillations at various times after the formation of the adsorption layer: 200, 400, 2000, and 5000 s. For the investigation of the effect of the area oscillation amplitude, we used a fixed frequency of 0.1 Hz and changed the surface area amplitude between 3% and 10%. The visco-elasticity values were calculated from the measured surface tension and drop surface area oscillations via a Fourier transformation procedure. The drops were formed at the tip of a vertical steel capillary with internal diameter of 3.0 mm. The surface areas of the drops were 32–36 mm2, and kept constant during the experiments. The initial volume of the drops was 21–24 mm3. The decrease of interfacial tension leads to the decrease of the drop volume by 3–5% while keeping the drop surface area constant.
The three studied proteins—BCS, BLG, and HAS—were purchased from Sigma (Germany) and were used as received. All measurements were made at a constant temperature of 25 °C. The protein solutions were all prepared in phosphate buffer (0.01 M, pH 7) using respective amounts of solutions of Na2HPO4 and NaH2PO4. All stock solutions were kept no longer than three days in a fridge at 5 °C. The Milli-Q water used for preparing the aqueous solutions had a constant surface tension over the time of at least 24 h of 72.0 ± 0.2 mN/m (at 25 °C).

3. Theory

3.1. Adsorption Layer Model

Let us consider first the adsorption model of proteins at liquid interfaces. In this study, we used theoretical models presented in [6,7,14,15,24]. The model used here assumes a multilayer adsorption and an area per protein molecule adsorbed in the first layer ω, which varies between minimum and maximum values, ωmin and ωmax, respectively, depending on the surface coverage. At protein concentrations higher than a critical value (which corresponds to a critical adsorption value Γ P * or critical value of the surface pressure Π*), we can assume that adsorbed molecules condensate or aggregate at the surface.
In the pre-critical concentration range, the equation of state for the first adsorption layer reads
Π ω 0 R T = ln ( 1 θ ) + θ ( 1 ω 0 ω ) + a θ 2   ,
where Π = γ0 − γ is the surface pressure (γ0 and γ are the surface tension values of the aqueous buffer solution and the studied solution, respectively); R is the gas law constant, and T is the absolute temperature. Moreover, the parameter a represents the intermolecular interaction between adsorbed molecules, and ω0 is the area difference between two neighbour adsorption states. This gives ωj = ωmin + (j − 1)ω0 and n = (ωmax − ωmin)/ω0 + 1, where n is the number of adsorption states. The surface coverage θ in the first adsorption layer is given by θ = ω Γ = j = 1 n ω j Γ j , where ω is the mean molar area of adsorbed protein molecules.
The adsorption isotherm for the protein reads
b 1 c = ω Γ j ( ω j / ω 1 ) α ( 1 θ ) ω 1 / ω exp ( 2 a ω j ω θ ) ,      j   =   1 ,   2 ,   ,   n ,
where the exponent α is the model parameter which controls the difference in the adsorption activity coefficients bj for each of n adsorption states
b j = b 1 ( ω j / ω 1 ) α .
The parameter b1 in Equation (2) is the adsorption activity coefficient for the state j = 1 of the adsorbed protein molecules. Combining the expression which follows from Equation (2) for j = 1 with the corresponding expression for any other j, and using Equation (3), we can determine the protein adsorption in state j
Γ j = Γ 1 ( ω j ω 1 ) α exp { ω j ω 1 ω [ ln ( 1 θ ) + 2 a θ ] } .
The total adsorption of the protein molecules in the primary layer then reads
Γ = j = 1 n Γ j = Γ 1 j = 1 n ( ω j ω 1 ) α exp { ω j ω 1 ω [ ln ( 1 θ ) + 2 a θ ] } ,
For the total protein adsorption ΓP a Langmuir type model for L adsorption layers can be used (bX is the adsorption equilibrium constant for the external layers)
Γ P = Γ i = 1 L ( b X c 1 + b X c ) i 1 .
At concentrations above the critical point, i.e., for Π > Π*, the relation was developed in [7] assuming the aggregation in the adsorbed layer
Π = Π * ( 1 + 1 n a Γ P Γ P * Γ P * ) .
Here na is the aggregation number of the formed protein aggregates.
As mentioned above, at low bulk protein concentrations there is a depletion of molecules due to adsorption at the drop surface. This depletion depends on the surface area S of the drop and its volume [25]. The final concentration at the equilibrium of adsorption, is then c = c0 – (S/V) ΓP, where c0 is the initial protein concentration in the drop.
Harmonic oscillations of the drop volume, generated with the drop profile tensiometer PAT-1, can be used to measure the dilational visco-elasticity of adsorbed layers. A diffusion theory developed by Joos [27] allows to consider the effect of a spherical surface with radius r on the adsorption. For the visco-elasticity E we then get [27,28]
E = E 0 { 1 i D ω ˜ r d c d Γ P [ ν r coth ( ν r ) 1 ] } 1 .
Here, E0 = dΠ/d(ln ΓP) is the visco-elasticity at sufficiently high frequencies of oscillation f, ν 2 = i ( ω ˜ / D ) , ω ˜ = 2 π f is the circular frequency and D is the protein’s diffusion coefficient. The surface dilational visco-elasticity is therefore a complex quantity E = Er + iEi, which defines the visco-elasticity modulus |E| and the corresponding phase angle ϕ (the phase angle between the surface stress dγ and the surface strain dA):
| E | = E r 2 + E i 2 ,      ϕ   =   arctan ( E i / E r ) ,
For protein concentrations above the critical point, the adsorption layers must be treated like composite layers [29], and the high frequency limit of the elasticity E0 can then be obtained from E 0 = E 0 * ( Γ P / Γ P * ) , where the value E 0 * is the elasticity in the critical point.

3.2. Effect of Oscillation Amplitude

In the experiments on surface rheology using drop profile analysis tensiometry an oscillation amplitude dependency of the measured visco-elasticity parameters can appear due to several reasons (the list is not exhausting):
  • The dynamic contribution due to inertia of the liquid can disturb the ideal Laplace shape of the drop. The inertia contribution is proportional to ρv², where ρ is the density, and v is the velocity of the liquid, i.e., this contribution is proportional to the squared velocity and, therefore, to the squared amplitude. Hence, it should decrease fast with the amplitude decrease and, in the linear regimes, it can be neglected.
  • Non-uniformity of the surface expansion during the oscillations—the surface can expand stronger near the drop apex and much less near its base (wetting perimeter). This leads to tangential flows at the surface (Marangoni flows). The corresponding contribution to the surfactant balance equation is proportional to the product ΔΓ⋅vs, where vs is the tangential velocity of the liquid at the surface, and ΔΓ is the difference of the surface concentrations in different points. Both vs and ΔΓ are proportional to the amplitude and, therefore, the effect is proportional to the squared amplitude. In linear regimes, we assume the surface concentration Γ to be constant over the surface.
  • The convective surfactant transfer in the bulk of a solution can overlap with the diffusional transport. The convective term in the convective diffusion equation is proportional to the product v⋅Δc, where v is the velocity of the liquid and Δc is the concentration difference in the bulk. Here, again both multipliers are proportional to the amplitude and, therefore, the effect is proportional to the squared amplitude. The respective term can be neglected by a linearization of the equation.
  • Non-linearity of the surface equation of state and the adsorption isotherm. All usually-used adsorption isotherms are non-linear, except the Henry isotherm. In linear regimes of surface oscillations, the derivatives dΠ/dΓ and dΓ/dc are assumed to be constant. However, in non-linear regimes, these derivatives can change due to large deviations from the equilibrium. When the equations for surface visco-elasticity are derived, one usually expands the functions Π(Γ) and Γ(c) in series, and only the leading terms are retained. At higher amplitudes, the contribution of the neglected higher order terms can be significant.
In the general case, it is difficult to estimate each of these contributions, because this requires the modeling of non-linear processes. However, the contributions of inertia, Marangoni flow, and bulk convection depend on the liquid velocity, which in turn depends on the frequency of oscillations. Frequencies below 0.1 Hz seem to be not very high for usual experimental conditions of oscillating drops and bubbles [30]. Therefore, the effects depending on the velocity probably do not play a decisive role under these particular conditions. This can suggest that the main factor leading to a dependence of the surface visco-elasticity on the oscillation amplitude, can be the non-linearity of the surface equation of state Π(Γ). Only for the case of the Henry isotherm is the dependence of Π on Γ linear. However, non-linearity can contribute also in this case because the surface visco-elasticity depends on ln(Γ), which is also a non-linear function.
If the equation of state Π(Γ) is known, one can estimate the contribution of the terms neglected by linearization. If in an oscillation process the adsorption Γ obtains an increment ΔΓ, then for the surface pressure one can write the following Taylor series expansion
Π ( Γ + Δ Γ ) = Π ( Γ ) + d Π d Γ Δ Γ + 1 2 d 2 Π d Γ 2 ( Δ Γ ) 2 + 1 6 d 3 Π d Γ 3 ( Δ Γ ) 3 + .
When the adsorption Γ decreases by the same value ΔΓ, then for the surface pressure we will have
Π ( Γ Δ Γ ) = Π ( Γ ) d Π d Γ Δ Γ + 1 2 d 2 Π d Γ 2 ( Δ Γ ) 2 1 6 d 3 Π d Γ 3 ( Δ Γ ) 3 + .
Therefore, the surface pressure difference for these two deviations of adsorption will be equal to
Π ( Γ + Δ Γ ) Π ( Γ Δ Γ ) = 2 d Π d Γ Δ Γ + 1 3 d 3 Π d Γ 3 ( Δ Γ ) 3 + .
and the ratio of the surface pressure difference to the respective adsorption difference will be
Π ( Γ + Δ Γ ) Π ( Γ Δ Γ ) 2 Δ Γ = d Π d Γ + 1 6 d 3 Π d Γ 3 ( Δ Γ ) 2 + .
Because of the non-linearity of the equation of state this ratio is not equal to dΠ/dΓ, but has a correction proportional to the third derivative d3Π/dΓ3 (if the subsequent terms are neglected). Hence, whether the amplitude of the surface pressure oscillations will increase faster or slower than the adsorption amplitude ΔΓ (and the respective surface area amplitude ΔA), depends on the sign of the derivative d3Π/dΓ3, i.e., it is determined by the shape of the curve Π(Γ). Accordingly, the surface apparent visco-elasticity modulus will either increase or decrease with the amplitude.
From the equation for the limiting elasticity E0 = dΠ/dln(Γ) = Γ⋅dΠ/dΓ we can write dΠ/dΓ = E0/Γ. Then, for the second and third derivatives, we obtain d2Π/dΓ2 = d(E0/Γ)/dΓ, and d3Π/dΓ3 = d2(E0/Γ)/dΓ2. Thus, the sign of the third derivative d3Π/dΓ3 depends on the sign of the second derivative d2(E0/Γ)/dΓ2.
Usually in the framework of the models neglecting the intrinsic compressibility of the adsorption layers, such as the standard Langmuir or Frumkin models, the function E0/Γ increases continuously with increasing Γ, and the second derivative d2(E0/Γ)/dΓ2 is always positive. However, the experimental data show that real dependencies of the limiting elasticity on concentration E0(c), and, therefore, the dependence on adsorption E0(Γ), always exhibits a maximum [31,32]. The presence of this maximum is determined by the effect of the intrinsic compressibility of the adsorption layer [33,34]. This means that in such cases the second derivative d2(E0/Γ)/dΓ2 can be negative. Hence, for such systems the amplitude of the surface pressure oscillations can increase slower with the applied oscillations amplitude than in the linear case, and the apparent visco-elasticity modulus can decrease with the increase of the amplitude.
For protein solutions, the dependencies E0(Π) and E0(Γ) have usually also a maximum, and therefore their visco-elasticity modulus can also decrease with the amplitude. In this study, we analyzed the effect of changes in the oscillation amplitude on the visco-elasticity modulus for three proteins (HSA, BLG, and BCS) by using the dependencies E0(Π) and E0(Γ) obtained from their equations of state Π(Γ). For each protein it is possible to calculate the dependence of E0/Γ on Γ using the corresponding equation of state and to check, whether it has a maximum, and then to calculate the derivative d2(E0/Γ)/dΓ2.
Here, we only analyze the dependencies Π(Γ) and not the dependencies Γ(c). The dependency Γ(c) and the derivative dΓ/dc play a role only in the case when the surfactant has a good solubility and is easily adsorbed and desorbed during one period of oscillations. For proteins, an adsorption or desorption practically do not happen during the oscillations at frequencies of about 0.1 Hz. Therefore, for the proteins, the derivative dΓ/dc does not play a significant role, and we do not consider it here. For well soluble surfactants the non-linearity of the derivative dΓ/dc can also contribute to the dependence of the visco-elasticity modulus on amplitude.
If the surfactant does not adsorb and desorb during the surface area oscillations (like in the case of proteins), then ΓA ≈ const, and the amplitude |ΔΓ| is proportional to |ΔA|. Then the visco-elasticity modulus is equal to the limiting elasticity E0
| E | = | d Π d ln A | d Π d ln Γ = E 0 ,
because in this case |Δln(Γ)| = |Δln(A)|. For such cases, it is possible to analyze dΠ/dln(Γ) instead of |dΠ/dln(A)|. The analysis of the contribution of non-linear terms in the expansions Π(Γ) and ln(Γ) (see Appendix A) gives for the apparent visco-elasticity modulus
E 0 = Γ 0 d Π d Γ + Γ 0 8 d 3 Π d Γ 3 Γ ˜ 2 Γ 0 4 d Π d Γ ( Γ ˜ Γ 0 ) 2 + ,
where Γ ˜ is the amplitude of adsorption oscillations. The second and third terms on the r.h.s. of Equation (15) give a contribution to the visco-elasticity modulus proportional to the squared amplitude Γ ˜ 2 . The next terms in the series give contributions proportional to Γ ˜ 4 , Γ ˜ 6 , etc. For a correct calculation of the visco-elasticity modulus, the oscillation amplitudes should be small. In this case, only the first term in Equation (15) is significant. However, in real experiments the oscillation amplitudes can be larger, and the next terms in the series can contribute to the calculated values of the modulus.
The third term in Equation (15) corresponds to the contribution from the non-linearity of the function |ln(Γ)|. The calculations show that this contribution is small within the limits of usual accuracy of calculations. The second term in Equation (15) reflects the contribution from the non-linearity of the equation of state Π(Γ). This contribution depends on the third derivative d3Π/dΓ3 and, therefore, is determined by the shape of the dependence Π(Γ). Thus, according to Equation (15) the correction to the visco-elasticity modulus due to the finite value of the oscillation amplitude can be estimated as
Δ E 0 = Γ 0 8 d 3 Π d Γ 3 Γ ˜ 2 = ( Γ 0 ) 3 8 d 3 Π d Γ 3 ( Γ ˜ Γ 0 ) 2 .

4. Results and Discussion

4.1. Experimental Results for the Studied Proteins

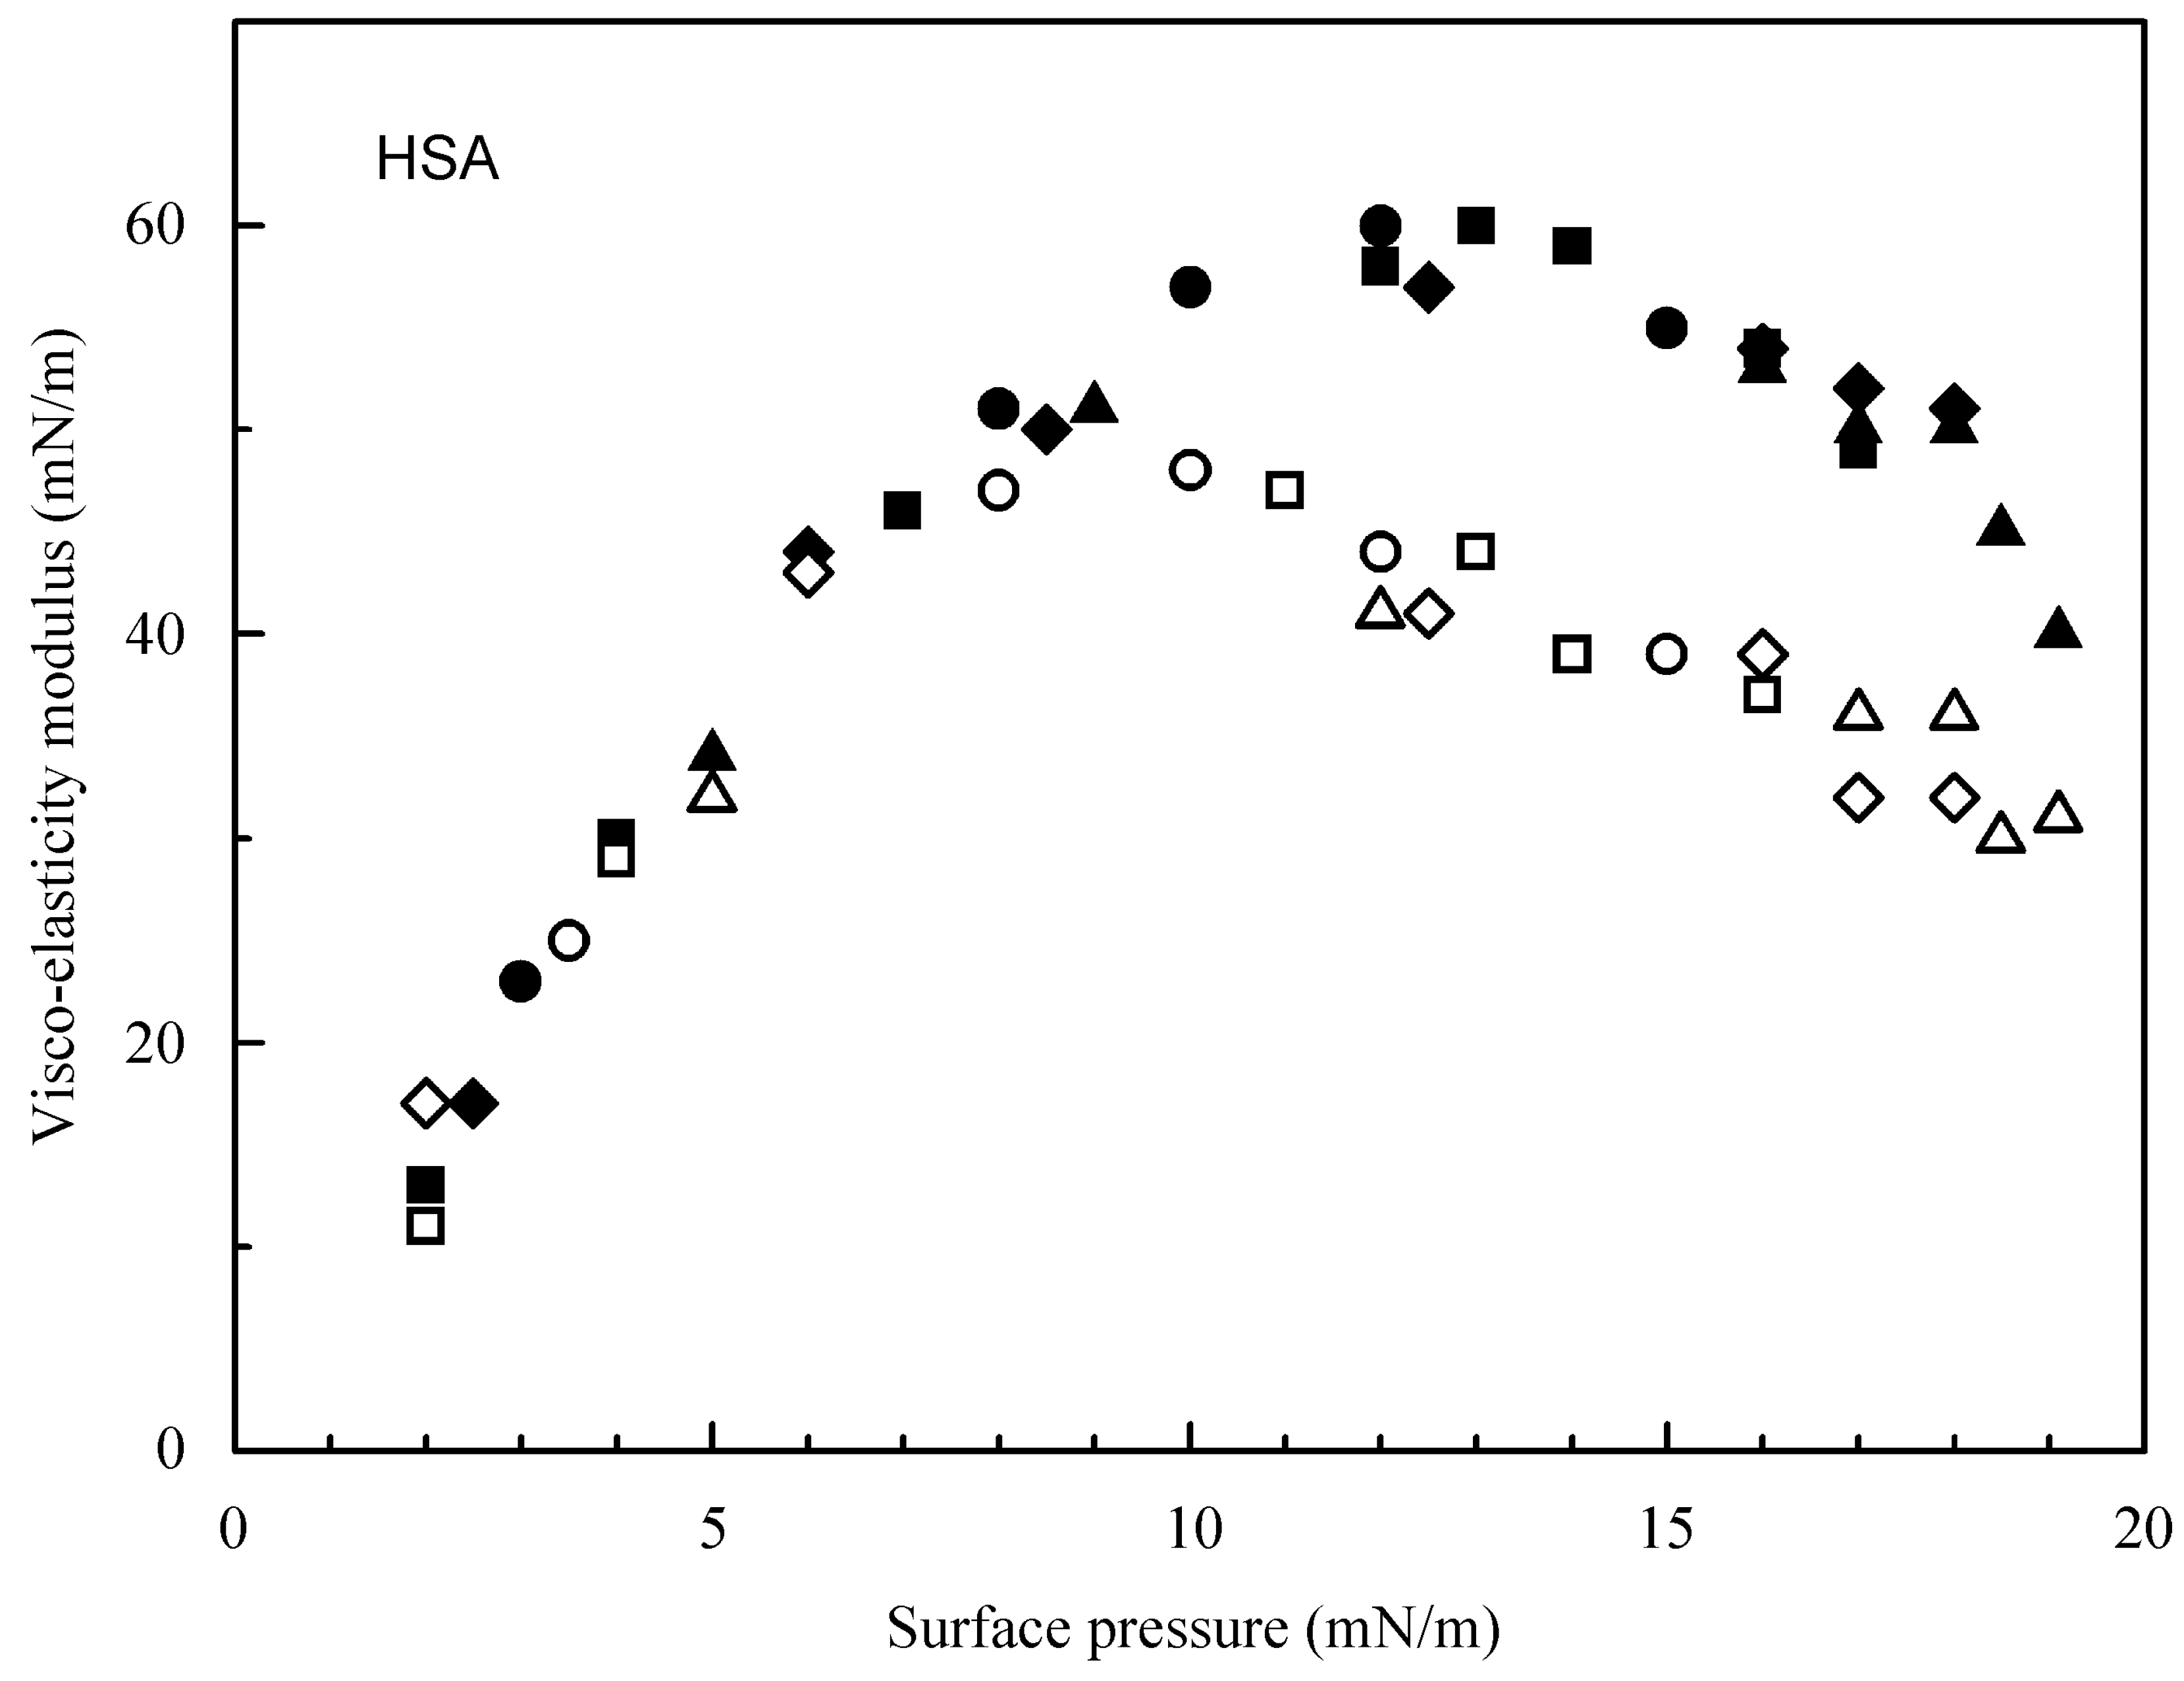
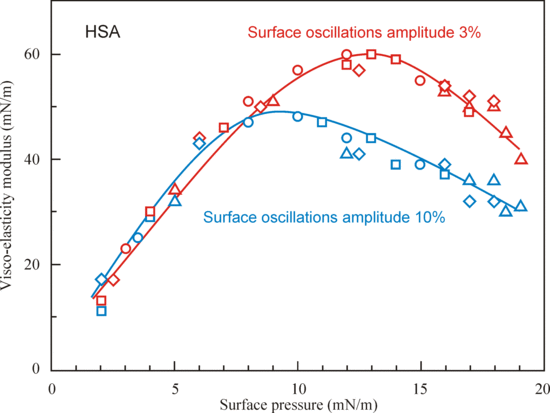
In Figure 1, Figure 2 and Figure 3 one can see the experimental dependencies of the visco-elasticity modulus on surface pressure for solutions of BCS, BLG, and HSA at concentrations below the critical point at amplitudes of the drop area oscillations of 3% and 10%. The pre-programmed four subsequent oscillations were performed at a fixed frequency of 0.1 Hz and at different adsorption times (200, 400, 2000, and 5000 s) after the generation of the respective protein solution drops. As it is seen, the visco-elasticity modulus depends on the amplitude for the globular proteins BLG and HSA (at surface pressures above 8 mN/m), whereas for the non-globular protein BCS there is practically no dependence on the amplitude. In this study, the ratio of the drop volume to its surface area V/S was approximately 0.58–0.61 mm and the same for all proteins and concentrations. Note, in [24] this ratio for BCS was different—of about 0.9 mm, and for BLG and HSА it was in the range between 0.58 and 0.63 mm. According to the model given by Equations (1)–(7), this decrease in the ratio V/S for BCS in the present study while all other parameters were fixed leads to a shift of the isotherm toward larger concentrations.
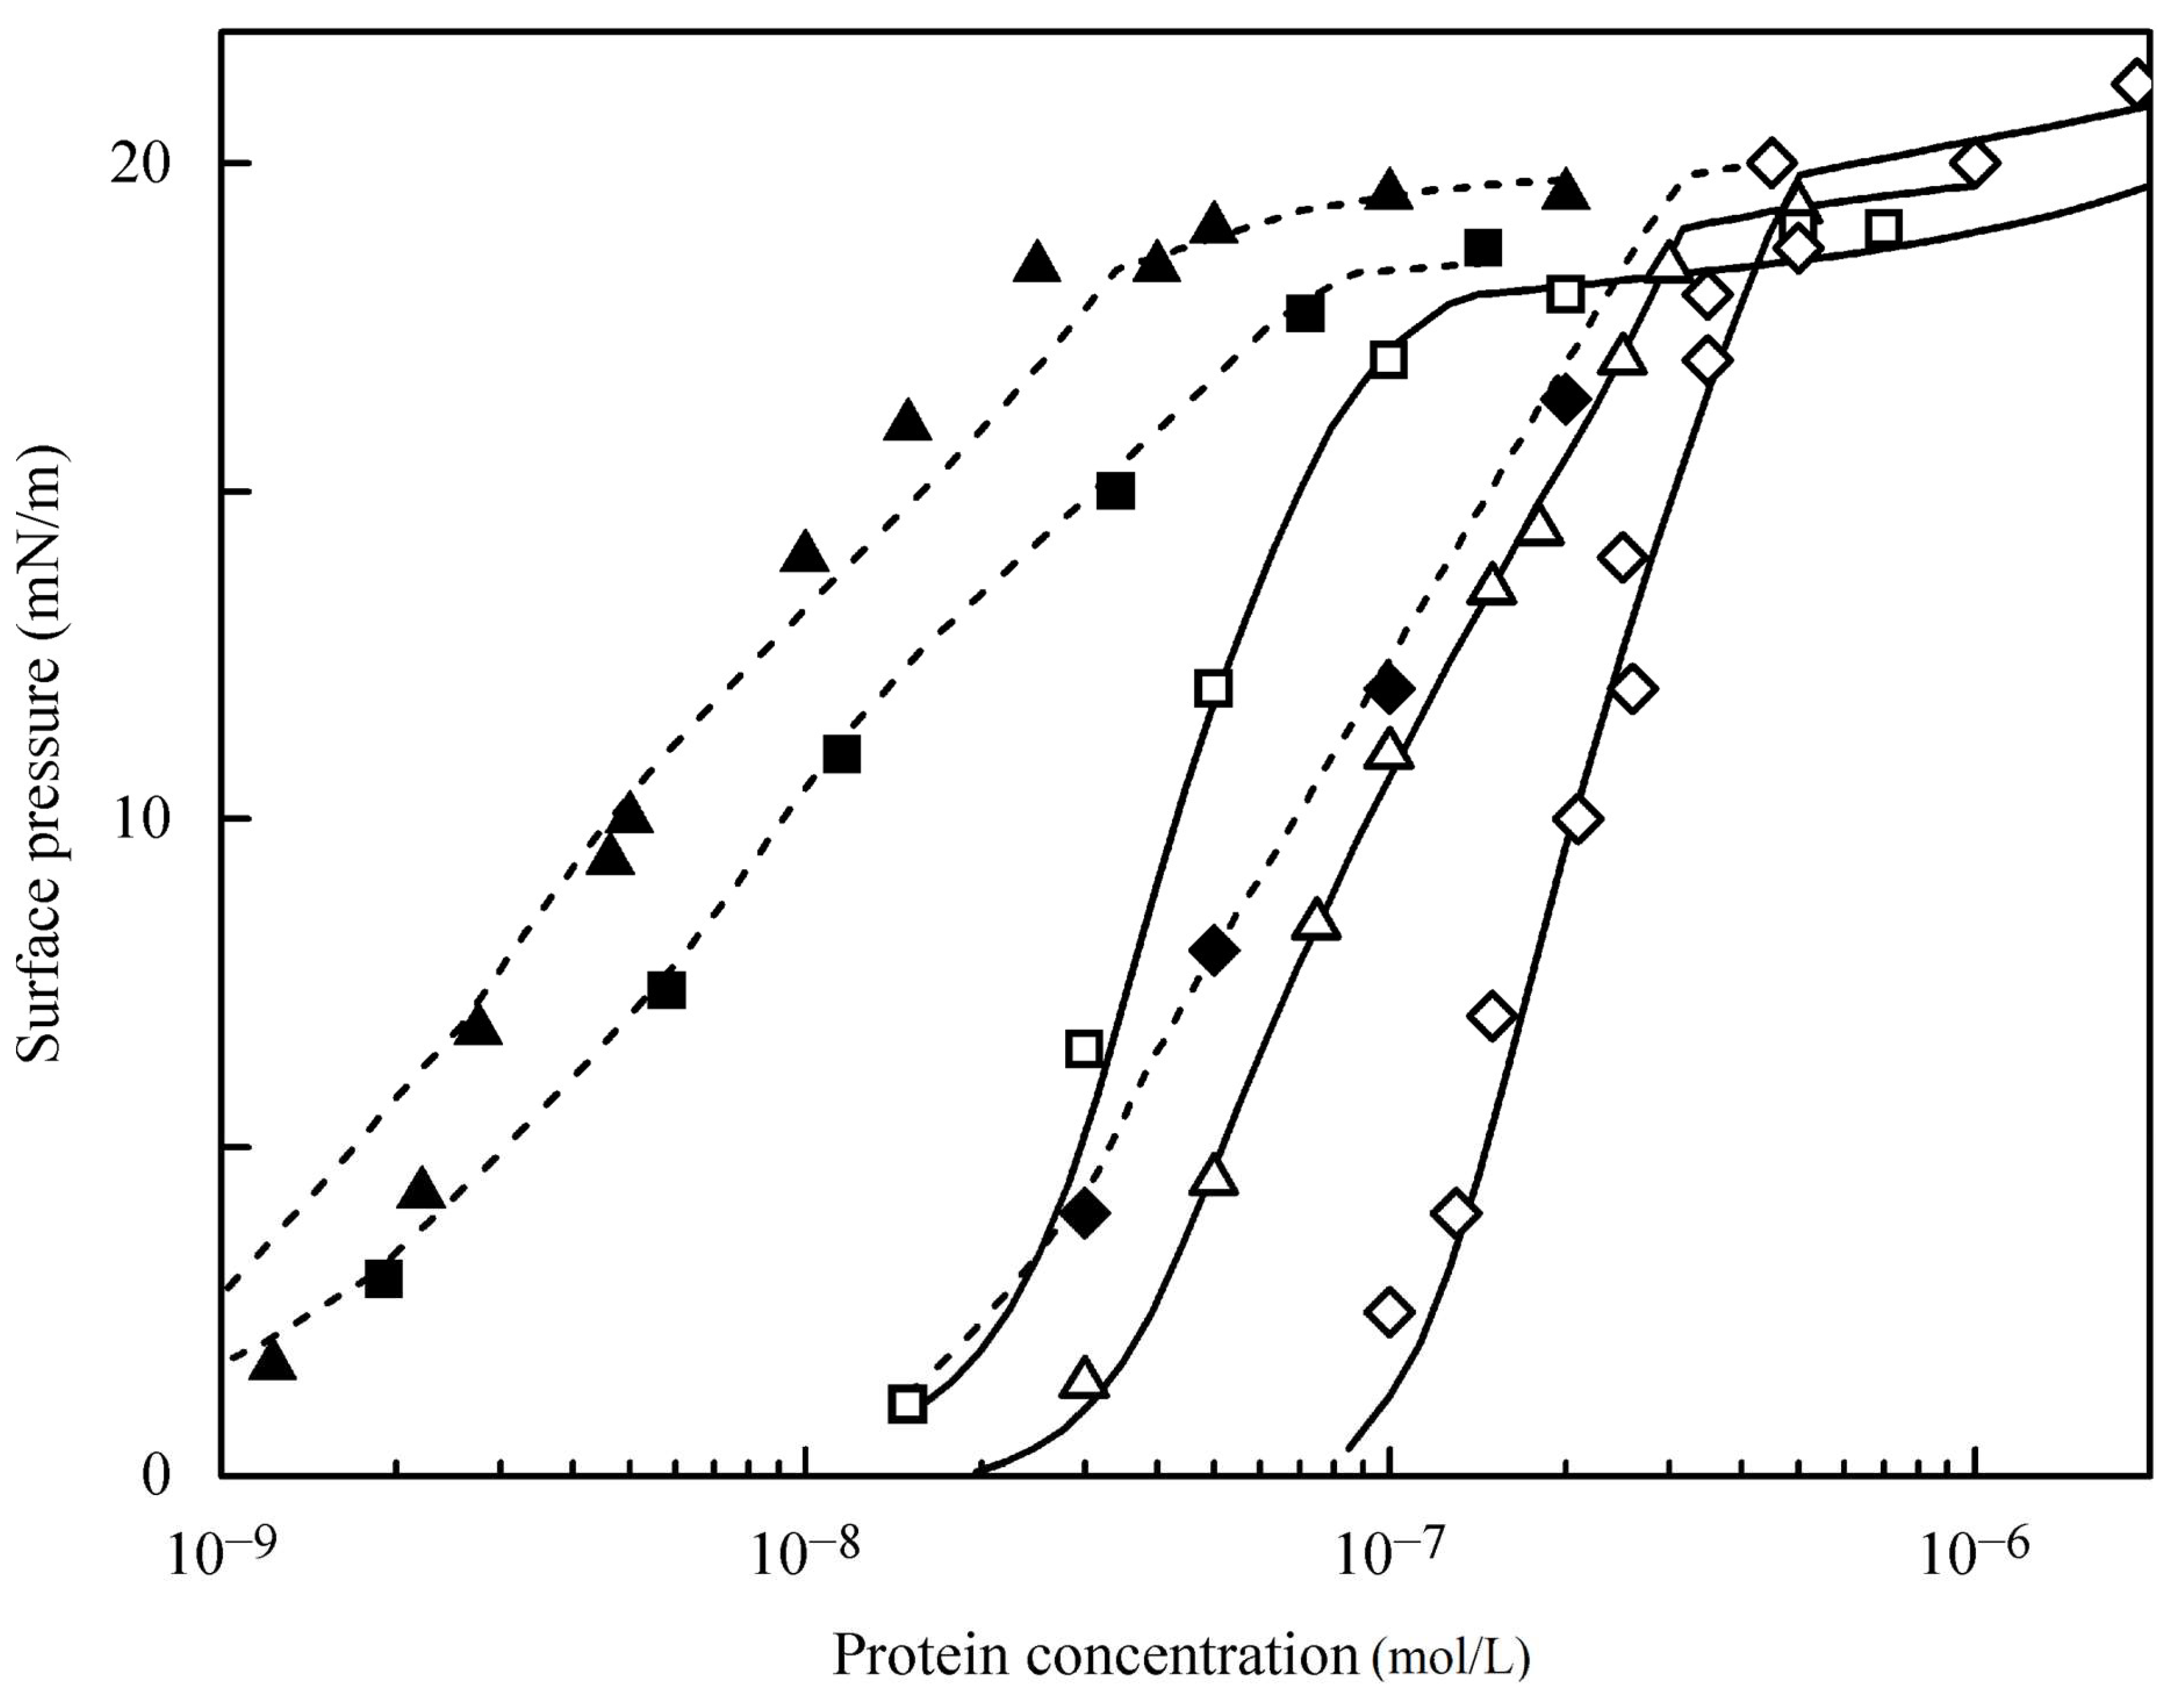
The experimental data obtained with PAT and the theoretical isotherms related to the initial (full lines) and the equilibrium (dashed lines) protein concentrations (BCS (△), HSA (☐), and BLG (◇)) are shown in Figure 4. The experimental data obtained with the bubble profile analysis tensiometry (black symbols) satisfactory agree with the data for the drop profile method calculated under equilibrium conditions. For BCS and HSA the data from [35] are used, while for BLG the data were obtained in the present study by using the buoyant bubble method. It should be noted that, in the buoyant bubble method, the surfactant depletion in the solution due to adsorption at the bubble surface can be neglected. The theoretical values of the equilibrium surface tension were obtained by fitting using a software based on the model Equations (1)–(7). The software also accounts for depletion due to adsorption. The model parameters are summarised in Table 1.
For the aim of comparison, Table 1 includes also the parameter values published in [24]. These parameters only slightly different from those obtained here for solutions of BLG and HSA because of the slightly different V/S ratios, however, the parameters for the BCS solutions are remarkably different. The parameters, which are different, are shown in bold. Note that, for the globular proteins, the values of the minimum and maximum molar area are different only by 2–3 times, whereas for BCS these areas are different by more than one order of magnitude.
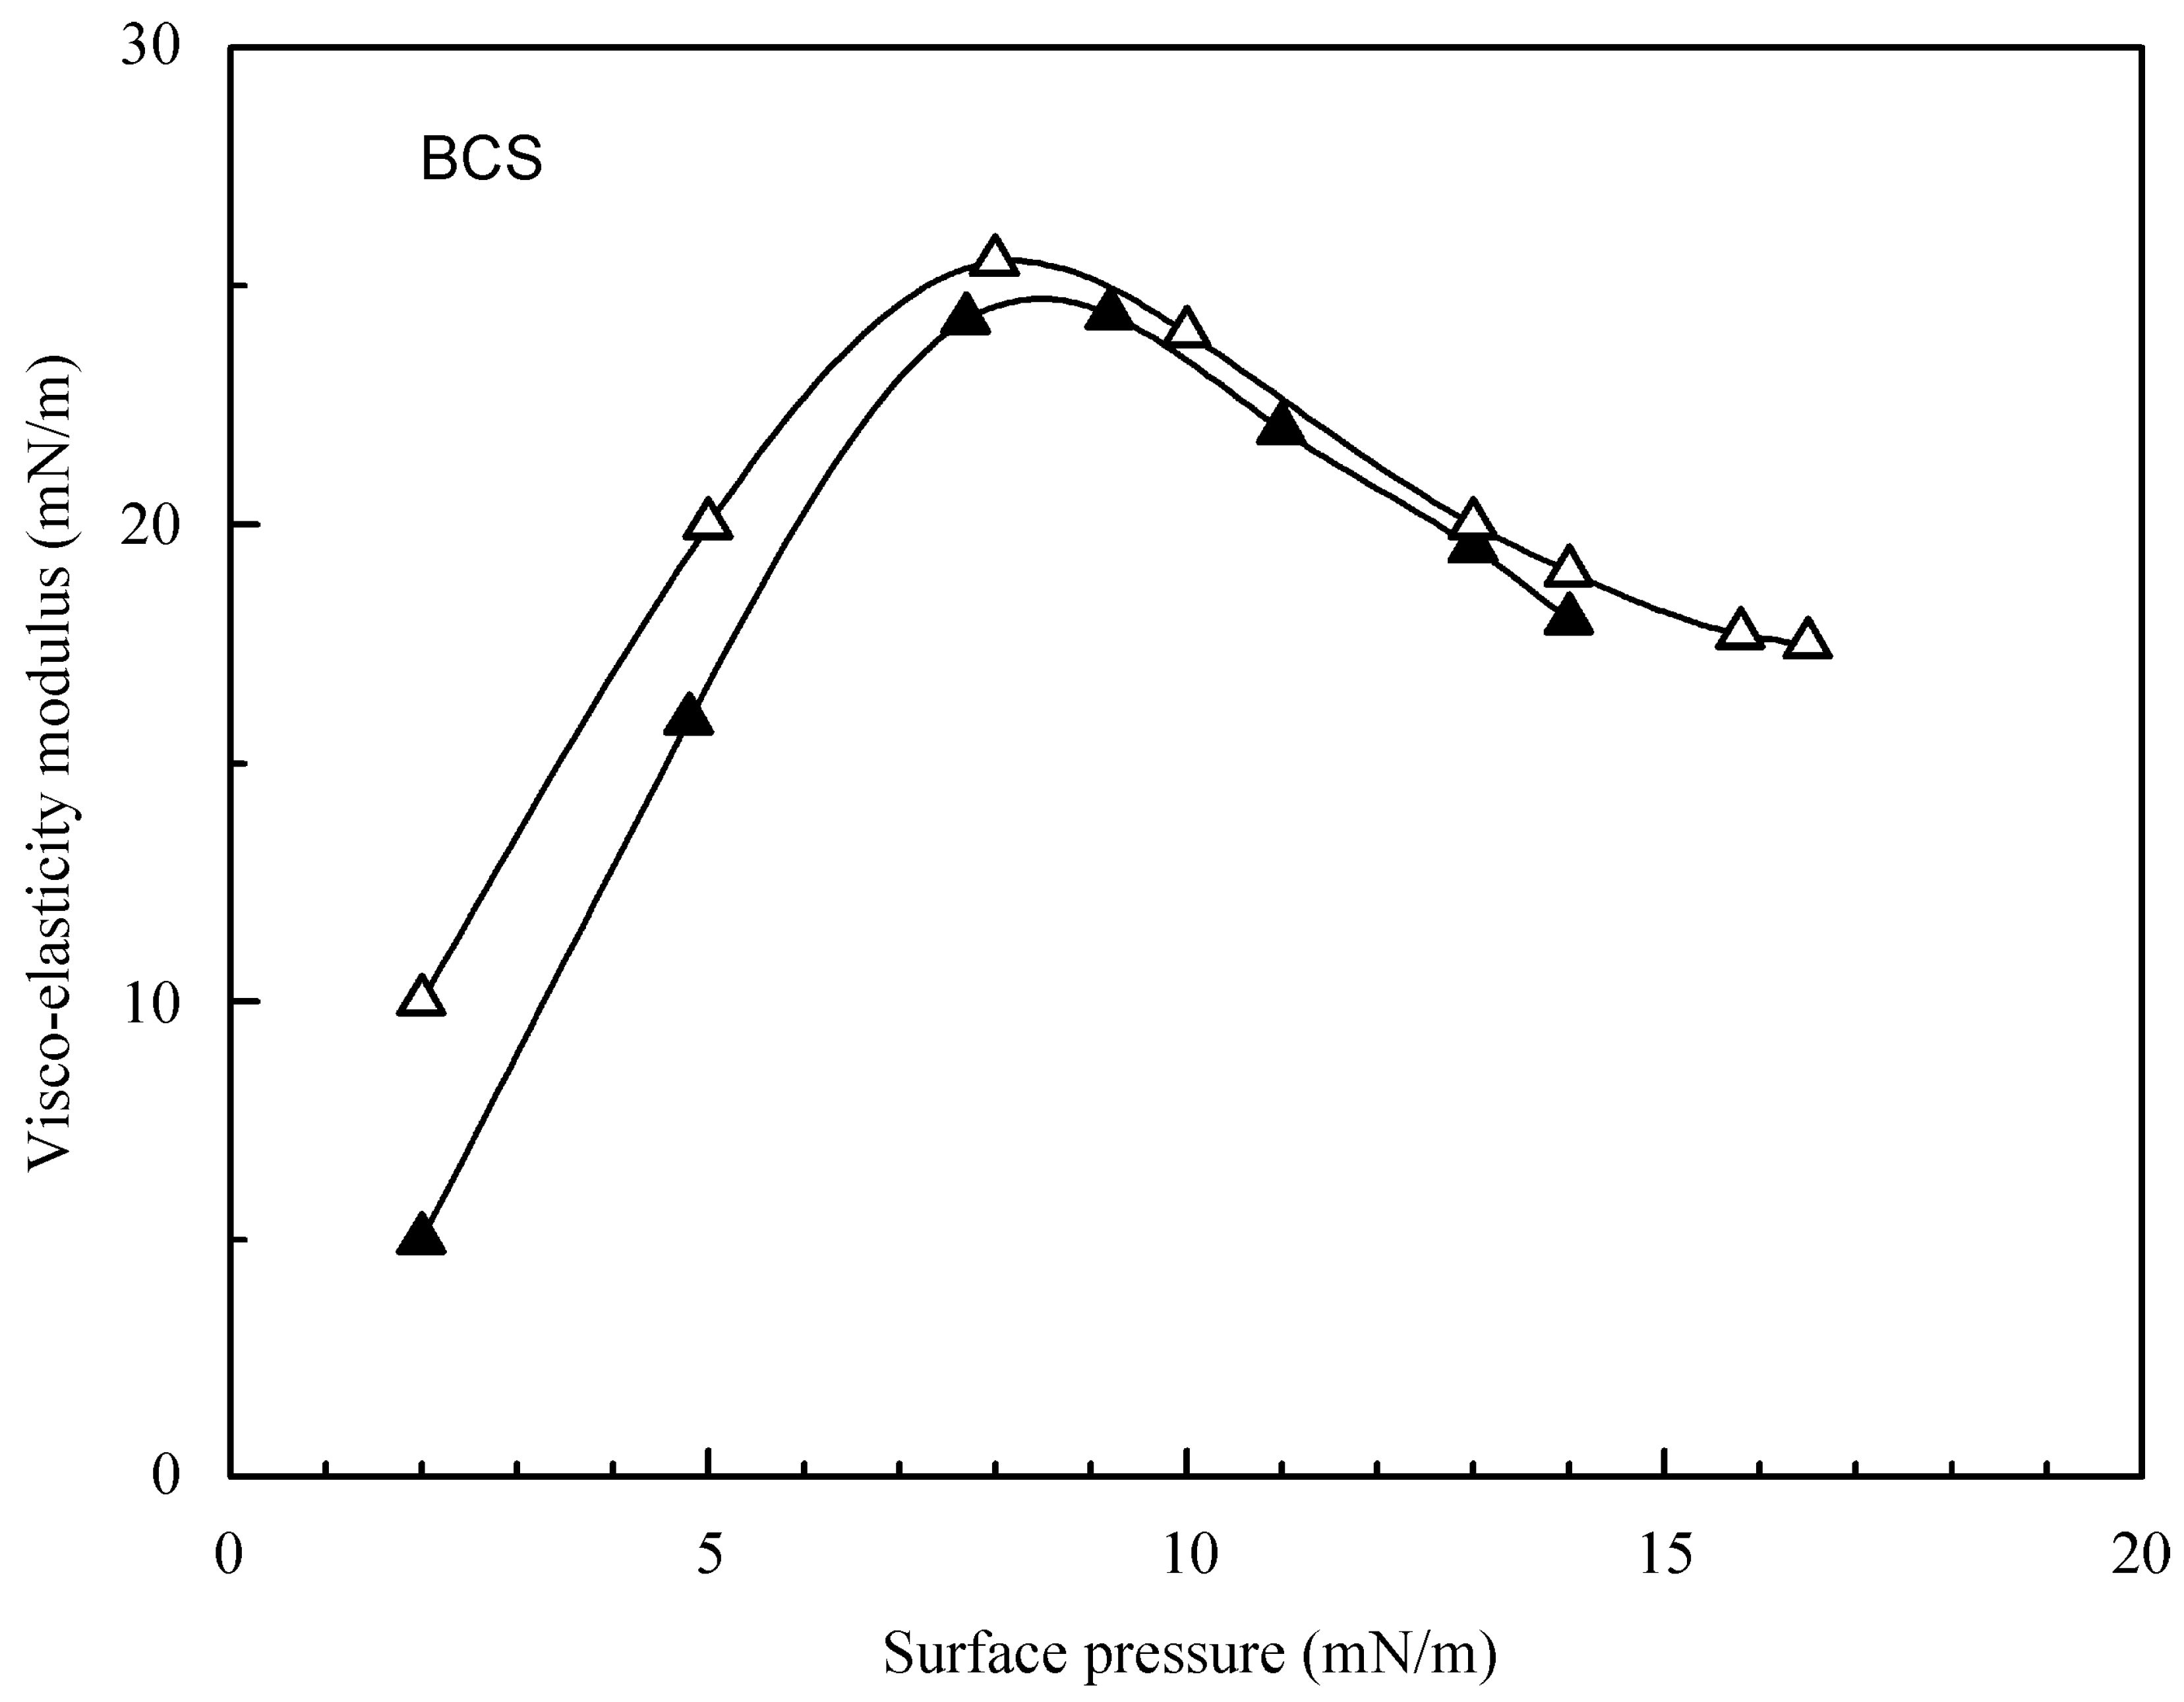
In Figure 5 the dependencies of the visco-elasticity modulus for BCS after 5000 s and at the amplitude of 10% from [24] (empty triangles) and this study (filled triangles) are shown. As it is seen, in spite of the large difference in V/S ratio for the pressures larger than 7 mN/m, the modules are almost the same.
In Figure 6, the dependencies of surface pressure versus adsorption are shown as calculated from the proposed model. As it is seen, the behavior of BCS is very different from the two globular proteins which show a sharp increase in the surface pressure in a narrow adsorption range. The results for BCS and HSA are supplemented by the results from [36,37]. The agreement is quite satisfactory.

4.2. Evaluation of the Effect of Oscillation Amplitude for the Studied Proteins

For the three studied proteins, by using the calculated surface pressure versus adsorption dependencies and Equation (16), we estimated the non-linearity corrections to the visco-elasticity modules, which are maximum around the minimum of the derivatives d3Π/dΓ3 (which are negative) at the corresponding Γ0 values. The obtained ΔE0 values for two relative amplitudes Γ ˜ / Γ 0 of 3% and 10% are shown in Table 2.
All the corrections shown in the last two columns are negative, i.e., the modules for the three studied proteins at the considered surface pressures should decrease with increasing oscillation amplitude. The numerical values of the corrections for the two amplitudes are quite reasonable. For the amplitude of 3% all corrections are less than 1 mN/m. Such small corrections are not significant, they are practically within the experimental error. For the amplitude of 10% the corrections for BLG and HSA are much larger than 1 mN/m, whereas for BCS it remains less than 1 mN/m. These results are in a good agreement with the experimental data shown in Figure 1, Figure 2 and Figure 3. For BCS the derivative d3Π/dΓ3 is larger than for BLG (absolute value), however the correction is smaller because the adsorption Γ0 for BCS is much smaller.
The derivative d3Π/dΓ3 is the largest for HSA, therefore, the correction is also the largest—almost 10 mN/m, even though the value of adsorption Γ0 is not very large. From the experimental data for HSA as shown in Figure 3, one can see that for a surface pressure of 17 mN/m the modulus obtained with an amplitude of 10% is smaller by about 10 mN/m than that at 3%, which is quite close to the estimation presented in Table 2.
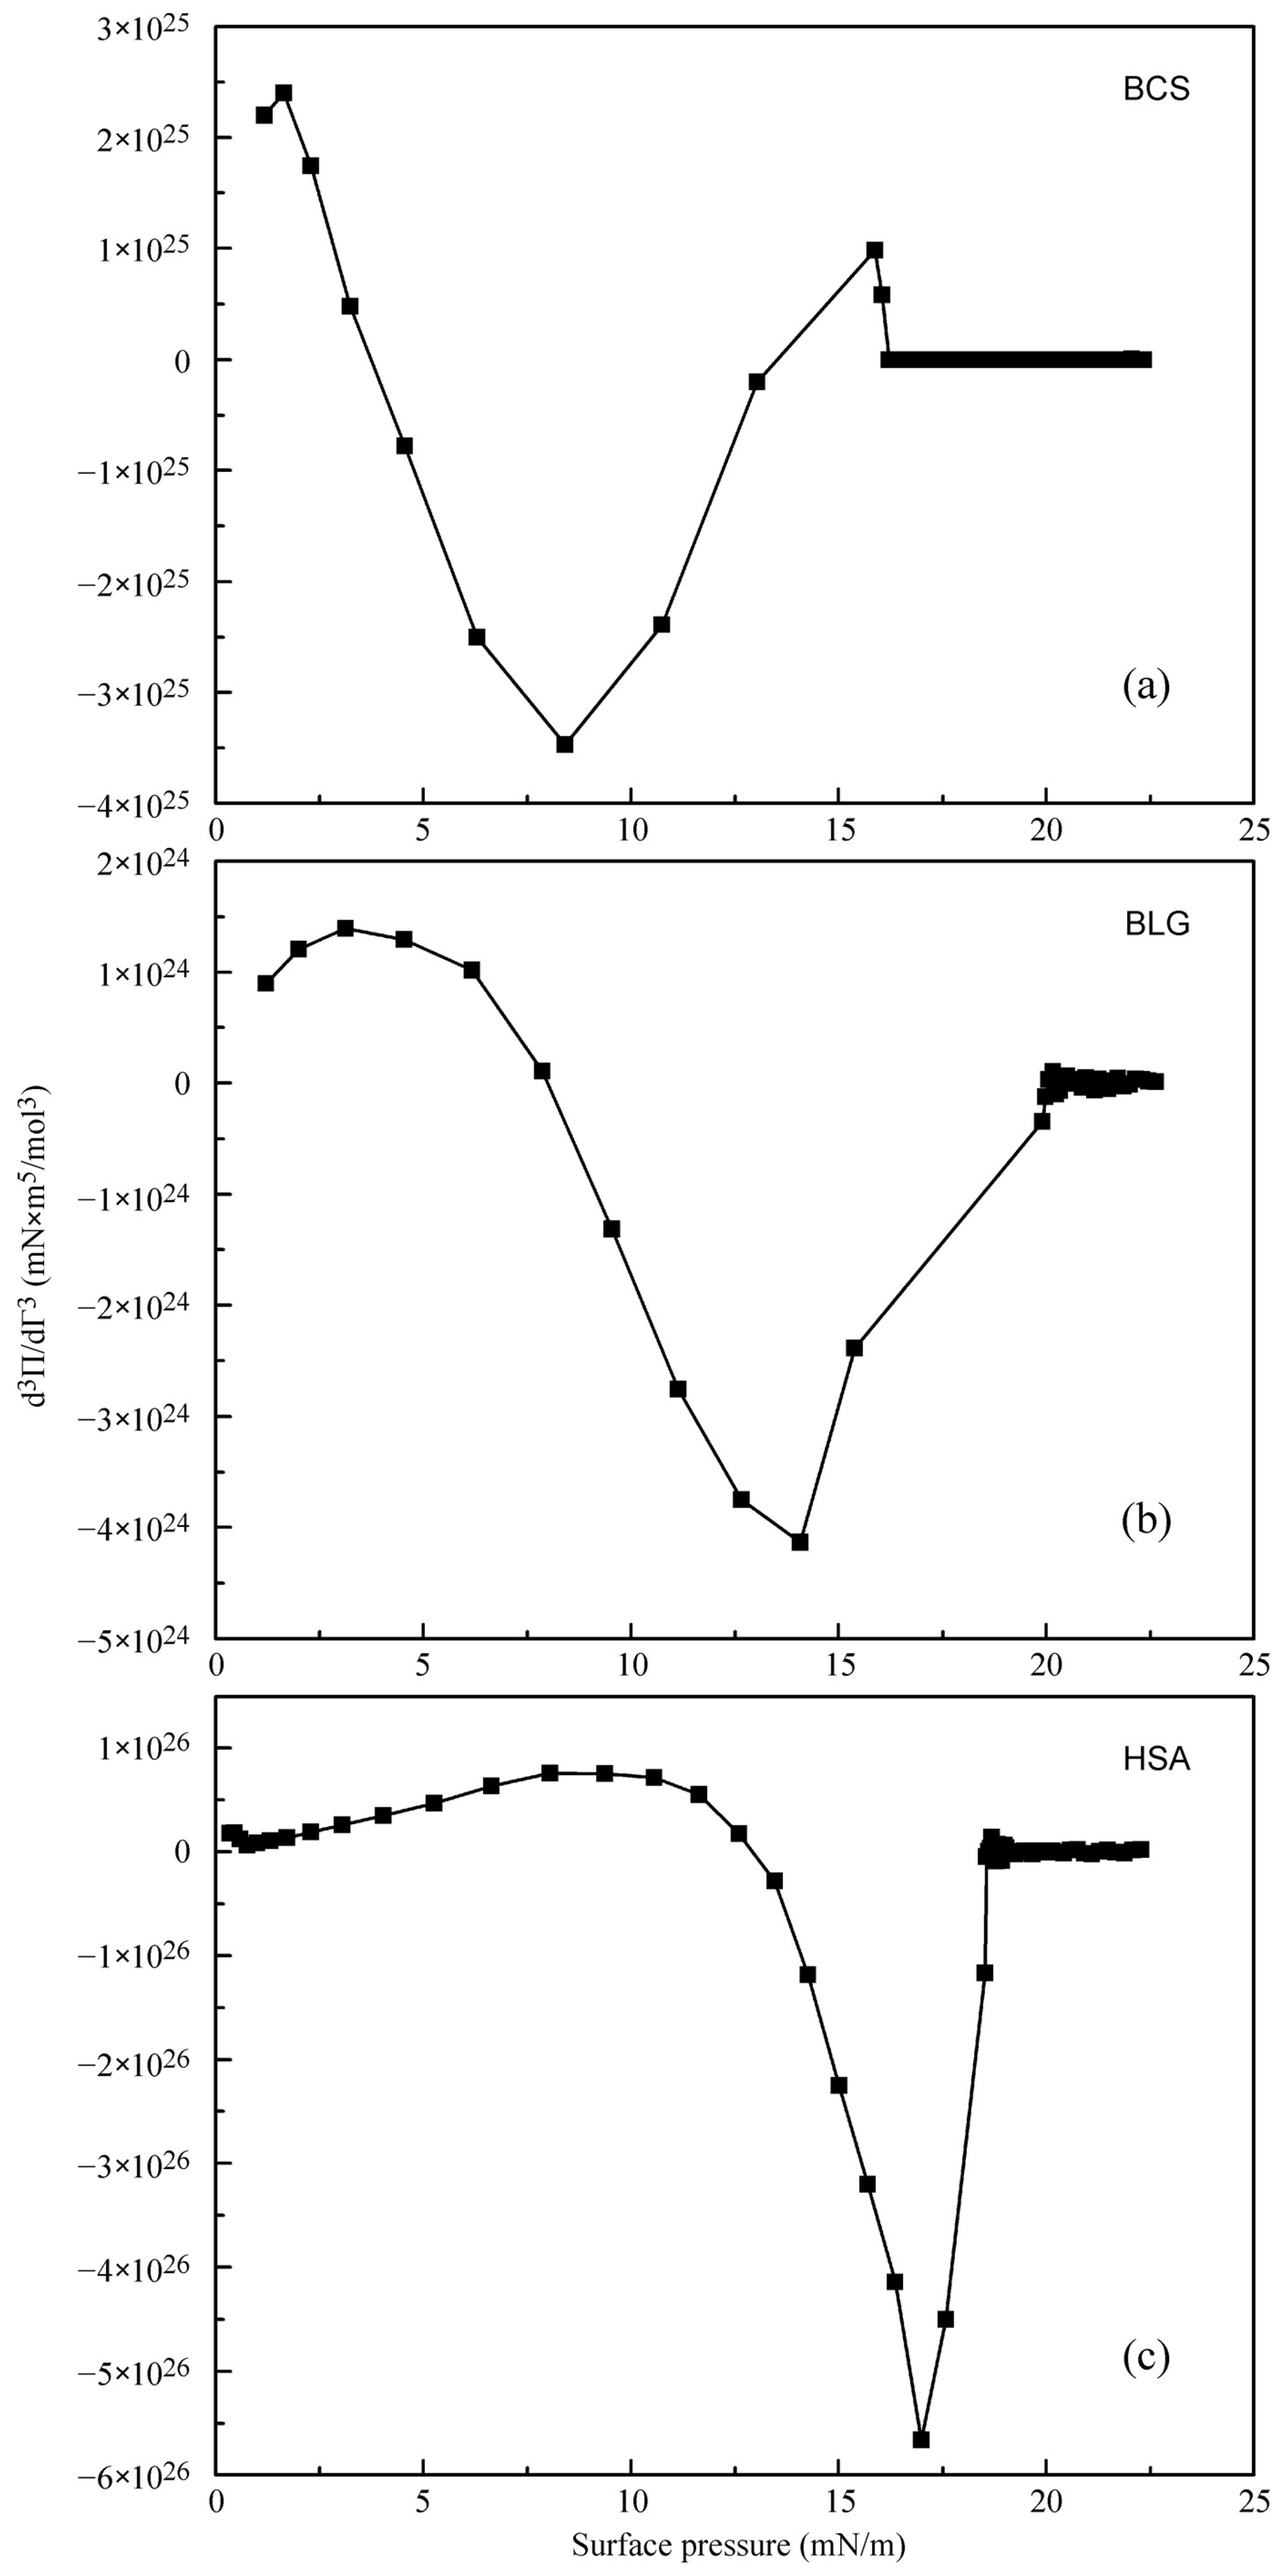
In Figure 7, the dependencies are shown for d3Π/dΓ3 = d2(E0/Γ)/dΓ2 as calculated for the three proteins from their surface pressure dependencies on adsorption Π(Γ). We can see that the derivatives d3Π/dΓ3 are negative only for intermediate surface pressure values. For small surface pressures the derivative d3Π/dΓ3 is positive which should lead to an increasing visco-elasticity modulus with increasing amplitude. However, these positive values are too small as compared to the large negative values at intermediate surface pressures. Therefore, for small surface pressures no dependency of the visco-elasticity modulus on the oscillation amplitude is observed experimentally.
For large surface pressures (Π > Π*) the dependencies Π(Γ) become almost linear (cf. Equation (7)), therefore, the values of d3Π/dΓ3 become very small. In this case the non-linearity of the equation of state should not be a cause for the dependence of the visco-elasticity modulus on the amplitude of the surface area oscillations. However, for Π > Π* in the adsorption layer additional relaxation processes can occur related to the aggregation of protein molecules or structure transformations within the multilayer film, the characteristic relaxation time of which can be comparable to the oscillation period. Such processes can also contribute to the dependence of the visco-elasticity modulus on the oscillation amplitude.
At intermediate surface pressures the derivatives d3Π/dΓ3 can acquire rather large negative values (Figure 7), which can cause a decrease of the visco-elasticity modulus with amplitude. According to the calculations, for BCS the dependence of the visco-elasticity modulus on amplitude should be negligible—the maximum difference of the modules for the amplitudes of 3% and 10% should be of about 0.36 mN/m (see Table 2). The experimental data for BCS (Figure 1) show that for the surface pressures between 6 mN/m and 11 mN/m a small difference of the modules can be recognized—on average the modulus for the amplitude 10% is about 1 mN/m lower than for 3%. Such small differences of the modules, which are of the order of the experimental error, are within the error of the calculation results. The surface pressures interval, where the modulus for BCS should decrease with increasing amplitude, is between 3 mN/m and 13 mN/m (Figure 7a). This expected surface pressures interval is close to the respective interval found in the experiments, which is between 6 mN/m and 11 mN/m (Figure 1). Accounting for the accuracy of the experiments, this is a good agreement.
From Figure 7b, one can see that for BLG the derivative d3Π/dΓ3 should be negative for the surface pressures between 7.5 mN/m and 20 mN/m. The experimental data in Figure 2 show that the reduced values of the visco-elasticity modulus for BLG at the amplitude of 10% are between 7 mN/m and 20 mN/m, which is very close to the numerical estimations. The maximum difference of the modules for BLG at the two amplitudes in Figure 2 is of about 6–7 mN/m. This is larger than the maximum correction value for BLG in Table 2, but nevertheless it is of the same order of magnitude. Thus, qualitatively, the expected behavior of the visco-elasticity modulus for BLG as a function of amplitude and surface pressure is also in good agreement with the experiments.
From the data shown in Figure 3, it can be seen that the reduced values of the visco-elasticity modulus for HSA at the amplitude of 10% are observed for surface pressures between 9 mN/m and 19 mN/m. According to the estimations made by using Equation (16) (Figure 7c), the surface pressure interval with negative values of the derivative d3Π/dΓ3 for HSA should be between 12 mN/m and 18 mN/m. This interval is slightly narrower than that in Figure 3 and the negative peak in Figure 7c is sharper, but qualitatively the correction for HSA is also similar to that observed in the experiments— the correction to the visco-elasticity modulus is significant and negative at intermediate surface pressures, and the order of magnitude of the maximum correction value is close to the experimental results.

5. Conclusions

The experimental data and numerical estimations presented above show that for the three proteins studied here at the fixed frequencies of 0.1 Hz the most probable reason for the dependence of the visco-elasticity modulus on the applied oscillation amplitude is the non-linearity of the equation of state for the interfacial layer. Qualitatively, the behavior of the three studied proteins is similar, but the magnitudes of the corrections to the visco-elasticity modulus are very different and the surface pressure intervals with negative correction values do not coincide. For HSA, the correction value is the largest, for BCS the correction is almost negligible and for BLG it takes intermediate values. Such a behavior of the amplitude corrections for the studied proteins agrees (at least qualitatively) with the calculated effect of the non-linear terms based on the available data of their equations of state.
In the analysis presented above only the data for the surface pressures below the critical point were used. At the surface pressures larger than the critical value, the adsorbed protein molecules can be involved in aggregation processes and/or form several adsorption layers. Under these conditions, additional relaxation processes are possible, which can be related to changes in the structure of the adsorption layers and changes in size or structure of the aggregates. These processes cannot be accounted for in the analysis presented here, therefore, surface pressures larger than the critical one cannot be considered here. For small surface pressures (below 6–8 mN/m), the calculations predict a negligible effect of the oscillation amplitude on the visco-elasticity modulus which is confirmed by the experiments.
The analysis proposed here assumes the absence of relaxation processes with characteristic times comparable to the oscillation period. A very slow relaxation due to changes of the conformation of the protein molecules with characteristic times of 200 s and more is not very important for the pre-critical surface pressures (Π < Π*) because the oscillation period in the experiments was only 10 s.
For the pre-critical surface pressure interval, the diffusional relaxation could be more significant. However, for proteins this is also a very slow process. For ordinary surfactants the proposed analysis is not completely suitable, because the diffusional relaxation is much more significant. Only for sufficiently large oscillation frequencies does the diffusional exchange of the molecules between the interface and the bulk solution becomes small. However, such large frequencies are not available in experiments with the PAT instruments. From this point of view, proteins are the most suitable systems for the analysis as it is shown here.

Author Contributions

Conceptualization, V.B.F. and R.M.; Methodology, V.I.K., V.B.F., and R.M.; Software, E.V.A.; Investigation, D.V.T. and A.V.M.; Writing—original draft preparation, V.B.F., V.I.K., and R.M.; Writing—review and editing, R.M. and E.V.A.

Funding

This research was funded by the ESA MAP “Soft Matter Dynamics”, and by the ICCCW NASU project III-6-16:20.

Conflicts of Interest

The authors declare no conflict of interest.

Appendix A

If in the considered frequency range the diffusional relaxation (e.g., at sufficiently large oscillation frequencies or at low solubility) and other relaxation processes are absent, then the variation of the surface pressure can be obtained from the equation of state Π(Γ) of the adsorption layer. We will consider harmonic oscillations of adsorption
Γ = Γ 0 + Γ ˜ sin ( ω ˜ t ) = Γ 0 + Δ Γ ,
where Γ0 is the equilibrium value of adsorption, Γ ˜ is the amplitude of the adsorption oscillations, ω ˜ is the angular frequency, and Δ Γ = Γ ˜ sin ( ω ˜ t ) . For such oscillations of adsorption for the surface pressure we obtain from Equation (10)
Π ( Γ 0 + Δ Γ ) = Π ( Γ 0 ) + d Π d Γ Δ Γ + 1 2 d 2 Π d Γ 2 ( Δ Γ ) 2 + 1 6 d 3 Π d Γ 3 ( Δ Γ ) 3 + ,
or
Π ( Γ 0 + Δ Γ ) = Π ( Γ 0 ) + d Π d Γ Γ ˜ sin ( ω ˜ t ) + 1 2 d 2 Π d Γ 2 Γ ˜ 2 sin 2 ( ω ˜ t ) + 1 6 d 3 Π d Γ 3 Γ ˜ 3 sin 3 ( ω ˜ t ) + ,
Similarly, for ln(Γ) we can write
ln ( Γ 0 + Δ Γ ) = ln ( Γ 0 ) + Δ Γ Γ 0 1 2 ( Δ Γ Γ 0 ) 2 + 1 3 ( Δ Γ Γ 0 ) 3 + ,
or
ln ( Γ 0 + Δ Γ ) = ln ( Γ 0 ) + Γ ˜ Γ 0 sin ( ω ˜ t ) 1 2 ( Γ ˜ Γ 0 ) 2 sin 2 ( ω ˜ t ) + 1 3 ( Γ ˜ Γ 0 ) 3 sin 3 ( ω ˜ t ) + ,
The trigonometry provides
sin 2 ( ω ˜ t ) = 1 2 cos ( 2 ω ˜ t ) + 1 2 ,
sin 3 ( ω ˜ t ) = 1 4 sin ( 3 ω ˜ t ) + 3 4 sin ( ω ˜ t ) ,
and analogously for the higher power exponents sin n ( ω ˜ t ) . All even power exponents contribute only to the amplitudes of even harmonics ( 2 ω ˜ ,   4 ω ˜ ,   ) and do not contribute to the amplitudes of the first (main) harmonic ( ω ˜ ). All odd power exponents contribute only to the amplitudes of odd harmonics ( ω ˜ ,   3 ω ˜ ,   ) including the first (main) harmonic ( ω ˜ ).
For the calculations of the viscoelasticity modulus E0 from the whole spectrum of oscillations we need only the amplitude of the first (main) harmonic. The other harmonics can be used for calculating the THD. Applying the Fourier transform to Equations (A2) and (A3) we obtain the amplitudes of the first (main) harmonics for the surface pressure A Π , 1 = d Π d Γ Γ ˜ + 1 8 d 3 Π d Γ 3 Γ ˜ 3 + , and for the logarithm of adsorption A ln Γ , 1 = Γ ˜ Γ 0 + 1 4 ( Γ ˜ Γ 0 ) 3 + . Then for the apparent viscoelasticity modulus we will have
E 0 = d Π d Γ Γ ˜ + 1 8 d 3 Π d Γ 3 Γ ˜ 3 + Γ ˜ Γ 0 + 1 4 ( Γ ˜ Γ 0 ) 3 + Γ 0 d Π d Γ + Γ 0 8 d 3 Π d Γ 3 Γ ˜ 2 Γ 0 4 d Π d Γ ( Γ ˜ Γ 0 ) 2 + ,

References

  1. Cascao-Pereira, L.G.; Theodoly, O.; Blanch, H.W.; Radke, C.J. Dilatational rheology of BSA conformers at the air/water interface. Langmuir 2003, 19, 2349–2356. [Google Scholar] [CrossRef]
  2. Freer, E.M.; Yim, K.S.; Fuller, G.G.; Radke, C.J. Shear and dilatational relaxation mechanisms of globular and flexible proteins at the hexadecane/water interface. Langmuir 2004, 20, 10159–10167. [Google Scholar] [CrossRef] [PubMed]
  3. Freer, E.M.; Yim, K.S.; Fuller, G.G.; Radke, C.J. Interfacial rheology of globular and flexible proteins at the hexadecane/water interface: Comparison of shear and dilatation deformation. J. Phys. Chem. B 2004, 108, 3835–3844. [Google Scholar] [CrossRef]
  4. Benjamins, J.; Lyklema, J.; Lucassen-Reynders, E.H. Compression/expansion rheology of oil/water interfaces with adsorbed proteins. Comparison with the air/water surface. Langmuir 2006, 22, 6181–6188. [Google Scholar] [CrossRef] [PubMed]
  5. Georgieva, D.; Cagna, A.; Langevin, D. Link between surface elasticity and foam stability. Soft Matter 2009, 5, 2063–2071. [Google Scholar] [CrossRef]
  6. Lucassen-Reynders, E.H.; Benjamins, J.; Fainerman, V.B. Dilational rheology of protein films adsorbed at fluid interfaces. Curr. Opin. Colloid Interface Sci. 2010, 15, 264–270. [Google Scholar] [CrossRef]
  7. Wüstneck, R.; Fainerman, V.B.; Aksenenko, E.V.; Kotsmar, C.; Pradines, V.; Krägel, J.; Miller, R. Surface dilatational behavior of β-casein at the solution/air interface at different pH values. Colloids Surf. A 2012, 404, 17–24. [Google Scholar] [CrossRef]
  8. Rühs, P.; Scheuble, N.; Windhab, E.; Fischer, P. Protein adsorption and interfacial rheology interfering in dilatational experiment. Eur. Phys. J. Spec. Top. 2013, 222, 47–60. [Google Scholar] [CrossRef]
  9. Dan, A.; Wüstneck, R.; Krägel, J.; Aksenenko, E.V.; Fainerman, V.B.; Miller, R. Interfacial adsorption and rheological behavior of β-casein at the water/hexane interface at different pH. Food Hydrocoll. 2014, 34, 193–201. [Google Scholar] [CrossRef]
  10. Noskov, B.A. Protein conformational transitions at the liquid–gas interface as studied by dilational surface rheology. Adv. Colloid Interface Sci. 2014, 206, 222–238. [Google Scholar] [CrossRef] [PubMed]
  11. Noskov, B.A. Dilational surface rheology of polymer and polymer/surfactant solutions. Curr. Opin. Colloid Interface Sci. 2010, 15, 229–236. [Google Scholar] [CrossRef]
  12. Hilles, H.; Monroy, F.; Bonales, L.J.; Ortega, F.; Rubio, R.G. Fourier-transform rheology of polymer Langmuir monolayers: Analysis of the non-linear and plastic behaviors. Adv. Colloid Interface Sci. 2006, 122, 67–77. [Google Scholar] [CrossRef] [PubMed]
  13. Erni, P.; Parker, A. Nonlinear viscoelasticity and shear localization at complex fluid interfaces. Langmuir 2012, 28, 7757–7767. [Google Scholar] [CrossRef] [PubMed]
  14. Fainerman, V.B.; Lucassen-Reynders, E.H.; Miller, R. Description of the adsorption behaviour of proteins at water/fluid interfaces in the framework of a two-dimensional solution model. Adv. Colloid Interface Sci. 2003, 106, 237–259. [Google Scholar] [CrossRef]
  15. Fainerman, V.B.; Aksenenko, E.V.; Krägel, J.; Miller, R. Thermodynamics, interfacial pressure isotherms and dilational rheology of mixed protein-surfactant adsorption layers. Adv. Colloid Interface Sci. 2016, 233, 200–222. [Google Scholar] [CrossRef] [PubMed]
  16. Ulaganathan, V.; Retzlaff, I.; Won, J.Y.; Gochev, G.; Gunes, D.Z.; Gehin-Delval, C.; Leser, M.; Noskov, B.A.; Miller, R. β-Lactoglobulin adsorption layers at the water/air surface: 2. Dilational rheology: Effect of pH and ionic strength. Colloids Surf. A 2017, 521, 167–176. [Google Scholar] [CrossRef]
  17. Noskov, B.A.; Loglio, G.; Miller, R. Dilational surface visco-elasticity of polyelectrolyte/surfactant solutions: Formation of heterogeneous adsorption layers. Adv. Colloid Interface Sci. 2011, 168, 179–197. [Google Scholar] [CrossRef] [PubMed]
  18. Bykov, A.G.; Liggieri, L.; Noskov, B.A.; Pandolfini, P.; Ravera, F.; Loglio, G. Surface dilational rheological properties in the nonlinear domain. Adv. Colloid Interface Sci. 2015, 222, 110–118. [Google Scholar] [CrossRef] [PubMed]
  19. Sagis, L.M.C. Rheology of interfaces stabilized by a 2D suspension of anisotropic particles: A classical irreversible thermodynamics theory. Soft Matter 2011, 7, 7727–7736. [Google Scholar] [CrossRef]
  20. Wan, Z.; Yang, X.; Sagis, L.M.C. Nonlinear Surface Dilatational Rheology and Foaming Behavior of Protein and Protein Fibrillar Aggregates in the Presence of Natural Surfactant. Langmuir 2016, 32, 3679–3690. [Google Scholar] [CrossRef] [PubMed]
  21. Sagis, L.M. Dynamic properties of interfaces in soft matter: Experiments and theory. Rev. Mod. Phys. 2011, 83, 1367–1404. [Google Scholar] [CrossRef]
  22. Sagis, L.M.; Scholten, E. Complex interfaces in food: Structure and mechanical properties. Trends Food Sci. Technol. 2014, 37, 59–71. [Google Scholar] [CrossRef]
  23. van Kempen, S.E.; Schols, H.A.; van der Linden, E.; Sagis, L.M. Non-linear surface dilatational rheology as a tool for understanding microstructures of air/water interfaces stabilized by oligofructose fatty acid esters. Soft Matter 2013, 9, 9579–9592. [Google Scholar] [CrossRef] [PubMed]
  24. Fainerman, V.B.; Kovalchuk, V.I.; Aksenenko, E.V.; Zinkovych, I.I.; Makievski, A.V.; Nikolenko, M.V.; Miller, R. Dilational viscoelasticity of proteins solutions in dynamic conditions. Langmuir 2018, 34, 6678–6686. [Google Scholar] [CrossRef] [PubMed]
  25. Kairaliyeva, T.; Aksenenko, E.V.; Mucic, N.; Makievski, A.V.; Fainerman, V.B.; Miller, R. Surface tension and adsorption studies by drop profile analysis tensiometry. J. Surfactants Deterg. 2017, 20, 1225–1241. [Google Scholar] [CrossRef] [PubMed]
  26. Zholob, S.A.; Makievski, A.V.; Miller, R.; Fainerman, V.B. Optimisation of calculation methods for determination of surface tensions by drop profile analysis tensiometry. Adv. Colloid Interface Sci. 2007, 134-135, 322–329. [Google Scholar] [CrossRef] [PubMed]
  27. Joos, P. Dynamic Surface Phenomena; VSP: Utrecht, The Netherlands, 1999; ISBN 90-6764-300-9. [Google Scholar]
  28. Fainerman, V.B.; Lylyk, S.V.; Aksenenko, E.V.; Makievski, A.V.; Ravera, F.; Petkov, J.T.; Yorke, J.; Miller, R. Adsorption layer characteristics of Tritons surfactants. 3. Dilational visco-elasticity. Colloids Surf. A 2009, 334, 16–21. [Google Scholar] [CrossRef]
  29. Lucassen, J. Dynamic dilational properties of composite surfaces. Colloids Surf. 1992, 65, 139–149. [Google Scholar] [CrossRef]
  30. Leser, M.E.; Acquistapace, S.; Cagna, A.; Makievski, A.V.; Miller, R. Limits of oscillation frequencies in drop and bubble shape tensiometry. Colloids Surf. A 2005, 261, 25–28. [Google Scholar] [CrossRef]
  31. Fainerman, V.B.; Miller, R.; Kovalchuk, V.I. Influence of the compressibility of adsorbed layers on the surface dilational elasticity. Langmuir 2002, 18, 7748–7752. [Google Scholar] [CrossRef]
  32. Fainerman, V.B.; Miller, R.; Kovalchuk, V.I. Influence of the two-dimensional compressibility on the surface pressure isotherm and dilational elasticity of dodecyldimethylphosphine oxide. J. Phys. Chem. B 2003, 107, 6119–6121. [Google Scholar] [CrossRef]
  33. Kovalchuk, V.I.; Loglio, G.; Fainerman, V.B.; Miller, R. Interpretation of surface dilational elasticity data based on an intrinsic two-dimensional interfacial compressibility model. J. Colloid Interface Sci. 2004, 270, 475–482. [Google Scholar] [CrossRef] [PubMed]
  34. Fainerman, V.B.; Kovalchuk, V.I.; Aksenenko, E.V.; Michel, M.; Leser, M.E.; Miller, R. Models of two-dimensional solution assuming the internal compressibility of adsorbed molecules: A comparative analysis. J. Phys. Chem. B 2004, 108, 13700–13705. [Google Scholar] [CrossRef]
  35. Fainerman, V.B.; Lylyk, S.V.; Makievski, A.V.; Miller, R. Interfacial tensiometry as a novel methodology for the determination of surfactant adsorption at a liquid surface. J. Colloid Interface Sci. 2004, 275, 305–308. [Google Scholar] [CrossRef] [PubMed]
  36. Graham, D.E.; Phillips, M.C. Proteins at liquid interfaces II: Adsorption isotherms. J. Colloid Interface Sci. 1979, 70, 415–426. [Google Scholar] [CrossRef]
  37. Graham, D.E.; Phillips, M.C. Proteins at liquid interfaces III: Molecular structure of adsorbed films. J. Colloid Interface Sci. 1979, 70, 427–439. [Google Scholar] [CrossRef]
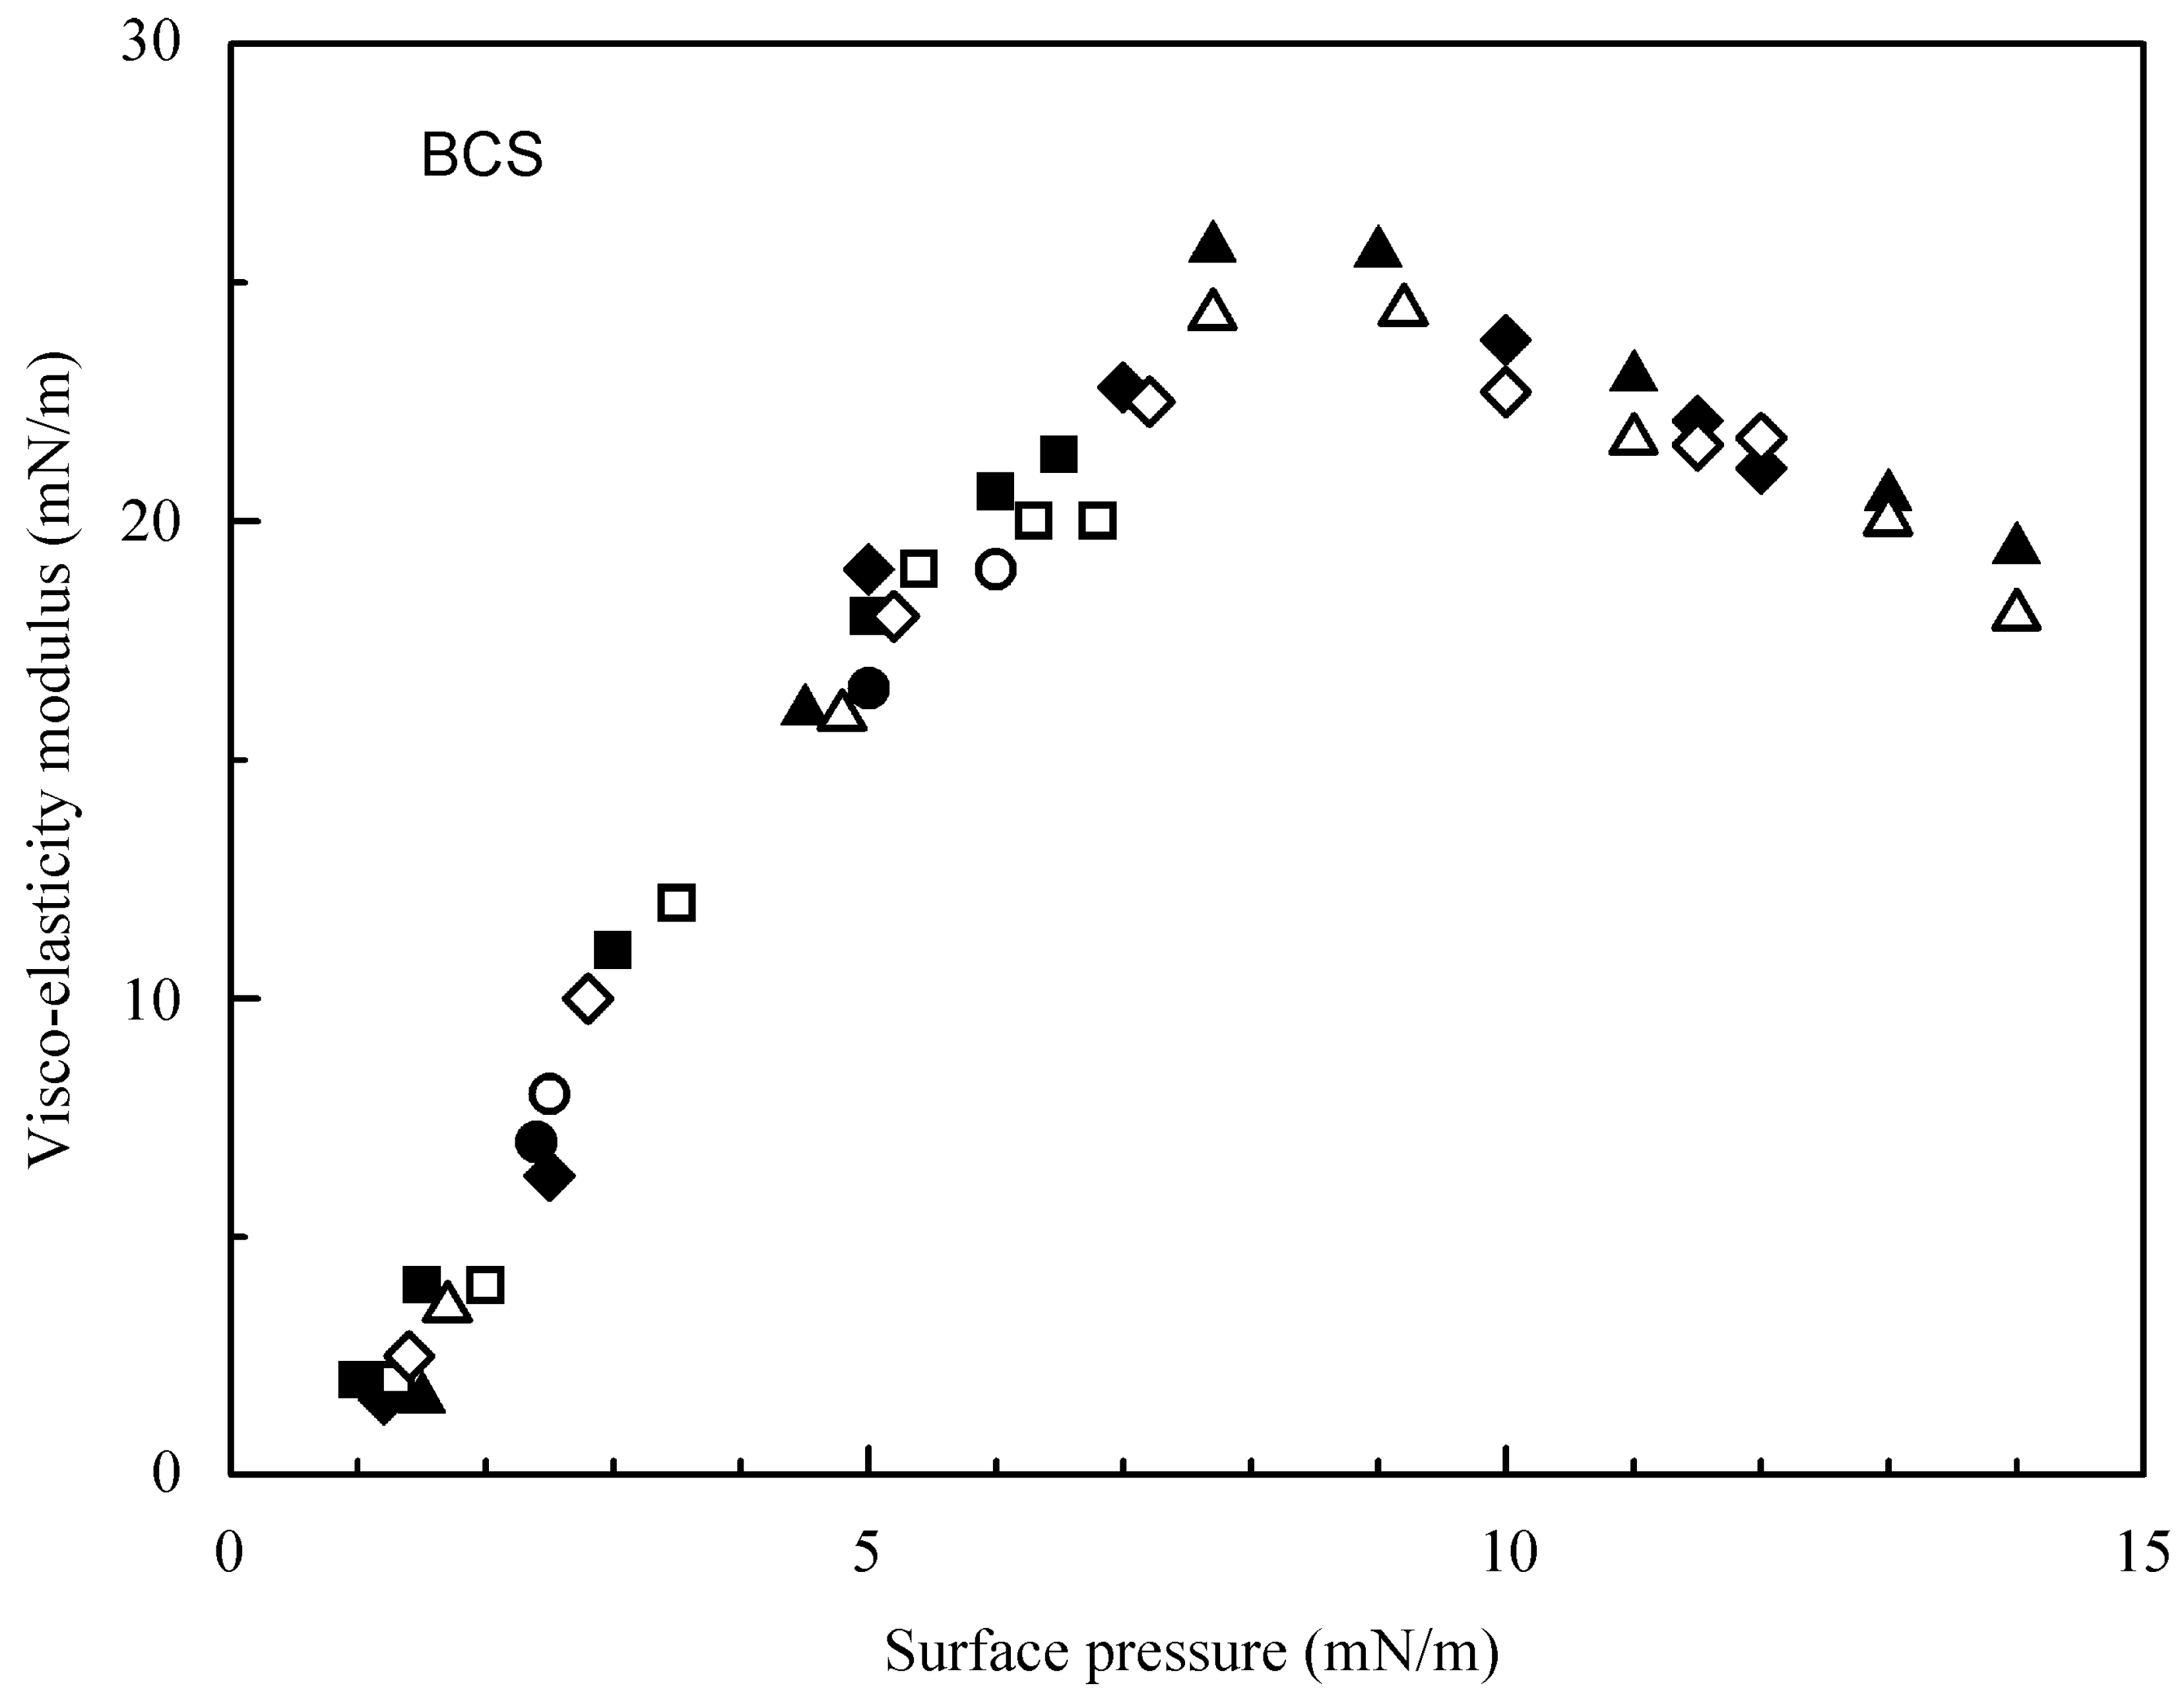
Figure 1. Visco-elasticity modulus of BCS solutions as a function of surface pressure at different adsorption times: ○, 200 s; ☐, 400 s; ◇, 2000 s; △, 5000 s, for the oscillation amplitude 10%. Black points—the results for the amplitude 3%.
Colloids 02 00057 g001
Figure 2. The same as in Figure 1 but for BLG solutions.
Colloids 02 00057 g002
Figure 3. The same as in Figure 1 but for HSA solutions.
Colloids 02 00057 g003
Figure 4. Experimental surface pressure isotherms for the solutions of HSA (☐), BCS (△), and BLG (◇) obtained by the drop profile method with respect to the initial concentration c0. The solid lines are the isotherms calculated with respect to c0 by using the parameters from the Table 1. ■ and ▲ are data from [35] for HSA and BCS solutions, respectively, obtained by the bubble profile method; ◆ are the data for BLG solutions obtained in the present study by the bubble profile method. The dashed lines are the isotherms calculated with respect to the equilibrium concentration c.
Colloids 02 00057 g004
Figure 5. Dependencies of the visco-elasticity modulus of BCS solutions on surface pressure at the adsorption times 5000 s, the frequency 0.1 Hz and the amplitude 10% (△, the data from [24], ▲, the data obtained in the present study).
Colloids 02 00057 g005
Figure 6. Dependencies of the surface pressure on adsorption for the three studied proteins. The experimental dependencies for HSA (☐) and BCS (△) are obtained in [36,37].
Colloids 02 00057 g006
Figure 7. Dependencies of d3Π/dΓ3 on surface pressure Π calculated from their Π(Γ) dependencies for BCS (a), BLG (b), and HAS (c).
Colloids 02 00057 g007
Table 1. Parameters of Equations (1)–(7) for proteins adsorbed at the solution/air surface
ParametersBLGBLG [24]BCSBCS [24]HSAHSA [24]
α0.750.750.450.280.00.0
a2.12.10.551.90.00.0
ω0 (105 m2/mol)3.13.12.83.03.63.5
ωmin (106 m2/mol)6.06.04.54.03536
ωmax (107 m2/mol)1.51.56.56.57.87.5
na34101033
Π* (mN/m)202118.516.518.518.4
b1 (103 m3/mol)0.570.683.53.03737
bX (m3/mol)16161515 9595
L222222
Table 2. Values of the derivatives d3Π/dΓ3 in the minimum and the corresponding corrections to the visco-elasticity modulus ΔE0
ProteinΠ (mN/m)Γ0 (10–8 mol/m2)d3Π/dΓ3 (1024 mN⋅m5/mol3)ΔE0(mN/m)
Γ ˜ / Γ 0 =   3 % Γ ˜ / Γ 0 =   10 %
HSA17.02.3−566−0.77−8.61
BLG14.19.1−4.13−0.35−3.89
BLS8.42.1−34.7−0.036−0.40