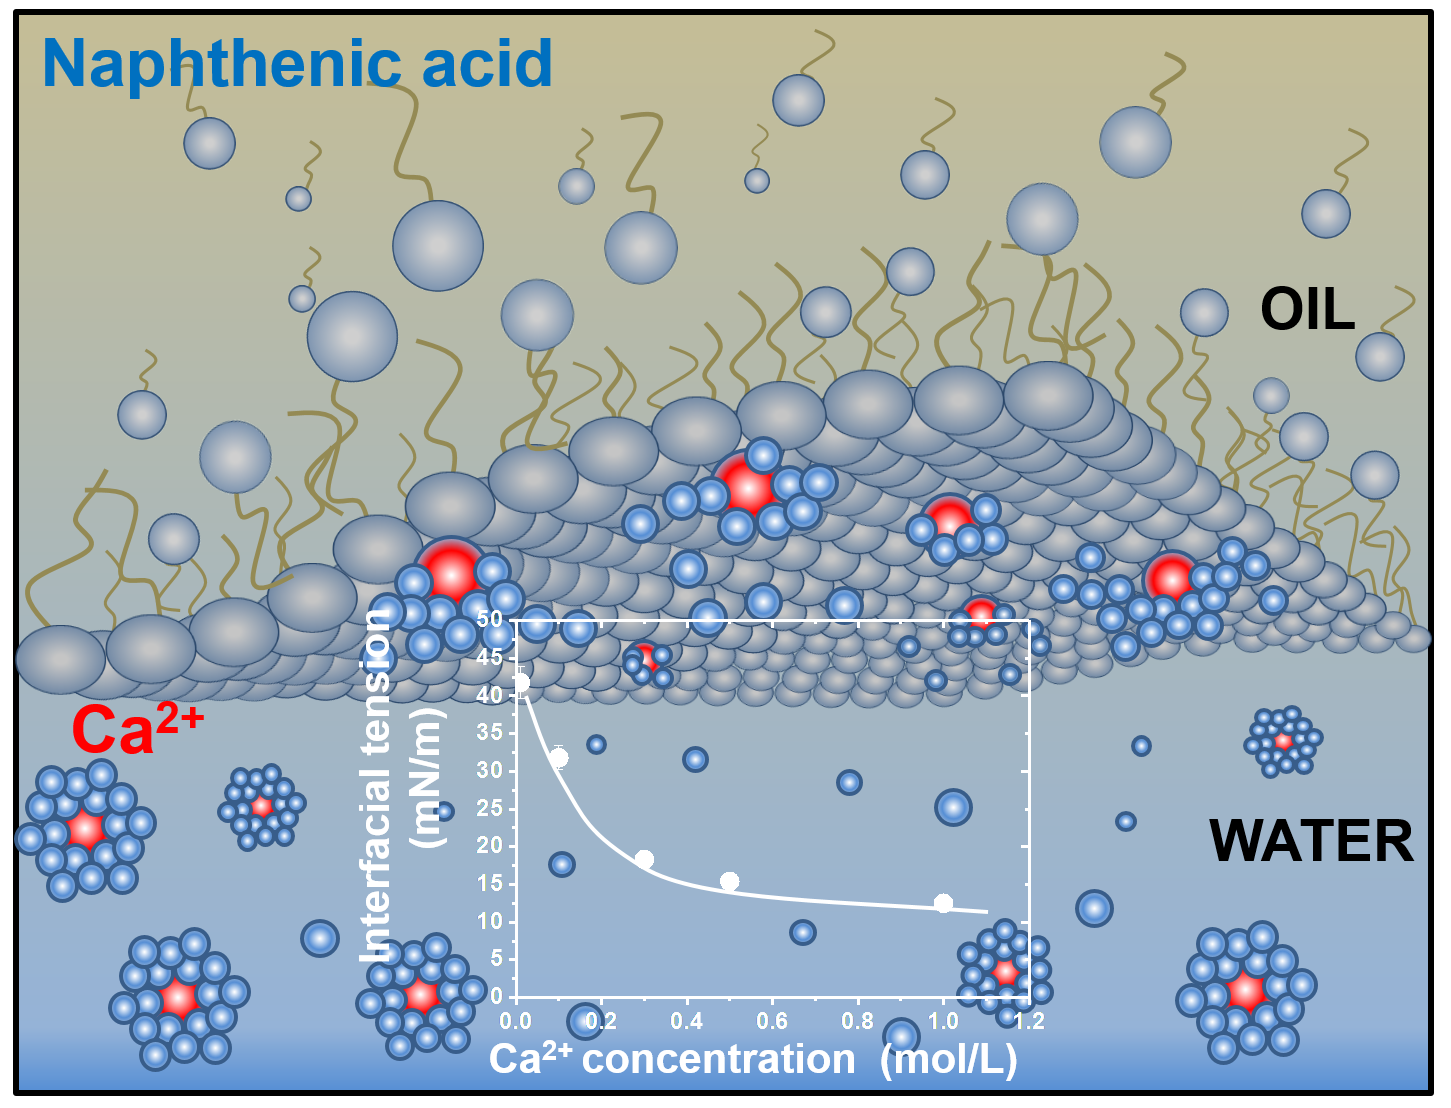
Metal Ion Interactions with Crude Oil Components: Specificity of Ca2+ Binding to Naphthenic Acid at an Oil/Water Interface


Abstract

1. Introduction
2. Experimental
2.1. Materials
2.2. Methods
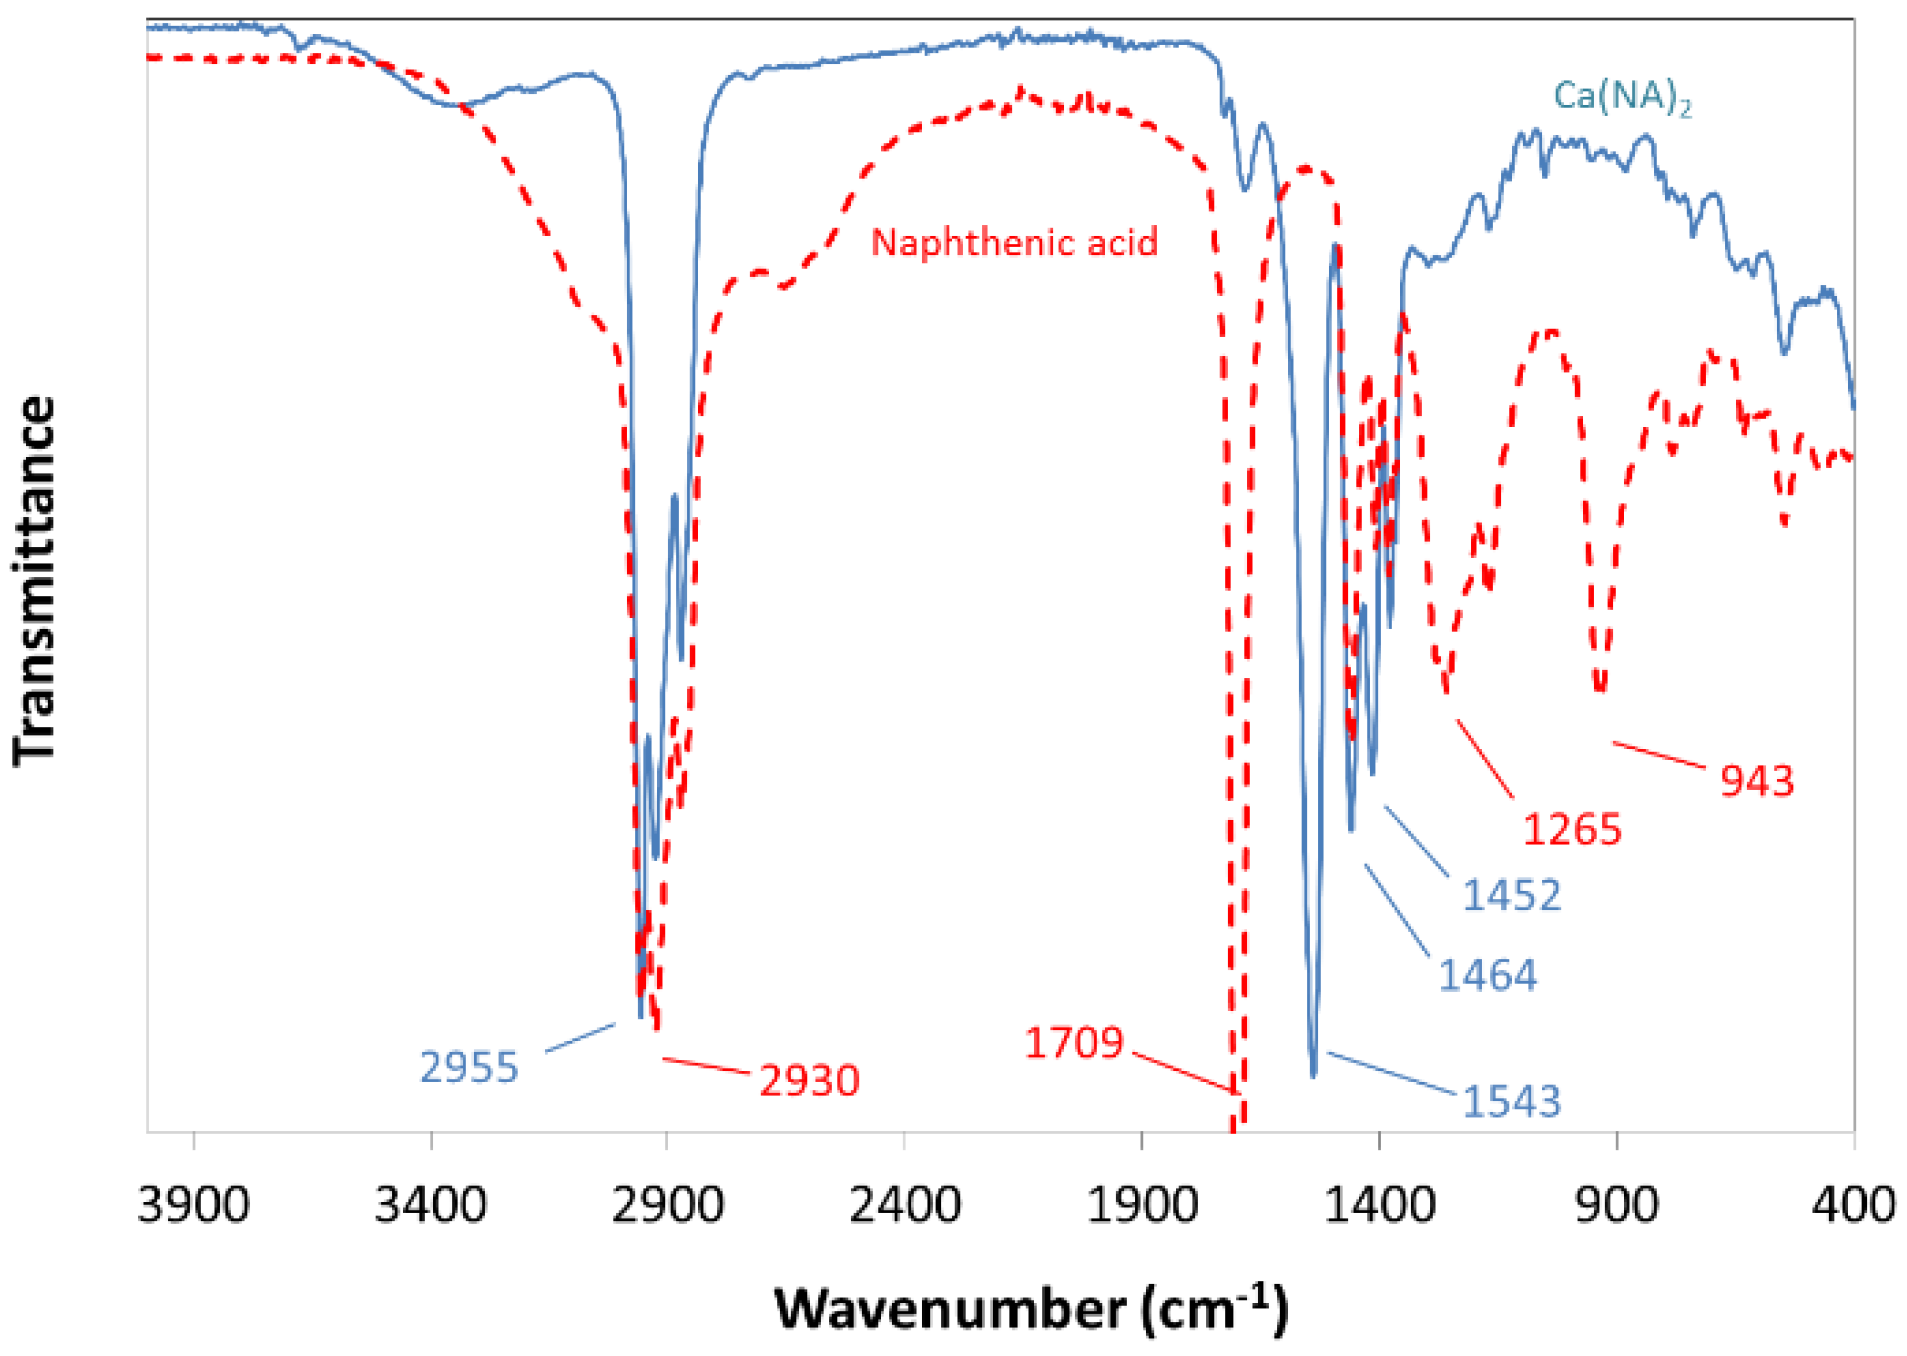
2.2.1. Synthesis of Calcium Naphthenate
2.2.2. Dynamic Interfacial Tension Measurements
13.58(r/V01/3)6 + 2.593(r/V01/3)7
3. Results and Discussion
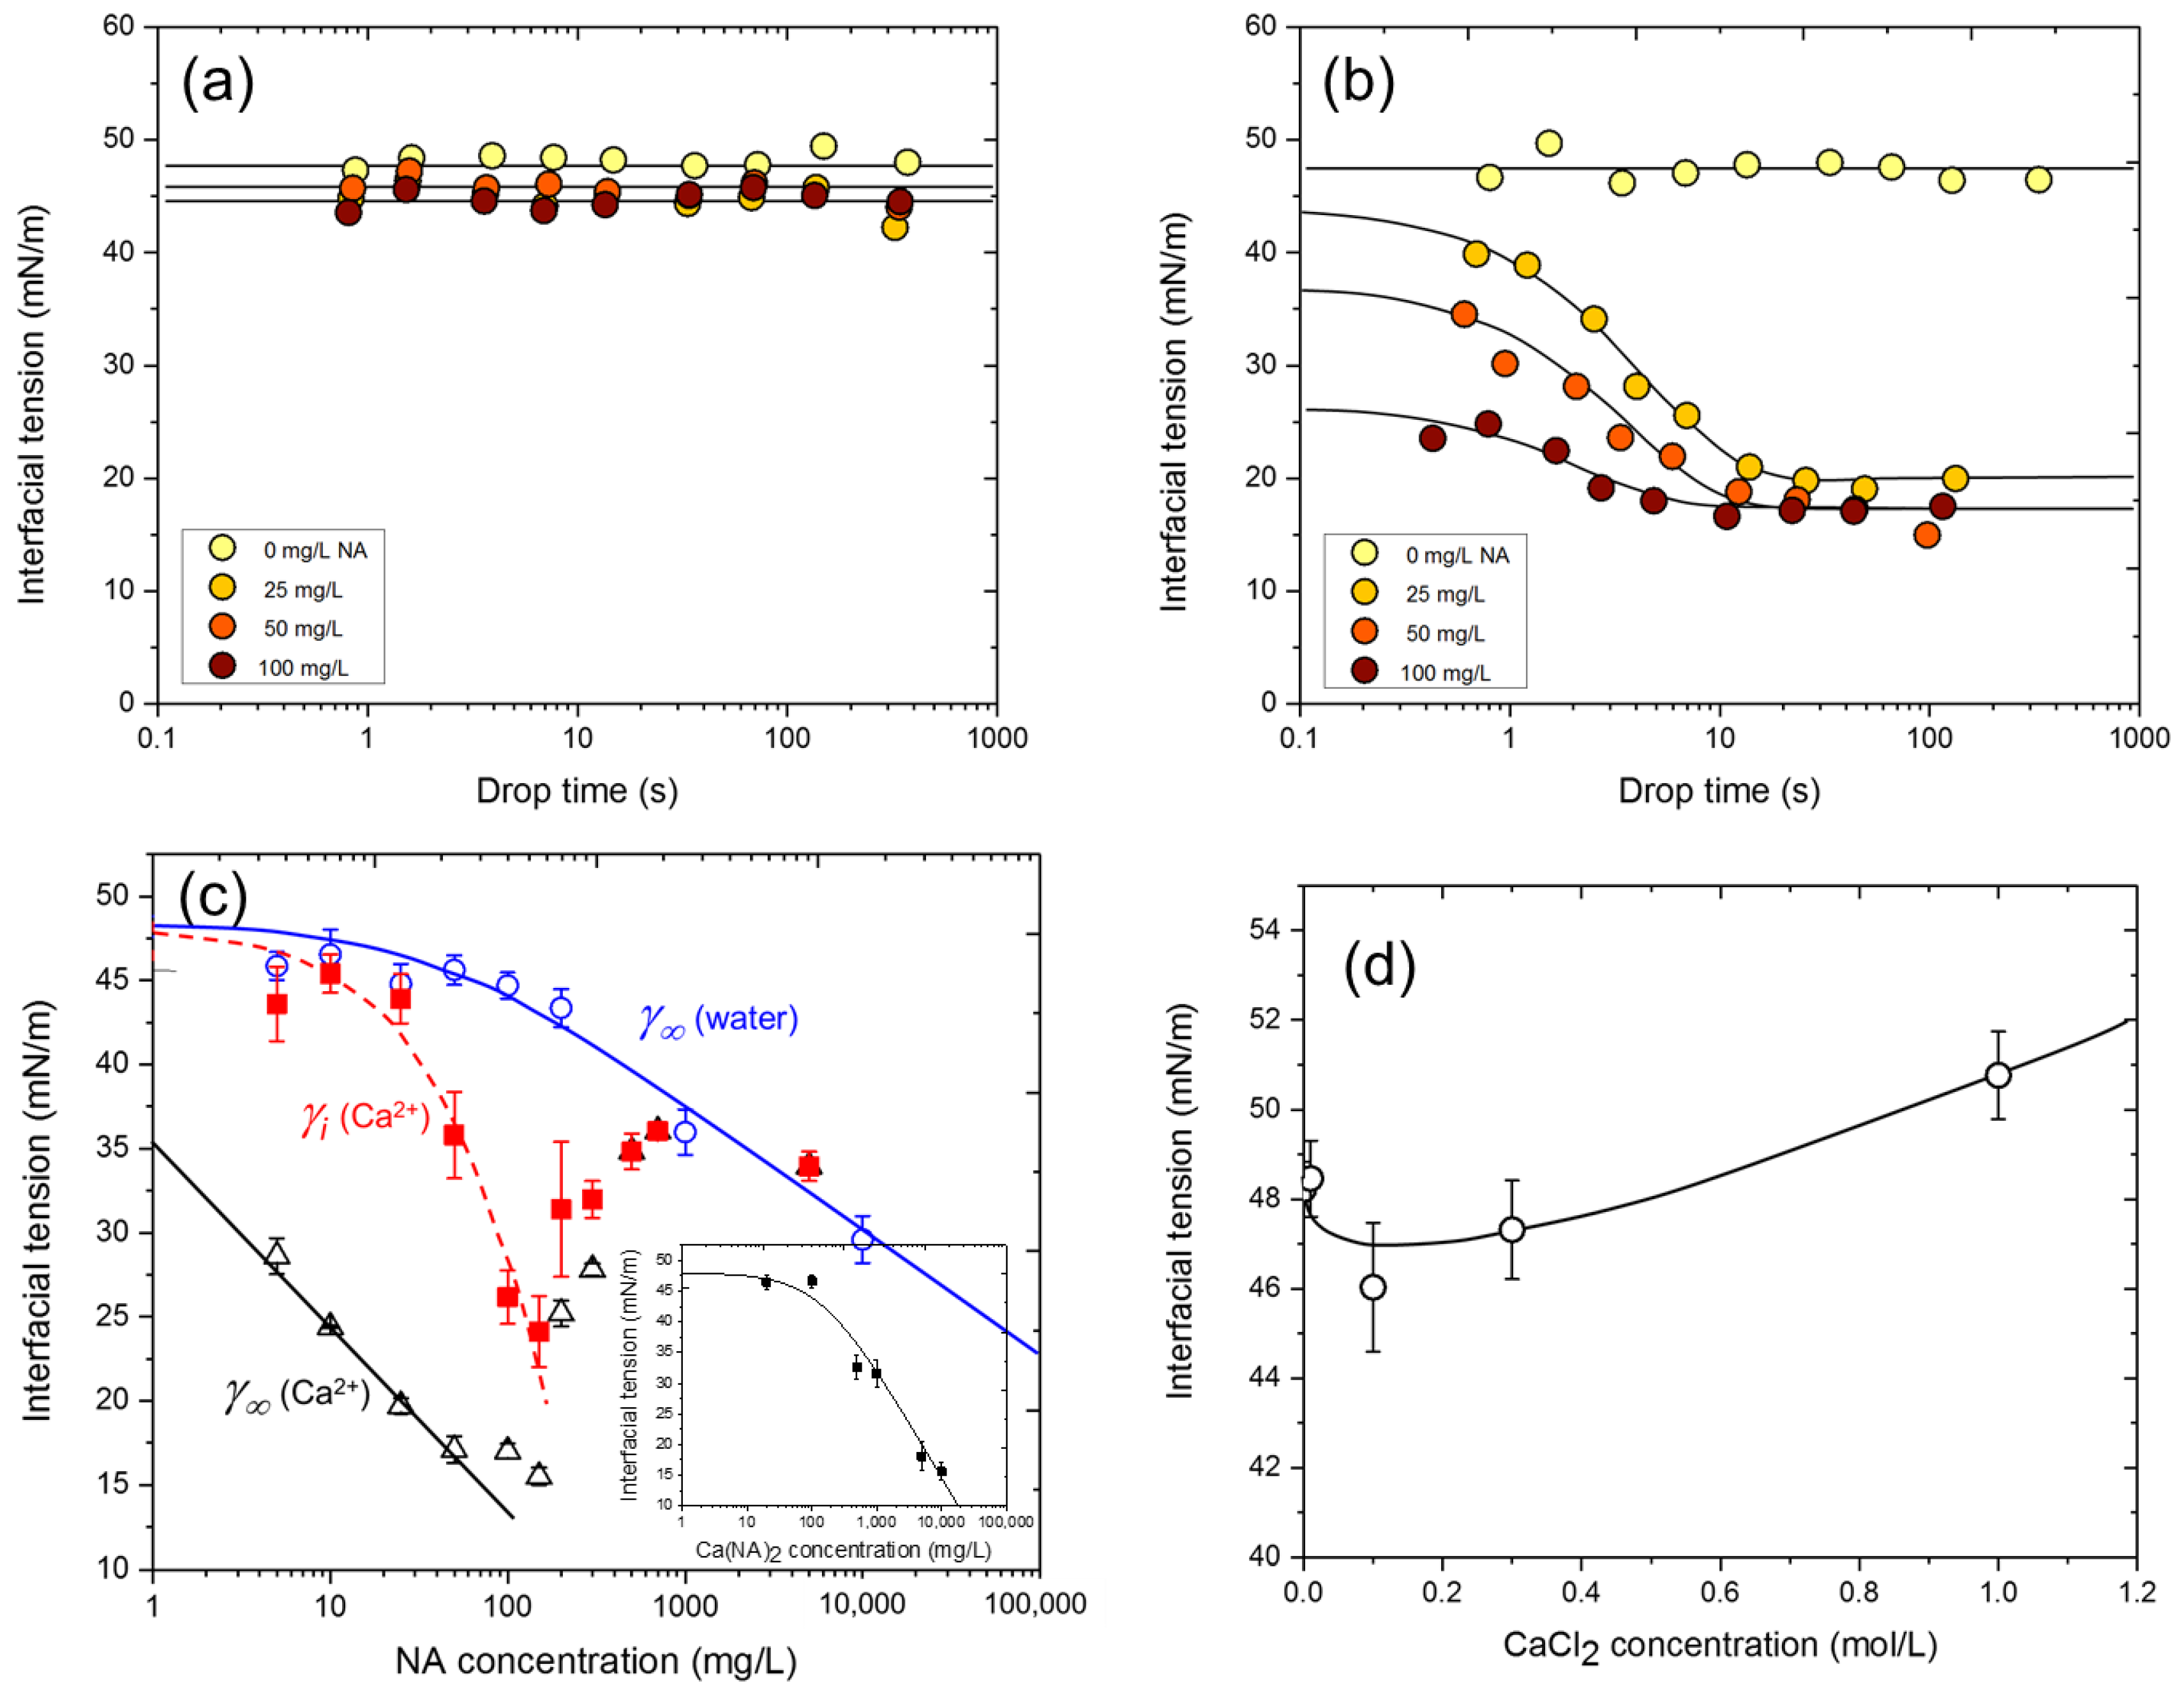
3.1. NA Adsorption at the n-Heptane/Water Interface
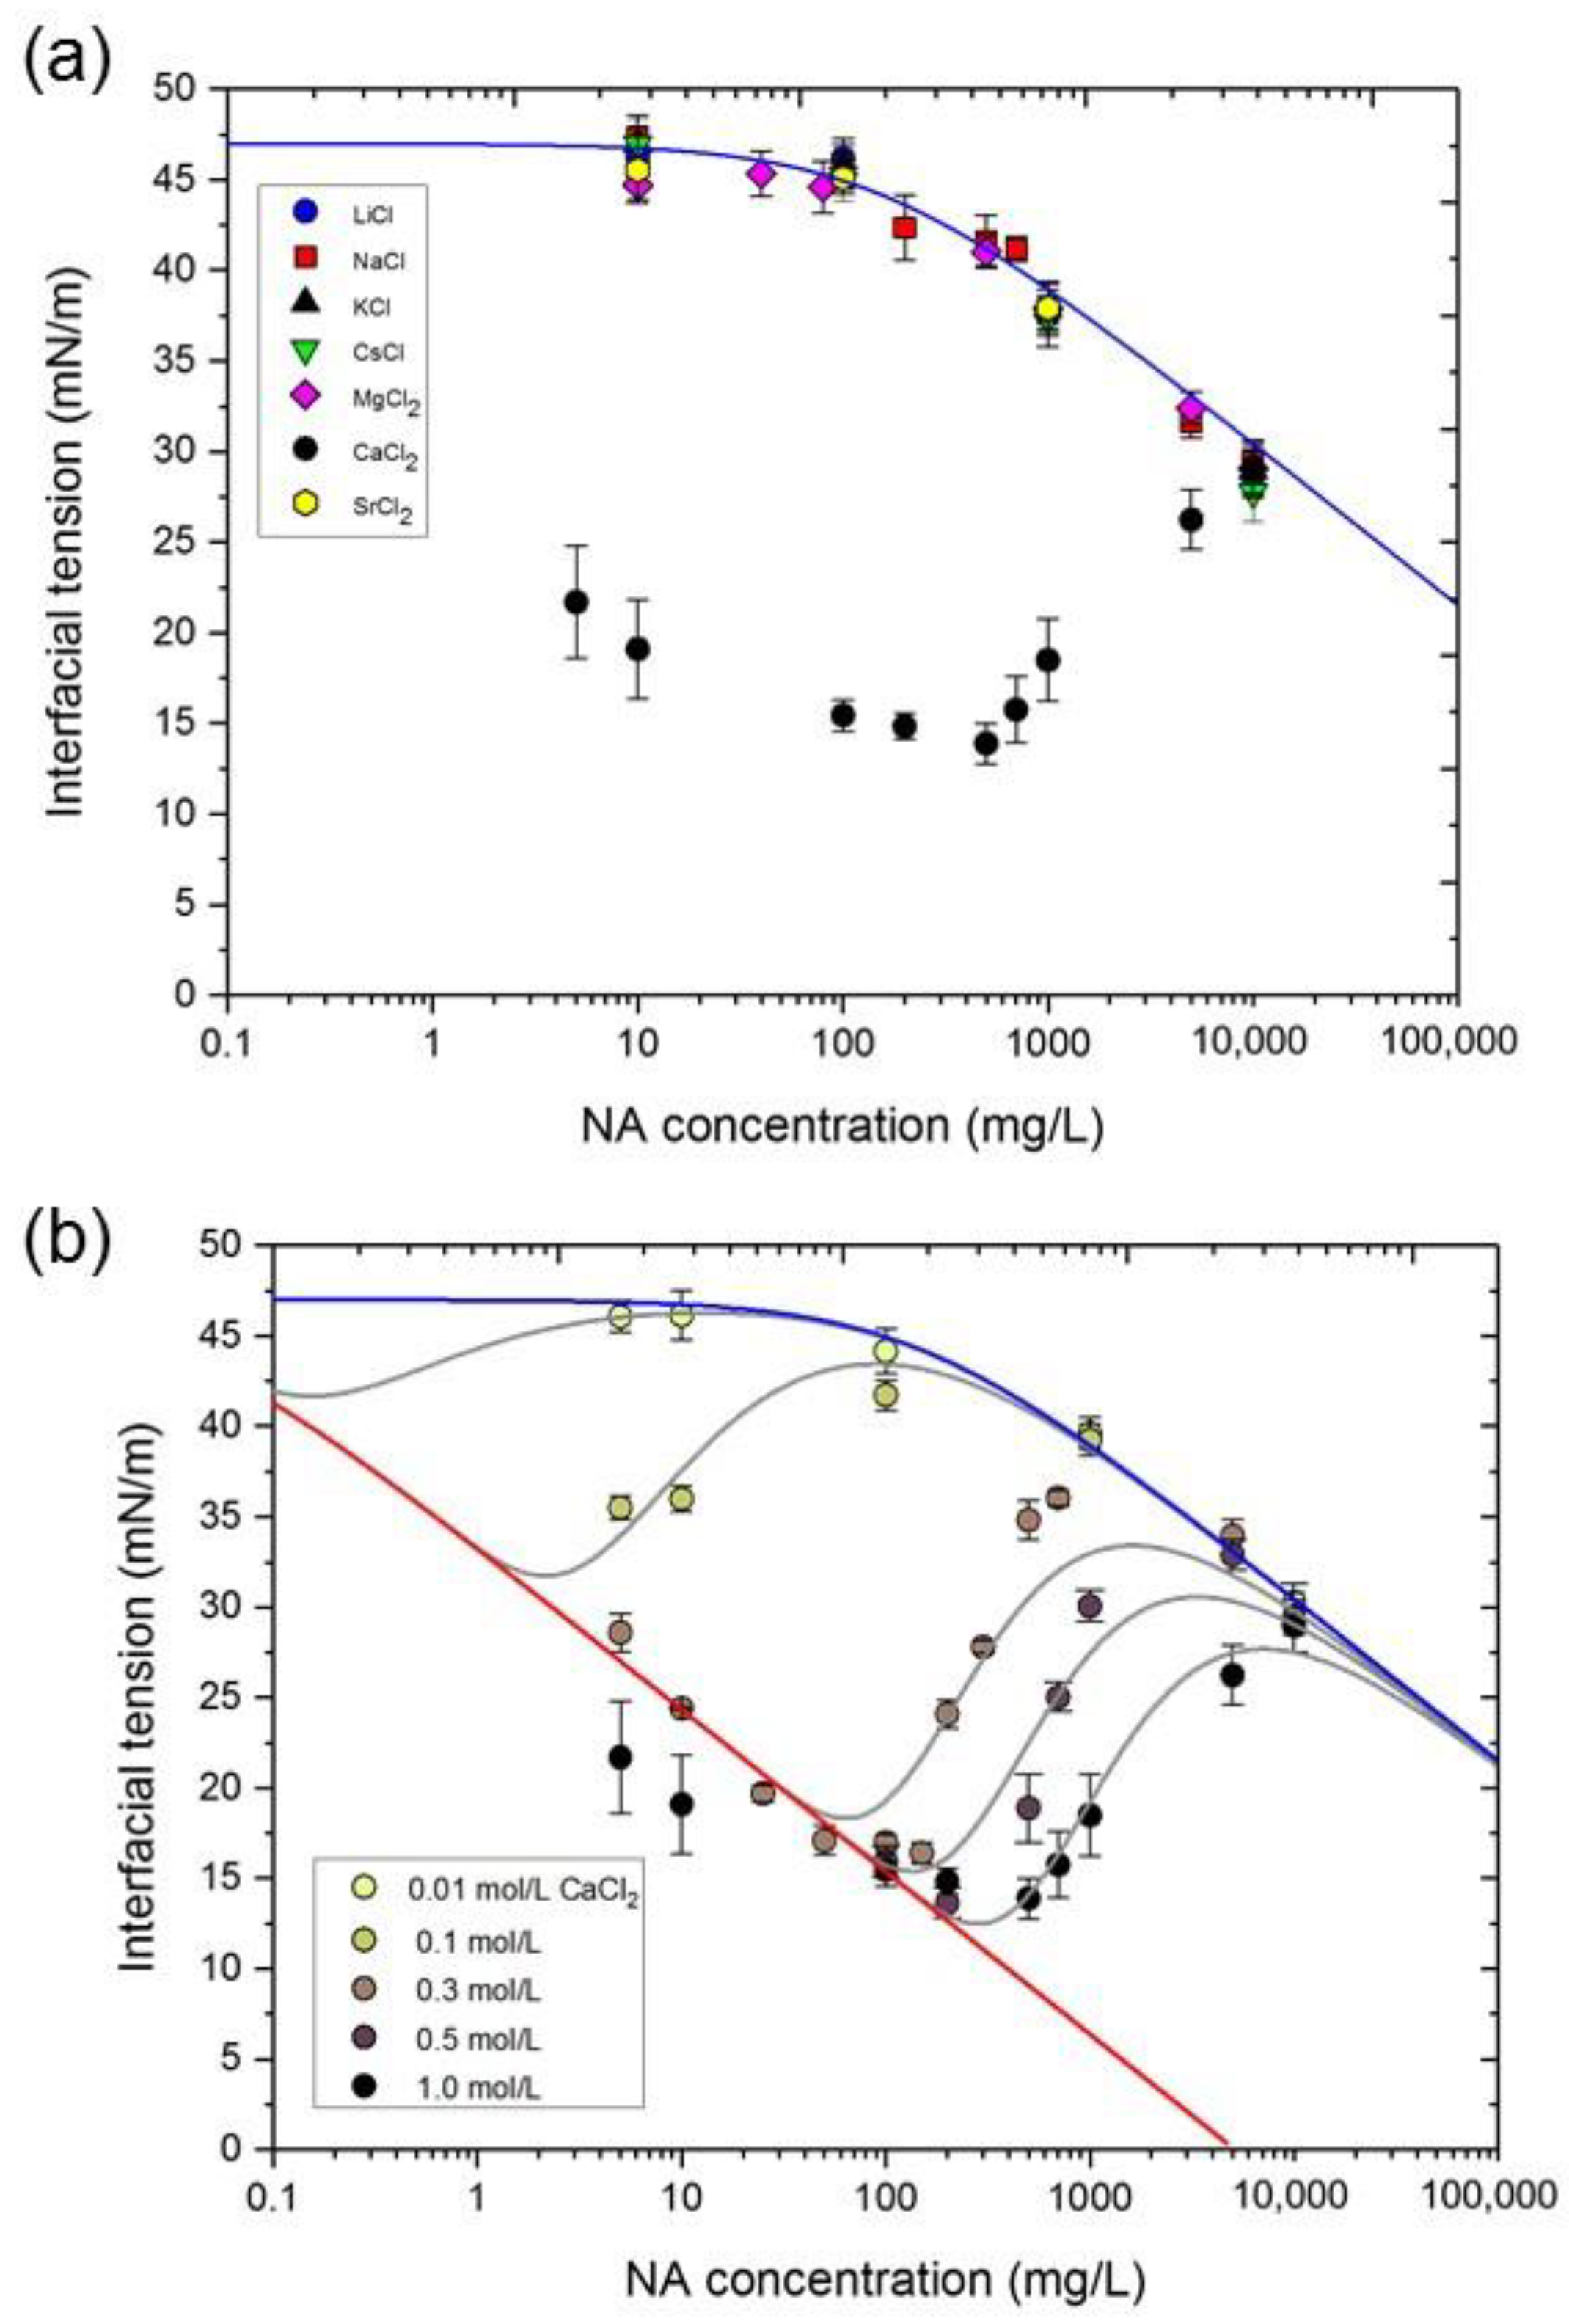
3.2. NA Adsorption at the n-Heptane/Water Interface in the Presence of Metal Ions
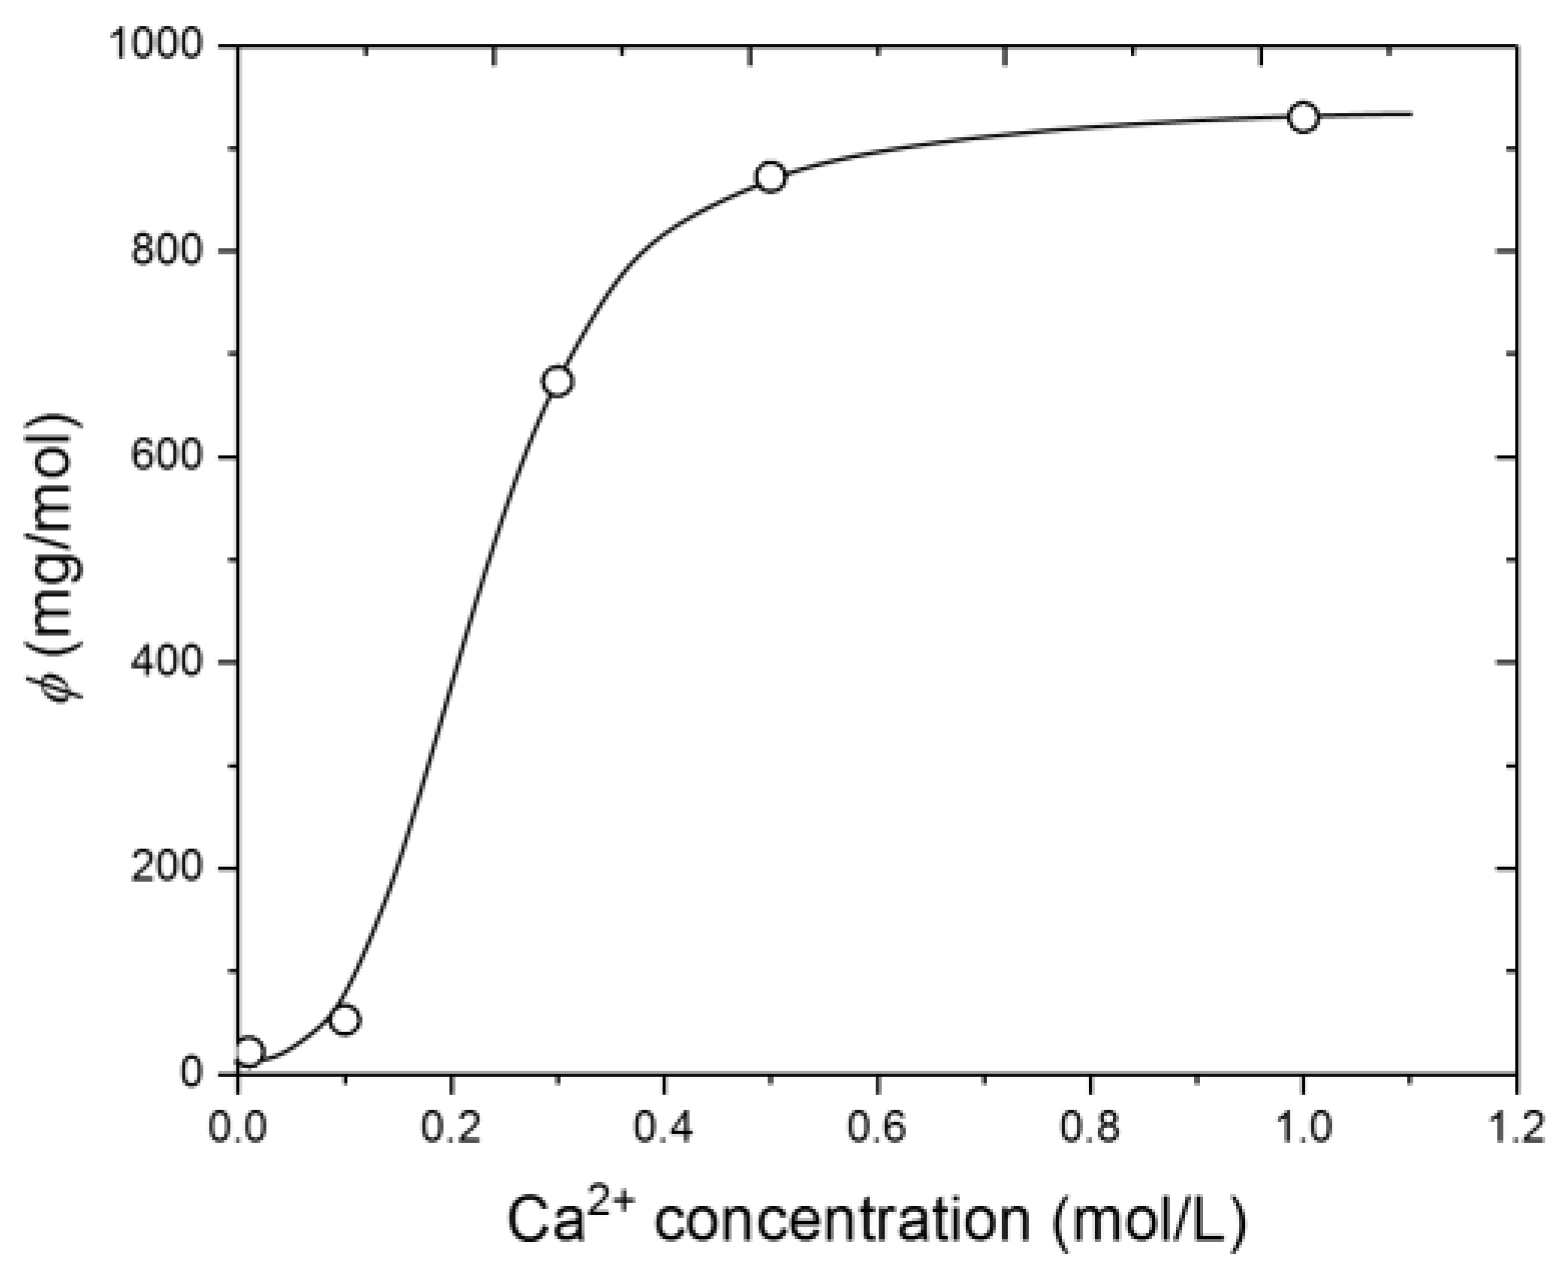
3.3. Dependence of Interfacial Tension on CNA and CCa
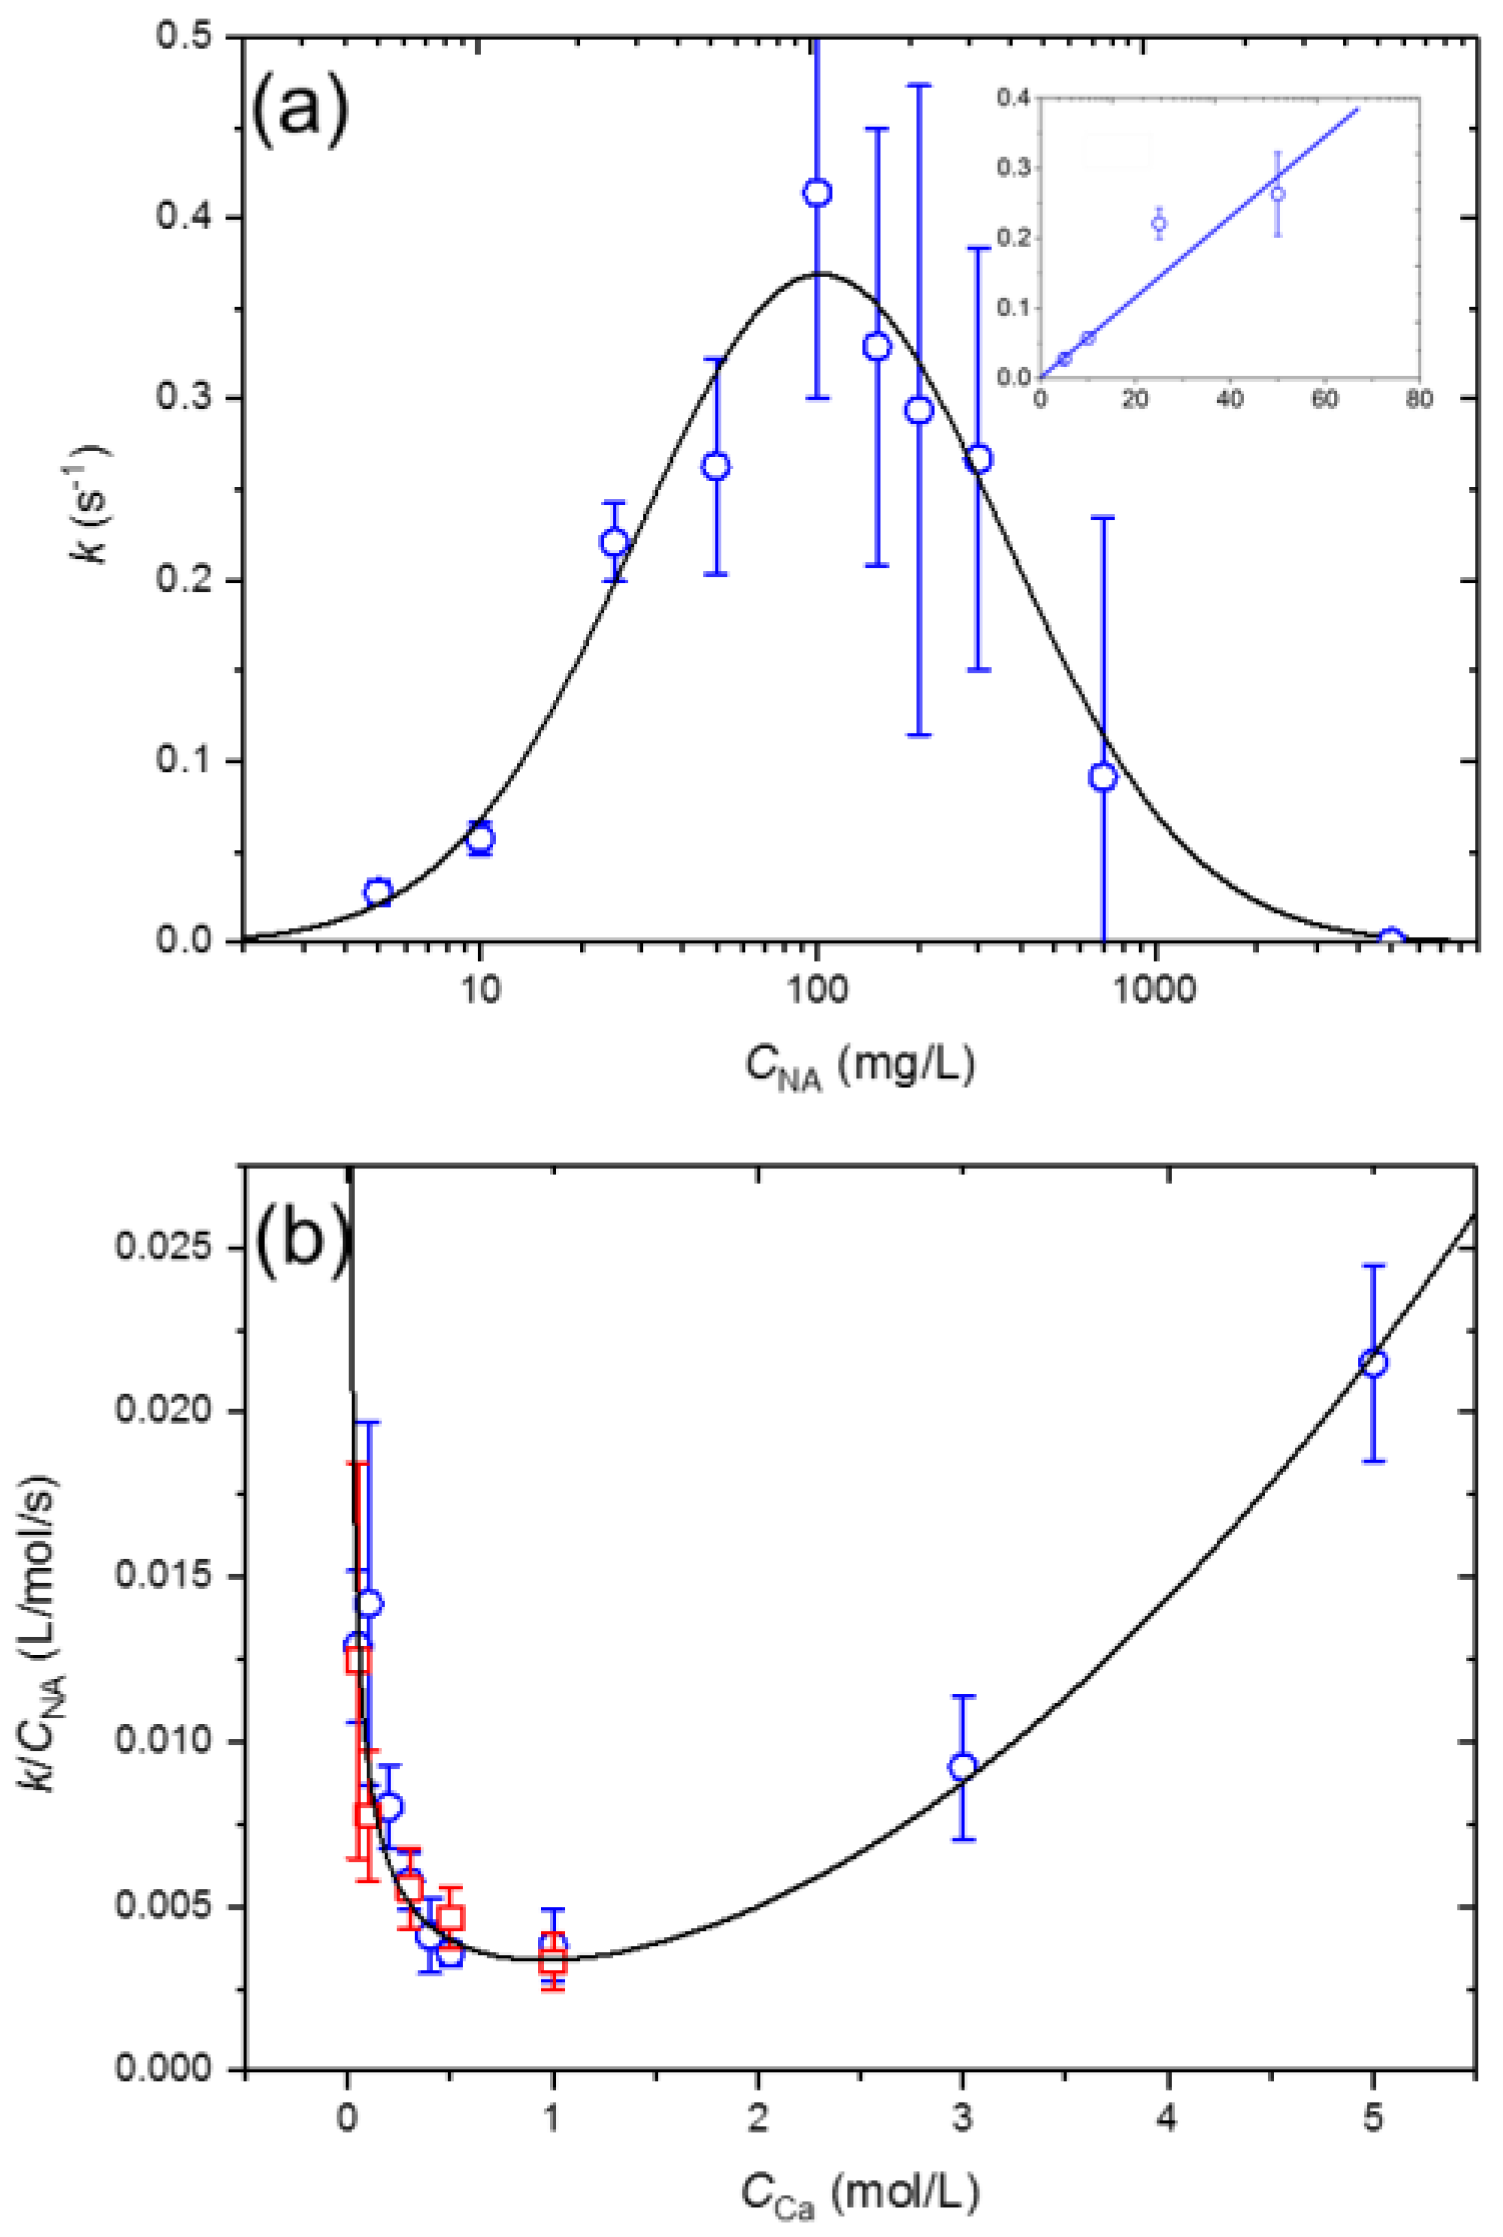
3.4. NA-Ca2+ Interfacial Tension Kinetics
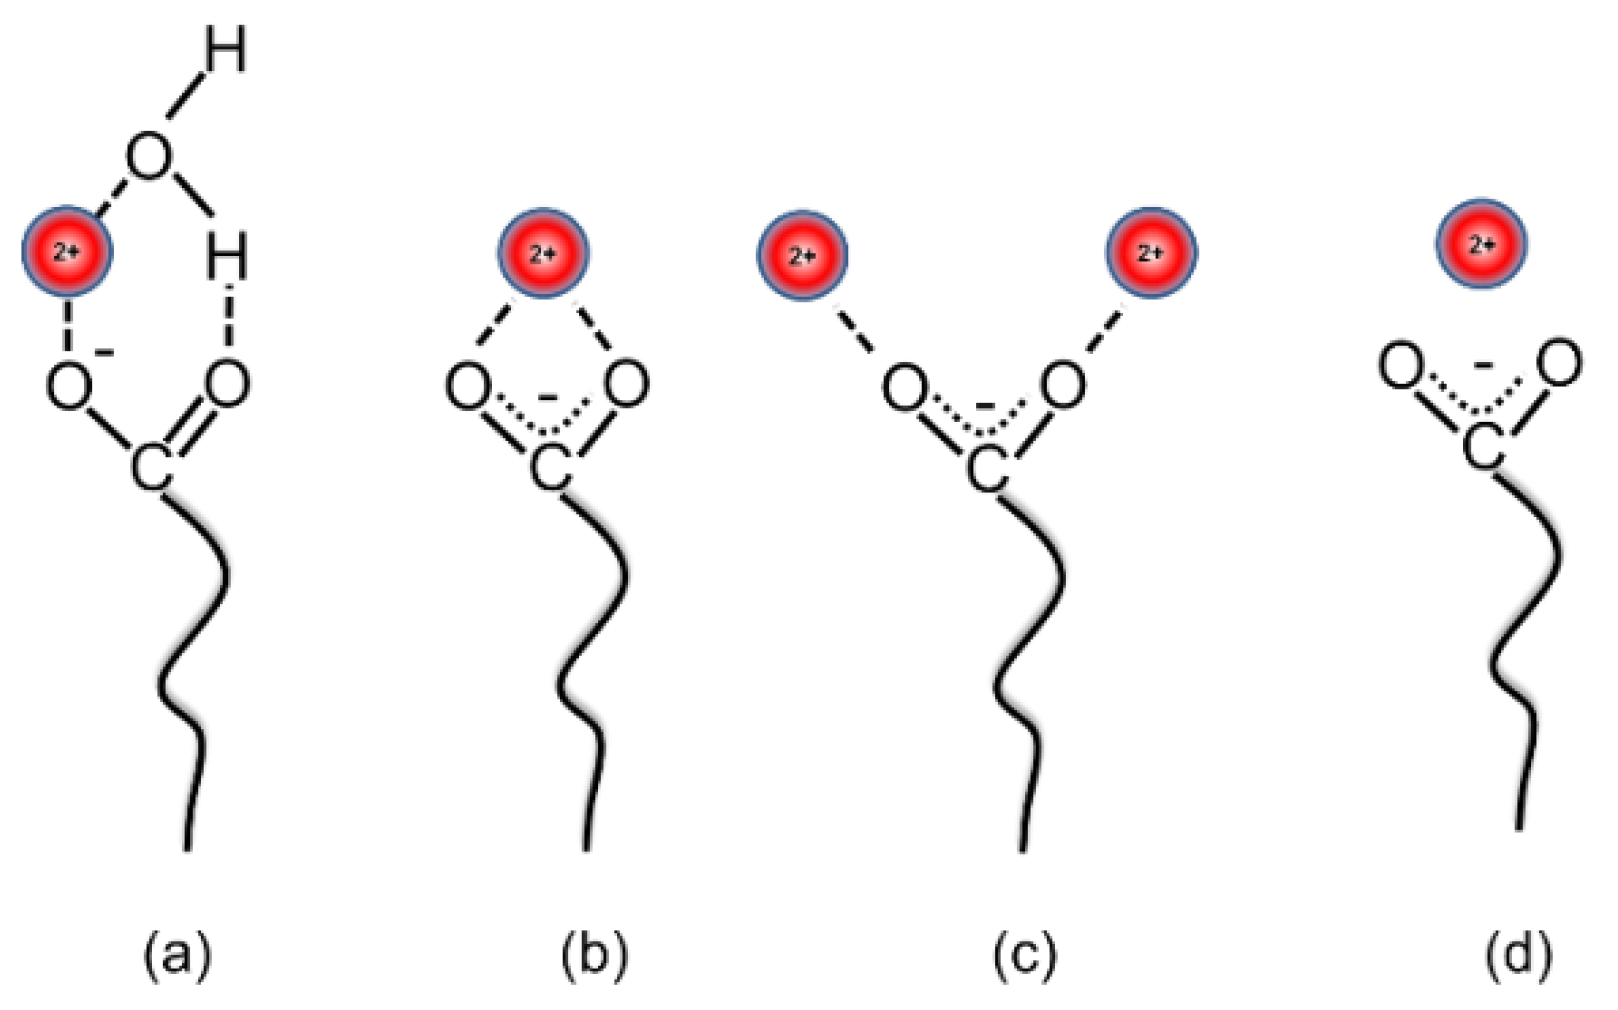
3.5. Interfacial Behavior of Ions and Metal Ion–Carboxylate Bonding
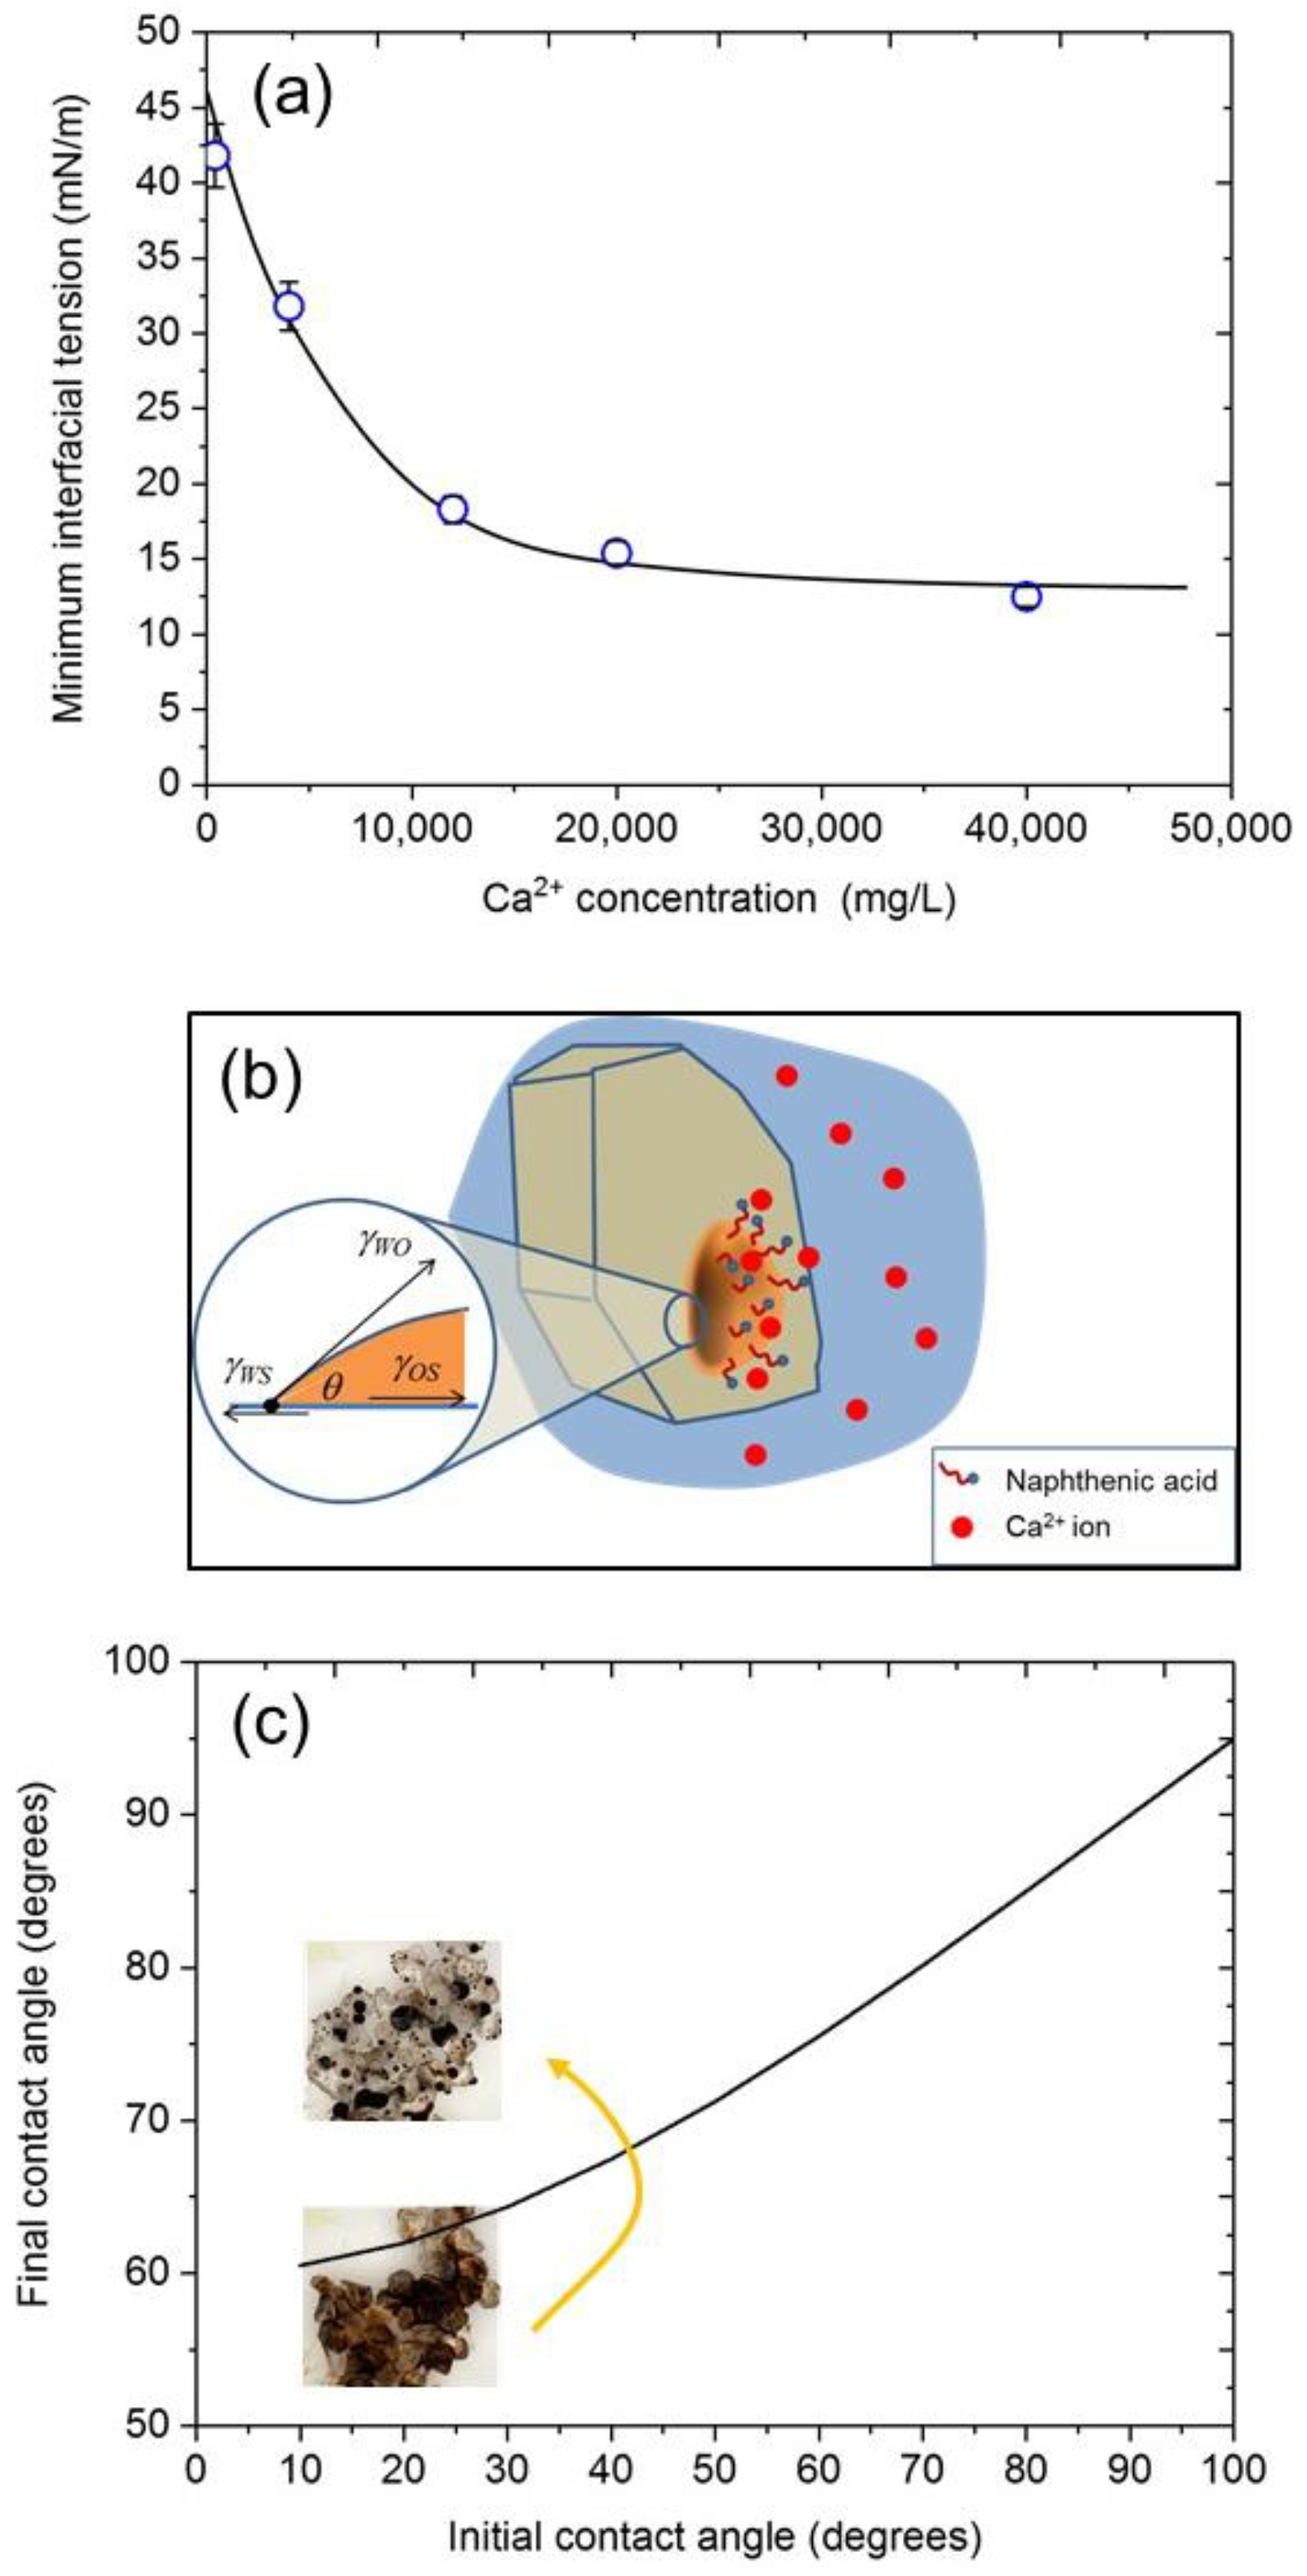
3.6. Implications for Crude Oil Surface Chemistry
4. Conclusions
Author Contributions
Funding
Acknowledgments
Conflicts of Interest
References
- Speight, J.G. High Acid Crudes; Gulf Professional Publishing: Waltham, MA, USA, 2014; Chapter 1. [Google Scholar]
- Burrell, G.A. Composition of petroleum and its products. Ind. Eng. Chem. 1928, 20, 602–608. [Google Scholar] [CrossRef]
- Rudzinski, W.E.; Oehlers, L.; Zhang, Y.; Najera, B. Tandem mass spectrometric characterization of commercial naphthenic acids and a Maya crude oil. Energy Fuels 2002, 16, 1178–1185. [Google Scholar] [CrossRef]
- Anderson, W.G. Wettability literature survey—Part 1: Rock/oil/brine Interactions and the effects of core handling on wettability. J. Pet. Technol. 1986, 38, 1125–1144. [Google Scholar] [CrossRef]
- Anderson, W.G. Wettability literature survey—Part 2: Wettability measurement. J. Pet. Technol. 1986, 38, 1246–1262. [Google Scholar] [CrossRef]
- Muller, H.; Pauchard, V.O.; Hajji, A.A. Role of naphthenic acids in emulsion tightness for a low total acid number (TAN)-high asphaltenes oil: Characterization of the interfacial chemistry. Energy Fuels 2009, 23, 1280–1288. [Google Scholar] [CrossRef]
- Acevedo, S.; Gutierrez, X.; Rivas, H. Bitumen-in-water emulsions stabilized with natural surfactants. J. Colloid Interface Sci. 2001, 242, 230–238. [Google Scholar] [CrossRef]
- Arla, D.; Flesisnki, L.; Bouriat, P.; Dicharry, C. Influence of alkaline pH on the rheology of water/acidic crude oil interface. Energy Fuels 2011, 25, 1118–1126. [Google Scholar] [CrossRef]
- Havre, T.E.; Sjöblom, J.; Vindstad, J.E. Oil/water-partitioning and interfacial behavior of naphthenic acids. J. Dispers. Sci. Technol. 2003, 24, 789–801. [Google Scholar] [CrossRef]
- Gallup, D.L.; Curiale, J.A.; Smith, P.C. Characterization of sodium emulsion soaps formed from production fluids of Kutei Basin, Indonesia. Energy Fuels 2007, 21, 1741–1759. [Google Scholar] [CrossRef]
- Kelland, M.A. Production Chemicals for the Oil and Gas Industry; CRC Press, Taylor and Francis: Boca Raton, FL, USA, 2009; Chapter 7. [Google Scholar]
- Baugh, T.D.; Grande, K.V.; Mediaas, H.; Vindstad, J.E.; Wolf, N.O. The discovery of high molecular weight naphthenic acids (ARN acid) responsible for calcium naphthenate deposits. In Proceedings of the SPE International Symposium on Oilfield Scale, Aberdeen, UK, 11–12 May 2005. [Google Scholar]
- Juyal, P.; Mapolelo, M.M.; Yen, A.; Rodgers, R.P.; Allenson, S.J. Identification of calcium naphthenate deposition in South American oil fields. Energy Fuels 2015, 29, 2342–2350. [Google Scholar] [CrossRef]
- Brandal, Ø.; Hanneseth, A.-M.D.; Hemmingsen, P.V.; Sjöblom, J.; Kim, S.; Rodgers, R.P.; Marshall, A.G. Isolation and characterization of naphthenic acids from a metal naphthenate deposit: Molecular properties at oil-water and air-water interfaces. J. Dispers. Sci. Technol. 2006, 27, 295–305. [Google Scholar] [CrossRef]
- Sundman, O.; Simon, S.; Nordgard, E.L.; Sjöblom, J. Study of the aqueous chemical interactions between a synthetic tetra-acid and divalent cations as a model for the formation of metal naphthenate deposits. Energy Fuels 2010, 24, 6054–6060. [Google Scholar] [CrossRef]
- Ge, L.; Vernon, M.; Simon, S.; Maham, Y.; Sjöblom, J.; Xu, Z. Interactions of divalent cations with tetrameric acid aggregates in aqueous solutions. Colloids Surf. A Physicochem. Eng. Asp. 2012, 396, 238–245. [Google Scholar] [CrossRef]
- Andersen, S.I.; Chandra, M.S.; Chen, J.; Zeng, B.Y.; Zou, F.; Mapolelo, M.; Abdallah, W.; Buiting, J.J. Detection and impact of carboxylic acids at the crude oil–water interface. Energy Fuels 2016, 30, 4475–4485. [Google Scholar] [CrossRef]
- Hutin, A.; Argillier, J.-F.; Langevin, D. Influence of pH on oil-water interfacial tension and mass transfer for asphaltenes model oils. Comparison with crude oil behavior. Oil Gas Sci. Technol. 2016, 71, 58–66. [Google Scholar] [CrossRef]
- Arla, D.; Sinquin, A.; Palermo, T.; Hurtevent, C.; Graciaa, A.; Dicharry, C. Influence of pH and water content on the type and stability of acidic crude oil emulsions. Energy Fuels 2007, 21, 1337–1342. [Google Scholar] [CrossRef]
- Alvarado, V.; Wang, X.; Moradi, M. Role of acid components and asphaltenes in Wyoming water-in-crude oil emulsions. Energy Fuels 2011, 25, 4606–4613. [Google Scholar] [CrossRef]
- Wang, X.; Alvarado, V. Effects of aqueous-phase salinity on water-in-crude oil emulsion stability. J. Dispers. Sci. Technol. 2012, 33, 165–170. [Google Scholar] [CrossRef]
- Kumar, N.; Wang, L.; Siretanu, I.; Duits, M.; Mugele, F. Salt dependent stability of stearic acid Langmuir–Blodgett films exposed to aqueous electrolytes. Langmuir 2013, 29, 5150–5159. [Google Scholar] [CrossRef] [PubMed]
- Sheng, J.J. Critical review of low-salinity waterflooding. J. Pet. Sci. Eng. 2014, 120, 216–224. [Google Scholar] [CrossRef]
- Haagh, M.E.J.; Siretanu, I.; Duits, M.H.G.; Mugele, F. Salinity-dependent contact angle alteration in oil/brine/silicate systems: The critical role of divalent cations. Langmuir 2017, 33, 3349–3357. [Google Scholar] [CrossRef] [PubMed]
- Gandomkar, A.; Rahimpour, M.R. The impact of monovalent and divalent ions on wettability alteration in oil/low salinity brine/limestone systems. J. Mol. Liq. 2017, 248, 1003–1013. [Google Scholar] [CrossRef]
- Pooryousefy, E.; Xie, Q.; Chen, Y.; Sari, A.; Saeedi, A. Drivers of low salinity effect in sandstone reservoirs. J. Mol. Liq. 2018, 250, 396–403. [Google Scholar] [CrossRef]
- Ding, H.; Rahman, S. Experimental and theoretical study of wettability alteration during low salinity water flooding-a state of the art review. Colloids Surf. A Physicochem. Eng. Asp. 2017, 520, 622–639. [Google Scholar] [CrossRef]
- Pouryousefy, E.; Xie, Q.; Saeedi, A. Effect of multi-component ions exchange on low salinity EOR: Coupled geochemical simulation study. Petroleum 2016, 2, 215–234. [Google Scholar] [CrossRef]
- Brady, P.V.; Krumhansl, J.L. A surface complexation model of oil–brine–sandstone interfaces at 100 °C: Low salinity waterflooding. J. Pet. Sci. Eng. 2012, 81, 171–176. [Google Scholar] [CrossRef]
- Derkani, M.H.; Fletcher, A.J.; Abdallah, W.; Sauerer, B.; Anderson, J.; Zhang, Z.J. Low salinity waterflooding in carbonate reservoirs: Review of interfacial mechanisms. Colloids Interfaces 2018, 2, 20. [Google Scholar] [CrossRef]
- De Ruiter, R.; Tjerkstra, R.W.; Duits, M.H.G.; Mugele, F. Influence of cationic composition and pH on the formation of metal stearates at oil/water interfaces. Langmuir 2011, 27, 8738–8747. [Google Scholar] [CrossRef] [PubMed]
- Brandal, Ø.; Hanneseth, A.-M.D.; Sjöblom, J. Interactions between synthetic and indigenous naphthenic acids and divalent cations across oil-water interfaces: Effects of addition of oil-soluble non-ionic surfactants. Colloid Polym. Sci. 2005, 284, 124–133. [Google Scholar] [CrossRef]
- Wojciechowski, K.; Buffle, J.; Miller, R. The synergistic adsorption of fatty acid and azacrown ether at the toluene–water interface. Colloids Surf. A Physicochem. Eng. Asp. 2005, 261, 49–55. [Google Scholar] [CrossRef]
- Enever, R.V.; Pilpel, N. Reaction between stearic acid and calcium ions at the air/water interface using surface viscometry. Trans. Faraday Soc. 1967, 63, 781–792. [Google Scholar] [CrossRef]
- Enever, R.V.; Pilpel, N. Reaction between stearic acid and calcium ions at the air/water interface using surface viscometry. Part 2. Mixed films of octadecanol and stearic acid. Trans. Faraday Soc. 1967, 63, 1559–1566. [Google Scholar] [CrossRef]
- Pilpel, N.; Enever, R.V. Reaction between stearic acid and calcium ions at the air/water interface using surface viscometry. Part 3. Mechanism. Trans. Faraday Soc. 1968, 64, 231–237. [Google Scholar] [CrossRef]
- Hindle, R.; Noestheden, M.; Peru, K.; Headley, J. Quantitative analysis of naphthenic acids in water by liquid chromatography–accurate mass time-of-flight mass spectrometry. J. Chromatogr. A 2013, 1286, 166–174. [Google Scholar] [CrossRef] [PubMed]
- Pereira, R.F.P.; Valente, A.J.M.; Fernandes, M.; Burrows, H.D. What drives the precipitation of long-chain calcium carboxylates (soaps) in aqueous solution. Phys. Chem. Chem. Phys. 2012, 14, 7517–7527. [Google Scholar] [CrossRef] [PubMed]
- Chakravarthy, R.; Naik, G.N.; Savalia, A.; Sridharan, U.; Saravanan, C.; Das, A.K.; Gudasi, K.B. Determination of naphthenic acid number in petroleum crude oils and their fractions by mid-Fourier transform infrared spectroscopy. Energy Fuels 2016, 30, 8579–8586. [Google Scholar] [CrossRef]
- Moreira, A.P.D.; Souza, B.S.; Teixeira, A.M.R.F. Monitoring of calcium stearate formation by thermogravimetry. J. Therm. Anal. Calorim. 2009, 97, 647–652. [Google Scholar] [CrossRef]
- Van Hunsel, J.; Joos, P. Study of the dynamic interfacial tension at the oil/water interface. Colloid Polym. Sci. 1989, 267, 1026–1035. [Google Scholar] [CrossRef]
- Deshiikan, S.R.; Bush, D.; Eschenazi, E.; Papadopoulos, K.D. SDS, Brij 58 and CTAB at the dodecane-water interface. Colloids Surf. A Physicochem. Eng. Asp. 1998, 136, 133–150. [Google Scholar] [CrossRef]
- Joos, P.; Rillaerts, E. Theory on the determination of the dynamic surface tension with the drop volume and maximum bubble pressure methods. J. Colloid Interface Sci. 1981, 79, 96–100. [Google Scholar] [CrossRef]
- Harkins, W.D.; Brown, F.E. The determination of surface tension (free surface energy), and the weight of falling drops: The surface tension of water and benzene by the capillary height method. J. Am. Chem. Soc. 1919, 41, 499–524. [Google Scholar] [CrossRef]
- Wilkinson, M. Extended use of, and comments on, the drop-weight (drop-volume) technique for the determination of surface and interfacial tensions. J. Colloid Interface Sci. 1972, 40, 14–26. [Google Scholar] [CrossRef]
- Lee, B.-B.; Ravindra, P.; Chan, E.-S. New drop weight analysis for surface tension determination of liquids. Colloids Surf. A Physicochem. Eng. Asp. 2009, 332, 112–120. [Google Scholar] [CrossRef]
- Robertson, E.J.; Beaman, D.K.; Richmond, G.L. Designated drivers: The differing roles of divalent metal ions in surfactant adsorption at the oil–water interface. Langmuir 2013, 29, 15511–15520. [Google Scholar] [CrossRef] [PubMed]
- Berry, J.D.; Neeson, M.J.; Dagastine, R.R.; Chan, D.Y.C.; Tabor, R.F. Measurement of surface and interfacial tension using pendant drop tensiometry. J. Colloid Interface Sci. 2015, 454, 226–237. [Google Scholar] [CrossRef] [PubMed]
- Dill, K.A.; Bromberg, S. Molecular Driving Forces: Statistical Mechanics in Chemistry and Biology; Garland Science, Taylor and Francis: New York, NY, USA, 2003; Chapters 21 and 22. [Google Scholar]
- Andersson, M.P.; Olsson, M.H.M.; Stipp, S.L.S. Predicting the pKa and stability of organic acids and bases at an oil–water interface. Langmuir 2014, 30, 6437–6445. [Google Scholar] [CrossRef] [PubMed]
- Gershevitz, O.; Sukenik, C.N. In situ FTIR-ATR analysis and titration of carboxylic acid-terminated SAMs. J. Am. Chem. Soc. 2004, 126, 482–483. [Google Scholar] [CrossRef] [PubMed]
- Kanicky, J.R.; Shah, D.O. Effect of degree, type, and position of unsaturation on the pKa of long-chain fatty acids. J. Colloid Interface Sci. 2002, 256, 201–207. [Google Scholar] [CrossRef] [PubMed]
- Kanicky, J.R.; Shah, D.O. Effect of premicellar aggregation on the pKa of fatty acid soap solutions. Langmuir 2003, 19, 2034–2038. [Google Scholar] [CrossRef]
- Wellen, B.A.; Lach, E.A.; Allen, H.C. Surface pKa of octanoic, nonanoic, and decanoic fatty acids at the air–water interface: Applications to atmospheric aerosol chemistry. Phys. Chem. Chem. Phys. 2017, 19, 26551–26558. [Google Scholar] [CrossRef] [PubMed]
- Brosseau, Q.; Vrignon, J.; Baret, J.-C. Microfluidic dynamic interfacial tensiometry (μDIT). Soft Matter 2014, 10, 3066–3076. [Google Scholar] [CrossRef] [PubMed]
- Von Szyszkowski, B. Experimental studies on the capillary characteristics of watery solutions of fatty acids. Z. Phys. Chem. 1908, 64, 385–414. [Google Scholar]
- Rosen, M.J. Surfactants and Interfacial Phenomena, 3rd ed.; John Wiley & Sons: New York, NY, USA, 2004; p. 45. [Google Scholar]
- Braunschweig, B.; Schulze-Zachau, F.; Nagel, E.; Engelhardt, K.; Stoyanov, S.; Gochev, G.; Khristov, K.; Mileva, E.; Exerowa, D.; Miller, R.; et al. Specific effects of Ca2+ ions and molecular structure of β-lactoglobulin interfacial layers that drive macroscopic foam stability. Soft Matter 2016, 12, 5995–6004. [Google Scholar] [CrossRef] [PubMed]
- Jones, G.; Ray, W.A. The surface tension of solutions of electrolytes as a function of the concentration. I. A differential method for measuring relative surface tension. J. Am. Chem. Soc. 1937, 59, 187–198. [Google Scholar] [CrossRef]
- Kakati, A.; Sangwai, J.S. Effect of monovalent and divalent salts on the interfacial tension of pure hydrocarbon-brine systems relevant for low salinity water flooding. J. Pet. Sci. Eng. 2017, 157, 1106–1114. [Google Scholar] [CrossRef]
- Moeini, F.; Hemmati-Sarapardeh, A.; Ghazanfari, M.-H.; Masihi, M.; Ayatollahi, S. Toward mechanistic understanding of heavy crude oil/brine interfacial tension: The roles of salinity, temperature and pressure. Fluid Phase Equilib. 2014, 375, 191–200. [Google Scholar] [CrossRef]
- Petersen, P.B.; Johnson, J.C.; Knutsen, K.P.; Saykally, R.J. Direct experimental validation of the Jones–Ray effect. Chem. Phys. Lett. 2004, 397, 46–50. [Google Scholar] [CrossRef]
- Saien, J.; Mishi, M. Equilibrium interfacial tension and the influence of extreme dilutions of uni-univalent salts: An expression of the “Jones–Ray effect”. J. Chem. Thermodyn. 2012, 54, 254–260. [Google Scholar] [CrossRef]
- Nguyen, K.T.; Nguyen, A.V.; Evans, G.M. Interactions between halide anions and interfacial water molecules in relation to the Jones–Ray effect. Phys. Chem. Chem. Phys. 2014, 16, 24661–24665. [Google Scholar] [CrossRef] [PubMed]
- Uematsu, Y.; Bonthuis, D.J.; Netz, R.R. Charged surface-active impurities at nanomolar concentration induce Jones–Ray effect. J. Phys. Chem. Lett. 2018, 9, 189–193. [Google Scholar] [CrossRef] [PubMed]
- Langmuir, I. Repulsive forces between charged surfaces in water, and the cause of the Jones-Ray effect. Science 1938, 88, 430–432. [Google Scholar] [CrossRef] [PubMed]
- Okur, H.I.; Chen, Y.; Wilkins, D.M.; Roke, S. The Jones-Ray effect reinterpreted: Surface tension minima of low ionic strength electrolyte solutions are caused by electric field induced water-water correlations. Chem. Phys. Lett. 2017, 684, 433–442. [Google Scholar] [CrossRef]
- Heydweillwer, A. On the physical properties of solutions and their interactions. II. Surface tension and electrical conductivity of aqueous salts. Ann. Phys. 1910, 33, 145–185. [Google Scholar]
- Aveyard, R.; Saleem, S.M. Interfacial tensions at alkane-aqueous electrolyte interfaces. JCS Faraday Trans. 1 1976, 72, 1609–1617. [Google Scholar] [CrossRef]
- Wen, B.; Sun, C.; Bai, B.; Gatapova, E.Y.; Kabov, O.A. Ionic hydration-induced evolution of decane–water interfacial tension. Phys. Chem. Chem. Phys. 2017, 19, 14606–14614. [Google Scholar] [CrossRef] [PubMed]
- Bastos-González, D.; Pérez-Fuentes, L.; Drummond, C.; Faraudo, J. Ions at interfaces: The central role of hydration and hydrophobicity. Curr. Opin. Colloid Interface Sci. 2016, 23, 19–28. [Google Scholar] [CrossRef]
- Persson, I. Hydrated metal ions in aqueous solution: How regular are their structures? Pure Appl. Chem. 2010, 82, 1901–1917. [Google Scholar] [CrossRef]
- Dos Santos, A.P.; Levin, Y. Ions at the water–oil Interface: Interfacial tension of electrolyte solutions. Langmuir 2012, 28, 1304–1308. [Google Scholar] [CrossRef] [PubMed]
- Dos Santos, A.P.; Levin, Y. Surface and interfacial tensions of Hofmeister electrolytes. Faraday Discuss. 2013, 160, 75–87. [Google Scholar] [CrossRef]
- Ikeda, T.; Boero, M.; Terakura, K. Hydration properties of magnesium and calcium ions from constrained first principles molecular dynamics. J. Chem. Phys. 2007, 127, 074503. [Google Scholar] [CrossRef] [PubMed]
- Pavlov, M.; Siegbahn, P.E.M.; Sandström, M. Hydration of beryllium, magnesium, calcium, and zinc ions using density functional theory. J. Phys. Chem A 1998, 102, 219–228. [Google Scholar] [CrossRef]
- Hofmeister, F. Zur Lehre von der Wirkung der Salze. Arch. Exp. Pathol. Pharmakol. 1888, 24, 247–260. [Google Scholar] [CrossRef]
- Kunz, W.; Henle, J.; Ninham, B.W. ‘Zur Lehre von der Wirkung der Salze’ (about the science of the effect of salts): Franz Hofmeister’s historical papers. Curr. Opin. Colloid Interface Sci. 2004, 9, 19–37. [Google Scholar] [CrossRef]
- Collins, K.D.; Washabaugh, M.W. The Hofmeister effect and the behaviour of water at interfaces. Q. Rev. Biophys. 1985, 18, 323–422. [Google Scholar] [CrossRef] [PubMed]
- Lee, Y.; Thirumalai, D.; Hyeon, C. Ultrasensitivity of water exchange kinetics to the size of metal ion. J. Am. Chem. Soc. 2017, 139, 12334–12337. [Google Scholar] [CrossRef] [PubMed]
- Kherb, J.; Flores, S.C.; Cremer, P.S. Role of carboxylate side chains in the cation Hofmeister series. J. Phys. Chem. B 2012, 116, 7389–7397. [Google Scholar] [CrossRef] [PubMed]
- Einspahr, H.; Bugg, C.E. The geometry of calcium-carboxylate interactions in crystalline complexes. Acta Cryst. 1981, B37, 1044–1052. [Google Scholar] [CrossRef]
- Carrell, C.J.; Carrell, H.L.; Erlebacher, J.; Glusker, J.P. Structural aspects of metal ion-carboxylate interactions. J. Am. Chem. Soc. 1988, 110, 8651–8656. [Google Scholar] [CrossRef]
- Beaman, D.K.; Robertson, E.J.; Richmond, G.L. Metal ions: Driving the orderly assembly of polyelectrolytes at a hydrophobic surface. Langmuir 2012, 28, 14245–14253. [Google Scholar] [CrossRef] [PubMed]
- Papageorgiou, S.K.; Kouvelos, E.P.; Favvas, E.P.; Sapalidis, A.A.; Romanos, G.E.; Katsaros, F.K. Metal–carboxylate interactions in metal–alginate complexes studied with FTIR spectroscopy. Carbohydr. Res. 2010, 345, 469–473. [Google Scholar] [CrossRef] [PubMed]
- Lu, Y.; Miller, J.D. Carboxyl stretching vibrations of spontaneously adsorbed and LB-transferred calcium carboxylates as determined by FTIR internal reflection spectroscopy. J. Colloid Interface Sci. 2002, 256, 41–52. [Google Scholar] [CrossRef]
- Dhavskar, K.T.; Bhargao, P.H.; Srinivasan, B.R. Synthesis, crystal structure and properties of magnesium and calcium salts of p-anisic acid. J. Chem. Sci. 2016, 128, 421–428. [Google Scholar] [CrossRef]
- Tang, C.Y.; Huang, Z.; Allen, H.C. Binding of Mg2+ and Ca2+ to palmitic acid and deprotonation of the COOH headgroup studied by vibrational sum frequency generation spectroscopy. J. Phys. Chem. B 2010, 114, 17068–17076. [Google Scholar] [CrossRef] [PubMed]
- Tang, C.Y.; Huang, Z.; Allen, H.C. Interfacial water structure and effects of Mg2+ and Ca2+ binding to the COOH headgroup of a palmitic acid monolayer studied by sum frequency spectroscopy. J. Phys. Chem. B 2011, 115, 34–40. [Google Scholar] [CrossRef] [PubMed]
- Vogel, H.J.; Brokx, R.D.; Ouyang, H. Calcium-binding proteins. In Methods in Molecular Biology, Volume 172: Calcium-Binding Protein Protocols: Reviews and Case Studies; Vogel, H.J., Ed.; Humana Press Inc.: Totowa, NJ, USA, 2002; Volume 1, Chapter 1. [Google Scholar]
- Katz, A.K.; Glusker, J.P.; Beebe, S.A.; Bock, C.W. Calcium ion coordination: A comparison with that of beryllium, magnesium, and zinc. J. Am. Chem. Soc. 1996, 118, 5752–5763. [Google Scholar] [CrossRef]
- Dudev, T.; Lim, C. Monodentate versus bidentate carboxylate binding in magnesium and calcium proteins: What are the basic principles? J. Phys. Chem. B 2004, 108, 4546–4557. [Google Scholar] [CrossRef]
- Nara, M.; Morii, H.; Tanokura, M. Coordination to divalent cations by calcium-binding proteins studied by FTIR spectroscopy. Biochim. Biophys. Acta 2013, 1828, 2319–2327. [Google Scholar] [CrossRef] [PubMed]
- Dudev, T.; Cowan, J.A.; Lim, C. Competitive binding in magnesium coordination chemistry: Water versus ligands of biological interest. J. Am. Chem. Soc. 1999, 121, 7665–7673. [Google Scholar] [CrossRef]
- Williams, R.J.P. Calcium. In Methods in Molecular Biology, Volume 172: Calcium-Binding Protein Protocols: Reviews and Case Studies; Vogel, H.J., Ed.; Humana Press Inc.: Totowa, NJ, USA, 2002; Volume 1, Chapter 2. [Google Scholar]
- Collins, K.D. Ion hydration: Implications for cellular function, polyelectrolytes, and protein crystallization. Biophys. Chem. 2006, 119, 271–281. [Google Scholar] [CrossRef] [PubMed]
- Kiriukhin, M.Y.; Collins, K.D. Dynamic hydration numbers for biologically important ions. Biophys. Chem. 2002, 99, 155–168. [Google Scholar] [CrossRef]
- Shehata, A.M.; Nasr-El-Din, H.A. Laboratory investigations to determine effect of connate-water composition on Low-salinity waterflooding in sandstone reservoirs. SPE Reserv. Eval. Eng. 2017, 20, 59–76. [Google Scholar] [CrossRef]
- Lashkarbolooki, M.; Ayatollahi, S.; Riazi, M. The impacts of aqueous ions on interfacial tension and wettability of an asphaltenic–acidic crude oil reservoir during Smart Water injection. J. Chem. Eng. Data 2014, 59, 3624–3634. [Google Scholar] [CrossRef]
- Suleimanov, B.A.; Latifov, Y.A.; Veliyev, E.F.; Frampton, H. Comparative analysis of the EOR mechanisms by using low salinity and low hardness alkaline water. J. Pet. Sci. Eng. 2018, 162, 35–43. [Google Scholar] [CrossRef]
- Gonzalez, V.; Taylor, S.E. Physical and chemical aspects of “precursor films” spreading on water from natural bitumen. J. Pet. Sci. Eng. 2018, 170, 291–303. [Google Scholar] [CrossRef]
- Basu, S.; Sharma, M.M. Measurement of critical disjoining pressure for dewetting of solid surfaces. J. Colloid Interface Sci. 1996, 181, 443–455. [Google Scholar] [CrossRef]
- Collins, A.G. Geochemistry of Oilfield Waters; Developments in Petroleum Science; Elsevier: New York, NY, USA, 1976; Volume 1, Chapter 7. [Google Scholar]
- Sauerer, B.; Stukan, M.; Buiting, J.; Abdallah, W.; Andersen, S. Dynamic asphaltene-stearic acid competition at the oil–water interface. Langmuir 2018, 34, 5558–5573. [Google Scholar] [CrossRef] [PubMed]
- Alexander, A.E.; Teorell, T.; Åborg, G.C. A study of films at the liquid/liquid interface. Part III. A specific effect of calcium ions on kephalin monolayers. Trans. Faraday Soc. 1939, 35, 1200–1205. [Google Scholar] [CrossRef]


| Interface Species | Γm (mol/m2) | Molecular Area (nm2) | ΔG0 (kJ/mol) |
|---|---|---|---|
| NA | 1.58 × 10⁻⁶ | 1.05 | −27.9 |
| NA + Ca2+ (i) | 1.66 × 10⁻⁵ | 0.10 | −27.5 |
| NA + Ca2+ (∞) | 1.60 × 10⁻⁶ | 1.04 | −48.7 |
| Ca(NA)2 | 3.34 × 10⁻⁶ | 0.50 | −29.1 |
| Geologic Period | Average (Maximum) Metal Ion Concentration (mg/L) | |
|---|---|---|
| Na+ | Ca2+ | |
| Oligocene/Paleogene | 39,000 (103,000) | 2530 (38,800) |
| Cretaceous | 31,000 (88,600) | 7000 (37,400) |
| Jurassic | 57,300 (120,000) | 25,800 (56,300) |
| Permian | 47,000 (109,000) | 8600 (22,800) |
| Carboniferous (Pennsylvanian) | 43,000 (101,000) | 9100 (205,000) |
| Carboniferous (Mississippian) | 41,500 (115,800) | 8900 (37,800) |
| Devonian | 48,000 (101,000) | 18,000 (129,000) |
© 2018 by the authors. Licensee MDPI, Basel, Switzerland. This article is an open access article distributed under the terms and conditions of the Creative Commons Attribution (CC BY) license (http://creativecommons.org/licenses/by/4.0/).
Share and Cite
Taylor, S.E.; Chu, H.T. Metal Ion Interactions with Crude Oil Components: Specificity of Ca2+ Binding to Naphthenic Acid at an Oil/Water Interface. Colloids Interfaces 2018, 2, 40. https://doi.org/10.3390/colloids2030040
Taylor SE, Chu HT. Metal Ion Interactions with Crude Oil Components: Specificity of Ca2+ Binding to Naphthenic Acid at an Oil/Water Interface. Colloids and Interfaces. 2018; 2(3):40. https://doi.org/10.3390/colloids2030040
Chicago/Turabian StyleTaylor, Spencer E., and Hiu Tung Chu. 2018. "Metal Ion Interactions with Crude Oil Components: Specificity of Ca2+ Binding to Naphthenic Acid at an Oil/Water Interface" Colloids and Interfaces 2, no. 3: 40. https://doi.org/10.3390/colloids2030040
APA StyleTaylor, S. E., & Chu, H. T. (2018). Metal Ion Interactions with Crude Oil Components: Specificity of Ca2+ Binding to Naphthenic Acid at an Oil/Water Interface. Colloids and Interfaces, 2(3), 40. https://doi.org/10.3390/colloids2030040