1. Introduction
Suspension rheology is a broad domain of soft matter science that studies flow properties of liquid-solid dispersions. Clay suspensions gained a lot of interest in the domain of granular and colloidal suspensions due to their unique properties, such as high aspect ratio, spatial chemical inhomogeneity, ion exchange capacity and swelling [
1]. Certain clays, for example bentonite, have found their broad applications in multiple industries, including pelletization [
2], filtration and purification [
3], medicine [
4], hydraulic barriers and radioactive waste disposal [
5]. Swelling and absorbing properties of bentonite justify its wide use. Bentonite (or montmorillonite) suspensions are often handled in mineral beneficiation [
6], drilling [
7], and mineral waste disposal [
8] processes.
Bentonite is an aluminum phyllosilicate clay, composed mostly of montmorillonite, classified as a dioctahedral smectite. Each particle of montmorillonite consists of sandwich-like sheets held together via the van der Waals force. A single sheet is constructed with three layers: an octahedral alumina layer sandwiched between two tetrahedral silica layers. The distance between the SiO
2-Al
2O
3-SiO
2 sheets is the order of 10 Å [
9] and can accommodate some water molecules and exchange cations such as K
+, Na
+, Ca
2+, Mg
2+ [
10]. Dominating exchange cation defines the extent and the reversibility of clay swelling. The highest swelling capacity is usually associated with the monovalent strongly hydrated interlayer cations of small ionic radius, such as Li
+ or Na
+. For theoretical explanations and modelling, bentonite particles are often approximated as rectangular sheets or disks. The nature of this mineral leads its spatial chemical inhomogeneity. The particle edge and face possess different chemical properties, and, thus, exhibit different physical properties [
1,
11].
Rheological behavior of aqueous bentonite suspensions depends on various parameters, including type of bentonite or Na
+/Ca
2+ ratio [
12], solid concentration [
12,
13], aging time [
12,
13], temperature [
14], pressure [
15] and solution chemistry [
11].
Once a bentonite particle is immersed in an aqueous salt solution, it gains a so-called electrical double layer (EDL)—an ionic structure built through the electrostatic attraction of ions to a charged particle surface. EDL can be divided into two parts: (1) fixed layer—ions densely adsorbed onto a surface of an opposite sign (also called Stern layer) and (2) a diffuse part—a loose cloud of ions and counter ions attracted from the bulk solution [
16]. An imaginary border that splits the EDL onto mobile and stationary parts is called a shear plane; it is thought to be situated in the diffuse part of the EDL. Isomorphous substitutions are responsible for charge occurrence on bentonite particle face. The face charge has greater influence on bentonite particle EDL than that of the edge. The EDL on the edge originates from the crystal lattice disruption and potential-determining ions attracted to broken chemical bonds [
11]. EDL of the edge strongly depends on the solution chemistry, in particular, solution pH. In acidic environment particle edge gains positive charge, whereas alkaline environment generates negative charge. On the other hand, the face remains negative along all the pH range. The pH corresponding to no net electrical charge on the shear plane is called an “isoelectric point” (IEP). It was proposed that the edges of sodium bentonite particles possess IEP around pH 7–8 [
17,
18]. Once the EDL repulsion is suppressed, the resulting particle-particle interaction is governed by the van der Waals force, causing particles to attract, according to the DLVO (Derjaguin–Landau–Verwey–Overbeek) [
16] theory.
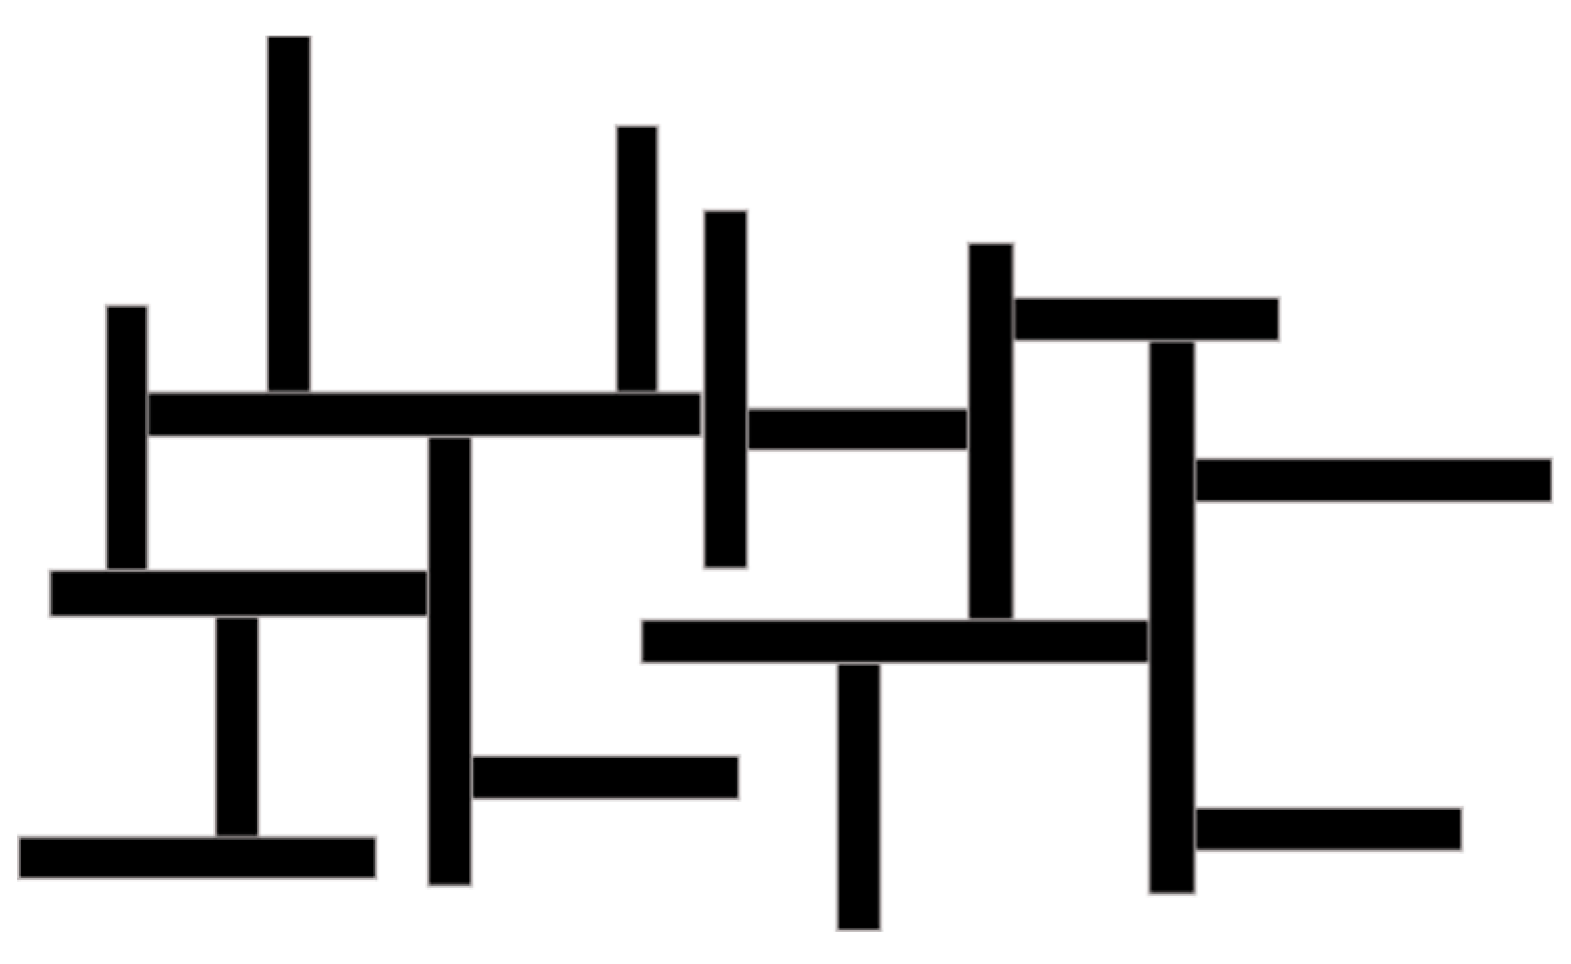
Opposite charging of bentonite particle edges and faces in aqueous suspensions laid the foundation of the charge-based structuring theories. In sufficiently concentrated bentonite suspension, particles are situated close enough to interact with each other. In this case, they organize in a way that oppositely charged particle sites attract while similarly charged sites repel. In an acidic suspension, such organizations result in a structure that was described as “cubic card house” [
19] (
Figure 1) used to explain the gel formation in bentonite suspensions.
There are several other particle association models suggested to justify the bentonite gel formation (e.g., [
20]); but the “card house” appears to be the most firmly established. In the card house structure, the “edge-to-face” (E-F) particle association is dominant. “Edge-to-edge” (E-E) accompanied by E-F particle association becomes highly probable at the IEP of the edges. In suspensions with moderate alkaline pH, all particle sites are negatively charged and mutually repel, and thus no structure will be formed [
21]. On the other hand, there are reports suggesting repulsion-promoted E-F arrangement in highly alkaline environment [
17]. Arrangement of “face-to-face” (F-F) type is predominantly associated with double layer compression at high salt concentrations [
11,
21]; it was also reported to be pH-independent [
18]. These association models were employed to explain the difference in rheological behavior of bentonite suspensions under various chemical environments. It was found experimentally that the suspensions exhibited higher shear stresses and yield stresses in the acidic pH below IEP, than in basic pH above IEP [
17,
21]. Also, several studies showed the general trend of lower shear stresses and yield stresses corresponding to increased ionic strength of the solution [
12,
22]. Rheological studies of bentonite suspensions infrequently consider the ionic radius of salt cation, despite its importance.
Thixotropy is another feature of bentonite suspensions linked to the particle structuring. Tadros [
23] defined thixotropy as a reversible time-dependent decrease in viscosity that results from: (a) a spatial rearrangement of molecules or particles in a non-Newtonian system or (b) change of the structure in the system, under an applied shear. Once the yield stress of the internal structure is exceeded, it collapses and the suspension flows. Its recovery does not happen instantaneously after the load is removed, resulting in a modified rheological response for some time. That temporary change of the rheological behavior is usually characterized with the hysteresis in the flow curve. Tombácz and Szekeres [
21] estimated the highest thixotropic loop area corresponding to their lowest tested pH (i.e., pH 5, within the range of pH 5–8).
Swelling of bentonite clay is a property that is characterized with a certain kinetics that affects the rheological behavior of the suspension. Aging time is a period during which the bentonite is exposed to the excess water available for the inter-sheet hydration and physicochemical transformations. Thixotropy and the yield stress of bentonite suspensions can enhance with aging time [
11,
12]. It was reported that the major changes occurred within first 24 h while later the transformations were less significant [
12,
13,
24]. It is common to use Bingham or Herschel–Bulkley rheological models to describe the flow behavior of bentonite suspensions [
11,
25].
Most studies listed above used global rheology alone to characterize mechanical properties of bentonite suspensions. On the other hand, for the fluids that are characterized with non-linear behavior or perturbation effects, it is useful to investigate the local rheology. Acquiring velocity profile at a controlled stress distribution allows to assign a local stress to a local velocity and deduce a constitutive law of the matter on the local scale [
26].
Nowadays, different scattering and signal attenuation techniques aimed to extract the velocity field in flowing matters have become available. Among many others, magnetic resonance imaging (MRI) velocimetry gained popularity in the field of mechanics of complex fluids, as a technique based on direct excitation of materials’ constituents. MRI is non-destructive and non-invasive, suitable for non-transparent matters technique based on nuclear magnetic resonance (NMR) spectroscopy. The theory behind NMR spectroscopy and MRI velocimetry can be found elsewhere [
26,
27].
MRI velocimetry can be used to recover the velocity distribution in the gap of the concentric cylinder geometry. In a steady Couette flow, the shear stress (τ) on an inner rotating cylinder is related to the torque (T) via
where R is the radial distance from the axis, and h is the immersed heights of the cylinder. The torque on the inner cylinder is extracted from the global rheological measurement. Local shear rate
(R) is obtained from MRI velocimetry, as a function of measured local velocity (V):
Combining the above data allows to access local rheology.
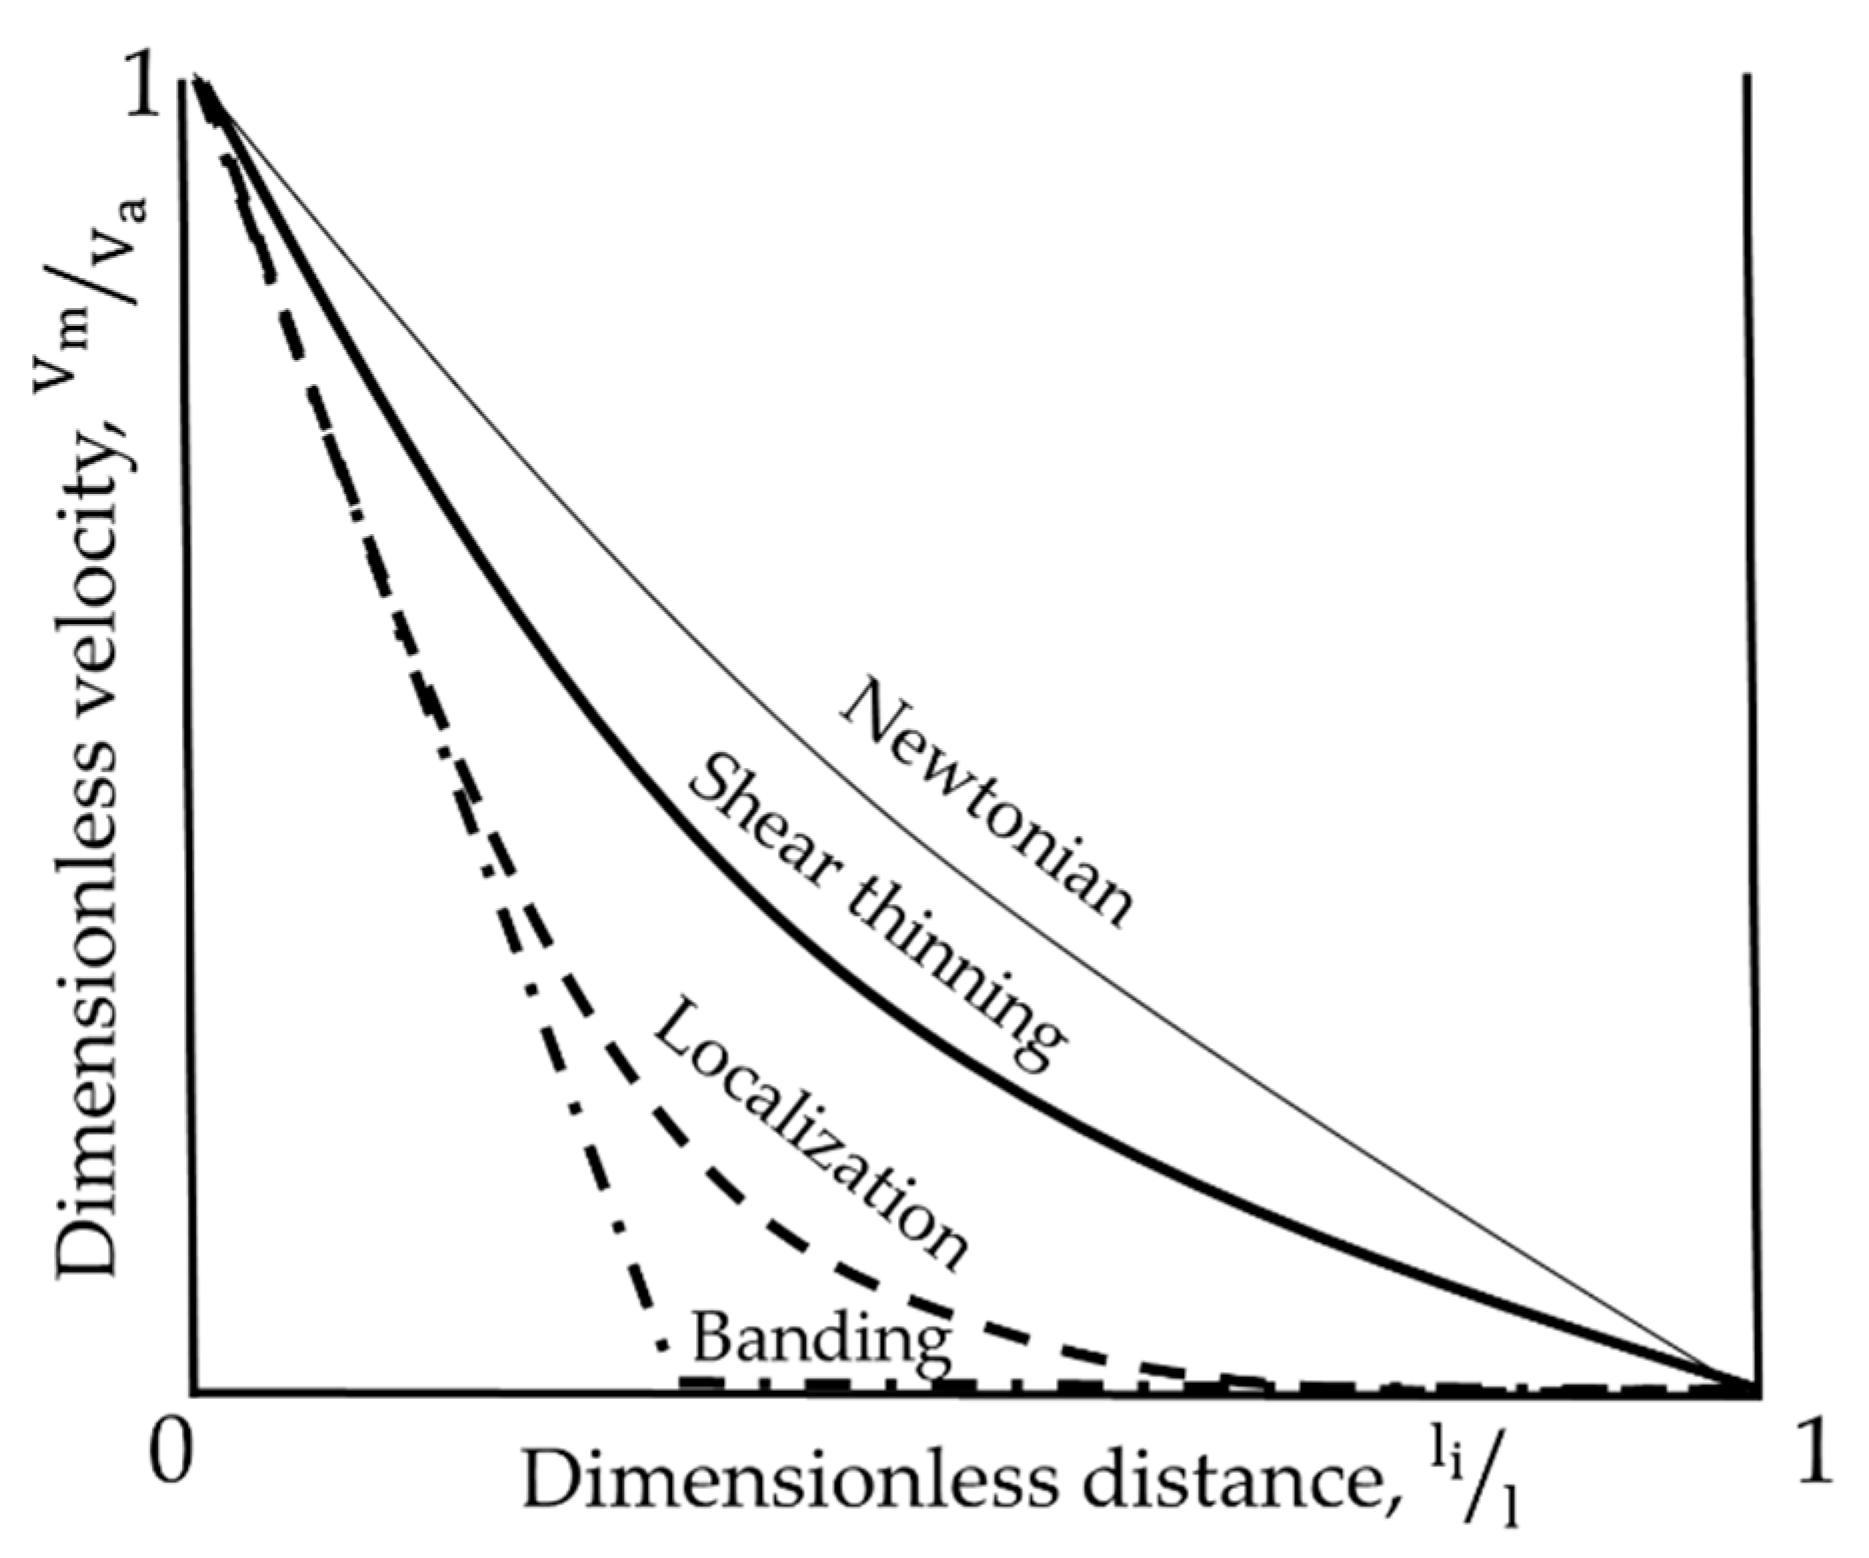
Some typical velocity profiles recovered in the gap of the rotational rheometer are depicted in
Figure 2. Thick solid line corresponds to a profile expected for a Newtonian fluid in a wide-gap Couette geometry, where the ratio of internal to external cylinder radii is smaller than one. The thin solid line corresponds to a shear thinning fluid, dashed line represents “localization”, and dash-dotted line—“banding”. Banding and localization are yield stress fluid phenomena, whose distinctive feature is simultaneous coexistence of flowing and static zones of material. There is some controversy over the definition of banding in literature, thus its signification and definition will be specified below. It was suggested [
28,
29] that the major difference between banding and localization concerns the manner of shear and stress distribution at the interface between solid and flowing regions.
Banding is a discontinuity in a sheared complex fluid, characterized with the coexistence of two adjacent regions with different velocities (shear rates,
) but insignificantly different shear stresses (τ). The shear rate on one side of the interface between the regions equals to the critical shear rate (
), and on the other side it is zero, with τ ≈ τ
c (with τ
c being a yield stress) for both sides. The banding effect was found in pastes [
30], micellar solutions [
31], emulsions [
32], gels [
33]. Localization is characterized with the coexistence of flowing and static regions due to continuous spatial variation of both, velocity (shear rate) and shear stress. The value of shear rate progressively decreases from some finite value to zero, where the flow stops. In a Couette cell, due to the character of shear stress distribution, the fluid flows until the value of stress at certain distance from the rotating cylinder falls below τ
c, and then the flow stops. Ideally, corresponding transition between the different velocity regions (smooth for localization and abrupt for banding, see
Figure 2) should be distinguishable at any scale of observation that is large enough to respect the continuum equation. More detailed information about banding and localization phenomena can be found in [
29,
34,
35]. Experimental techniques used to access these local phenomena are well summarized in [
36].
In the absence of MRI velocimetry, one can recover local flow information by processing the output of conventional rheometric measurement alone. In a Couette cell, where the shear stress distribution is well-known, local shear rate at the inner cylinder can be recovered. This method was described in [
26,
37] and successfully applied by [
28,
38]. It suggests the summation of successively decreasing torques differing one from another by k = R
int2/R
ext2, where R
int is internal and R
ext is external cylinder radii of the Couette geometry. This allows the elimination of shear rate on the external cylinder at each summation step, see Equation (3),
where Ω is the angular velocity.
Once computed shear stress falls below the yield stress, the summation stops. The method has shown to give accurate predictions for some localizing fluids but must be treated with caution when material slippage occurs [
26]. Some aspects of local rheological behavior of bentonite suspensions with modest to high solid concentrations were reported in the past. Coussot et al. [
39,
40,
41], for example, indicated the velocity bifurcation and dependency of suspensions’ local properties on the time of rest following the load. Roussel et al. [
42] studied the validity of thixotropy modelling under different flow conditions at different scales (local and global). Raynaud et al. [
43] monitored behavior of bentonite suspensions in transient flows, fluid restructuring under the load and at rest. They demonstrated the dependency of steady state on the flow history and suggested that simple power-law approximation of the flowing region is appropriate.
The aim of this study, on the other hand, was to apply the MRI velocimetry to dilute bentonite suspensions to study the linkage between the solution chemistry and the local rheological performance. To the authors’ best knowledge, there is yet no study in this regard. In the first place, the difference in velocity profiles of bentonite suspensions prepared under different chemistry was discussed and explained from the perspective of electrostatic interactions and particle structuring. Scanning electron microscopy was applied to visualize structural differences in those suspensions. Secondly, the rheological curves obtained using different means were compared and discussed. Finally, the question of existence of a master curve (or, otherwise, global flow curve) for each type of suspension was addressed.
2. Materials and Methods
Dilute (0.1 vol.%) suspensions were prepared using the Kunipia-F sodium bentonite (Kunimine Industries Co., Ltd.). The average size of the bentonite particles was measured using Mastersizer 3000 (Malvern). The particles were suspended in aqueous salt solution (1 × 10⁻² M KNO3) at pH 10, and soft ultrasound was applied to disperse the particles. Measurement yielded an average particle size of 0.5–1 µm (≈ face diameter). For the MRI velocimetry and conventional rheological measurements, suspensions were prepared using 1 × 10⁻² M KNO3 or NaCl aqueous salt solution made with demineralized water. After introducing the solids to a salt solution, 5 min agitation with magnetic stirrer was applied, followed by the pH adjustment. The sample was then agitated with a magnetic stirrer for additional 15 min, and the pH adjustment was repeated. The pH of suspensions with KNO3 was regulated using HNO3 or KOH, while pH of suspension with NaCl was regulated with HCl. Once the desired pH value was achieved the sample was left to age. After 48 h, the pH was measured and adjusted one final time. Four bentonite suspension samples were prepared for the tests: pH 4, 8 and 10 in 1 × 10⁻² M KNO3 solution and pH 4 in 1 × 10⁻² M NaCl solution.
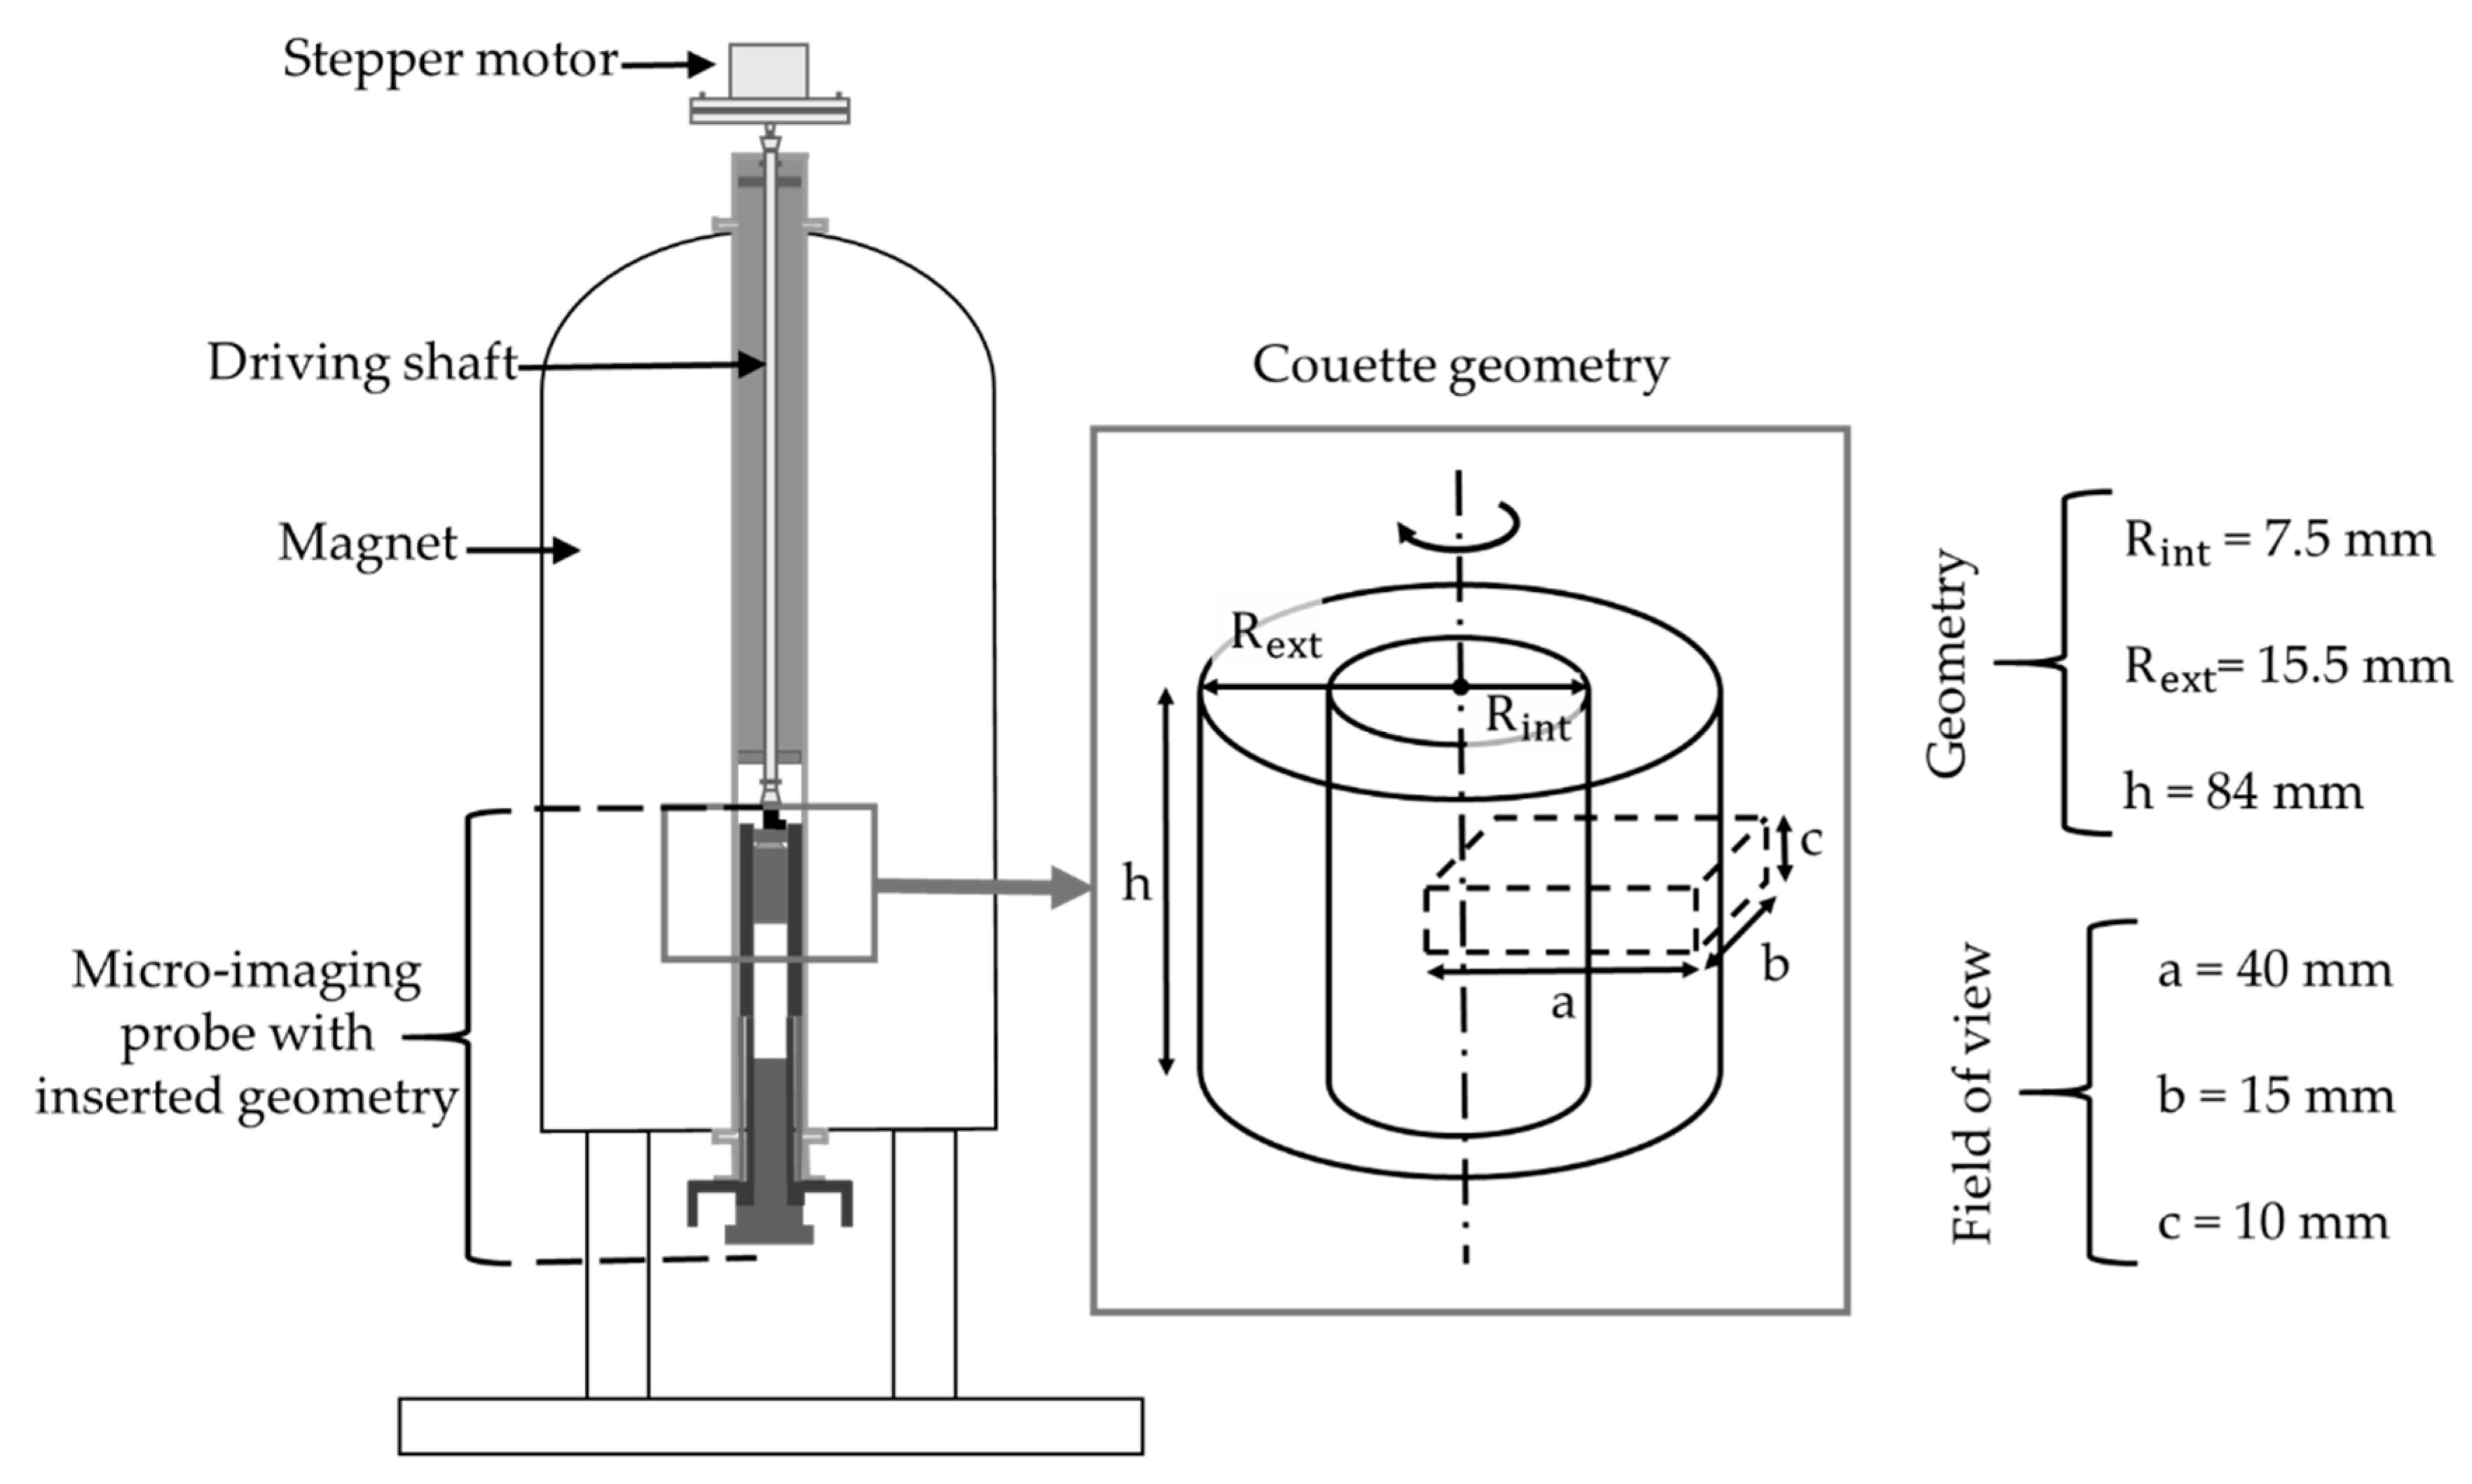
The velocity profile acquisition was carried out with Bruker Avance III 600 wide bore spectrometer (14.1 T, 600 MHz proton resonance frequency) coupled with Rheo-NMR accessory from Magritek. The setting with indication of its major elements is given in
Figure 3. Micro-imaging probe (MicWB57) was a 40 mm quadrature resonator manufactured by Bruker, with 45 G/cm gradient system. Image acquisition was performed using the flow encoding spin-echo sequence.
Concentric cylinder geometry with radial dimensions of internal (R
int) and external (R
ext) cylinders, and immersed heights (h) was used to conduct the measurement (see the insert of
Figure 3). The inner cylinder of the geometry was roughened with glass beads of 150–250 μm diameter to prevent slipping. The field of view with the length (a), width (b), and section thickness (c) was analyzed (see
Figure 3). Matrix of 512 × 64 pixels allowed the velocity profile spatial resolution of 78 µm. Only one side of the cell was analyzed as the profile symmetricity was assumed. The estimated error of a velocity measurement with our MRI velocimetry was 5%.
In this work, there was no opportunity to conduct MRI velocimetry and rheometry simultaneously in one machine; thus, the torque measurements were performed separately, using the AR 1000 rheometer (TA Instruments) assembled with the Couette geometry identical to the one used for MRI experiments. Steady state measurements were conducted for the range of angular velocities increasing from 1 × 10
−3 to 100 rad/s. The rheometer was equipped with Rheology Advantage software that used Equation (4) to calculate the shear rate from the angular velocity.
where
= (R
ext2 + R
int2)/(R
ext2 − R
int2).
Throughout whole experimental program the pH deviation from its initial values was carefully monitored and controlled; the deviation was found to be negligible. Swelling after 48 h (included in sample preparation) was significantly limited as agreed with literature [
12,
13,
24]. The evaporation was prevented by sealing the sample container with plastic paraffin film during its storage period. Temperature was set to 20 °C and did not deviate significantly from this value for all conducted measurements. It was ensured that each sample has same shear rate history prior to the measurements.
Scanning electron microscopy (SEM) images of all four suspensions were taken using TESCAN VEGA3 SEM system. One drop of each suspension was placed on an Al sample stub and left to dry over the night at room temperature. The dried sample was then carbon-coated and placed in the TESCAN VEGA3 chamber. Secondary electron (SE) detector was used to image the samples.
3. Results
Dimensionless velocity profiles for the suspensions with different solution pH in 1 × 10
−2 KNO
3 are shown in
Figure 4. In all cases given below, the dimensionless velocity represents the ratio of the applied velocity to the velocity measured through MRI. The solid line on the images corresponds to a velocity profile expected for a Newtonian fluid in a wide-gap Couette cell.
The wall slip could not be fully prevented and is estimated to cause the velocity loss up to 10–15% (maximum) from the imposed value (
Figure 4). A sharp slope discontinuity (banding) at low velocity was observed only in suspension with pH 4 (
Figure 4a) and not pH 8 (
Figure 4b) or 10 (
Figure 4c), with the same solid volume fraction.
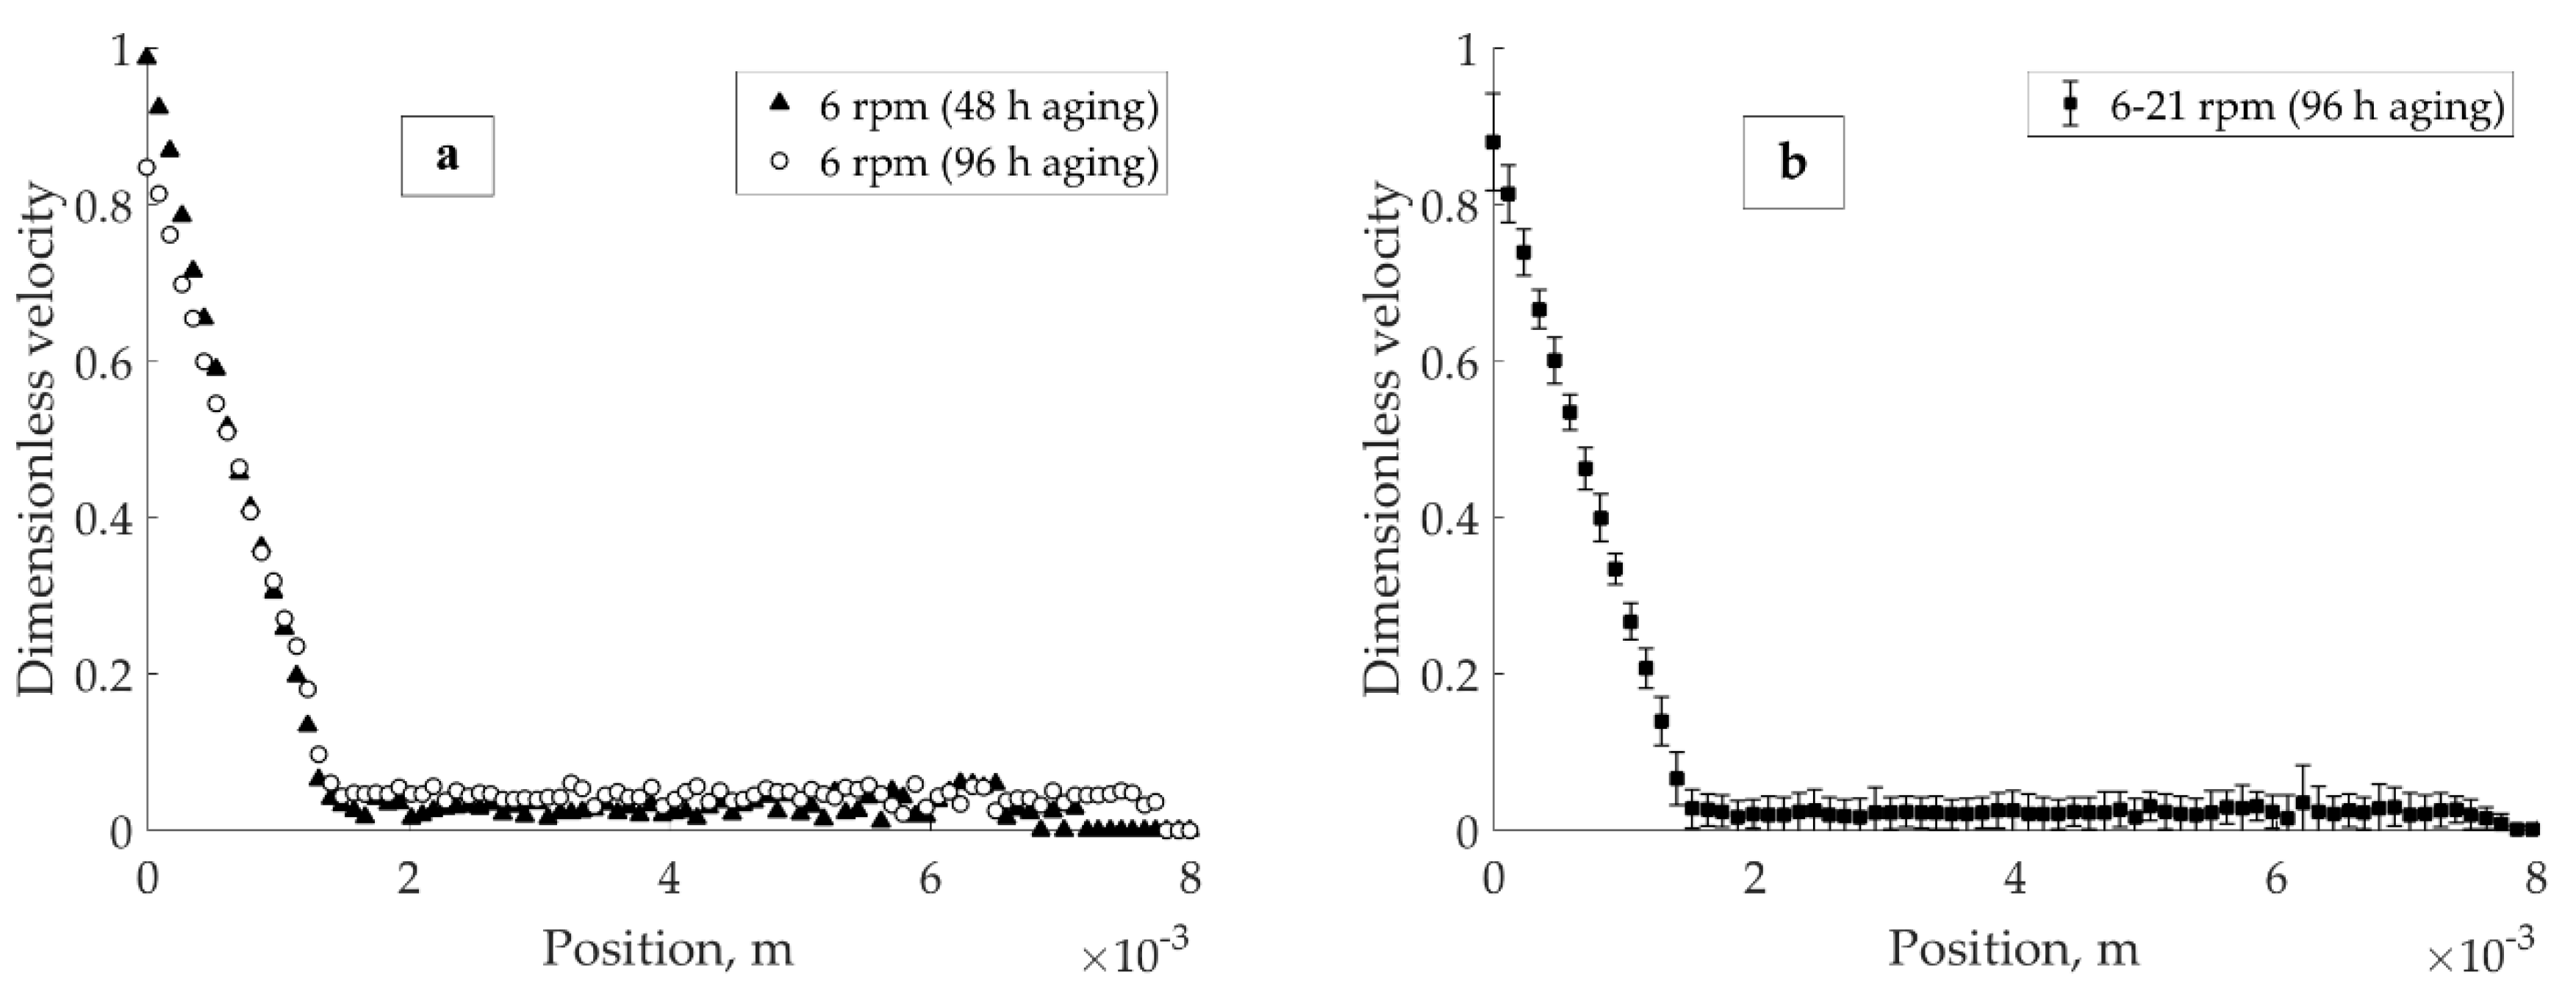
It is a coherent question whether banding is established as a stationary phenomenon. The pH 4 in 1 × 10
−2 M KNO
3 suspension was tested after 48 and 96 h of aging (
Figure 5a). As shown in
Figure 5a, there was no significant influence of aging time on the positioning of the banding point after the first 48 h of exposure to the aqueous salt solution. The apparent slip corresponding to the 96-h curve is a sequence of instrumental-related uncertainty in the proximity of the inner cylinder. The stationarity of banding under the load for the 96-h aged pH 4 in 1 × 10
−2 M KNO
3 suspension was investigated in the 6–24 rpm range of applied velocities (
Figure 5b,c).
Figure 5b shows the average of 14 velocity profiles collected during 2.5 h of experiment, after 96 h aging in total. The applied velocities were 6, 9, 12, 15, 18, and 21 rpm, with the minimum of two acquisitions (at 5 and 20 min) performed per each applied velocity. As seen from the standard deviation, these profiles exhibited minor difference. In other words, the location of the banding point in the gap did not change within the 6–21 rpm velocity range.
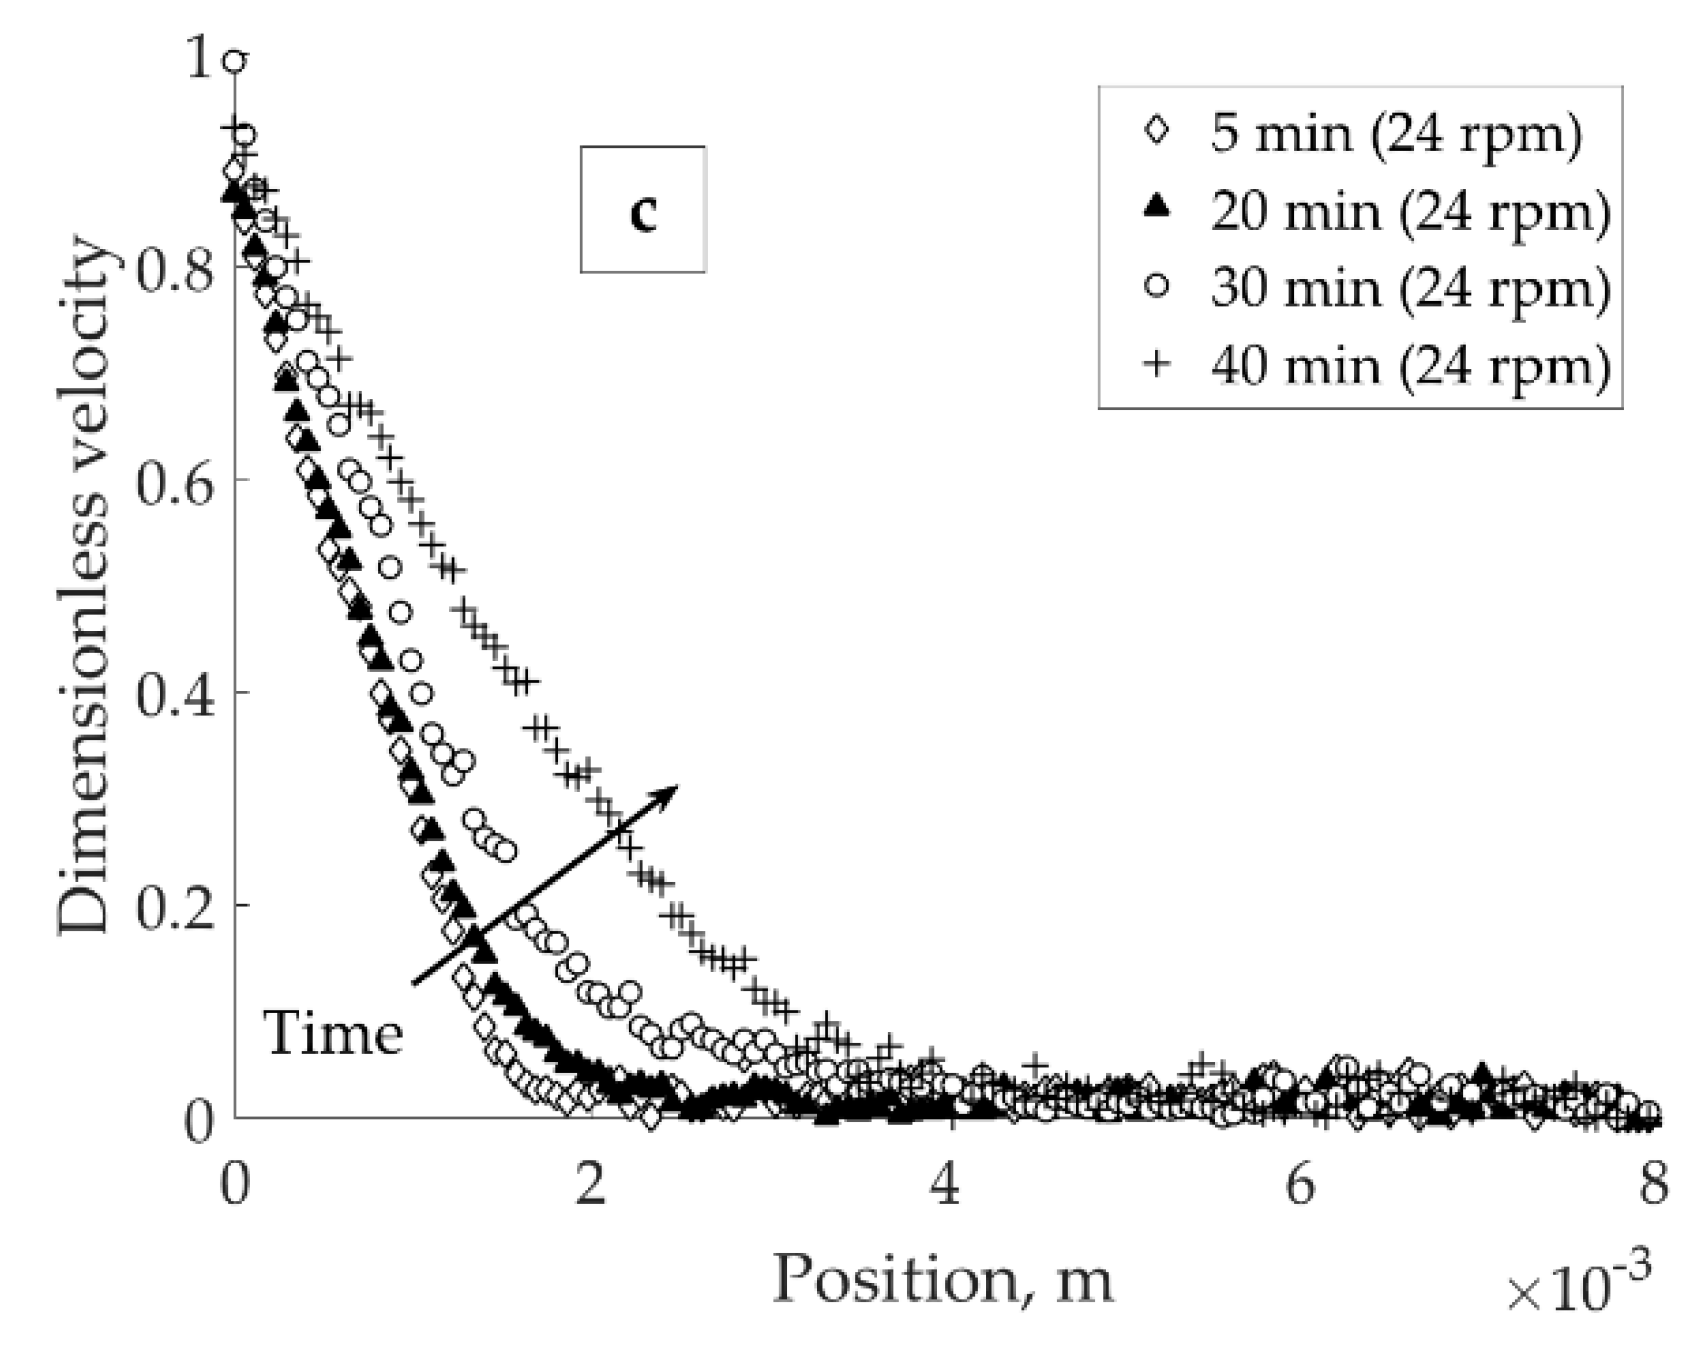
Figure 5c demonstrates the establishment of a stationary localized profile for the 96-h aged pH 4 in 1 × 10
−2 M KNO
3 sample. Upon increasing the applied velocity from 21 to 24 rpm, the conditional border between the solid and liquid regions lost its sharpness. The interface between solid and liquid regions advanced towards the external cylinder wall until a stationary localized profile (i.e., 40 min (24 rpm),
Figure 5c) was established.
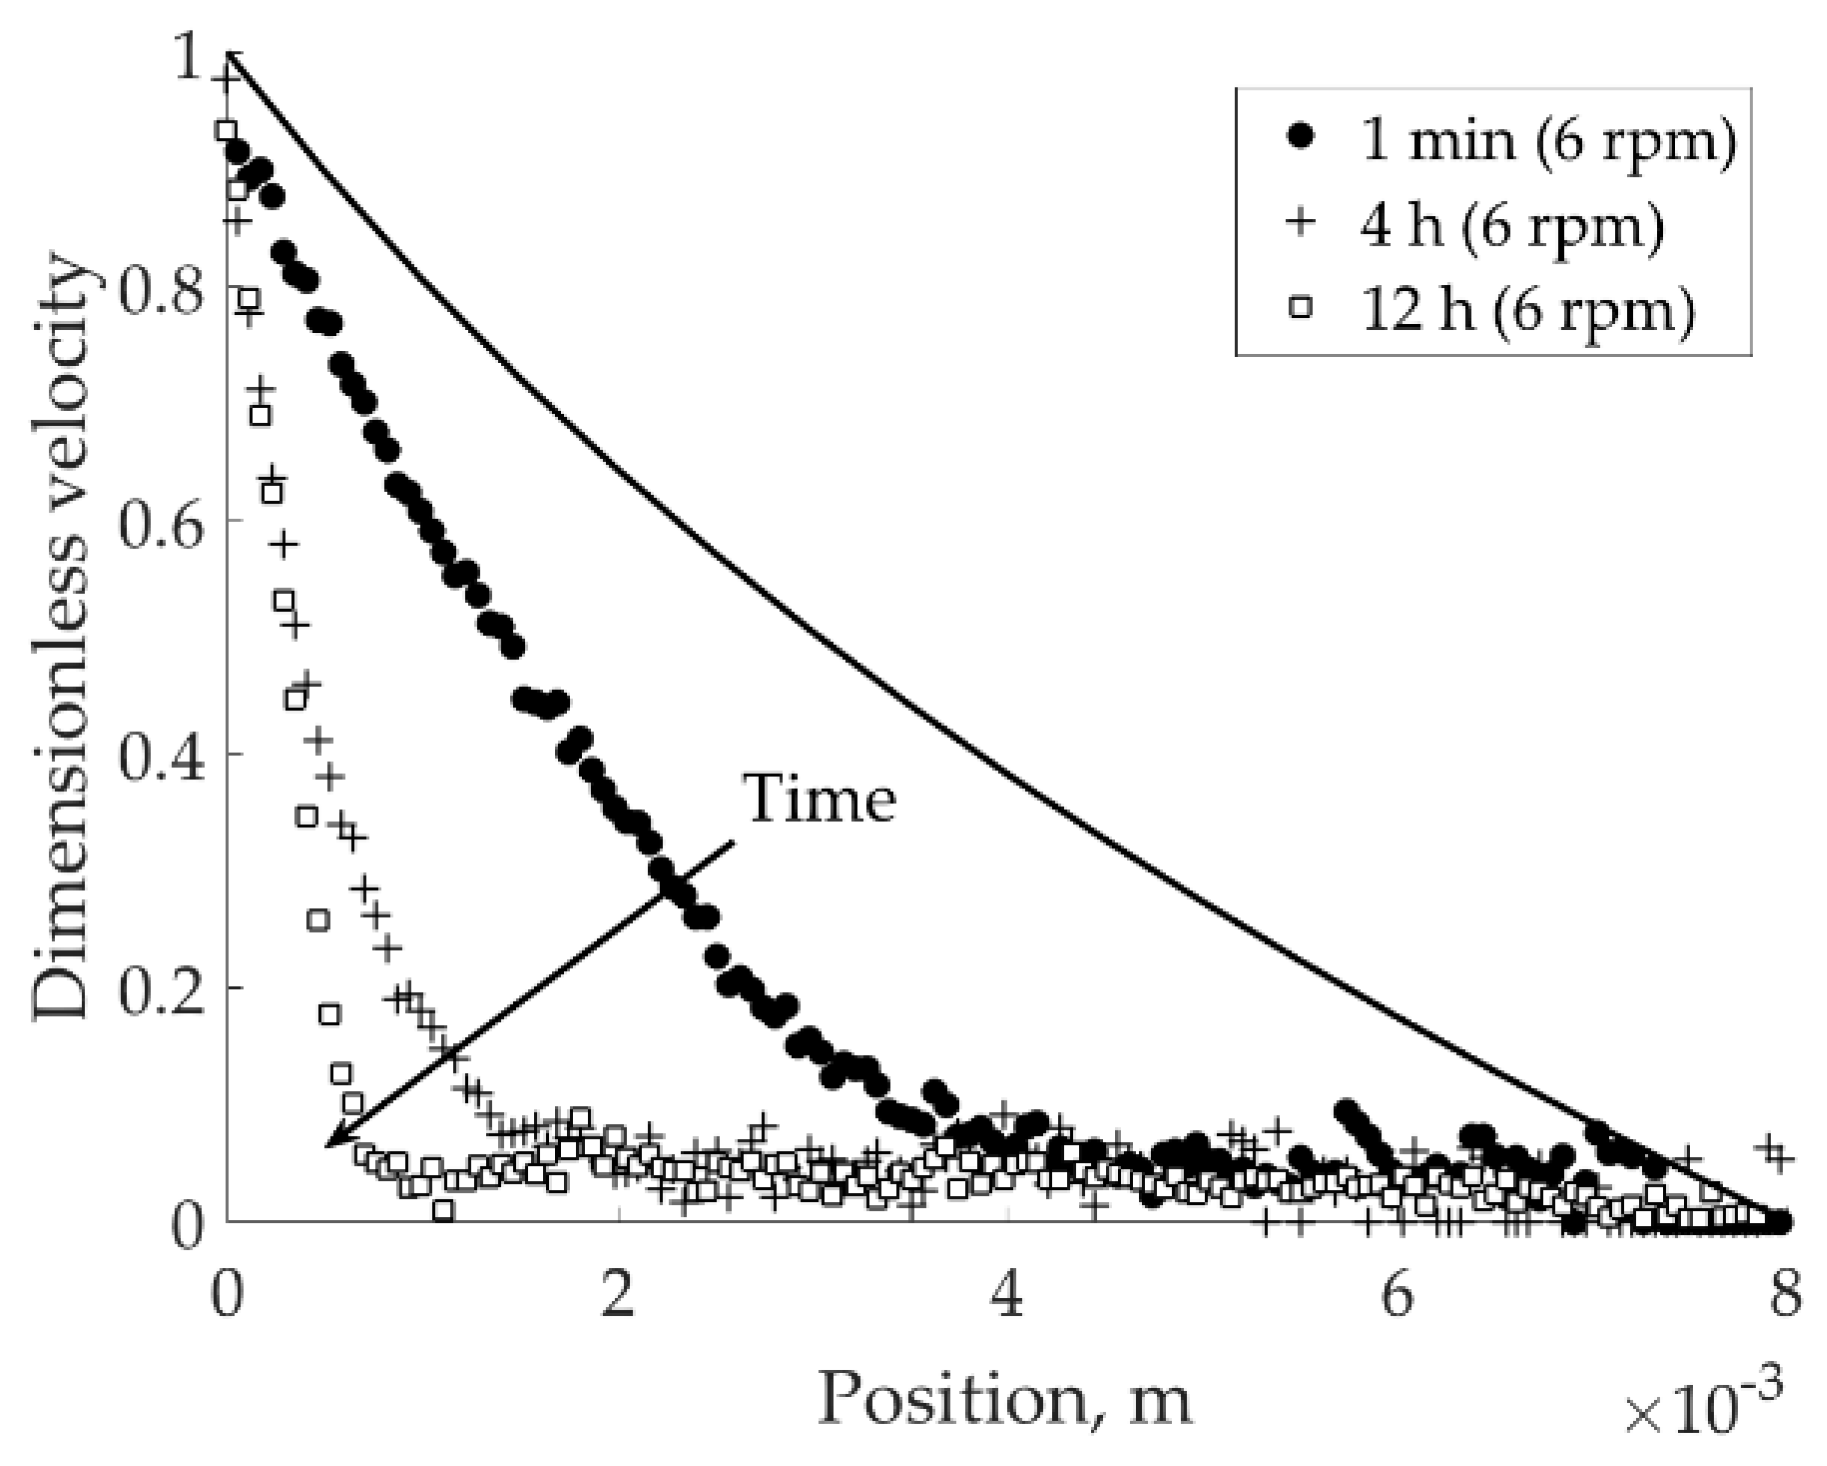
To observe the recovery of the network under mild load after the breakage, the pH 4 in 1 × 10
−2 M KNO
3 bentonite suspension was subjected to high-speed agitation (27 rpm) followed by an immediate velocity decrease to 6 rpm. The network recovery process was investigated during 12 h at the constant applied velocity of 6 rpm (see
Figure 6). The location of banding points found from network recovery tests (0.7 × 10
−3 m,
Figure 6) and shearing the original suspension (1.5 × 10
−3 m,
Figure 5a) mismatched.
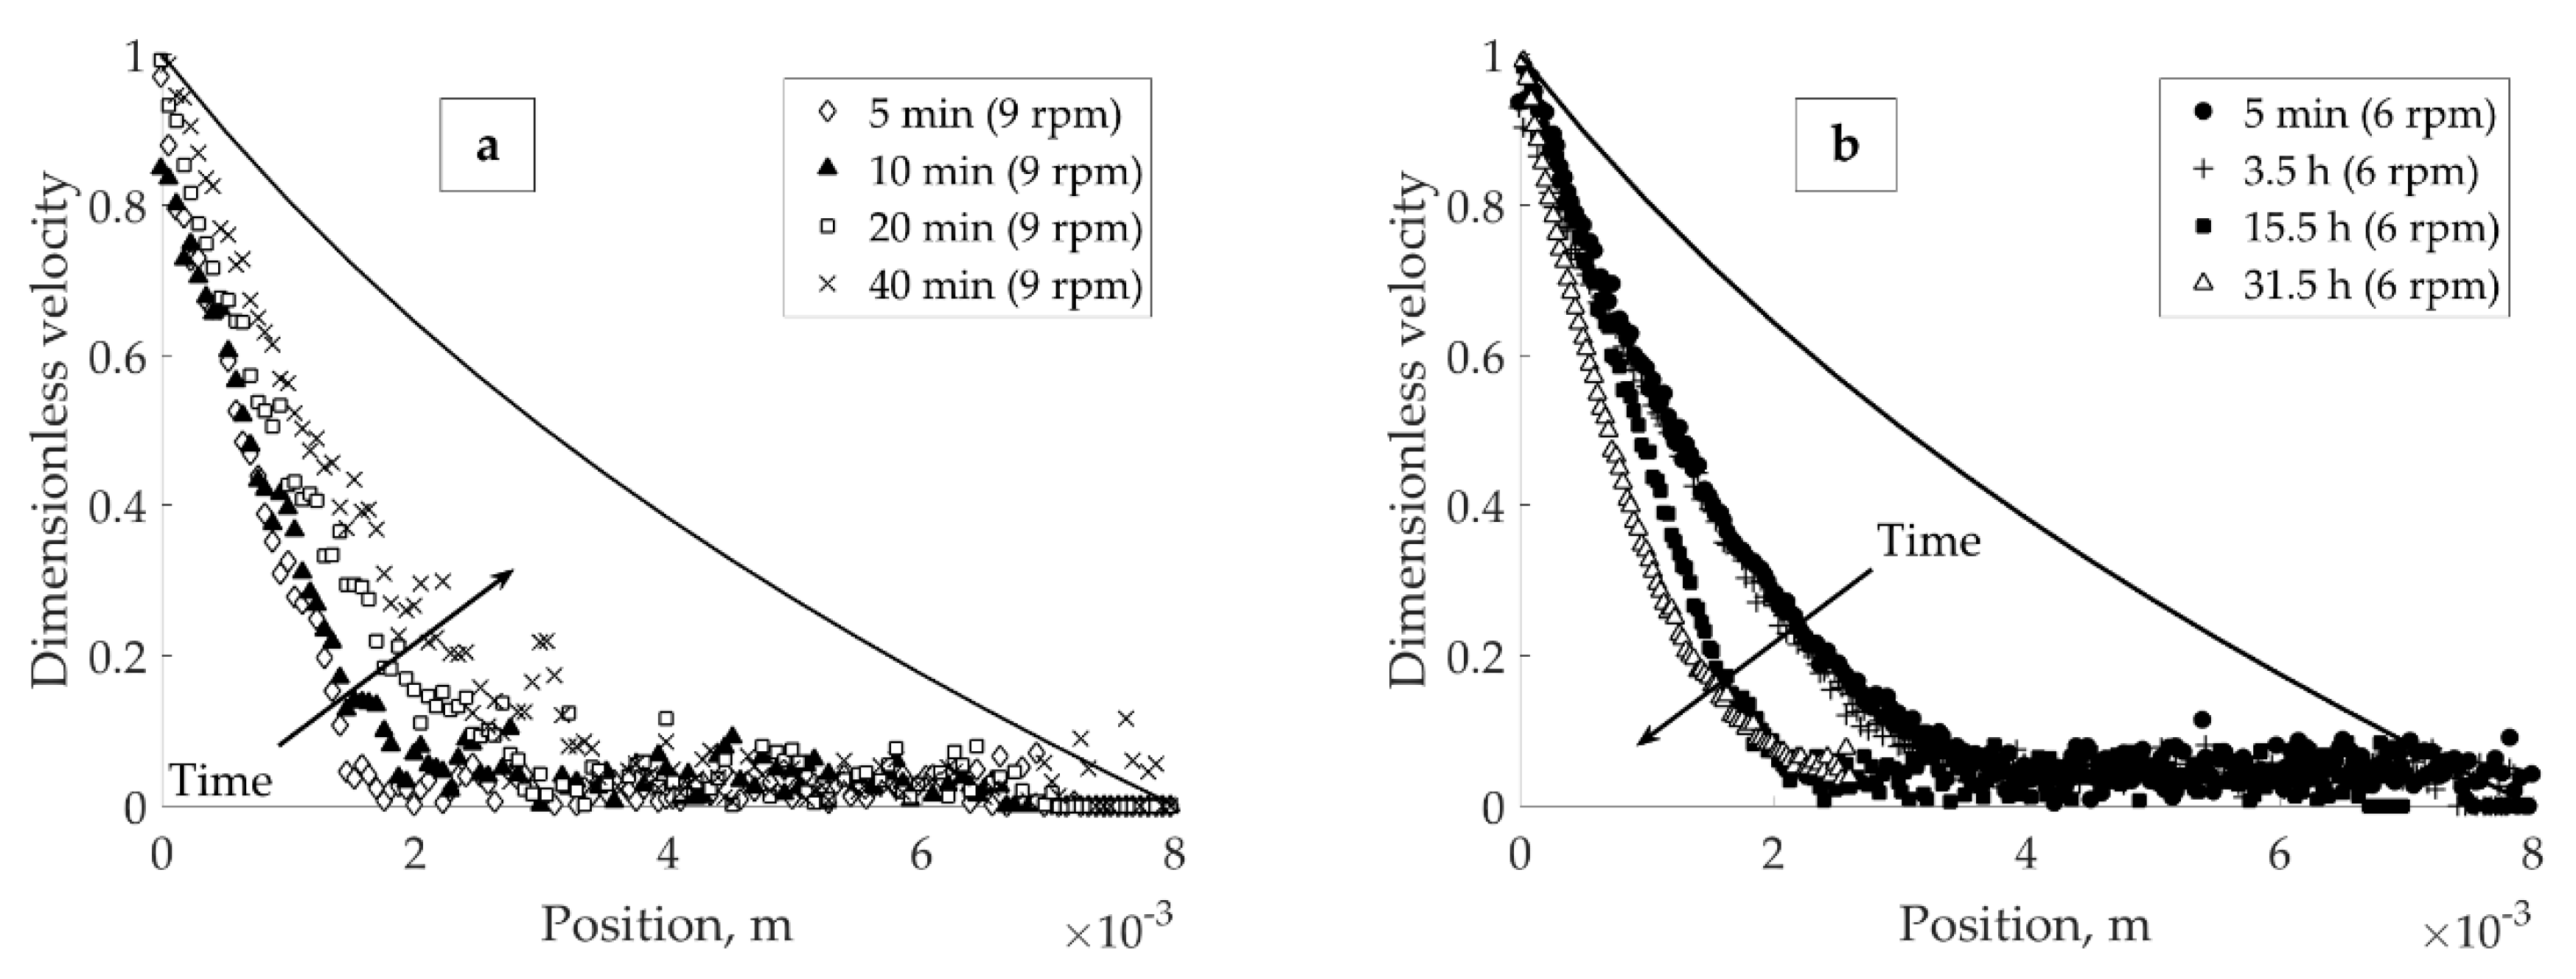
Suspension at pH 4 in 1 × 10
−2 M NaCl was subjected to a constant load of 9 rpm for 40 min, to investigate the effect of salt type on suspension flow behavior. It was found that the stationary state for this sample at low shear rate is rather localization than banding (see
Figure 7a). The interface between solid and flowing regions lost its sharpness already after 10 min of the experiment; after 40 min the stationary localized profile was recorded (40 min (9 rpm),
Figure 7a). Furthermore, agitating the suspension 27 rpm and leaving it to recover the network at 6 rpm during 31.5 h resulted in the recovery of a localized profile (
Figure 7b).
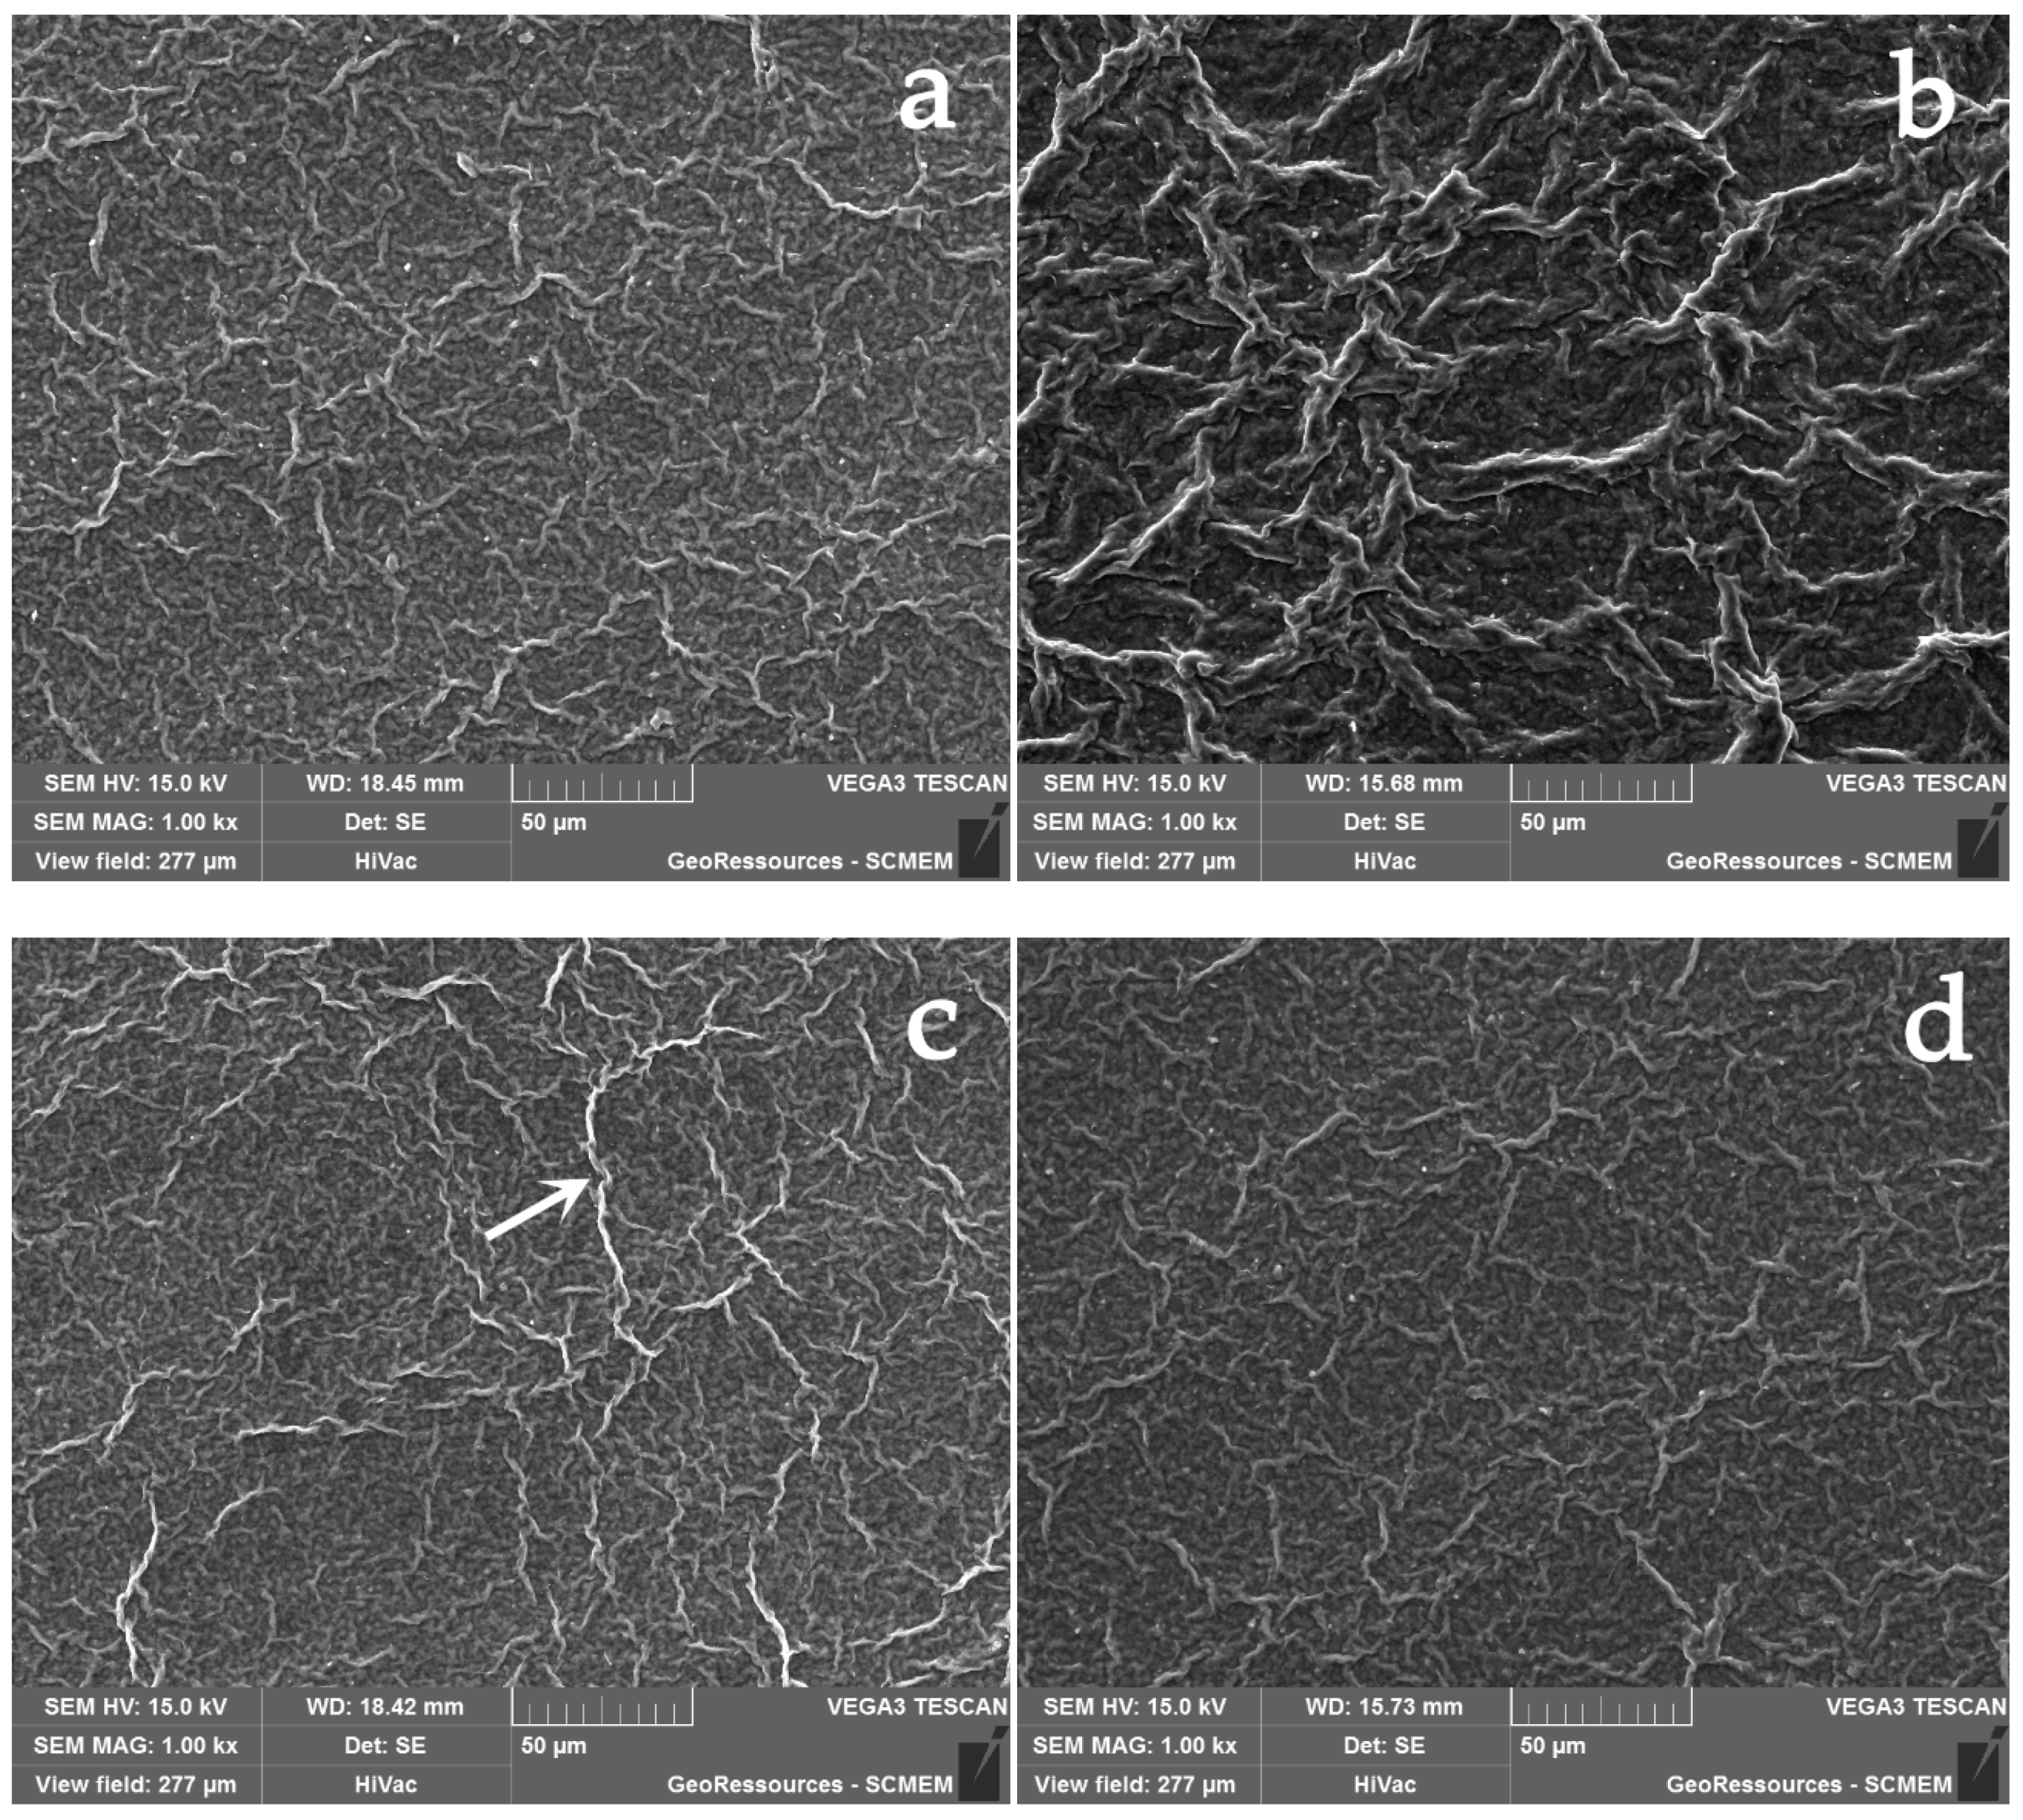
SEM was used to visualize the differences between the networks formed in suspensions prepared under different chemistries. The SE images of all four samples are given in
Figure 8. The observed structures represent the organization of particle aggregates in different chemical environments.
It can be observed that the aggregate networks formed in different salt solutions (KNO
3 in
Figure 8a, and NaCl in
Figure 8b) were noticeably different in size. Thicker aggregates were obtained with NaCl-based bentonite suspension at pH 4. At pH 8 and 1 × 10
−2 KNO
3 bentonite suspension, some long chains of aggregates were identified, an example of such chain is indicated with an arrow on
Figure 8c. No significant particle network differences between the suspensions at pH 4 (
Figure 8a) and 10 (
Figure 8d) in 1 × 10
−2 M KNO
3 were observed up to 5000 times magnification.
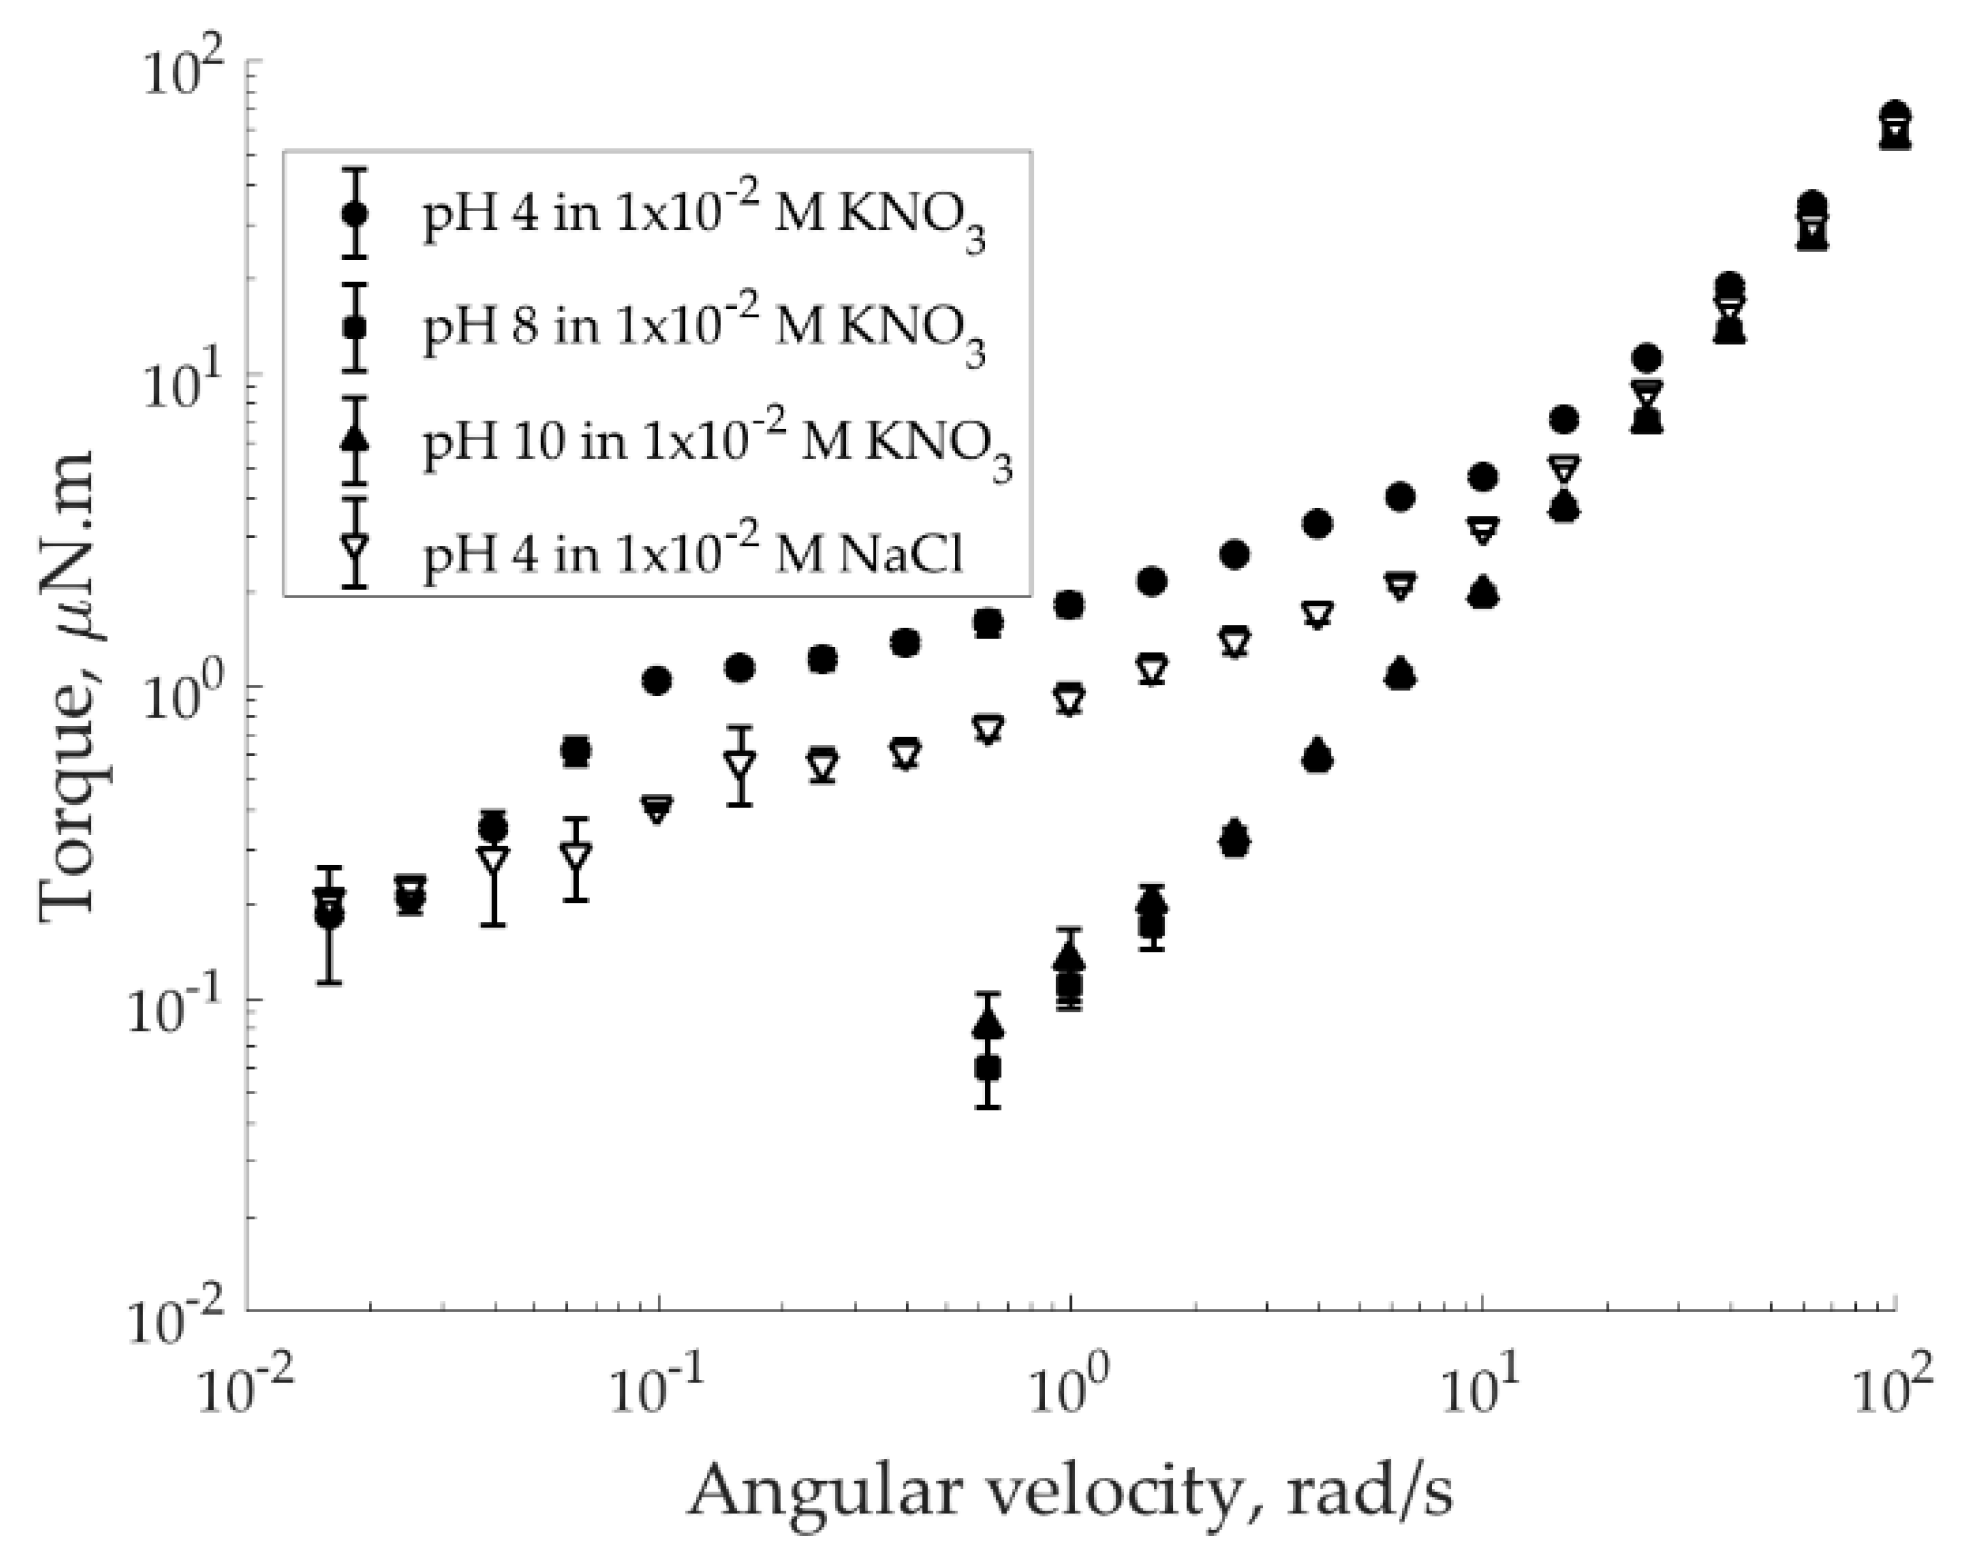
To deduce the local rheology, we accessed to the global rheological data (
Figure 9), which in this study was collected using a regular rotational rheometer. The seeming inconsistency of pH 4 suspensions behavior in low shear rate range (below 0.1 s
−1) can occur due to the transient flows. It was also suggested that such inconsistency may occur due to the wall slip, as it happens, for example, in the suspensions of synthetic swelling laponite clay, see work of Divoux et al. [
45].
Two methods were used to obtain the local rheology of the suspensions. The first one requires only measurement with a conventional rheometer [
26,
28,
37,
38]. The second method uses MRI velocimetry (e.g., [
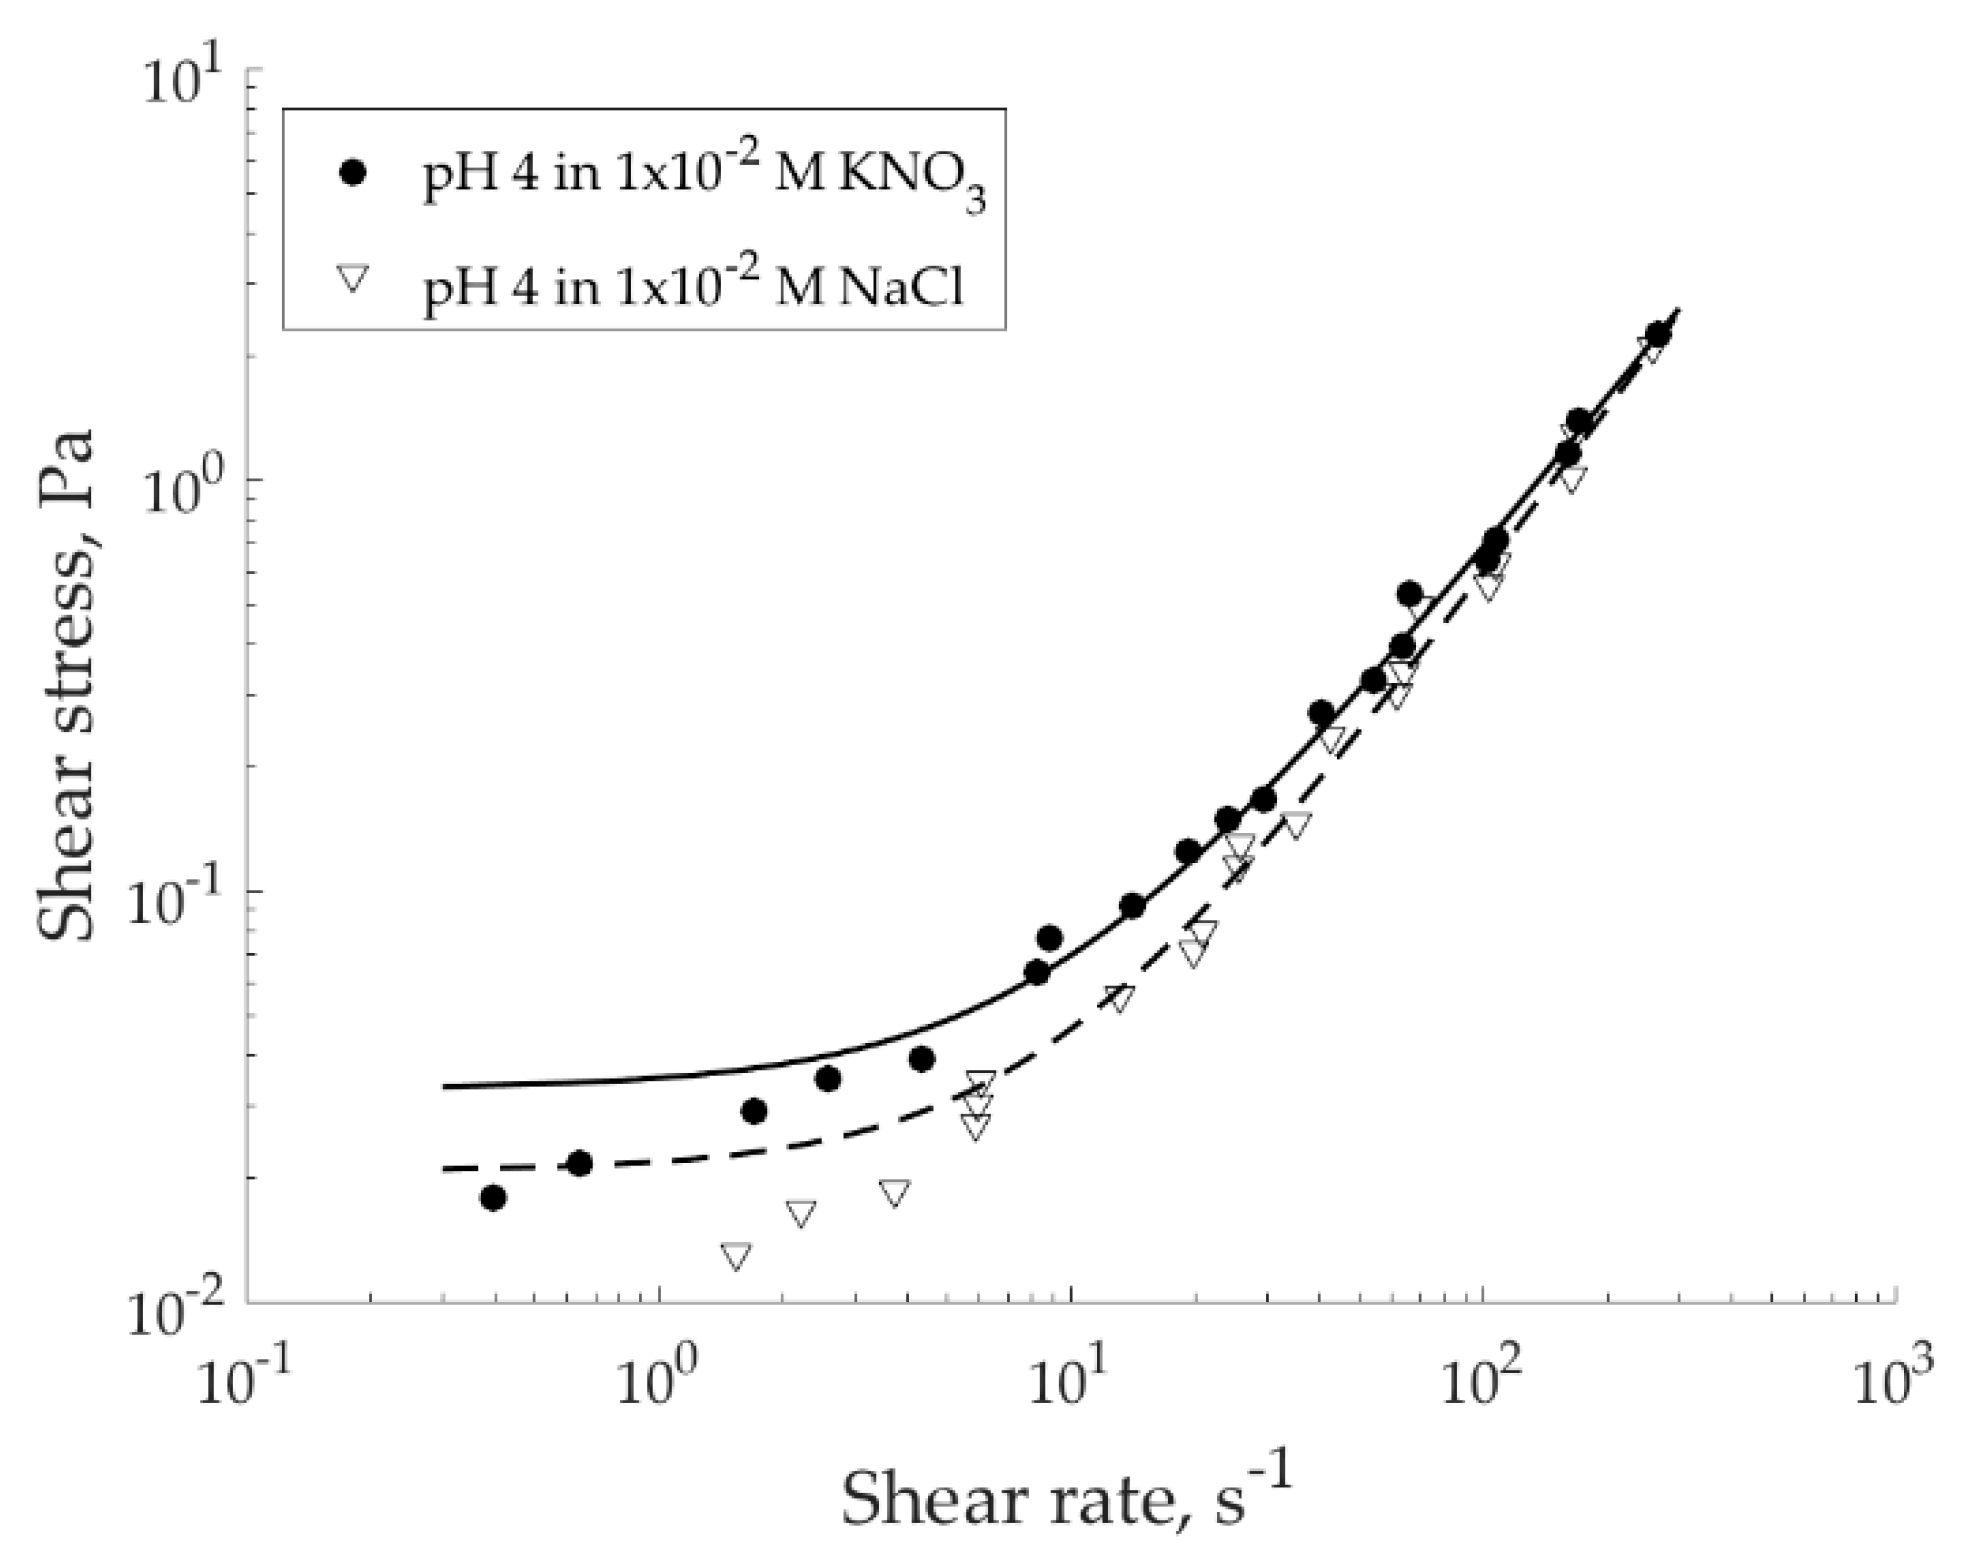
28]). For the first method, the procedure summarized in Equation (3) allows to compute the local shear rate on the inner cylinder of a Couette geometry and assign a value of shear stress calculated by Equation (1) to this spatial point. This method was applied to treat flow curves of viscous pH 4 suspensions, which are characterized with pronounced yield stress (see
Figure 10). The calculation outcome was fitted with the Herschel–Bulkley model, Equation (5).
where κ is the consistency index and n is the flow index.
Local shear rates calculated using the model, Equation (3), and bulk shear rates provided by the rheometer are of the same order of magnitude at high applied velocities (not depicted); at the low velocities, these shear rates significantly differ. The model suggests that apparent shear rates obtained from the rheological measurement are underestimated. Such result makes sense in localized or banded flows in a Couette cell. This method is applied when MRI velocimetry is not available and has limited application in case of material slippage. To investigate how much the slippage perturbed the shear rate estimation using Equation (3), the result was compared with the one obtained using MRI velocimetry.
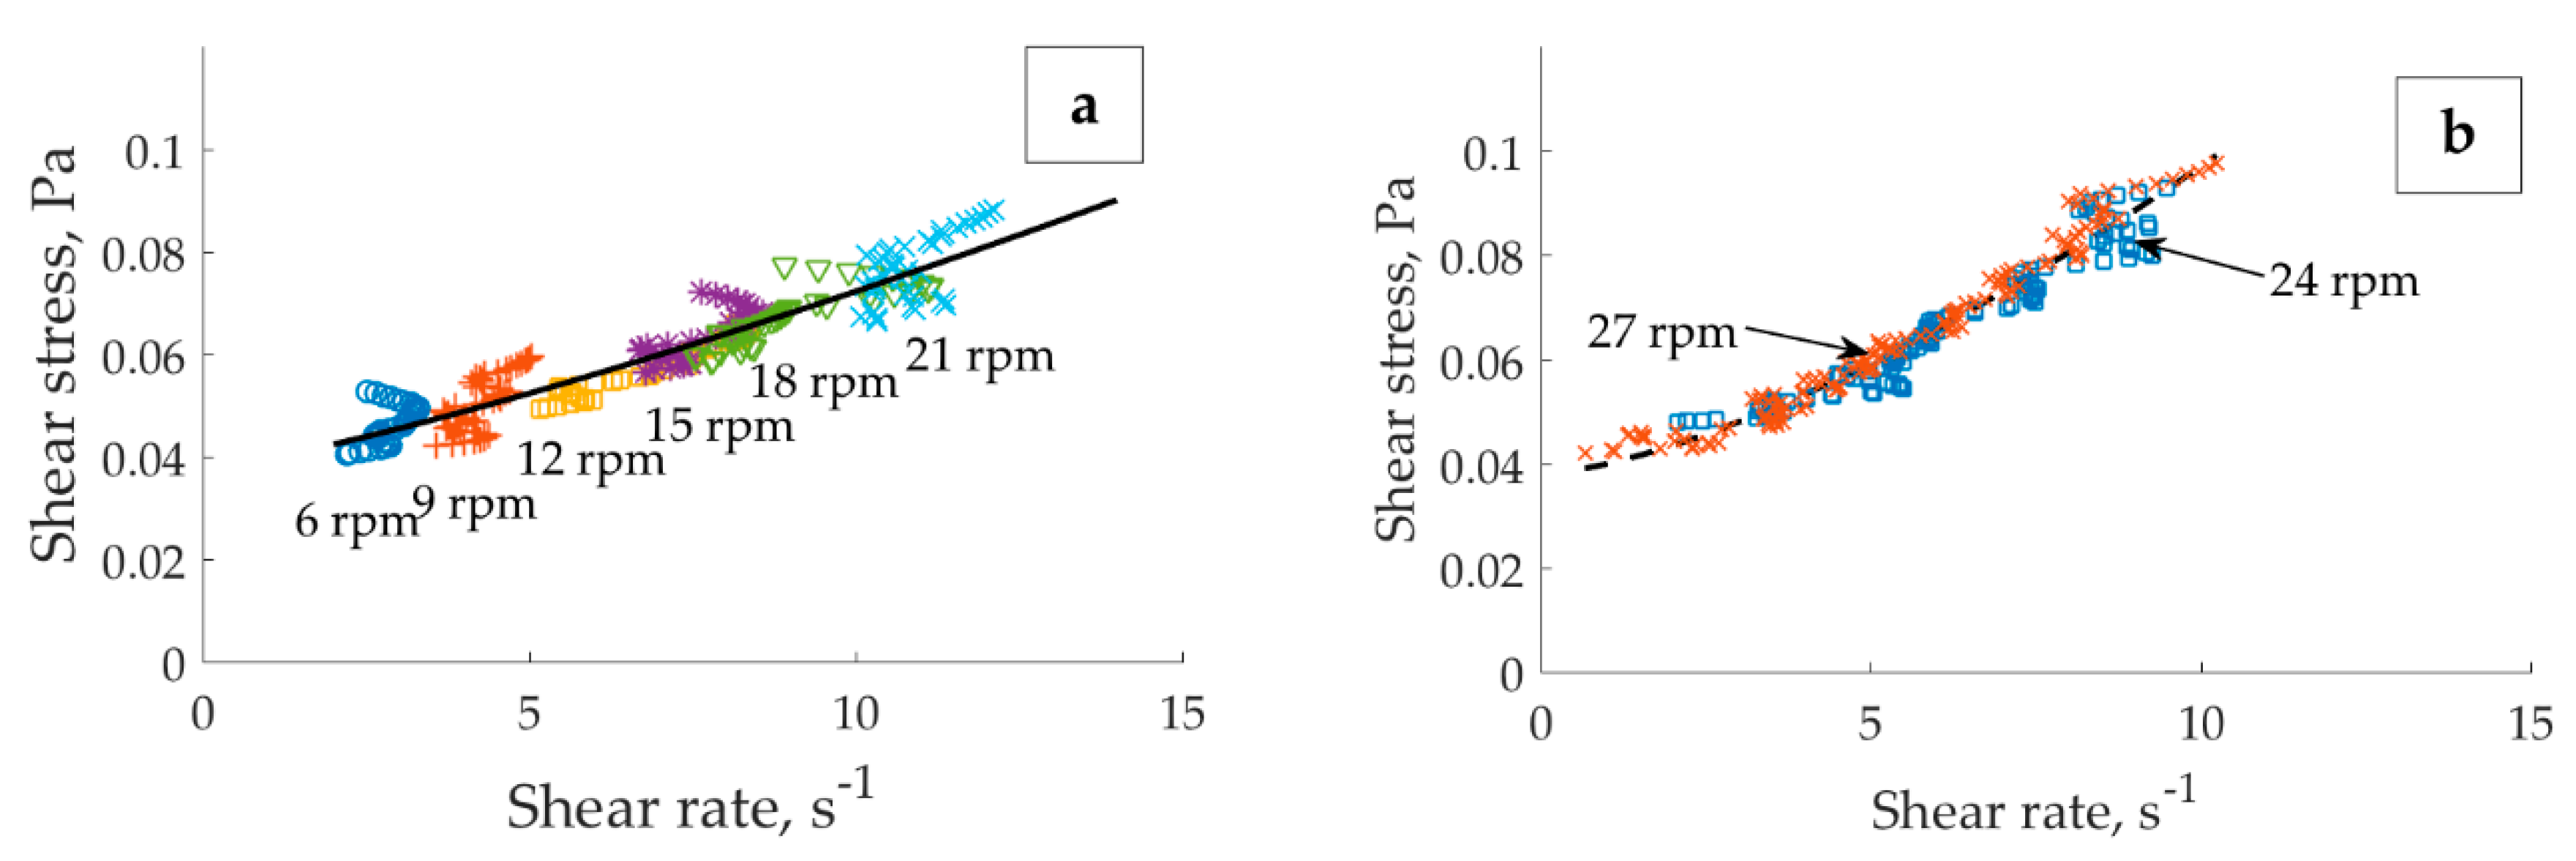
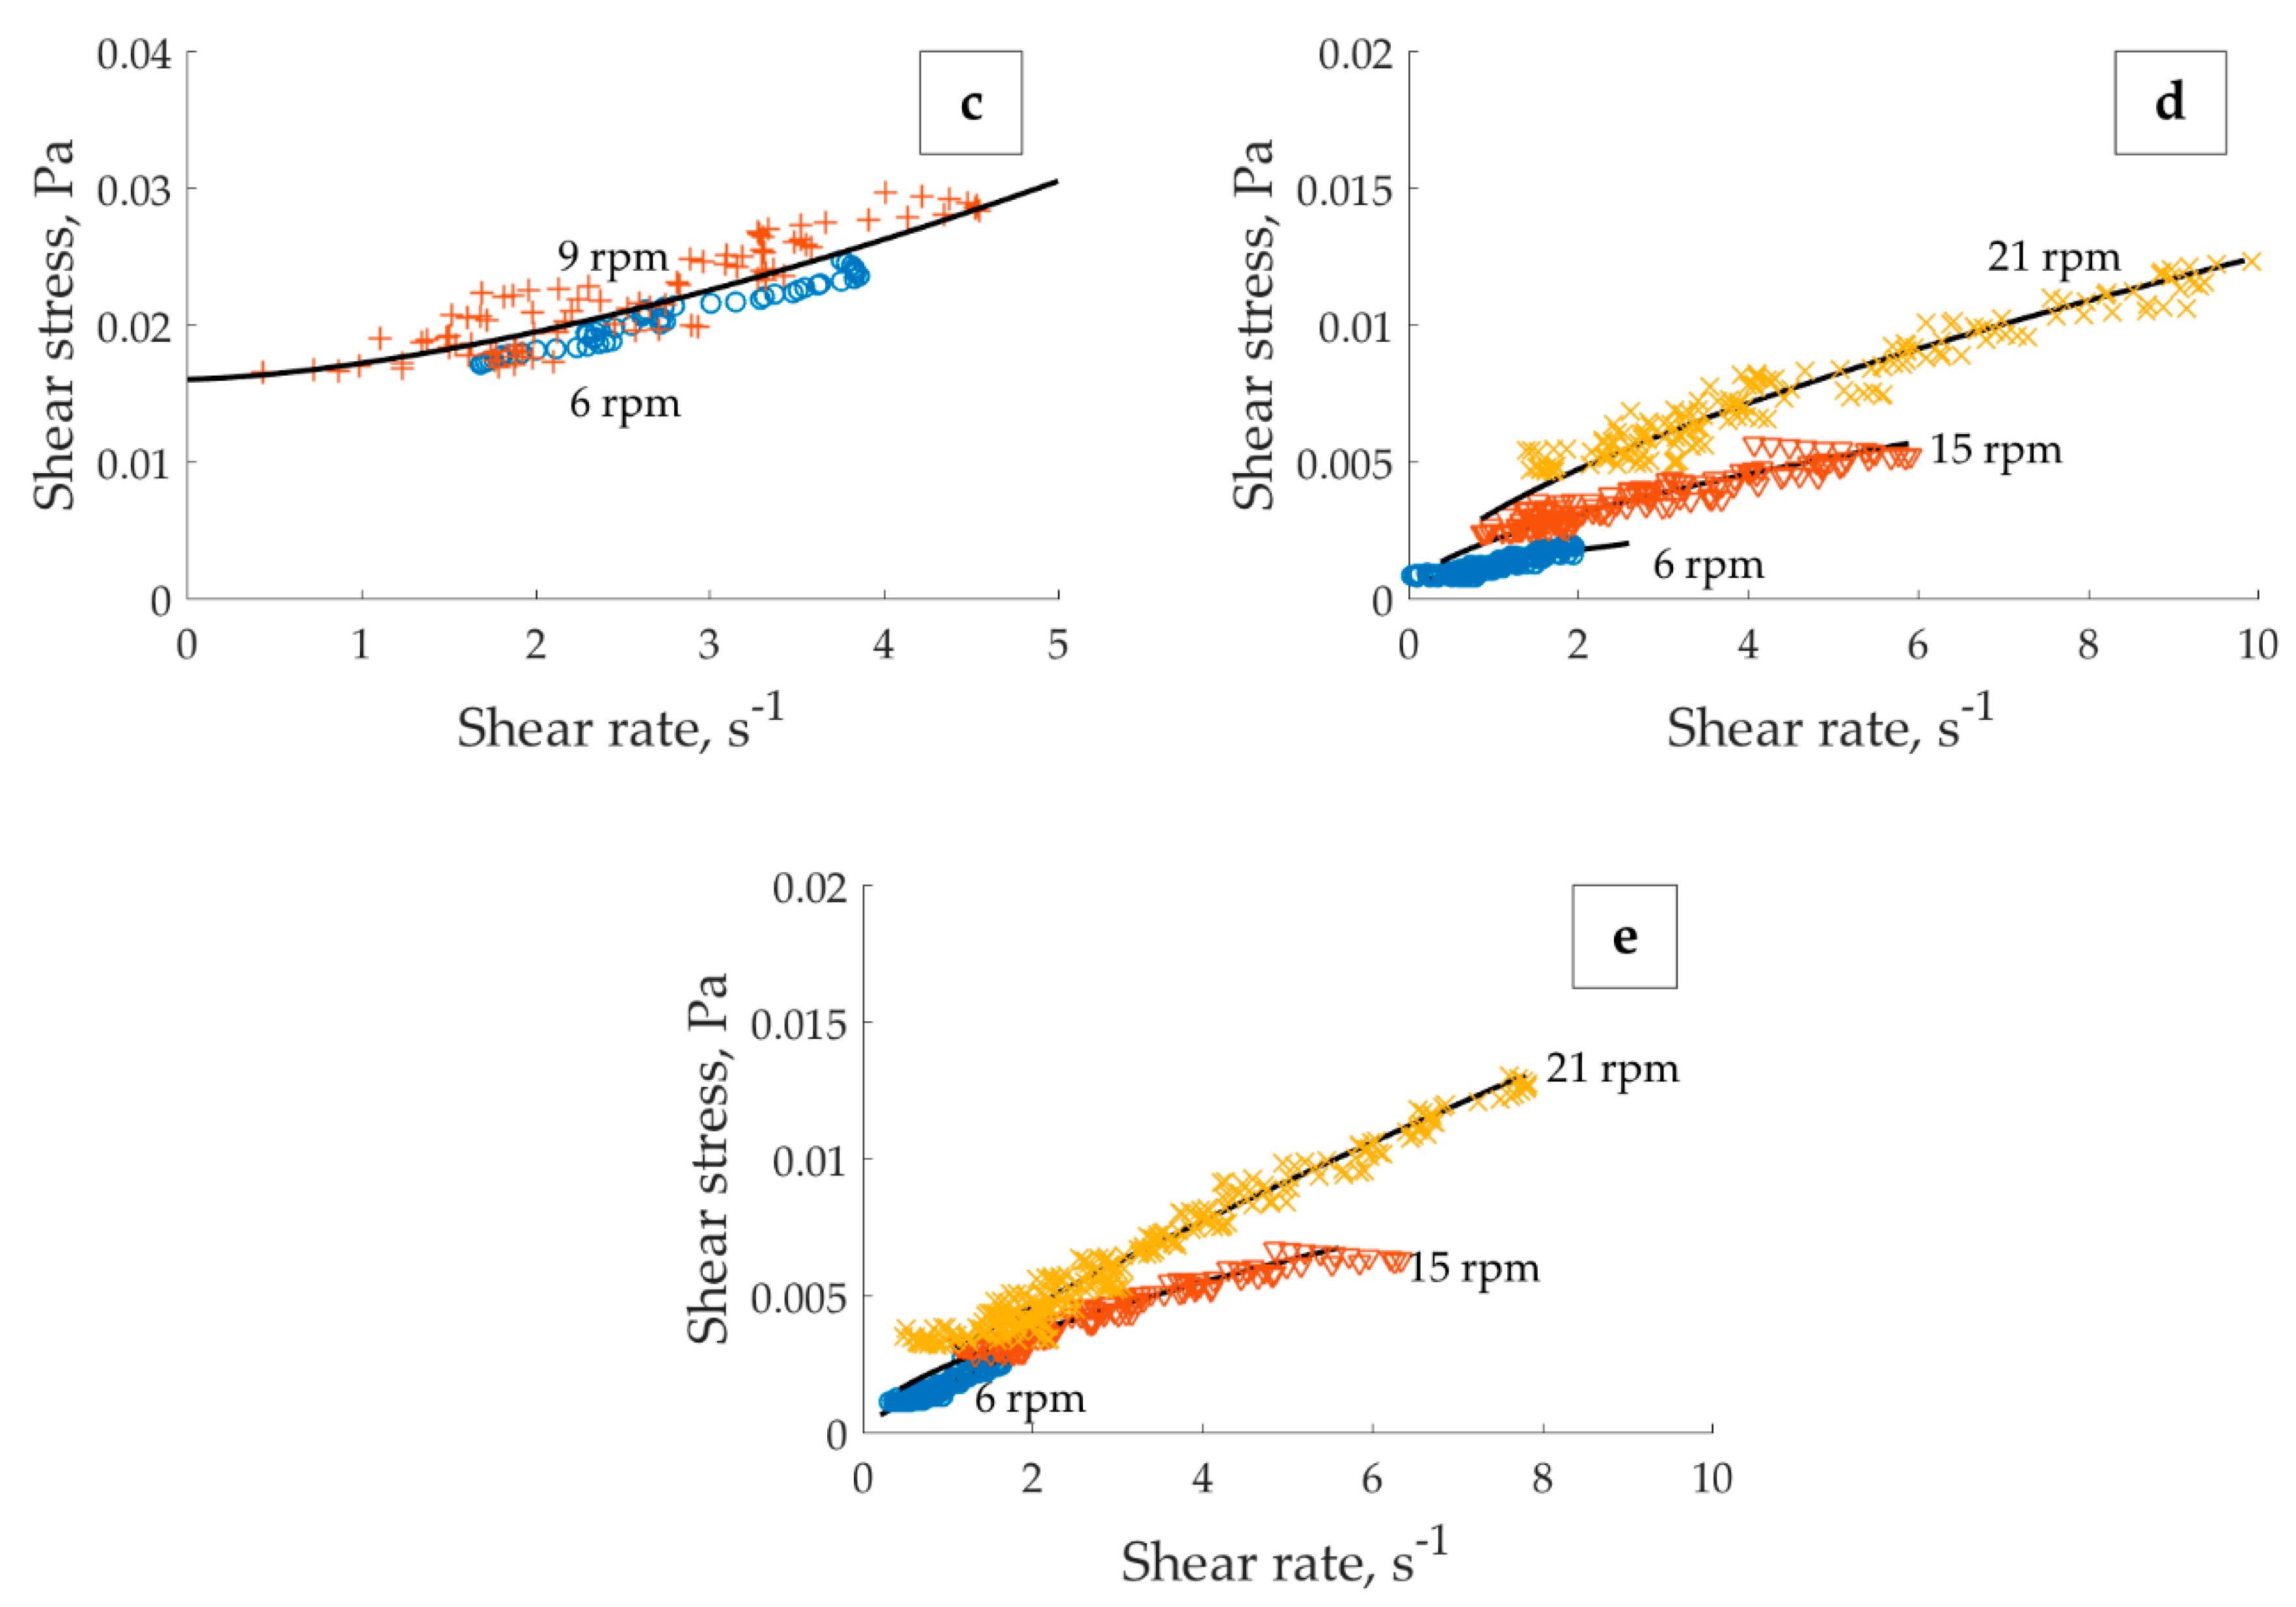
Local rheology obtained using MRI velocimetry is shown in
Figure 11. For the sequence of velocity measurements resulting in overlapping shear rates it is normal to have a dispersion of associated local stress values. This happens due to the difference of the initial state of the matter at the beginning of each measurement.
For the pH 4 in 1 × 10
−2 M KNO
3 suspension two major trends were observed. They are depicted in
Figure 11a (all curves result from the banded profiles) and
Figure 11b (both curves result from the localized profiles). The yield stress corresponding to the KNO
3-based suspension (0.038 Pa,
Figure 11a) was twice that of NaCl-based suspension (0.016 Pa,
Figure 11 c). For suspensions at pH 8 (
Figure 11d) and 10 (
Figure 11e) in 1 × 10
−2 M KNO
3, the low shear rate viscosities acquired using MRI velocimetry are about the viscosity of water, which causes respective torques to approach the lowest limit of the rheometer. This fact complicates the proper evaluation of the yield stress which seems to be very small, or, even inexistent for these suspensions, explaining the absence of yield stress related phenomena. The apparent stratification of the curves at different applied velocities in
Figure 11d,e is, thus, assigned to the measurement-related uncertainty.
4. Discussion
The difference between the suspensions with different pH observed in
Figure 4 can be explained by the formation of a three-dimensional particle network in the acidic environment. At pH 4 (
Figure 4a) the faces and edges of the particles possess opposite surface charge which allows the formation of a continuous E-F network in the suspension. Once the applied load exceeds the yield stress of this fragile network, it breaks, and the particles follow the flow direction assigned by the movement of the internal cylinder. The structure collapses abruptly so that the shear rate cannot advance accordingly, and the suspension exhibits banding. Coexistence of solid and liquid phases in more concentrated (around 3–5 vol.% solid, i.e., 30–50 times higher concentration than the one investigated in this study) bentonite suspensions was previously reported by [
41,
43]. Those studies were conducted on the suspensions made with tap or distillate water at, presumably, natural pH (no value reported) which is usually slightly basic for bentonite suspensions. In these conditions, the particles mutually repel, and the formation of a three-dimensional network is hindered. Coussot et al. [
41] related the thickness of solid region to the degree of jamming. In their system with repulsive electrostatic interactions, jamming may also explain simultaneous occurrence of flowing and static regions in their suspensions.
Figure 4b features the velocity profile in the suspension where bentonite particle edges are close to their IEP. In this case, absolute value of potential energy of interaction of E-F type is less (meaning, the attraction is reduced) compared to that at pH 4; interaction between the edges, on contrary, is enhanced [
18]. At pH 8, for both association types (E-F and E-E), the potential barrier that must be exceeded for dispersion of the aggregated particles is small compared to that at pH 4. Decrease in the attractive E-F interaction between the particles with increasing pH yields an easy-flowing system without any obvious localized discontinuities in the gap.
Figure 4c demonstrates the velocity profile of bentonite suspension at pH 10. In this environment, all particle sites carry negative charge and, thus, mutually repel. Therefore, the suspension at pH 10 flows easily, giving a response close to one of Newtonian fluid. Above mentioned electrostatic interactions between the bentonite particles suggest that in dilute aqueous bentonite suspensions coexistence of static and flowing zones of material is related to the formation of a continuous three-dimensional network.
In acidic bentonite suspensions under the load, there is a constant confrontation between the building and breaking of the three-dimensional particle network. It is expected that as soon as the load is removed or decreased significantly, the restructuring of the network in the lowest shear zone will commence and continue progressing as far as possible with respect to the local shear rate in the gap.
Figure 6 demonstrates the recovery of the three-dimensional particle network under the mild load (6 rpm). Intensive recovery took place in first four hours after the velocity decrease from 27 rpm while after 12 h the shear banding was recovered. Mismatch in banding points found from network recovery tests (
Figure 6) and shearing the original suspension (
Figure 5a) could be explained by favored due to previous shear-induced particle alignment recovery mechanism. Alternatively, the application of shear rate from zero velocity to 6 rpm (e.g.,
Figure 5a) provides impulsive cracking that possesses a semi-steady nature, and at higher timescales the banding point eventually converges to that found at 12 h (
Figure 6).
From the results presented on
Figure 7, it is clear that the local rheology of acidic bentonite suspensions is affected by the type of monovalent electrolyte available in the solution. There are several ways in which the chosen salt can influence the mechanical strength of the particle network. First, the size of an elementary unit of the network (meaning, the bentonite particle) is known to depend on the degree of swelling. Having K
+ instead of Na
+ in aqueous bentonite suspensions was found to limit the particle swelling [
11,
20]. In other words, the size of the network elementary unit is a function of the type of cation introduced with the salt. Secondly, the strength of the interaction between those elementary units can be influenced through the EDL formed around the particles by changing the type and concentration of salt introduced in the suspension. Niriella and Carnahan [
46] measured the zeta potential (electric potential at the shear plane of EDL) of bentonite particles in various electrolyte solutions. For 1 × 10
−2 M electrolyte concentration, zeta potential of −22 mV in NaCl against −15.6 mV in KCl was reported at pH 4 and 200 mg/L of solid. It was suggested that due to less cation hydration, EDL formed with K
+ is thinner than the one formed with Na
+, with higher portion of ions representing the Stern layer [
47,
48]. Bentonite lamellae are composed of the SiO
2-Al
2O
3-SiO
2 sheets; the chemistry of these oxides and the character of their interaction with the salt define the properties of the bentonite particles’ EDL. Therefore, we shall look at the chemistries and surface properties of silica (SiO
2) and alumina (Al
2O
3). Some studies indicated the preferential adsorption of K
+ ion (over Na
+) onto the silanol groups, relating it to the bare ion size, and suggested that the cation adsorbability is not influenced by the ionic hydrated radius [
49]. It was reported earlier [
50] that the decay of electrostatic repulsion between two silica surfaces is more pronounced in the solution of KCl than in that of NaCl. Thus, considering the same distance between the surfaces, the van der Waals attraction is more influential in KCl solution. The effect of anion identity (e.g., Cl
− or NO
3−) on surface charge density and surface potential of silica was proven to be insignificant in the range of pH values above pH 3 [
51]. Measurements performed on alpha-alumina showed no significant difference in the adsorption tendencies, behavior in EDL, and thus, no significant change in zeta potentials for Cl
− and NO
3− anions [
52,
53]. The influence of type of cation on electrochemical properties of alpha-alumina was found to be negligible at moderate (1 × 10
−2 mol/L) electrolyte concentration and was only manifested at a high (1 mol/L) electrolyte concentration, with the preferential binding of Na
+ over K
+ [
53]. From the above points, one may conclude that the difference in the EDL of bentonite particles in different salt solutions is largely dictated by the type of cation and its interaction with the SiO
2 layers of bentonite particles. The anion identity in this case is expected to have from no to minor effect on the electrochemical properties of the bentonite particles. In summary, the above-described phenomena are responsible for the difference in the particle network formed in presence of K
+ and Na
+, and its mechanical resistance against loading. Some recent advances in the customization of non-Newtonian fluids also suggest manipulation of the salt type and concentration as a mean of control of viscoelastic properties of polyelectrolyte solutions [
54].
SEM images presented in
Figure 8a,b suggest that the size of the aggregates depends on the type of the salt used. The aggregates found in the suspension prepared with 1 × 10
−2 M NaCl (
Figure 8b) were larger and thicker than those found in the suspension prepared with 1 × 10
−2 M KNO
3 (
Figure 8a). Larger aggregates can explain why the network does not collapse abruptly (shear banding) that happened to the suspension prepared in 1 × 10
−2 KNO
3 at pH 4; but it rather flows in a continuous manner (shear localization). Long chains of aggregates found at pH 8 (around IEP of bentonite edges) in 1 × 10
−2 KNO
3 bentonite suspension (
Figure 8c) are attributed to the decrease in the electrostatic repulsion between bentonite particle edges and, thus, increased weak E-E attraction due to the van der Waals force. This attraction, however, is not significantly influential to lead shear banding or localization (
Figure 5b).
From the global rheological curves presented on
Figure 9, it is clear that pH 4 suspensions in different salt solutions do not flow in the same manner. Significant effect of K
+ ion on the rheological properties of sodium montmorillonite was previously reported [
55]. Suspensions at pH 10 and pH 8 (both in 1 × 10
−2 M KNO
3) flow in very similar manner. This happens due to repulsive interactions between the particles at pH 10 and weak particle interaction of at pH 8; both cases result in easy-flowing system. It is important to state that the result is valid for dilute suspensions in this study.
Shear rate is related to the velocity gradient in the gap of the rheometer. An equation used by the rheometer software for the shear rate calculation, Equation (4), contains coefficient () that ignores the stagnant regions in the cell. In contrast, the MRI velocimetry allows to identify the critical radius, observe the velocity distribution, detect slipping and quantify its degree. Identifying the border between “solid” and “liquid” region is crucial for correct estimation of shear rate in a suspension characterized with banding or localization. This explains the underestimation of the shear rate by means of conventional rheometry.
Despite the slipping, two methods used to recover the local rheology of pH 4 suspensions agreed in the overlapping range of shear rates (
Figure 10 and
Figure 11a–c). The yield stress difference between the KNO
3-based suspension (
Figure 11a) and NaCl-based suspension (
Figure 11c) is assigned to the influence of the type of monovalent electrolyte on the strength of the three-dimensional particle network formed at pH 4. Suspensions not possessing a continuous three-dimensional E-F network (
Figure 11d,e) behaved in a manner similar to one another, each overlapping with or being very close to the global curve (obtained via conventional rheometry). Despite the absence of a continuous E-F three-dimensional particle network in the suspensions with solely repulsive interactions (e.g., pH 10 in 1 × 10
−2 M KNO
3), the (reversible) particle reorganization still can occur under the shear. Specifically, the particles can align with the flow under the load, resulting in rearrangement, which is not necessary charge-favorable. When the load is removed, particles must reorganize again, to increase the distance between similarly charged sites.
The existence of a master curve for the suspensions in this study depends on the chemistry of the suspending media. For pH 8 and 10 in 1 × 10
−2 M KNO
3, the establishment of a master curve is possible due to the simplicity of the global rheological curve and its good agreement with local rheology (within the range of shear rates acquired via MRI velocimetry). Narrow range of data acquired for pH 4 in 1 × 10
−2 M NaCl sample (
Figure 11c) did not allow us to confidently conclude the existence of a master curve—further research is required. Nevertheless, it is worth mentioning that all the steady state local rheological curves obtained for this suspension collapse on the curve depicted in
Figure 11c. For the pH 4 in 1 × 10
−2 M KNO
3, the establishment of a master curve suitable for whole shear rate range at any scale and flow history with a single set of parameters does not seem to be possible (
Figure 11a,b). Similar conclusion was drawn by [
32] when comparing local and global behavior of concentrated emulsions. The behavior of the acidic suspensions in the flowing zone can be described by a simple power-law model (e.g., Herschel–Bulkley). It was also the case for more concentrated suspensions with non-interfered chemistry [
41,
43]. Nevertheless, the velocity profile for a given applied load is a function of suspension’s history of shear and time of rest (as agreed with the previous report by [
43]). As an evidence of true thixotropy, the existence of several different structure-dependent states for a single value of the shear rate was demonstrated. Each of these states is characterized by its own local curve that reflects the degree of system’s destruction. That leads to complexity of relevant description of suspension’s flow behavior via a single simple model with just one set of parameters.
Some of the observations made in the present work agree with those conducted on the aqueous suspensions of laponite, such as occurrence of banding [
45] and localization [
56], or the shear rate-shear stress plateau found in the global flow curve, in the shear rate range corresponding to banding [
45].

 ,
, 


